Exploring and Assessing Intercultural Competence - Center for ...
Exploring and Assessing Intercultural Competence - Center for ...
Exploring and Assessing Intercultural Competence - Center for ...

You also want an ePaper? Increase the reach of your titles
YUMPU automatically turns print PDFs into web optimized ePapers that Google loves.
<strong>Exploring</strong> <strong>and</strong> <strong>Assessing</strong> <strong>Intercultural</strong> <strong>Competence</strong><br />
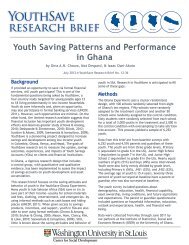
Table 1: Reliability Analysis (Beginning of Service)<br />
<strong>Intercultural</strong> Competency Components (ICC)<br />
Knowledge<br />
Cronbach Alpha<br />
% Component<br />
Variance Explained<br />
Component 1 0.899 68.21<br />
Component 2 0.862 64.81<br />
Attitude 0.984 88.30<br />
Skills 0.966 87.59<br />
Awareness 0.988 68.53<br />
<strong>Intercultural</strong> Competency (ICC) 0.824 69.53<br />
Source: Alumni Survey 2006<br />
Table 2: Reliability Analysis (End of Service)<br />
<strong>Intercultural</strong> Competency Dimensions (ICC)<br />
Knowledge<br />
Cronbach Alpha<br />
% Component<br />
Variance Explained<br />
Component 1 0.870 61.89<br />
Component 2 0.800 53.69<br />
Attitude 0.960 72.90<br />
Skills 0.944 72.85<br />
Awareness 0.968 71.57<br />
<strong>Intercultural</strong> Competency (ICC) 0.892 85.53<br />
Source: Alumni Survey 2006<br />
For Tables 3 to 6, Principal Component Analysis with varimax rotation method was used to<br />
obtain factor loadings. These tables provide factor loadings (at beginning <strong>and</strong> end of service) <strong>for</strong><br />
each item of the four components of the ICC construct. For the first component “knowledge,”<br />
principal component analysis suggested two underlying factors. Consequently, the items were<br />
then collapsed into two clusters according to factor loadings. In each of the remaining three<br />
components (“attitude,” “skills,” <strong>and</strong> “awareness”), however, most items loaded onto a single<br />
factor. In a few cases, where it was found that items loaded onto two factors at the same time,<br />
these items were excluded. Their exclusion led to single component loadings <strong>and</strong> showed an<br />
improvement in the explained variance. Tables 1 <strong>and</strong> 2 also show the percentage of variance<br />
explained by each.<br />
It is important to note that all factor loadings in Table 3 were 0.6 or above, indicating strong<br />
associations with the underlying construct. With very acceptable Cronbach Alpha scores of 0.7 or<br />
above, the item scores <strong>for</strong> each ICC component were then added together to compute the needed<br />
index. For “knowledge,” a mean score of the two clusters cited was used to compute the index.<br />
<strong>Center</strong> <strong>for</strong> Social Development<br />
Washington University in St. Louis<br />
19