journal of forest science
journal of forest science
journal of forest science

Create successful ePaper yourself
Turn your PDF publications into a flip-book with our unique Google optimized e-Paper software.
3,0 .<br />
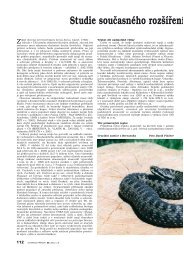
Fig. 1. Development <strong>of</strong> the indexes <strong>of</strong> timber prices for the years<br />
1988–1997 for spruce <strong>of</strong> quality class I <strong>of</strong> logs (I i = c i /c 1988 )<br />
highest variation coefficients were reached in 1994, when<br />
they ranged from 8 to 11%. This difference is obviously<br />
related with a strong wind calamity resulting in a great<br />
volume <strong>of</strong> salvage felling, and consequently, a large volume<br />
<strong>of</strong> timber on the market. It meant for the <strong>forest</strong> enterprises<br />
affected by this calamity that they received<br />
lower prices and higher variability <strong>of</strong> timber prices. With<br />
normal distribution <strong>of</strong> unit prices <strong>of</strong> timber close to arith-<br />
.<br />
Index<br />
3,5<br />
.<br />
3,0<br />
.<br />
2,5<br />
.<br />
2,0<br />
.<br />
1,5<br />
.<br />
.<br />
2,5<br />
.<br />
2,0<br />
.<br />
1,5<br />
.<br />
Index<br />
diameter class 3 diameter class 4<br />
diameter class 5 diameter class 6<br />
1,0<br />
1988 1991 1992 1993 1994 1995 1996 1997<br />
Years<br />
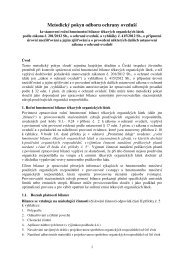
diameter class 2 diameter class 3<br />
diameter class 4 diameter class 5<br />
diameter class 6<br />
1,0<br />
1988 1991 1992 1993 1994 1995 1996 1997<br />
Years<br />
Fig. 2. Development <strong>of</strong> the indexes <strong>of</strong> timber prices for the years<br />
1988–1997 for spruce <strong>of</strong> quality class II <strong>of</strong> logs (I i = c i /c 1988 )<br />
1,0<br />
1988 1991 1992 1993 1994 1995 1996 1997<br />
Years<br />
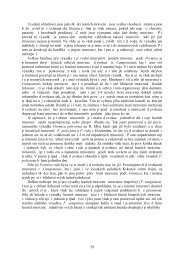
Fig. 3. Development <strong>of</strong> the indexes <strong>of</strong> timber prices for the years<br />
1988–1997 for spruce <strong>of</strong> quality class IIIA <strong>of</strong> logs (I i = c i /c 1988 )<br />
metical mean we can state that 68% <strong>of</strong> enterprises had<br />
average timber prices with the range ± 1 multiple and<br />
95% <strong>of</strong> enterprises with the range ± 2 multiple <strong>of</strong> variation<br />
coefficient. This range <strong>of</strong> unit prices <strong>of</strong> timber could<br />
provide sufficient space for its full realization on the<br />
market.<br />
or better comparison and generalization <strong>of</strong> the trends<br />
<strong>of</strong> spruce timber prices price indexes were calculated<br />
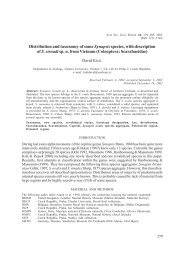
Fig. 4. Development <strong>of</strong> the indexes <strong>of</strong> timber prices for the years<br />
1988–1997 for spruce <strong>of</strong> quality class IIIB <strong>of</strong> logs (I i = c i /c 1988 )<br />
330 J. FOR. SCI., 47, 2001 (7): 322–330<br />
.<br />
Index<br />
4,0<br />
.<br />
3,5<br />
.<br />
3,0<br />
.<br />
2,5<br />
.<br />
2,0<br />
.<br />
1,5<br />
.<br />
.<br />
4,0<br />
.<br />
3,5<br />
.<br />
3,0<br />
.<br />
2,5<br />
.<br />
2,0<br />
.<br />
1,5<br />
.<br />
Index<br />
diameter class 1 diameter class 2<br />
diameter class 3 diameter class 4<br />
diameter class 5 diameter class 6<br />
diameter class 1 diameter class 2<br />
diameter class 3 diameter class 4<br />
diameter class 5 diameter class 6<br />
1,0<br />
1988 1991 1992 1993 1994 1995 1996 1997<br />
Years