A Guide to Understanding Color Communication - X-Rite
A Guide to Understanding Color Communication - X-Rite
A Guide to Understanding Color Communication - X-Rite

You also want an ePaper? Increase the reach of your titles
YUMPU automatically turns print PDFs into web optimized ePapers that Google loves.
A <strong>Guide</strong> <strong>to</strong> <strong>Understanding</strong><br />
<strong>Color</strong> <strong>Communication</strong>
Table of<br />
Contents<br />
Communicating <strong>Color</strong> . . . . . . . . . . . . . . . . . . . . . . . . . . . . . . . . . . . 2<br />
Ways <strong>to</strong> Measure <strong>Color</strong> . . . . . . . . . . . . . . . . . . . . . . . . . . . . . . . . . . 3<br />
Integrated <strong>Color</strong> – Throughout the Supply Chain . . . . . . . . . . . 4-5<br />
Applications . . . . . . . . . . . . . . . . . . . . . . . . . . . . . . . . . . . . . . . . . . . 6<br />
Attributes of <strong>Color</strong><br />
Hue . . . . . . . . . . . . . . . . . . . . . . . . . . . . . . . . . . . . . . . . . . . . . . . . 7<br />
Chroma . . . . . . . . . . . . . . . . . . . . . . . . . . . . . . . . . . . . . . . . . . . . . 7<br />
Lightness. . . . . . . . . . . . . . . . . . . . . . . . . . . . . . . . . . . . . . . . . . . . 8<br />
Scales for Measuring <strong>Color</strong><br />
The Munsell Scale . . . . . . . . . . . . . . . . . . . . . . . . . . . . . . . . . . . . 9<br />
CIE <strong>Color</strong> Systems. . . . . . . . . . . . . . . . . . . . . . . . . . . . . . . . . . 9-10<br />
Chromaticity Values. . . . . . . . . . . . . . . . . . . . . . . . . . . . . . . . . . . 11<br />
Expressing <strong>Color</strong>s Numerically<br />
CIELAB (L*a*b*) . . . . . . . . . . . . . . . . . . . . . . . . . . . . . . . . . . . . . 12<br />
CIELCH (L*C*h°) . . . . . . . . . . . . . . . . . . . . . . . . . . . . . . . . . . 12-13<br />
<strong>Color</strong> Differences, Notation and Tolerancing<br />
Delta CIELAB and CIELCH. . . . . . . . . . . . . . . . . . . . . . . . . . . . . 14<br />
CIE <strong>Color</strong> Space Notation. . . . . . . . . . . . . . . . . . . . . . . . . . . . . . 15<br />
Visual <strong>Color</strong> and Tolerancing . . . . . . . . . . . . . . . . . . . . . . . . . . . 15<br />
CIELAB Tolerancing . . . . . . . . . . . . . . . . . . . . . . . . . . . . . . . . . . 15<br />
CIELCH Tolerancing . . . . . . . . . . . . . . . . . . . . . . . . . . . . . . . . . . 16<br />
CMC Tolerancing . . . . . . . . . . . . . . . . . . . . . . . . . . . . . . . . . . 16-17<br />
CIE94 Tolerancing . . . . . . . . . . . . . . . . . . . . . . . . . . . . . . . . . . . . 18<br />
Visual Assessment vs. Instrumental . . . . . . . . . . . . . . . . . . . . . . 18<br />
Choosing the Right Tolerance . . . . . . . . . . . . . . . . . . . . . . . . . . . 18<br />
Other <strong>Color</strong> Expressions<br />
White and Yellow Indices. . . . . . . . . . . . . . . . . . . . . . . . . . . . . . . 19<br />
Glossary . . . . . . . . . . . . . . . . . . . . . . . . . . . . . . . . . . . . . . . . . . . 20-24<br />
© X-<strong>Rite</strong>, Incorporated 2007<br />
1
2<br />
Communicating<br />
<strong>Color</strong><br />
How would you describe the color<br />
of this rose? Would you say it’s<br />
yellow, sort of lemon yellow or<br />
maybe a bright canary yellow?<br />
Your perception and interpretation<br />
of color are highly subjective. Eye<br />
fatigue, age and other physiological<br />
fac<strong>to</strong>rs can influence your<br />
color perception.<br />
But even without such physical<br />
considerations, each observer<br />
interprets color based on personal<br />
references. Each person also<br />
verbally defines an object’s color<br />
differently.<br />
As a result, objectively communicating<br />
a particular color <strong>to</strong><br />
someone without some type of<br />
standard is difficult. There also<br />
must be a way <strong>to</strong> compare one<br />
color <strong>to</strong> the next with accuracy.<br />
The solution is a measuring instrument<br />
that explicitly identifies a<br />
color. That is, an instrument that<br />
differentiates a color from all<br />
others and assigns it a numeric<br />
value.
Ways <strong>to</strong><br />
Measure <strong>Color</strong><br />
Reference<br />
Beam<br />
Port<br />
Receiver<br />
Specular<br />
15˚<br />
Sample<br />
Viewing<br />
Port<br />
Sample Being Measured<br />
45˚<br />
25˚<br />
8˚ 8˚<br />
Sample Being Measured<br />
Spherical<br />
Light Source<br />
0/45<br />
45˚<br />
Specular<br />
Port<br />
Sample Being Measured<br />
Multi-angle<br />
Sphere<br />
45˚<br />
75˚<br />
Receiver<br />
Light<br />
Source<br />
110˚<br />
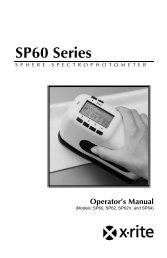
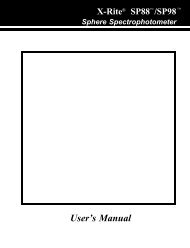
Today, the most commonly used<br />
instruments for measuring color<br />
are spectropho<strong>to</strong>meters.<br />
Spectro technology measures<br />
reflected or transmitted light at<br />
many points on the visual spectrum,<br />
which results in a curve.<br />
Since the curve of each color is as<br />
unique as a signature or fingerprint,<br />
the curve is an excellent <strong>to</strong>ol<br />
for identifying, specifying and<br />
matching color.<br />
The following information can help<br />
you <strong>to</strong> understand which type of<br />
instrument is the best choice for<br />
specific applications.<br />
Spherical<br />
Spherically based instruments<br />
have played a major roll in formulation<br />
systems for nearly 50 years.<br />
Most are capable of including the<br />
“specular component” (gloss) while<br />
measuring. By opening a small<br />
trap door in the sphere, the “specular<br />
component” is excluded from<br />
the measurement. In most cases,<br />
databases for color formulation are<br />
more accurate when this component<br />
is a part of the measurement.<br />
Spheres are also the instrument of<br />
choice when the sample is<br />
textured, rough, or irregular or<br />
approaches the brilliance of a firstsurface<br />
mirror. Textile manufacturers,<br />
makers of roofing tiles or<br />
acoustic ceiling materials would all<br />
likely select spheres as the right<br />
<strong>to</strong>ol for the job.<br />
0/45 (or 45/0)<br />
No instrument “sees” color more<br />
like the human eye than the 0/45.<br />
This simply is because a viewer<br />
does everything in his or her power<br />
<strong>to</strong> exclude the “specular component”<br />
(gloss) when judging color.<br />
When we look at pictures in a<br />
glossy magazine, we arrange<br />
ourselves so that the gloss does<br />
not reflect back <strong>to</strong> the eye. A 0/45<br />
instrument, more effectively than<br />
any other, will remove gloss from<br />
the measurement and measure the<br />
appearance of the sample exactly<br />
as the human eye would see it.<br />
Multi-Angle<br />
In the past 10 or so years, car<br />
makers have experimented with<br />
special effect colors. They use<br />
special additives such as mica,<br />
pearlescent materials, ground up<br />
seashells, microscopically coated<br />
colored pigments and interference<br />
pigments <strong>to</strong> produce different<br />
colors at different angles of view.<br />
Large and expensive goniometers<br />
were traditionally used <strong>to</strong> measure<br />
these colors until X-<strong>Rite</strong> introduced<br />
a battery-powered, hand-held,<br />
multi-angle instrument. X-<strong>Rite</strong><br />
portable multi-angle instruments<br />
are used by most au<strong>to</strong> makers and<br />
their colorant supply chain, worldwide.<br />
<strong>Color</strong>imeter<br />
<strong>Color</strong>imeters are not spectropho<strong>to</strong>meters.<br />
<strong>Color</strong>imeters are tristimulus<br />
(three-filtered) devices that<br />
make use of red, green, and blue<br />
filters that emulate the response of<br />
the human eye <strong>to</strong> light and color. In<br />
some quality control applications,<br />
these <strong>to</strong>ols represent the lowest<br />
cost answer. <strong>Color</strong>imeters cannot<br />
compensate for metamerism (a<br />
shift in the appearance of a<br />
sample due <strong>to</strong> the light used <strong>to</strong> illuminate<br />
the surface). As colorimeters<br />
use a single type of light (such<br />
as incandescent or pulsed xenon)<br />
and because they do not record<br />
the spectral reflectance of the<br />
media, they cannot predict this<br />
shift. Spectropho<strong>to</strong>meters can<br />
compensate for this shift, making<br />
spectropho<strong>to</strong>meters a superior<br />
choice for accurate, repeatable<br />
color measurement.<br />
3
4<br />
Integrated<br />
<strong>Color</strong> –<br />
Throughout the<br />
Supply Chain<br />
Since color is a key element of a<br />
consumer's buying decisions, how<br />
do you handle color consistency<br />
and quality in a global environment?<br />
How do you keep in step with<br />
consumer color preferences while<br />
ensuring color options are available<br />
and easy <strong>to</strong> reproduce? The solution:<br />
X-<strong>Rite</strong> color measurement<br />
technology.<br />
Accurate <strong>Color</strong>.<br />
On Time. Every Time.<br />
Whether you're working with<br />
coatings, plastics or textiles,<br />
X-<strong>Rite</strong> understands the challenges<br />
unique <strong>to</strong> your business. Because<br />
cus<strong>to</strong>mer needs—not off-the-shelf<br />
products—drive the solutions we<br />
bring, our industry experts take the<br />
time <strong>to</strong> understand your business.<br />
The unique combination of X-<strong>Rite</strong>'s<br />
technology, our vertically integrated<br />
manufacturing capabilities and the<br />
industry's largest global presence<br />
allows us <strong>to</strong> invent and adapt specific<br />
solutions for you, wherever you are.<br />
When you streamline your workflow<br />
system, it can greatly reduce<br />
the complexity of your supply<br />
chain. With a digital supply chain<br />
solution for color control, you can<br />
shift color management responsibilities<br />
<strong>to</strong> your organization. This<br />
means you control color data workflow.<br />
The result: data flows faster,<br />
which provides the information<br />
needed <strong>to</strong> optimize choice of<br />
suppliers, and respond quickly <strong>to</strong><br />
market pressures.
Controlling <strong>Color</strong><br />
throughout the Process<br />
X-<strong>Rite</strong>'s product portfolio offers<br />
solutions which connect color<br />
accurately throughout the entire<br />
process. Our solutions save you<br />
money by reducing scrap, production<br />
downtime, off-color product<br />
shipments and rework. We simplify<br />
the process of managing color<br />
through-out your global supply<br />
chain, whether with multiple<br />
locations or at a single facility,<br />
helping you protect the quality<br />
of corporate brands.<br />
Offering a broad range of bench<strong>to</strong>p,<br />
portable or non-contact systems,<br />
X-<strong>Rite</strong> instruments can be found<br />
on the desk<strong>to</strong>p, in retail settings, in<br />
labora<strong>to</strong>ries or on production lines,<br />
all managing color reliably and<br />
accurately. Your <strong>to</strong>tal solution<br />
includes software that enhances<br />
instrument functionality by adding<br />
quality control, profiling functions,<br />
color matching, or color management<br />
packages. Complimented<br />
with our Macbeth Lighting offering<br />
and visual evaluation <strong>to</strong>ols from<br />
Munsell <strong>Color</strong>, X-<strong>Rite</strong> offers the<br />
complete portfolio for all of your<br />
color needs.<br />
X-<strong>Rite</strong> is a global leader in color<br />
measurement, management and<br />
communication solutions, and can<br />
help you get the right color, every<br />
time, from the earliest stages of<br />
production <strong>to</strong> final product shipment.<br />
Calibrated,<br />
On-Screen <strong>Color</strong><br />
X-<strong>Rite</strong> offers the only color formulation<br />
and quality assurance<br />
software <strong>to</strong> use the International<br />
<strong>Color</strong> Consortium’s (ICC) standard<br />
device profiles for on-screen color.<br />
This means that colors will be<br />
consistently displayed on different<br />
computers, so long as ICC profiles<br />
are used. Use X-<strong>Rite</strong> moni<strong>to</strong>r<br />
optimizers and au<strong>to</strong>-scan densi<strong>to</strong>meters<br />
for complete color calibration<br />
and control on computers, printers<br />
and scanners.<br />
5
6<br />
Applications<br />
Spectropho<strong>to</strong>metry’s applications<br />
are seemingly boundless. <strong>Color</strong>matching<br />
measurements are made<br />
every day by those comparing a<br />
reproduced object <strong>to</strong> a reference<br />
point. Spectropho<strong>to</strong>metry-assisted<br />
color measurement can be useful<br />
in areas such as:<br />
• Corporate logo standardization<br />
• <strong>Color</strong> testing of inks<br />
• <strong>Color</strong> control of paints<br />
• Control of printed colors on<br />
packaging material and labels<br />
• <strong>Color</strong> control of plastics and<br />
textiles throughout the<br />
development and manufacturing<br />
process<br />
• Finished products like printed<br />
cans, clothing, shoes,<br />
au<strong>to</strong>mobile components, plastic<br />
components of all types
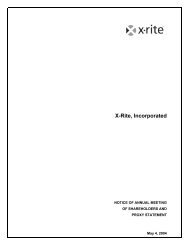
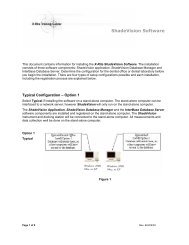
Attributes<br />
of <strong>Color</strong><br />
Figure 1: Hue<br />
Yellow<br />
Green Red<br />
Blue<br />
Each color has its own distinct<br />
appearance, based on three<br />
elements: hue, chroma and value<br />
(lightness). By describing a color<br />
using these three attributes, you<br />
can accurately identify a particular<br />
color and distinguish it from any<br />
other.<br />
Less Chroma<br />
More<br />
Figure 2: Chromaticity<br />
Chroma<br />
(Saturation)<br />
Hue<br />
When asked <strong>to</strong> identify the color of<br />
an object, you’ll most likely speak<br />
first of its hue. Quite simply, hue is<br />
how we perceive an object’s color<br />
— red, orange, green, blue, etc.<br />
The color wheel in Figure 1 shows<br />
the continuum of color from one<br />
hue <strong>to</strong> the next. As the wheel illustrates,<br />
if you were <strong>to</strong> mix blue and<br />
green paints, you would get bluegreen.<br />
Add yellow <strong>to</strong> green for<br />
yellow-green, and so on.<br />
Chroma<br />
Chroma describes the vividness or<br />
dullness of a color — in other<br />
words, how close the color is <strong>to</strong><br />
either gray or the pure hue. For<br />
example, think of the appearance of<br />
a <strong>to</strong>ma<strong>to</strong> and a radish. The red of<br />
the <strong>to</strong>ma<strong>to</strong> is vivid, while the radish<br />
appears duller.<br />
Figure 2 shows how chroma<br />
changes as we move from center <strong>to</strong><br />
the perimeter. <strong>Color</strong>s in the center<br />
are gray (dull) and become more<br />
saturated (vivid) as they move<br />
<strong>to</strong>ward the perimeter. Chroma also<br />
is known as saturation.<br />
7
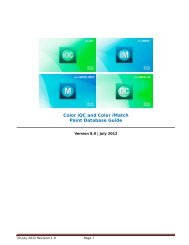
Lightness<br />
8<br />
Attributes<br />
of <strong>Color</strong><br />
continued<br />
The luminous intensity of a color — i.e., its degree of lightness — is called<br />
its value. <strong>Color</strong>s can be classified as light or dark when comparing their<br />
value.<br />
For example, when a <strong>to</strong>ma<strong>to</strong> and a radish are placed side by side, the red<br />
of the <strong>to</strong>ma<strong>to</strong> appears <strong>to</strong> be much lighter. In contrast, the radish has a<br />
darker red value. In Figure 3, the value, or lightness, characteristic is<br />
represented on the vertical axis.<br />
White<br />
Black<br />
Lightness<br />
Figure 3: Three-dimensional color system depicting lightness<br />
White<br />
Black
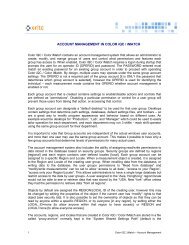
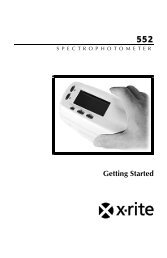
Figure 4: Munsell <strong>Color</strong> Tree<br />
Percent Reflectance<br />
120<br />
100<br />
80<br />
60<br />
40<br />
20<br />
Scales for<br />
Measuring<br />
<strong>Color</strong><br />
400 500 600 700<br />
Wavelength (nm)<br />
Figure 5: Spectral curve from a measured sample<br />
The Munsell Scale<br />
In 1905, artist Albert H. Munsell<br />
originated a color ordering system<br />
— or color scale — which is still<br />
used <strong>to</strong>day. The Munsell System of<br />
<strong>Color</strong> Notation is significant from a<br />
his<strong>to</strong>rical perspective because it’s<br />
based on human perception.<br />
Moreover, it was devised before<br />
instrumentation was available for<br />
measuring and specifying color.<br />
The Munsell System assigns<br />
numerical values <strong>to</strong> the three properties<br />
of color: hue, value and<br />
chroma. Adjacent color samples<br />
represent equal intervals of visual<br />
perception.<br />
The model in Figure 4 depicts the<br />
Munsell <strong>Color</strong> Tree, which provides<br />
physical samples for judging visual<br />
color. Today’s color systems rely on<br />
instruments that utilize mathematics<br />
<strong>to</strong> help us judge color.<br />
Three things are necessary <strong>to</strong> see<br />
color:<br />
• A light source (illuminant)<br />
• An object (sample)<br />
• An observer/processor<br />
We as humans see color because<br />
our eyes process the interaction of<br />
light hitting an object. What if we<br />
replace our eyes with an instrument<br />
—can it see and record the same<br />
Relative Spectral Power<br />
120<br />
100<br />
80<br />
60<br />
40<br />
20<br />
color differences that our eyes<br />
detect?<br />
CIE <strong>Color</strong> Systems<br />
The CIE, or Commission<br />
Internationale de l’Eclairage<br />
(translated as the International<br />
Commission on Illumination), is the<br />
body responsible for international<br />
recommendations for pho<strong>to</strong>metry<br />
and colorimetry. In 1931 the CIE<br />
standardized color order systems<br />
by specifying the light source (or<br />
illuminants), the observer and the<br />
methodology used <strong>to</strong> derive values<br />
for describing color.<br />
The CIE <strong>Color</strong> Systems utilize<br />
three coordinates <strong>to</strong> locate a color<br />
in a color space. These color<br />
spaces include:<br />
• CIE XYZ<br />
• CIE L*a*b*<br />
• CIE L*C*h°<br />
To obtain these values, we must<br />
understand how they are calculated.<br />
As stated earlier, our eyes need<br />
three things <strong>to</strong> see color: a light<br />
source, an object and an<br />
observer/processor. The same<br />
must be true for instruments <strong>to</strong> see<br />
color. <strong>Color</strong> measurement instruments<br />
receive color the same way<br />
our eyes do — by gathering and<br />
400 500 600 700<br />
Wavelength (nm)<br />
Figure 6: Daylight (Standard Illuminant D65/10˚)<br />
9
10<br />
Scales for<br />
Measuring <strong>Color</strong><br />
continued<br />
filtering the wavelengths of light reflected from an object. The instrument<br />
perceives the reflected light wavelengths as numeric values. These values<br />
are recorded as points across the visible spectrum and are called spectral<br />
data. Spectral data is represented as a spectral curve. This curve is the<br />
color’s fingerprint (Figure 5).<br />
Once we obtain a color’s reflectance curve, we can apply mathematics <strong>to</strong><br />
map the color on<strong>to</strong> a color space.<br />
To do this, we take the reflectance curve and multiply the data by a CIE<br />
standard illuminant. The illuminant is a graphical representation of the light<br />
source under which the samples are viewed. Each light source has a power<br />
distribution that affects how we see color. Examples of different illuminants<br />
are A — incandescent, D65 — daylight (Figure 6) and F2 — fluorescent.<br />
We multiply the result of this calculation by the CIE standard observer.<br />
The CIE commissioned work in 1931 and 1964 <strong>to</strong> derive the concept of a<br />
standard observer, which is based on the average human response <strong>to</strong><br />
wavelengths of light (Figure 7).<br />
In short, the standard observer represents how an average person sees<br />
color across the visible spectrum. Once these values are calculated, we<br />
convert the data in<strong>to</strong> the tristimulus values of XYZ (Figure 8). These<br />
values can now identify a color numerically.<br />
Percent Reflectance Reflectance Intensity<br />
120<br />
100<br />
80<br />
60<br />
40<br />
20<br />
Reflectance Intensity<br />
Tristimulus Values<br />
120<br />
100<br />
80<br />
60<br />
40<br />
20<br />
Reflectance Intensity<br />
120<br />
100<br />
80<br />
60<br />
40<br />
20<br />
2.0<br />
1.5<br />
1.0<br />
0.5<br />
z(λ)<br />
y(λ)<br />
2° Observer (CIE 1931)<br />
10° Observer (CIE 1964)<br />
x(λ)<br />
0.0<br />
380 430 480 530 580 630 680 730 780<br />
Wavelength (nm)<br />
Figure 7: CIE 2° and 10° Standard Observers<br />
Reflectance Intensity<br />
120<br />
100<br />
80<br />
60<br />
40<br />
20<br />
Relative Reflectance Spectral Intensity Power<br />
120<br />
100<br />
80<br />
60<br />
40<br />
20<br />
Reflectance Intensity<br />
120<br />
100<br />
80<br />
60<br />
40<br />
20<br />
300<br />
300<br />
250<br />
200<br />
150<br />
250<br />
2° Observer<br />
2° Observer (CIE 1931)<br />
2° Observer (CIE 1931) (CIE 1931)<br />
200 2.0 10° Observer<br />
10° Observer (CIE 1964)<br />
10° Observer (CIE 1964) (CIE 1964)<br />
z(λ) z(λ)<br />
z(λ)<br />
150 1.5<br />
100<br />
50<br />
100 1.0 y(λ)<br />
0.5 50<br />
y(λ)<br />
y(λ)<br />
x(λ) x(λ)<br />
x(λ)<br />
0.0<br />
0<br />
400 500 600 700<br />
400 500 600 700 0 0<br />
400 400 500 500 600 600 700 700 400 400 500 500 600 600 700 700<br />
380 430<br />
380 430 480 530 580 630 680 730 780<br />
380 480 430 530 480 580 530 630 580 680 630 730 680 780730<br />
780<br />
Wavelength Wavelength (nm) Wavelength<br />
(nm)<br />
(nm)<br />
Wavelength Wavelength (nm) Wavelength<br />
(nm)<br />
(nm)<br />
Wavelength Wavelength (nm) Wavelength<br />
(nm)<br />
(nm)<br />
Reflectance Intensity<br />
300<br />
250<br />
200<br />
150<br />
100<br />
50<br />
X X =<br />
Reflectance Intensity<br />
Reflectance Tristimulus Intensity Values<br />
A spectropho<strong>to</strong>meter measures<br />
spectral data – the amount of<br />
light energy reflected from an<br />
object at several intervals along<br />
the visible spectrum. The<br />
spectral data is shown as<br />
a spectral curve.<br />
X = 62.04<br />
Y = 69.72<br />
Z = 7.34<br />
Spectral Curve D65 Illuminant Standard Observer Tristimulus Values<br />
Figure 8: Tristimulus values
Chromaticity Values<br />
Tristimulus values, unfortunately, have limited use as color specifications<br />
because they correlate poorly with visual attributes. While Y relates <strong>to</strong><br />
value (lightness), X and Z do not correlate <strong>to</strong> hue and chroma.<br />
As a result, when the 1931 CIE standard observer was established, the<br />
commission recommended using the chromaticity coordinates xyz. These<br />
coordinates are used <strong>to</strong> form the chromaticity diagram in Figure 9. The<br />
notation Yxy specifies colors by identifying value (Y) and the color as<br />
viewed in the chromaticity diagram (x,y).<br />
As Figure 10 shows, hue is represented at all points around the perimeter<br />
of the chromaticity diagram. Chroma, or saturation, is represented by a<br />
movement from the central white (neutral) area out <strong>to</strong>ward the diagram’s<br />
perimeter, where 100% saturation equals pure hue.<br />
Figure 9: CIE 1931 (x, y)<br />
chromaticity diagram<br />
Figure 10: Chromaticity diagram<br />
y<br />
Hue<br />
Saturation<br />
x<br />
11
12<br />
Expressing<br />
<strong>Color</strong>s<br />
Numerically<br />
To overcome the limitations of<br />
chromaticity diagrams like Yxy, the<br />
CIE recommended two alternate,<br />
uniform color scales: CIE 1976<br />
(L*a*b*) or CIELAB, and CIELCH<br />
(L*C*h°).<br />
These color scales are based on<br />
the opponent-colors theory of color<br />
vision, which says that two colors<br />
cannot be both green and red at<br />
the same time, nor blue and yellow<br />
Flower A:<br />
L* = 52.99 a* = 8.82 b* = 54.53<br />
Flower B:<br />
L* = 29.00 a* = 52.48 b* = 22.23<br />
at the same time. As a result,<br />
single values can be used <strong>to</strong><br />
describe the red/green and the<br />
yellow/blue attributes.<br />
CIELAB (L*a*b*)<br />
When a color is expressed in<br />
CIELAB, L* defines lightness, a*<br />
denotes the red/green value and<br />
b* the yellow/blue value.<br />
Figures 11 and 12 (on page 13)<br />
show the color-plotting diagrams<br />
for L*a*b*. The a* axis runs from<br />
left <strong>to</strong> right. A color measurement<br />
movement in the +a direction<br />
depicts a shift <strong>to</strong>ward red. Along<br />
the b* axis, +b movement represents<br />
a shift <strong>to</strong>ward yellow. The<br />
center L* axis shows L = 0 (black<br />
or <strong>to</strong>tal absorption) at the bot<strong>to</strong>m.<br />
At the center of this plane is<br />
neutral or gray.<br />
To demonstrate how the L*a*b*<br />
values represent the specific<br />
colors of Flowers A and B, we’ve<br />
plotted their values on the CIELAB<br />
<strong>Color</strong> Chart in Figure 11.<br />
The a* and b* values for Flowers<br />
A and B intersect at color spaces<br />
identified respectively as points<br />
A and B (see Figure 11). These<br />
points specify each flower’s hue<br />
(color) and chroma (vividness/dullness).<br />
When their L* values<br />
(degree of lightness) are added in<br />
Figure 12, the final color of each<br />
flower is obtained.<br />
CIELCH (L*C*h°)<br />
While CIELAB uses Cartesian<br />
coordinates <strong>to</strong> calculate a color in<br />
a color space, CIELCH uses polar<br />
coordinates. This color expression<br />
can be derived from CIELAB. The<br />
L* defines lightness, C* specifies<br />
chroma and h° denotes hue angle,<br />
an angular measurement.
The L*C*h° expression offers an<br />
advantage over CIELAB in that it’s<br />
very easy <strong>to</strong> relate <strong>to</strong> the earlier<br />
systems based on physical<br />
samples, like the Munsell <strong>Color</strong><br />
Scale.<br />
L* = 116 (Y/Yn) 1/3 – 16<br />
a* = 500 [(X/Xn) 1/3 – (Y/Yn) 1/3 ]<br />
b* = 200 [(Y/Yn) 1/3 – (Z/Zn) 1/3 ]<br />
L* =116 (Y/Yn) 1/3 – 16<br />
C* = (a2 + b2 ) 1/2<br />
h° = arctan (b*/a*)<br />
X n, Y n, Z n, are values for a<br />
reference white for the<br />
illumination/observer used.<br />
180˚<br />
Green<br />
-a*<br />
Figure 11: CIELAB color chart<br />
90˚<br />
Yellow<br />
+b*<br />
Blue<br />
-b*<br />
270˚<br />
Hue<br />
Figure 12: The L* value is represented on the center axis. The a* and b* axes<br />
appear on the horizontal plane.<br />
13<br />
0˚<br />
Red<br />
+a*
14<br />
<strong>Color</strong><br />
Differences,<br />
Notation and<br />
Tolerancing<br />
Delta CIELAB and CIELCH<br />
Assessment of color is more than a<br />
numeric expression. Usually it’s an<br />
assessment of the color difference<br />
(delta) from a known standard.<br />
CIELAB and CIELCH are used <strong>to</strong><br />
compare the colors of two objects.<br />
Flower A: L* = 52.99 a* = 8.82 b* = 54.53<br />
Flower C: L*=64.09 a*=2.72 b*=49.28<br />
<strong>Color</strong> difference of Flower C <strong>to</strong> A<br />
∆L* = +11.10, ∆a* = –6.10, ∆b* = –5.25<br />
∆E* ab = [(+ 11.1) 2 + (–6.1) 2 + (–5.25) 2 ] 1/2<br />
∆E* ab = 13.71<br />
The expressions for these color<br />
differences are ∆L* ∆a* ∆b* or DL*<br />
Da* Db*, and ∆L* ∆C* ∆H* or DL*<br />
DC* DH* (∆ or D symbolizes<br />
“delta,” which indicates difference).<br />
Given ∆L* ∆a* ∆b*, the <strong>to</strong>tal difference<br />
or distance on the CIELAB<br />
diagram can be stated as a single<br />
value, known as ∆E*.<br />
∆E* ab = [(∆L 2 ) + (∆a 2 ) + (∆b 2 )] 1/2<br />
Let’s compare the color of Flower<br />
A <strong>to</strong> Flower C, pictured below.<br />
Separately, each would be classified<br />
as a yellow rose. But what is<br />
their relationship when set side by<br />
side? How do the colors differ?<br />
Using the equation for ∆L* ∆a*<br />
∆b*, the color difference between<br />
Flower A and Flower C can be<br />
expressed as:<br />
∆L* = +11.10<br />
∆a* = –6.10<br />
∆b* = –5.25<br />
The <strong>to</strong>tal color difference can be<br />
expressed as ∆E*=13.71<br />
The values for Flowers A and C<br />
are shown at the bot<strong>to</strong>m of this<br />
page. On the a* axis, a reading of<br />
–6.10 indicates greener or less red.<br />
On the b* axis, a reading of –5.25<br />
indicates bluer or less yellow. On the<br />
L* plane, the measurement difference<br />
of +11.10 shows that Flower<br />
C is lighter than Flower A.<br />
If the same two flowers were<br />
compared using CIELCH, the color<br />
differences would be expressed as:<br />
∆L* = +11.10<br />
∆C* = –5.88<br />
∆H* = 5.49<br />
Referring again <strong>to</strong> the flowers<br />
shown below, the ∆C* value of<br />
–5.88 indicates that Flower C is less<br />
chromatic, or less saturated. The<br />
∆H* value of 5.49 indicates that<br />
Flower C is greener in hue than<br />
Flower A. The L* and ∆L* values are<br />
identical for CIELCH and CIELAB.
CIE <strong>Color</strong> Space Notation<br />
∆L* = difference in lightness/darkness value<br />
+ = lighter – = darker<br />
∆a* = difference on red/green axis<br />
+ = redder – = greener<br />
∆b* = difference on yellow/blue axis<br />
+ = yellower – = bluer<br />
∆C* = difference in chroma<br />
+ = brighter – = duller<br />
∆H* = difference in hue<br />
∆E* = <strong>to</strong>tal color difference value<br />
Refer <strong>to</strong> Figure 11 on page 10.<br />
Visual <strong>Color</strong> and Tolerancing<br />
Poor color memory, eye fatigue, color blindness and viewing<br />
conditions can all affect the human eye’s ability <strong>to</strong> distinguish<br />
color differences. In addition <strong>to</strong> those limitations, the eye does<br />
not detect differences in hue (red, yellow, green, blue, etc.),<br />
chroma (saturation) or lightness equally. In fact, the average<br />
observer will see hue differences first, chroma differences<br />
second and lightness differences last. Visual acceptability is<br />
best represented by an ellipsoid (Figure 13).<br />
As a result, our <strong>to</strong>lerance for an acceptable color match<br />
consists of a three-dimensional boundary with varying limits<br />
for lightness, hue and chroma, and must agree with visual<br />
assessment. CIELAB and CIELCH can be used <strong>to</strong> create<br />
those boundaries. Additional <strong>to</strong>lerancing formulas, known<br />
as CMC and CIE94, produce ellipsoidal <strong>to</strong>lerances.<br />
CIELAB Tolerancing<br />
When <strong>to</strong>lerancing with CIELAB, you must choose a difference<br />
limit for ∆L* (lightness), ∆a* (red/green), and ∆b* (yellow/blue).<br />
These limits create a rectangular <strong>to</strong>lerance box around the<br />
standard (Figure 14).<br />
When comparing this <strong>to</strong>lerance box with the visually accepted<br />
ellipsoid, some problems emerge. A box-shaped <strong>to</strong>lerance<br />
around the ellipsoid can give good numbers for unacceptable<br />
color. If the <strong>to</strong>lerance box is made small enough <strong>to</strong> fit within<br />
the ellipsoid, it is possible <strong>to</strong> get bad numbers for visually<br />
acceptable color (Figure 15).<br />
∆b*<br />
Hue<br />
Lightness<br />
Chroma<br />
Figure 13: Tolerance ellipsoid<br />
b*<br />
a*<br />
Standard<br />
Figure 14: CIELAB <strong>to</strong>lerance box<br />
b*<br />
Samples within the box<br />
and not in the ellipsoid are<br />
numerically correct but<br />
visually unacceptable<br />
Samples within<br />
the ellipsoid<br />
are visually<br />
acceptable<br />
∆a*<br />
Figure 15: Numerically correct<br />
vs. visually acceptable<br />
a*<br />
Lightness (L*)<br />
15
16<br />
<strong>Color</strong> Differences,<br />
Notation and<br />
Tolerancing<br />
continued<br />
CIELCH Tolerancing<br />
CIELCH users must choose a difference limit for ∆L* (lightness), ∆C*<br />
(chroma) and ∆H* (hue). This creates a wedge-shaped box around the<br />
standard. Since CIELCH is a polar-coordinate system, the <strong>to</strong>lerance box<br />
can be rotated in orientation <strong>to</strong> the hue angle (Figure 16).<br />
When this <strong>to</strong>lerance is compared with the ellipsoid, we can see that it<br />
more closely matches human perception. This reduces the amount of<br />
disagreement between the observer and the instrumental values<br />
(Figure 17).<br />
CMC Tolerancing<br />
CMC is not a color space but rather a <strong>to</strong>lerancing system. CMC <strong>to</strong>lerancing<br />
is based on CIELCH and provides better agreement between<br />
visual assessment and measured color difference. CMC <strong>to</strong>lerancing was<br />
developed by the Colour Measurement Committee of the Society of Dyers<br />
and Colourists in Great Britain and became public domain in 1988.<br />
The CMC calculation mathematically defines an ellipsoid around the standard<br />
color with semi-axis corresponding <strong>to</strong> hue, chroma and lightness. The<br />
ellipsoid represents the volume of acceptable color and au<strong>to</strong>matically<br />
varies in size and shape depending on the position of the color in color<br />
space.<br />
Figure 18 (on page 17) shows the variation of the ellipsoids throughout<br />
color space. The ellipsoids in the orange area of color space are longer<br />
and narrower than the broader and rounder ones in the green area. The<br />
size and shape of the ellipsoids also change as the color varies in chroma<br />
and/or lightness.<br />
The CMC equation allows you <strong>to</strong> vary the overall size of the ellipsoid <strong>to</strong><br />
better match what is visually acceptable. By varying the commercial fac<strong>to</strong>r<br />
(cf), the ellipsoid can be made as large or small as necessary <strong>to</strong> match<br />
visual assessment. The cf value is the <strong>to</strong>lerance, which means that if<br />
cf=1.0, then ∆E CMC less than 1.0 would pass, but more than 1.0 would<br />
fail (see Figure 19 on page 17).<br />
Since the eye will generally accept larger differences in lightness (l) than in<br />
chroma (c), a default ratio for (l:c) is 2:1. A 2:1 ratio will allow twice as<br />
much difference in lightness as in chroma. The CMC equation allows this<br />
ratio <strong>to</strong> be adjusted <strong>to</strong> achieve better agreement with visual assessment<br />
(see Figure 20 on page 18).<br />
Lightness<br />
Chroma<br />
∆L*<br />
Standard<br />
∆C*<br />
Figure 16: CIELCH <strong>to</strong>lerance<br />
wedge<br />
b*<br />
∆H*<br />
∆C*<br />
∆C*<br />
Figure 17: CIELCH <strong>to</strong>lerance<br />
ellipsoids<br />
∆H*<br />
∆C*<br />
∆H*<br />
∆H*<br />
a*
Green<br />
Tolerance ellipsoids<br />
are larger in the<br />
green region.<br />
Figure 18: Tolerance ellipsoids in color space<br />
cf = 0.5<br />
Cross sections<br />
of the ellipsoid<br />
Standard<br />
Figure 19: Commercial fac<strong>to</strong>r (cf) of <strong>to</strong>lerances<br />
cf = 1<br />
Yellow<br />
Blue<br />
Tolerance ellipsoids are<br />
tightly packed in the<br />
orange region.<br />
Hue and chromaticity <strong>to</strong>lerances<br />
become smaller as lightness<br />
increases or decreases<br />
Hue<br />
Hue<br />
Chroma<br />
Red<br />
Chroma<br />
17
CIE94 Tolerancing<br />
In 1994 the CIE released a new <strong>to</strong>lerance method called CIE94. Like<br />
CMC, the CIE94 <strong>to</strong>lerancing method also produces an ellipsoid. The user<br />
has control of the lightness (kL) <strong>to</strong> chroma (Kc) ratio, as well as the<br />
commercial fac<strong>to</strong>r (cf). These settings affect the size and shape of the<br />
ellipsoid in a manner similar <strong>to</strong> how the l:c and cf settings affect CMC.<br />
However, while CMC is targeted for use in the textile industry, CIE94 is<br />
targeted for use in the paint and coatings industry. You should consider the<br />
type of surface being measured when choosing between these two <strong>to</strong>lerances.<br />
If the surface is textured or irregular, CMC may be the best fit. If the<br />
surface is smooth and regular, CIE94 may be the best choice.<br />
Visual Assessment vs. Instrumental<br />
Though no color <strong>to</strong>lerancing system is perfect, the CMC and CIE94 equations<br />
best represent color differences as our eyes see them.<br />
Choosing the Right Tolerance<br />
When deciding which color difference calculation <strong>to</strong> use, consider the<br />
following five rules (Billmeyer 1970 and 1979):<br />
1. Select a single method of calculation and use it consistently.<br />
2. Always specify exactly how the calculations are made.<br />
3. Never attempt <strong>to</strong> convert between color differences calculated by<br />
different equations through the use of average fac<strong>to</strong>rs.<br />
4. Use calculated color differences only as a first approximation in setting<br />
<strong>to</strong>lerances, until they can be confirmed by visual judgments.<br />
5. Always remember that nobody accepts or rejects color because of<br />
numbers — it is the way it looks that counts.<br />
18<br />
<strong>Color</strong> Differences,<br />
Notation and<br />
Tolerancing<br />
continued<br />
% Agreement<br />
Tolerance Method with Visual<br />
CIELAB 75%<br />
CIELCH 85%<br />
CMC or CIE94 95%<br />
Hue<br />
Lightness<br />
Figure 20: CMC <strong>to</strong>lerance<br />
ellipsoids<br />
Chroma<br />
(1.4:1)<br />
(2:1)
Other<br />
<strong>Color</strong><br />
Expressions<br />
The same blue ink looks like a different color when<br />
printed on paper of various whiteness<br />
White and Yellow Indices<br />
Certain industries, such as paint,<br />
textiles and paper manufacturing,<br />
evaluate their materials and products<br />
based on standards of whiteness.<br />
Typically, this whiteness<br />
index is a preference rating for how<br />
white a material should appear, be<br />
it pho<strong>to</strong>graphic and printing paper<br />
or plastics.<br />
In some instances, a manufacturer<br />
may want <strong>to</strong> judge the yellowness<br />
or tint of a material. This is done <strong>to</strong><br />
determine how much that object’s<br />
color departs from a preferred<br />
white <strong>to</strong>ward a bluish tint.<br />
The effect of whiteness or yellowness<br />
can be significant, for<br />
example, when printing inks or<br />
dyes on paper. A blue ink printed<br />
on a highly-rated white s<strong>to</strong>ck will<br />
look different than the same ink<br />
printed on newsprint or another<br />
low-rated s<strong>to</strong>ck.<br />
The American Standards Test<br />
Methods (ASTM) has defined<br />
whiteness and yellowness indices.<br />
The E313 whiteness index is used<br />
for measuring near-white, opaque<br />
materials such as paper, paint and<br />
plastic. In fact, this index can be<br />
used for any material whose color<br />
appears white.<br />
The ASTM’s E313 yellowness<br />
index is used <strong>to</strong> determine the<br />
degree <strong>to</strong> which a sample’s color<br />
shifts away from an ideal white.<br />
The D1925 yellowness index is<br />
used for measuring plastics.<br />
19
20<br />
Glossary<br />
absolute white – In theory, a material<br />
that perfectly reflects all light<br />
energy at every visible wavelength.<br />
In practice, a solid white with known<br />
spectral reflectance data that is used<br />
as the “reference white” for all measurements<br />
of absolute reflectance.<br />
When calibrating a spectropho<strong>to</strong>meter,<br />
often a white ceramic<br />
plaque is measured and used as the<br />
absolute white reference.<br />
absorb/absorption – Dissipation of<br />
the energy of electromagnetic waves<br />
in<strong>to</strong> other forms (e.g., heat) as a<br />
result of its interaction with matter; a<br />
decrease in directional transmittance<br />
of incident radiation, resulting in a<br />
modification or conversion of the<br />
absorbed energy.<br />
achromatic color – A neutral color<br />
that has no hue (white, gray or black).<br />
additive primaries – Red, green<br />
and blue light. When all three additive<br />
primaries are combined at 100%<br />
intensity, white light is produced.<br />
When these three are combined at<br />
varying intensities, a gamut of<br />
different colors is produced.<br />
Combining two primaries at 100%<br />
produces a subtractive primary,<br />
either cyan, magenta or yellow:<br />
100% red + 100% green = yellow<br />
100% red + 100% blue = magenta<br />
100% green + 100% blue = cyan<br />
See subtractive primaries<br />
appearance – An object’s or material’s<br />
manifestation through visual<br />
attributes such as size, shape, color,<br />
texture, glossiness, transparency,<br />
opacity, etc.<br />
artificial daylight – Term loosely<br />
applied <strong>to</strong> light sources, frequently<br />
equipped with filters, that try <strong>to</strong><br />
reproduce the color and spectral<br />
distribution of daylight. A more<br />
specific definition of the light source<br />
is preferred.<br />
attribute – Distinguishing characteristic<br />
of a sensation, perception or<br />
mode of appearance. <strong>Color</strong>s are<br />
often described by their attributes of<br />
hue, chroma (or saturation) and<br />
lightness.<br />
black – In theory, the complete<br />
absorption of incident light; the<br />
absence of any reflection. In practice,<br />
any color that is close <strong>to</strong> this<br />
ideal in a relative viewing situation —<br />
i.e., a color of very low saturation<br />
and very low luminance.<br />
brightness – The dimension of color<br />
that refers <strong>to</strong> an achromatic scale,<br />
ranging from black <strong>to</strong> white. Also<br />
called lightness, luminous<br />
reflectance or transmittance (q.v.).<br />
Because of confusion with saturation,<br />
the use of this term should be<br />
discouraged.<br />
c* – Abbreviation for chromaticity.<br />
chroma/chromaticity – The intensity<br />
or saturation level of a particular<br />
hue, defined as the distance of<br />
departure of a chromatic color from<br />
the neutral (gray) color with the<br />
same value. In an additive colormixing<br />
environment, imagine mixing<br />
a neutral gray and a vivid red with<br />
the same value. Starting with the<br />
neutral gray, add small amounts of<br />
red until the vivid red color is<br />
achieved. The resulting scale<br />
obtained would represent increasing<br />
chroma. The scale begins at zero for<br />
neutral colors, but has no arbitrary<br />
end. Munsell originally established<br />
10 as the highest chroma for a<br />
vermilion pigment and related other<br />
pigments <strong>to</strong> it. Other pigments with<br />
higher chroma were noted, but the<br />
original scale remained. The chroma<br />
scale for normal reflecting materials<br />
may extend as high as 20, and for<br />
fluorescent materials it may be as<br />
high as 30.<br />
chromatic – Perceived as having a<br />
hue — not white, gray or black.<br />
chromaticity coordinates (CIE) –<br />
The ratios of each of the three tristimulus<br />
values X, Y and Z in relation<br />
<strong>to</strong> the sum of the three — designated<br />
as x, y and z respectively.<br />
They are sometimes referred <strong>to</strong> as<br />
the trichromatic coefficients. When<br />
written without subscripts, they are<br />
assumed <strong>to</strong> have been calculated for<br />
illuminant C and the 2° (1931) standard<br />
observer unless specified<br />
otherwise. If they have been
obtained for other illuminants or<br />
observers, a subscript describing the<br />
observer or illuminant should be<br />
used. For example, x10 and y10 are<br />
chromaticity coordinates for the 10°<br />
observer and illuminant C.<br />
chromaticity diagram (CIE) – A<br />
two-dimensional graph of the chromaticity<br />
coordinates (x as the<br />
abscissa and y as the ordinate),<br />
which shows the spectrum locus<br />
(chromaticity coordinates of monochromatic<br />
light, 380-770nm). It has<br />
many useful properties for<br />
comparing colors of both luminous<br />
and non-luminous materials.<br />
CIE (Commission Internationale de<br />
l’Eclairage) – The International<br />
Commission on Illumination, the<br />
primary international organization<br />
concerned with color and color<br />
measurement.<br />
CIE 1976 L*a*b* color space – A<br />
uniform color space utilizing an<br />
Adams-Nickerson cube root formula,<br />
adopted by the CIE in 1976 for use<br />
in the measurement of small color<br />
differences.<br />
CIE 1976 L*u*v* color space – A<br />
uniform color space adopted in 1976.<br />
Appropriate for use in additive mixing<br />
of light (e.g., color TV).<br />
CIE chromaticity coordinates –<br />
See chromaticity coordinates (CIE).<br />
CIE chromaticity diagram – See<br />
chromaticity diagram (CIE).<br />
CIE daylight illuminants – See<br />
daylight illuminants (CIE).<br />
CIE luminosity function (y) – See<br />
luminosity function (CIE).<br />
CIE standard illuminants – See<br />
standard illuminants (CIE).<br />
CIE standard observer – See standard<br />
observer (CIE).<br />
CIE tristimulus values – See tristimulus<br />
values (CIE).<br />
CIELAB (or CIE L*a*b*, CIE Lab) –<br />
<strong>Color</strong> space in which values L*, a*<br />
and b* are plotted using Cartesian<br />
coordinate system. Equal distances<br />
in the space approximately represent<br />
equal color differences. Value L*<br />
represents lightness; value a* represents<br />
the red/green axis; and value<br />
b* represents the yellow/blue axis.<br />
CIELAB is a popular color space for<br />
use in measuring reflective and<br />
transmissive objects.<br />
CMC (Colour Measurement<br />
Committee of the Society of Dyes<br />
and Colourists of Great Britain) –<br />
Organization that developed and<br />
published in 1988 a more logical,<br />
ellipse-based equation based on<br />
L*C*h˚ color space for computing DE<br />
(see delta E*) values as an alternative<br />
<strong>to</strong> the rectangular coordinates of<br />
the CIELAB color space.<br />
color – One aspect of appearance; a<br />
stimulus based on visual response <strong>to</strong><br />
light, consisting of the three dimensions<br />
of hue, saturation and lightness.<br />
color attribute – A three-dimensional<br />
characteristic of the appearance<br />
of an object. One dimension<br />
usually defines the lightness, the<br />
other two <strong>to</strong>gether define the chromaticity.<br />
color difference – The magnitude<br />
and character of the difference<br />
between two colors under specified<br />
conditions.<br />
color-matching functions –<br />
Relative amounts of three additive<br />
primaries required <strong>to</strong> match each<br />
wavelength of light. The term is<br />
generally used <strong>to</strong> refer <strong>to</strong> the CIE<br />
standard observer color-matching<br />
functions.<br />
color measurement – Physical<br />
measurement of light radiated, transmitted<br />
or reflected by a specimen<br />
under specified condition and mathematically<br />
transformed in<strong>to</strong> standardized<br />
colorimetric terms. These terms<br />
can be correlated with visual evaluations<br />
of colors relative <strong>to</strong> one<br />
another.<br />
color model – A color-measurement<br />
scale or system that numerically<br />
specifies the perceived attributes of<br />
color. Used in computer graphics<br />
applications and by color measurement<br />
instruments.<br />
color order systems – Systems<br />
used <strong>to</strong> describe an orderly threedimensional<br />
arrangement of colors.<br />
Three bases can be used for<br />
ordering colors: 1) an appearance<br />
basis (i.e., a psychological basis) in<br />
terms of hue, saturation and lightness;<br />
an example is the Munsell<br />
System; 2) an orderly additive color<br />
mixture basis (i.e., a psychophysical<br />
basis); examples are the CIE System<br />
and the Ostwald System; and 3) an<br />
orderly subtractive color mixture<br />
basis; an example is the Plochere<br />
<strong>Color</strong> System based on an orderly<br />
mixture of inks.<br />
color space – Three-dimensional<br />
solid enclosing all possible colors.<br />
The dimensions may be described in<br />
various geometries, giving rise <strong>to</strong><br />
various spacings within the solid.<br />
color specification – Tristimulus<br />
values, chromaticity coordinates and<br />
luminance value, or other color-scale<br />
values, used <strong>to</strong> designate a color<br />
numerically in a specified color<br />
system.<br />
color temperature – A measurement<br />
of the color of light radiated by<br />
a black body while it is being heated.<br />
This measurement is expressed in<br />
terms of absolute scale, or degrees<br />
Kelvin. Lower Kelvin temperatures<br />
such as 2400K are red; higher<br />
temperatures such as 9300K are<br />
blue. Neutral temperature is white, at<br />
6504K.<br />
color wheel – The visible spectrum’s<br />
continuum of colors arranged in a<br />
circle, where complementary colors<br />
such as red and green are located<br />
directly across from each other.<br />
colorants – Materials used <strong>to</strong> create<br />
colors — dyes, pigments, <strong>to</strong>ners,<br />
waxes, phosphors.<br />
colorimeter – An optical measurement<br />
instrument that responds <strong>to</strong><br />
color in a manner similar <strong>to</strong> the<br />
human eye — by filtering reflected<br />
light in<strong>to</strong> its dominant regions of red,<br />
green and blue.<br />
21
colorimetric – Of, or relating <strong>to</strong>,<br />
values giving the amounts of three<br />
colored lights or recep<strong>to</strong>rs — red,<br />
green and blue.<br />
colorist – A person skilled in the art<br />
of color matching (colorant formulation)<br />
and knowledgeable concerning<br />
the behavior of colorants in a particular<br />
material; a tinter (q.v.) (in the<br />
American usage) or a shader. The<br />
word “colorist” is of European origin.<br />
complements – Two colors that<br />
create neutral gray when combined.<br />
On a color wheel, complements are<br />
directly opposite from each other:<br />
blue/yellow, red/green and so on.<br />
contrast – The level of variation<br />
between light and dark areas in an<br />
image.<br />
D65 – The CIE standard illuminant<br />
that represents a color temperature<br />
of 6504K. This is the color temperature<br />
most widely used in graphic<br />
arts industry viewing booths. See<br />
Kelvin (K).<br />
daylight illuminants (CIE) – Series<br />
of illuminant spectral power distribution<br />
curves based on measurements<br />
of natural daylight and recommended<br />
by the CIE in 1965. Values are<br />
defined for the wavelength region<br />
300 <strong>to</strong> 830nm. They are described in<br />
terms of the correlated color temperature.<br />
The most important is D65<br />
because of the closeness of its<br />
correlated color temperature <strong>to</strong> that<br />
of illuminant C, 6774K. D75 bluer<br />
than D65 and D55 yellower than D65<br />
are also used.<br />
delta (D or ∆) – A symbol used <strong>to</strong><br />
indicate deviation or difference.<br />
delta E*, delta e* – The <strong>to</strong>tal color<br />
difference computed with a color<br />
difference equation (∆Eab or ∆Ecmc). In color <strong>to</strong>lerancing, the symbol DE<br />
is often used <strong>to</strong> express Delta Error.<br />
dye – A soluble colorant — as<br />
opposed <strong>to</strong> pigment, which is insoluble.<br />
dynamic range – An instrument’s<br />
range of measurable values, from<br />
the lowest amount it can detect <strong>to</strong><br />
the highest amount it can handle.<br />
22<br />
Glossary<br />
continued<br />
electromagnetic spectrum – The<br />
massive band of electromagnetic<br />
waves that pass through the air in<br />
different sizes, as measured by<br />
wavelength. Different wavelengths<br />
have different properties, but most<br />
are invisible — and some completely<br />
undetectable — <strong>to</strong> human beings.<br />
Only wavelengths that are between<br />
380 and 720 nanometers are visible,<br />
producing light. Waves outside the<br />
visible spectrum include gamma<br />
rays, x-rays, microwaves and radio<br />
waves.<br />
emissive object – An object that<br />
emits light. Emission is usually<br />
caused by a chemical reaction, such<br />
as the burning gasses of the sun or<br />
the heated filament of a light bulb.<br />
fluorescent lamp – A glass tube<br />
filled with mercury gas and coated<br />
on its inner surface with phosphors.<br />
When the gas is charged with an<br />
electrical current, radiation is<br />
produced. This, in turn, energizes the<br />
phosphors, causing them <strong>to</strong> glow.<br />
gloss – An additional parameter <strong>to</strong><br />
consider when determining a color<br />
standard, along with hue, value,<br />
chroma, the texture of a material and<br />
whether the material has metallic or<br />
pearlescent qualities. Gloss is an<br />
additional <strong>to</strong>lerance that may be<br />
specified in the Munsell <strong>Color</strong><br />
Tolerance Set. The general rule for<br />
evaluating the gloss of a color<br />
sample is the higher the gloss unit,<br />
the darker the color sample will<br />
appear. Conversely, the lower the<br />
gloss unit, the lighter a sample will<br />
appear.<br />
Gloss is measured in gloss units,<br />
which use the angle of measurement<br />
and the gloss value (e.g. 60˚ gloss =<br />
29.8). A 60˚ geometry is recommended<br />
by the American Society for<br />
Testing and Materials (ASTM) D523<br />
standard for the general evaluation<br />
of gloss.<br />
grayscale – An achromatic scale<br />
ranging from black through a series<br />
of successively lighter grays <strong>to</strong> white.<br />
Such a series may be made up of<br />
steps that appear <strong>to</strong> be equally<br />
distant from one another (such as<br />
the Munsell Value Scale), or it may<br />
be arranged according <strong>to</strong> some other<br />
criteria such as a geometric progression<br />
based on lightness. Such scales<br />
may be used <strong>to</strong> describe the relative<br />
amount of difference between two<br />
similar colors.<br />
hue – 1) The first element in the<br />
color-order system, defined as the<br />
attribute by which we distinguish red<br />
from green, blue from yellow, etc.<br />
Munsell defined five principal hues<br />
(red, yellow, green, blue and purple)<br />
and five intermediate hues (yellowred,<br />
green-yellow, blue-green,<br />
purple-blue and red-purple. These 10<br />
hues (represented by their corresponding<br />
initials R, YR, Y, GY, G,<br />
BG, B, PB, P and RP) are equally<br />
spaced around a circle divided in<strong>to</strong><br />
100 equal visual steps, with the zero<br />
point located at the beginning of the<br />
red sec<strong>to</strong>r. Adjacent colors in this<br />
circle may be mixed <strong>to</strong> obtain continuous<br />
variation from one hue <strong>to</strong><br />
another. <strong>Color</strong>s defined around the<br />
hue circle are known as chromatic<br />
colors. 2) The attribute of color by<br />
means of which a color is perceived<br />
<strong>to</strong> be red, yellow, green, blue, purple,<br />
etc. White, black and gray possess<br />
no hue.<br />
illuminant – Mathematical description<br />
of the relative spectral power<br />
distribution of a real or imaginary<br />
light source — i.e., the relative<br />
energy emitted by a source at each<br />
wavelength in its emission spectrum.<br />
Often used synonymously with “light<br />
source” or “lamp,” though such usage<br />
is not recommended.<br />
illuminant A (CIE) – Incandescent<br />
illumination, yellow-orange in color,<br />
with a correlated color temperature<br />
of 2856K. It is defined in the wavelength<br />
range of 380 <strong>to</strong> 770nm.<br />
illuminant C (CIE) – Tungsten illumination<br />
that simulates average<br />
daylight, bluish in color, with a correlated<br />
color temperature of 6774K.<br />
illuminants D (CIE) – Daylight illuminants,<br />
defined from 300 <strong>to</strong> 830nm<br />
(the UV portion 300 <strong>to</strong> 380nm being<br />
necessary <strong>to</strong> correctly describe<br />
colors that contain fluorescent dyes<br />
or pigments). They are designated as<br />
D, with a subscript <strong>to</strong> describe the
correlated color temperature; D65 is<br />
the most commonly used, having a<br />
correlated color temperature of<br />
6504K, close <strong>to</strong> that of illuminant C.<br />
They are based on actual measurements<br />
of the spectral distribution of<br />
daylight.<br />
integrating sphere – A sphere<br />
manufactured or coated with a highly<br />
reflective material that diffuses light<br />
within it.<br />
Kelvin (K) – Unit of measurement<br />
for color temperature. The Kelvin<br />
scale starts from absolute zero,<br />
which is -273˚ Celsius.<br />
light – 1) Electromagnetic radiation<br />
of which a human observer is aware<br />
through the visual sensations that<br />
arise from the stimulation of the<br />
retina of the eye. This portion of the<br />
spectrum includes wavelengths from<br />
about 380 <strong>to</strong> 770nm. Thus, <strong>to</strong> speak<br />
of ultraviolet light is incorrect<br />
because the human observer cannot<br />
see radiant energy in the ultraviolet<br />
region. 2) Adjective meaning high<br />
reflectance, transmittance or level of<br />
illumination as contrasted <strong>to</strong> dark, or<br />
low level of intensity.<br />
light source – An object that emits<br />
light or radiant energy <strong>to</strong> which the<br />
human eye is sensitive. The emission<br />
of a light source can be described by<br />
the relative amount of energy<br />
emitted at each wavelength in the<br />
visible spectrum, thus defining the<br />
source as an illuminant. The emission<br />
also may be described in terms<br />
of its correlated color temperature.<br />
lightness – Perception by which<br />
white objects are distinguished from<br />
gray, and light-colored objects from<br />
dark-colored.<br />
luminosity function (y) (CIE) – A<br />
plot of the relative magnitude of the<br />
visual response as a function of<br />
wavelength from about 380 <strong>to</strong><br />
780nm, adopted by CIE in 1924.<br />
metamerism – A phenomenon<br />
exhibited by a pair of colors that<br />
match under one or more sets of illuminants<br />
(be they real or calculated),<br />
but not under all illuminants.<br />
Munsell <strong>Color</strong> System – The color<br />
identification of a specimen by its<br />
Munsell hue, value and chroma as<br />
visually estimated by comparison<br />
with the Munsell Book of <strong>Color</strong>.<br />
nanometer (nm) – Unit of length<br />
equal <strong>to</strong> 10-9 meter (a.k.a. one<br />
billionth of a meter, or a milli-micron).<br />
observer – The human viewer who<br />
receives a stimulus and experiences<br />
a sensation from it. In vision, the<br />
stimulus is a visual one and the<br />
sensation is an appearance.<br />
observer, standard – See standard<br />
observer.<br />
radiant energy – A form of energy<br />
consisting of the electromagnetic<br />
spectrum, which travels at 299,792<br />
kilometers/second (186,206<br />
miles/second) through a vacuum,<br />
and more slowly in denser media<br />
(air, water, glass, etc.). The nature of<br />
radiant energy is described by its<br />
wavelength or frequency, although it<br />
also behaves as distinct quanta<br />
(“corpuscular theory”). The various<br />
types of energy may be transformed<br />
in<strong>to</strong> other forms of energy (electrical,<br />
chemical, mechanical, a<strong>to</strong>mic,<br />
thermal, radiant), but the energy<br />
itself cannot be destroyed.<br />
reflectance – The ratio of the intensity<br />
of reflected radiant flux <strong>to</strong> that of<br />
incident flux. In popular usage, it is<br />
considered the ratio of the intensity<br />
of reflected radiant energy <strong>to</strong> that<br />
reflected from a defined reference<br />
standard.<br />
reflectance, specular – See specular<br />
reflectance.<br />
reflectance, <strong>to</strong>tal – See <strong>to</strong>tal<br />
reflectance.<br />
saturation – The attribute of color<br />
perception that expresses the<br />
amount of departure from a gray of<br />
the same lightness. All grays have<br />
zero saturation (ASTM). See<br />
chroma/chromaticity.<br />
scattering – Diffusion or redirection of<br />
radiant energy encountering particles<br />
of different refractive index. Scattering<br />
occurs at any such interface, at the<br />
surface, or inside a medium containing<br />
particles.<br />
spectral power distribution curve<br />
– Intensity of radiant energy as a<br />
function of wavelength, generally<br />
given in relative power terms.<br />
spectropho<strong>to</strong>meter – Pho<strong>to</strong>metric<br />
device that measures spectral transmittance,<br />
spectral reflectance or relative<br />
spectral emittance.<br />
spectropho<strong>to</strong>metric curve – A<br />
curve measured on a spectropho<strong>to</strong>meter;<br />
a graph with relative<br />
reflectance or transmittance (or<br />
absorption) as the ordinate, plotted<br />
with wavelength or frequency as the<br />
abscissa.<br />
spectrum – Spatial arrangement of<br />
components of radiant energy in<br />
order of their wavelengths, wave<br />
number or frequency.<br />
specular gloss – Relative luminous<br />
fractional reflectance from a surface<br />
in the mirror or specular direction. It<br />
is sometimes measured at 60˚ relative<br />
<strong>to</strong> a perfect mirror.<br />
specular reflectance – Reflectance<br />
of a beam of radiant energy at an<br />
angle equal but opposite <strong>to</strong> the incident<br />
angle; the mirror-like reflectance.<br />
The magnitude of the specular<br />
reflectance on glossy materials<br />
depends on the angle and the difference<br />
in refractive indices between<br />
two media at a surface. The magnitude<br />
may be calculated from<br />
Fresnel’s Law.<br />
specular reflectance excluded<br />
(SCE) – Measurement of reflectance<br />
made in such a way that the specular<br />
reflectance is excluded from the<br />
measurement; diffuse reflectance.<br />
The exclusion may be accomplished<br />
by using 0˚ (perpendicular) incidence<br />
on the samples. This then reflects<br />
the specular component of the<br />
reflectance back in<strong>to</strong> the instrument<br />
by use of black absorbers or light<br />
traps at the specular angle when the<br />
incident angle is not perpendicular,<br />
or in directional measurements by<br />
measuring at an angle different from<br />
the specular angle.<br />
23
specular reflectance included<br />
(SCI) – Measurement of the <strong>to</strong>tal<br />
reflectance from a surface, including<br />
the diffuse and specular reflectances.<br />
standard – A reference against<br />
which instrumental measurements<br />
are made.<br />
standard illuminants (CIE) –<br />
Known spectral data established by<br />
the CIE for four different types of<br />
light sources. When using tristimulus<br />
data <strong>to</strong> describe a color, the illuminant<br />
must also be defined. These<br />
standard illuminants are used in<br />
place of actual measurements of the<br />
light source.<br />
standard observer (CIE) – 1) A<br />
hypothetical observer having the tristimulus<br />
color-mixture data recommended<br />
in 1931 by the CIE for a 2˚<br />
viewing angle. A supplementary<br />
observer for a larger angle of 10˚<br />
was adopted in 1964. 2) The spectral<br />
response characteristics of the<br />
average observer defined by the<br />
CIE. Two such sets of data are<br />
defined, the 1931 data for the 2˚<br />
visual field (distance viewing) and<br />
the 1964 data for the annular 10˚<br />
visual field (approximately arm’s<br />
length viewing). By cus<strong>to</strong>m, the<br />
assumption is made that if the<br />
observer is not specified, the tristimulus<br />
data has been calculated for the<br />
1931, or 2˚ field observer. The use of<br />
the 1964 data should be specified.<br />
subtractive primaries – Cyan,<br />
magenta and yellow. Theoretically,<br />
when all three subtractive primaries<br />
are combined at 100% on white<br />
paper, black is produced. When<br />
these are combined at varying intensities,<br />
a gamut of different colors is<br />
produced. Combining two primaries<br />
at 100% produces an additive<br />
primary, either red, green or blue:<br />
100% cyan + 100% magenta = blue<br />
100% cyan + 100% yellow = green<br />
100% magenta + 100% yellow = red<br />
tint – 1) verb: To mix white pigment<br />
with absorbing (generally chromatic)<br />
colorants. 2) noun: The color<br />
produced by mixing white pigment<br />
with absorbing (generally chromatic)<br />
colorants. The resulting mixture is<br />
24<br />
Glossary<br />
continued<br />
lighter and less saturated than the<br />
color without the white added.<br />
<strong>to</strong>tal reflectance – Reflectance of<br />
radiant flux reflected at all angles<br />
from the surface, thus including both<br />
diffuse and specular reflectances.<br />
transparent – Describes a material<br />
that transmits light without diffusion<br />
or scattering.<br />
tristimulus – Of, or consisting of,<br />
three stimuli; generally used <strong>to</strong><br />
describe components of additive<br />
mixture required <strong>to</strong> evoke a particular<br />
color sensation.<br />
tristimulus colorimeter – An instrument<br />
that measures tristimulus<br />
values and converts them <strong>to</strong> chromaticity<br />
components of color.<br />
tristimulus values (CIE) –<br />
Percentages of the components in a<br />
three-color additive mixture necessary<br />
<strong>to</strong> match a color; in the CIE system,<br />
they are designated as X, Y and Z.<br />
The illuminant and standard observer<br />
color-matching functions used must<br />
be designated; if they are not, the<br />
assumption is made that the values<br />
are for the 1931 observer (2˚ field)<br />
and illuminant C. The values obtained<br />
depend on the method of integration<br />
used, the relationship of the nature of<br />
the sample and the instrument design<br />
used <strong>to</strong> measure the reflectance or<br />
transmittance. Tristimulus values are<br />
not, therefore, absolute values characteristic<br />
of a sample, but relative<br />
values dependent on the method<br />
used <strong>to</strong> obtain them. Approximations<br />
of CIE tristimulus values may be<br />
obtained from measurements made<br />
on a tristimulus colorimeter that gives<br />
measurements generally normalized<br />
<strong>to</strong> 100. These must then be normalized<br />
<strong>to</strong> equivalent CIE values. The<br />
filter measurements should be properly<br />
designated as R, G and B<br />
instead of X, Y and Z.<br />
value – Indicates the degree of lightness<br />
or darkness of a color in relation<br />
<strong>to</strong> a neutral gray scale. The<br />
scale of value (or V, in the Munsell<br />
system of color notation) ranges<br />
from 0 for pure black <strong>to</strong> 10 for pure<br />
white. The value scale is neutral or<br />
without hue.<br />
X – 1) One of the three CIE tristimulus<br />
values; the red primary. 2)<br />
Spectral color-matching functions of<br />
the CIE standard observer used for<br />
calculating the X tristimulus value. 3)<br />
One of the CIE chromaticity coordinates<br />
calculated as the fraction of<br />
the sum of the three tristimulus<br />
values attributable <strong>to</strong> the X value.<br />
Y – 1) One of the three CIE tristimulus<br />
values, equal <strong>to</strong> the luminous<br />
reflectance or transmittance; the<br />
green primary. 2) Spectral colormatching<br />
function of the CIE standard<br />
observer used for calculating Y<br />
tristimulus value. 3) One of the CIE<br />
chromaticity coordinates calculated<br />
as the fraction of the sum of the<br />
three tristimulus values, attributable<br />
<strong>to</strong> the Y value.<br />
Z – 1) One of the three CIE tristimulus<br />
values; the blue primary. 2)<br />
Spectral color-matching function of<br />
the CIE standard observer used for<br />
calculating the Z tristimulus value. 3)<br />
One of the CIE chromaticity coordinates<br />
calculated as the fraction of<br />
the sum of the three tristimulus<br />
values attributable <strong>to</strong> the Z primary.
xrite.com<br />
Corporate Headquarters - USA<br />
4300 44th Street SE<br />
Grand Rapids, Michigan 49512<br />
Phone 1 800 248 9748 or 1 616 803 2100<br />
Fax 1 800 292 4437 or 1 616 803 2705<br />
Corporate Headquarters - Europe<br />
Althardstrasse 70<br />
8105 Regensdorf<br />
Switzerland<br />
Phone (+41) 44 842 24 00<br />
Fax (+41) 44 842 22 22<br />
Corporate Headquarters - Asia<br />
Room 808-810<br />
Kornhill Metro Tower, 1 Kornhill Road<br />
Quarry Bay, Hong Kong<br />
Phone (+852) 2 568 6283<br />
Fax (+852) 2 885 8610<br />
Please visit xrite.com for a local office near you.<br />
L10-001 (03/07) Printed in U.S.A.