On Erd˝os-Gallai and Havel-Hakimi algorithms
On Erd˝os-Gallai and Havel-Hakimi algorithms
On Erd˝os-Gallai and Havel-Hakimi algorithms

Create successful ePaper yourself
Turn your PDF publications into a flip-book with our unique Google optimized e-Paper software.
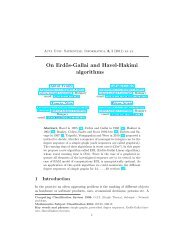
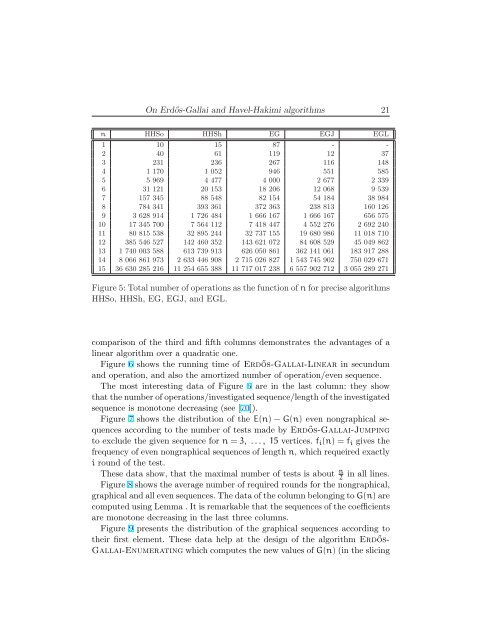
<strong>On</strong> Erdős-<strong>Gallai</strong> <strong>and</strong> <strong>Havel</strong>-<strong>Hakimi</strong> <strong>algorithms</strong> 21<br />
n HHSo HHSh EG EGJ EGL<br />
1 10 15 87 - -<br />
2 40 61 119 12 37<br />
3 231 236 267 116 148<br />
4 1 170 1 052 946 551 585<br />
5 5 969 4 477 4 000 2 677 2 339<br />
6 31 121 20 153 18 206 12 068 9 539<br />
7 157 345 88 548 82 154 54 184 38 984<br />
8 784 341 393 361 372 363 238 813 160 126<br />
9 3 628 914 1 726 484 1 666 167 1 666 167 656 575<br />
10 17 345 700 7 564 112 7 418 447 4 552 276 2 692 240<br />
11 80 815 538 32 895 244 32 737 155 19 680 986 11 018 710<br />
12 385 546 527 142 460 352 143 621 072 84 608 529 45 049 862<br />
13 1 740 003 588 613 739 913 626 050 861 362 141 061 183 917 288<br />
14 8 066 861 973 2 633 446 908 2 715 026 827 1 543 745 902 750 029 671<br />
15 36 630 285 216 11 254 655 388 11 717 017 238 6 557 902 712 3 055 289 271<br />
Figure 5: Total number of operations as the function of n for precise <strong>algorithms</strong><br />
HHSo, HHSh, EG, EGJ, <strong>and</strong> EGL.<br />
comparison of the third <strong>and</strong> fifth columns demonstrates the advantages of a<br />
linear algorithm over a quadratic one.<br />
Figure 6 shows the running time of Erdős-<strong>Gallai</strong>-Linear in secundum<br />
<strong>and</strong> operation, <strong>and</strong> also the amortized number of operation/even sequence.<br />
The most interesting data of Figure 6 are in the last column: they show<br />
that the number of operations/investigated sequence/length of the investigated<br />
sequence is monotone decreasing (see [70]).<br />
Figure 7 shows the distribution of the E(n) − G(n) even nongraphical sequences<br />
according to the number of tests made by Erdős-<strong>Gallai</strong>-Jumping<br />
to exclude the given sequence for n = 3, . . . , 15 vertices. fi(n) = fi gives the<br />
frequency of even nongraphical sequences of length n, which requeired exactly<br />
i round of the test.<br />
These data show, that the maximal number of tests is about n<br />
2<br />
in all lines.<br />
Figure 8 shows the average number of required rounds for the nongraphical,<br />
graphical <strong>and</strong> all even sequences. The data of the column belonging to G(n) are<br />
computed using Lemma . It is remarkable that the sequences of the coefficients<br />
are monotone decreasing in the last three columns.<br />
Figure 9 presents the distribution of the graphical sequences according to<br />
their first element. These data help at the design of the algorithm Erdős-<br />
<strong>Gallai</strong>-Enumerating which computes the new values of G(n) (in the slicing