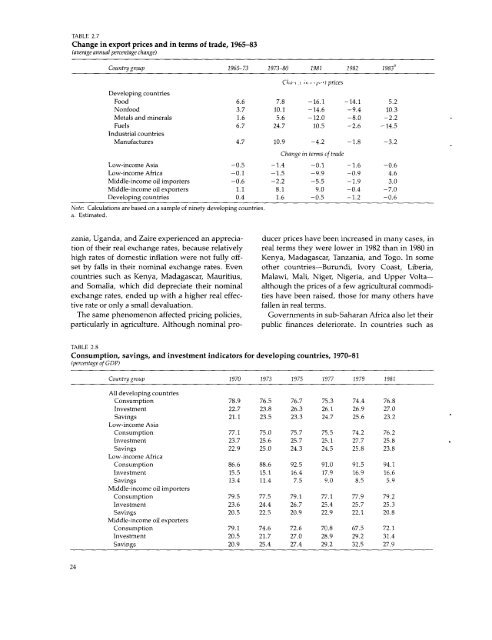
TABLE 2.7 Change in export prices and in terms of trade, 1965-83 (average annual percentage change) Country group 1965-73 1973-80 1981 1982 1983 C!a t ;.,--p. -t prices Developing countries Food 6.6 7.8 -16.1 -14.1 5.2 Nonfood 3.7 10.1 -14.6 -9.4 10.3 Metalsandminerals 1.6 5.6 -12.0 -8.0 -2.2 Fuels Industrial countries 6.7 24.7 10.5 -2.6 -14.5 Manufactures 4.7 10.9 -4.2 -1.8 -3.2 Cihange in tenns of trade Low-income Asia -0.5 -1.4 -0.1 -1.6 -0.6 Low-income Africa -0.1 -1.5 -9.9 -0.9 4.6 Middle-income oil importers -0.6 -2.2 -5.5 -1.9 3.0 Middle-income oil exporters 1.1 8.1 9.0 -0.4 -7.0 Developing countries 0.4 1.6 -0.5 -1.2 -0.6 Note: Calculations are based on a sample of ninety developing countries. a. Estimated. zania, Uganda, and Zaire experienced an apprecia- ducer prices have been increased in many cases, in tion of their real exchange rates, because relatively real terms they were lower in 1982 than in 1980 in high rates of domestic inflation were not fully off- Kenya, Madagascar, Tanzania, and Togo. In some set by falls in their nominal exchange rates. Even other countries-Burundi, Ivory Coast, Liberia, countries such as Kenya, Madagascar, Mauritius, Malawi, Mali, Niger, Nigeria, and Upper Voltaand Somalia, which did depreciate their nominal although the prices of a few agricultural commodiexchange rates, ended up with a higher real effec- ties have been raised, those for many others have tive rate or only a small devaluation. fallen in real terms. The same phenomenon affected pricing policies, Governments in sub-Saharan Africa also let their particularly in agriculture. Although nominal pro- public finances deteriorate. In countries such as TABLE 2.8 Consumption, savings, and investment indicators for developing countries, 1970-81 (percentage of GDP) 24 Country group 1970 1973 1975 1977 1979 1981 All developing countries Consumption 78.9 76.5 76.7 75.3 74.4 76.8 Investment 22.7 23.8 26.3 26.1 26.9 27.0 Savings 21.1 23.5 23.3 24.7 25.6 23.2 Low-income Asia Consumption 77.1 75.0 75.7 75.5 74.2 76.2 Investment 23.7 25.6 25.7 25.1 27.7 25.8 Savings 22.9 25.0 24.3 24.5 25.8 23.8 Low-income Africa Consumption 86.6 88.6 92.5 91.0 91.5 94.1 Investment 15.5 15.1 16.4 17.9 16.9 16.6 Savings 13.4 11.4 7.5 9.0 8.5 5.9 Middle-income oil importers Consumption 79.5 77.5 79.1 77.1 77.9 79.2 Investment 23.6 24.4 26.7 25.4 25.7 25.3 Savings 20.5 22.5 20.9 22.9 22.1 20.8 Middle-income oil exporters Consumption 79.1 74.6 72.6 70.8 67.5 72.1 Investment 20.5 21.7 27.0 28.9 29.2 31.4 Savings 20.9 25.4 27.4 29.2 32.5 27.9
Box 2.3 Adjustment to external shocks, 1974-81 E, trri rli ILnrr -hI-cl-s u tn.i* I it- nirlinltl r .. Et vi c E in 'r..in- -o.unirl Th.rd a It counir'e- ir ei enlpl| :inc, - F;pl m. tt; inhw ir 3, *d1iu>inir.t throuch iZgrI.i,artl mplort kFtna i idlu ld throughi a c mrilb.n3rii.n * The l .rn,4 .t had- .rid i i-I. 1J.. rh t.il- ub tiilu .inm ic. urre-- rin -r-n.- L i in --I inIp.rlt eUherruli-. i- and In cnhani. d 3rc. ot ii,prtn i;4 i I .ll imt.ir- liicd M3l,tia and CarbL'tcan *:ounirtIm and publi.l\ ' in - nli iri 1tt. liii.- ''Fi-i rnice again3i a .- ar .i- a p.r..ni.iar i-I in -j:gutlhtrn Eurc'.p:- increaetJd *Ain4 le- rapldi ihan lilth n culd . hc.; -a-"d t-,Ni' tht -it t-i 1 , -1;il hi: -.n i-,. pnri e- '-*- iptilrtanI mIn ltinit i-t .t FI-i . \iiil- . -n theor1 bn -1 e\peeri'n-t F--r thi; t:- taq-.-.rti in rwll,-.-n n mip--ri; -cri. r.1: oiunlrItI A d li' rI in rm..;ntt nitni I,-ll a; a i Lhi1I.- i.h- d ri--raiiton i bila - 1 pa. innt; . her it i4--4 i h-.hI..h lii a rnipir,- i.inlil . *k*f-r a-..r pubIlc;-1. pi4; a, c.li'ir,r.c i.-r 4I js r,:tl p-:'r-d r trigk,d rr.-m an Lr-l.a. ra1 .- a I - Luha ha ran ir ia \ind a3 rlr,t nu.nibi-r c-i -iernal ,h-cl- '.i. -Ilt thie e aun- . .r l nI Il - p,r.n a .- -ir lit -iTh - 01 . XirI clunirI.- b*rr-,t t ort:.- liE ak.- inc rea dt heir rd r-l. ,re,i.n Nr. noiddl.-o-liccrnle L i,n nlh..ilfln prF-d-.ert ,,- it.-ra a l' p-sr-en' ,r a- alri .1. In r.:-:ilr, IId r In [-4 c: untri-; :-tado it a mi rn itr. r-.- in 4 hi-.. hi.t. nio-r, ihan '', t --d t' it. r mnal hik pert,rl aind rat-ke 11t- ! rn,i r, e:rrt. . numt e . .. I r 1- h- -, il,t d nd car., It ., cIJ ,hart lhir i .-sr.i l.- rit Al hthir tulJr * pillZ ...,irllrlc 2 .-n lb. 1hiii Inc Ir a inmF,.rl wlirctiIUut.l.inIi ditrli'ral- * Tl; r..c;-;.- n-.idic.i *ei.l tt- * I- F p,rv rl-*'nin an -nhanLti rng put:lic -a- ing- In ii h gro.-t ! c -un- imnna,ic -n Ih hl-inc .- 1 pa-. ni,t .. I purlh -.a irm; . Intr, Fi.r II-,. gri.tp trt-l-lhi:h include- lam3ica P,.rt:iral 1- 1 1c pir.g c:..iill-t, hb.--c -: c r, [...,. -- l iuding k..r.a arnd .i.. tli - 1 : nd ci-l 13-til a'- er-e ha.- - li, . *,r. ilI;-.ir ir.ido ir-ir.r, p. ... r: I Zk thilL. i..a, higihi'i it 4 " ptrcT-ni .i.t pa% r.ertIl .rnpa .I: i d t iirlling public Ufrill rmr Iurltril ;Abl-- i -a p-rccimra-o tC . tr *t t.itl Th -- - np.-r pan - a'- ig.- rt ill, -r -lm n; r tih.;r -in -and-.a- * -it I` r ln cn d Irt-nri mainnu;l i 3' *:rt-t: -.-I n;tui l ll .c d- d tl;c,r t - rrial haill l,hl ti grr, A ltr Hat n ihal cnt i t sit II 1; 2, p,rcer In rm.:r -11*.; - Ir -nF.d tKr T hr ir r.-, Id z4. h.k. h,; lmpnrt p ut,ubituti.iIn rl Aed a * Fh,- ni mi,r;-r . rar- trr- r Ir I'- 4- .;.eriged 211 pII in.' 1 -hi. *l' ,1 -lnllari r.-l .n all ..i rtIhem i iih 'I Ihu lpiil in ih,: I,I. t-lcp,r -- --; . 1 r-e p i 3i.. h,.,i lie I -un txprl.-. in iTn t--, rapidl * ciimpcartd itlih ni.- iltan- .. -ii j,);' lit1r -i- . 1t .inlcI-edSt ic .;1.-- nianagtd 1 c.i-;liiilii. 0 nr, l-4n17l ill ih-e tiraluris pre-enl in iri r.Al iriitrt:-.; r rtt rin .-d ir ifl n IfliflIri. r -n-h h i .. ftn h r-l n i.. ll:hr oi l.f ---\ -. h..me ir,l.. pr,-rt.lt,n.ed in ,lil..ltnablt 2 plrc:rt .F m rni-:t (i Ii.N 1, . ..- mrD 1;1 IM I tllls l-m h .,ii rr-. J 1l-.b I Rc-sal - t*e rnal linanc,np It.a, ir.-. -1;:1-1k ii '-[ic-it fhr.t Ilihurc- ert li.l ii mrd ,r ;nd ir, -. ;.-d nrie irrl-irain han irI hr t ire t ir .o .- Iitir jii nmuch hic.h-r I l'J'I 1 ihil h . In i nc-nlfnl Sni F.I r-rii ill .I l I \ gi r \11,up but i nh n-i ,rk,-d dilierence - rh-i tlid L-.n in ir4- 1 .i rt I u.--am,ld III n r,-,I.I-nl h l.ml) b. ci,en c.iuntr-e - Irlt. .i ii tIrltit ur cued, , ccllpar.-l ;. tlull-ir,i lIniiitd IFl.l,illnr-l M * Pture r PA, r|a recri p II.:ri r. nerrl II -.ha a -. dut gli 1 - 1 r:. .r-i- d 41 ic-al i, 1' F inw . .. 'i-l i \ii.icc [ro-tan ar-i 5parn itlied ill .inr Jn un-.a ir,ldhlt arnnuail a-. er.l-` 01 ng-,ap ro . i -lawE I.are . PItI -i -w- tit in ii t:-rt helminill .n c LrrnIi bLonrrot-. - -ru. t r.-nt I L Ni' 1 . .IK... a . hi Ilnd a-ild p-iclf- :I lan. -Anlrr - ii, rv.,l In.- ni k.nc -r.! ., Imii:d d:lnlta lt ptr:trn irl i *;nhi -n- , rhr- i,-t,rnal d. H dllctnltni .1.- ... S;--..I. ent -t-ur .......... t * F' \p- ,t n . .. r, In Pnl. -r ..... ,d -V ; .rhl mr-.;l. V .. 1* i-nc r.- 1idier- :rt rnil rs1;-I. - in hi . pubic 11i ng- till-ni i' ihin ih- cr up .-.uniri. -f. .i il.-nb, ind-lninra . 1 .r, Pt rl .t ihic.. railtnli a ilaLr:itnl n-, Ia-. dr-- (a, Intl lr-., .- r.ai Irili rnil'ied t.Vi ith, r -pl.n;-t ar.-d --.n-i triwl rinL uI-h-d F,r-i Itrit-- 'iii:e tc .- IIh iichar.l-e becit L i h plll.Sd ['li-ii- .crluc- T.. r -uad Illu. .- icr .alit -a*.,1 L ri- imLii ItiiliiIl. . r u- uit *: ra-Idl.-ntnui h,t-rn-1 I .- t.-p I--ndlI, 'rade Alu-irll ii ill-. li i l. tur.:hn I l n r..4-n.t Un > .. .1if -1-hck, k .1- 1 I ri n .I I an unipctrl hIm p. p-ri - pari.i -., i.iu riin p i . ubur lu -. lu.- IIclui,n :-inlrl tti riilgp.-ln il-in Tha.- a,-i itin hlic,Ih h.r-phatyt In r. I lTh d IlDlrl ll tn,nl:lanct -a rIg.-; !IIri ihal - lard ;nd TLt: ( 1 rel.ead u*I nCI3ii-hiid -, It1 ii '1 1- . a itpping[ upL|. Ihe *h re h.thI. 5t -r.cI..n..I..r Ph' In r.laillnrI hNI t [lil-lhIl .- ni -,nltl-kl t trill!.pan-iln r,elktunnu nm -tIi ;UN lm -ti i. Ill . -rh m :jC-i . m t I Ic-c- l ind s1 i.l-,u -........ l..I Iluli-il but i-du..i U public ung; ; p-Li. ; F;.. i% mrig-- an.l ;u1bi-rarial addi- I1I ir-.r rd s -_rnai -rr.i-i .ir, r r i. 4l ci ti u hni - -.... pa ih -u-r-a, .nl i-a .i.nai tir. nil- I,g hi ard he I p ri t par.-i-i-n pl.,c-i ., p-m t . n -i,ni ICnf. in-p.ad .I4 .- t-rrn l di-luirb nt c; . -nd ti l petr--ilt 25
- Page 1: Public Disclosure Authorized Public
- Page 4 and 5: Oxford University Press NEW YORK OX
- Page 6 and 7: labor markets. And they have a vest
- Page 8 and 9: 8 The policy agenda 155 Population
- Page 10 and 11: Boxes 1.1 The arithmetic of populat
- Page 12 and 13: Glossary Demographic terms informat
- Page 14 and 15: I I
- Page 16 and 17: countries regain their momentum of
- Page 18 and 19: 4 Box 1.1 The arithmetic of populat
- Page 20 and 21: example. Between 1955 and 1980 inco
- Page 22 and 23: ment-all the more so if human skill
- Page 24 and 25: etween 1 and 2 percent-moderate com
- Page 26 and 27: FIGURE 2.1 directions-with a lag in
- Page 28 and 29: 14 Distribution of product among se
- Page 30 and 31: TABLE 2.2 Rates of growth in the re
- Page 32 and 33: export restraints and orderly marke
- Page 34 and 35: Box 2.2 Comparisons between the 193
- Page 36 and 37: TABLE 2.6 indebtedness is denominat
- Page 40 and 41: Burundi, Guinea, Mali, Malawi, and
- Page 42 and 43: TABLE 2.9 Exports from developing c
- Page 44 and 45: of rapid and painful adjustment for
- Page 46 and 47: In many countries internal adjustme
- Page 48 and 49: 3 Prospects for sustained growth Wi
- Page 50 and 51: TABLE 3.2 Growth of GDP per capita,
- Page 52 and 53: TABLE 3.4 Current account balance a
- Page 54 and 55: over time. The main focus of indust
- Page 56 and 57: TABLE 3.6 Growth of trade in develo
- Page 58 and 59: Box 3.3 Delinking from the world ec
- Page 60 and 61: nal surplus. The resulting rise in
- Page 62 and 63: Because the public sector in low-in
- Page 64 and 65: developing-country creditworthiness
- Page 66 and 67: themselves and, by caring for young
- Page 68 and 69: fertility in a changing world is a
- Page 70 and 71: nize contraceptive services. As wil
- Page 72 and 73: Economic transformation: Europe, Ja
- Page 74 and 75: scious control of family size, prob
- Page 76 and 77: Box 4.3 The European fertility tran
- Page 78 and 79: FIGURE 4.2 Birth and death rates an
- Page 80 and 81: Box 4.4 Alternative measures of fer
- Page 82 and 83: largest city in 1950, will not even
- Page 84 and 85: FIGURE 4.4 Fertility in relation to
- Page 86 and 87: government goal is a nationwide rat
- Page 88 and 89:
North America's population in 2000
- Page 90 and 91:
IBox 4.6 Three views of population
- Page 92 and 93:
TABLE 4.6 Population size and densi
- Page 94 and 95:
Box 5.1 Consequences of population
- Page 96 and 97:
implied by a simple division of tot
- Page 98 and 99:
and on farms. But the evidence on e
- Page 100 and 101:
get in GDP. Alternatively, all or p
- Page 102 and 103:
youths, who are presumably able to
- Page 104 and 105:
saving because they come from the c
- Page 106 and 107:
acre increased from 15.4 million to
- Page 108 and 109:
food they need. Although the amount
- Page 110 and 111:
is so scarce, they can do so only o
- Page 112 and 113:
from rural to urban areas mainly re
- Page 114 and 115:
other developing countries suggests
- Page 116 and 117:
emigration by providing information
- Page 118 and 119:
Box 5.7 Coping with rapid fertility
- Page 120 and 121:
6 Slowing population growth Experie
- Page 122 and 123:
feTtility; nor is it easy to judge
- Page 124 and 125:
the education of mothers increases
- Page 126 and 127:
etter education and health services
- Page 128 and 129:
TABLE 6.1 Total fertility rates and
- Page 130 and 131:
effectiveness of existing laws, ins
- Page 132 and 133:
in the 1950s and 1960s, fertility w
- Page 134 and 135:
FIGURE 6.6 Fertility dedine within
- Page 136 and 137:
Box 6.3 Mleasuring the value of chi
- Page 138 and 139:
few births; to encourage spacing, T
- Page 140 and 141:
Box 6.4 A deferred incentive scheme
- Page 142 and 143:
Box"7.1 Family planning for health
- Page 144 and 145:
FIGURE 71 88 in Romania (1979). Res
- Page 146 and 147:
132 Box 7.2 Birth planning technolo
- Page 148 and 149:
TABLE 7.2 Percentage of married wom
- Page 150 and 151:
TABLE 7.3 Discontinuation of contra
- Page 152 and 153:
may be delaying a first pregnancy,
- Page 154 and 155:
family planning and maternal and ch
- Page 156 and 157:
clients may develop can be promptly
- Page 158 and 159:
Box 7.6 The impact of service quali
- Page 160 and 161:
medical examination was not always
- Page 162 and 163:
measuring social acceptability, or
- Page 164 and 165:
Box 7.7 Military versus social expe
- Page 166 and 167:
costs per user. Public cost per use
- Page 168 and 169:
sanguine, however, as soon as one t
- Page 170 and 171:
TABLE 8.1 Population policy indicat
- Page 172 and 173:
Box 8.2 China's census: counting a
- Page 174 and 175:
FAMILY PLANNING. In many countries-
- Page 176 and 177:
improving the availability of famil
- Page 178 and 179:
Box 8.4 Africa: how much land, how
- Page 180 and 181:
Box 8.5 Infertility: a challenge to
- Page 182 and 183:
FIGURE 8.2 upper Egypt want no more
- Page 184 and 185:
growth. Fertility has declined in t
- Page 186 and 187:
Box 8.7 Changing policies and attit
- Page 188 and 189:
FIGURE 8.6 childbearing age have un
- Page 190 and 191:
able several types of condoms, pill
- Page 192 and 193:
housing schemes to parents with onl
- Page 194 and 195:
and training, data collection and a
- Page 196 and 197:
9 Ten years of experience Much that
- Page 198 and 199:
ecause few effective methods are of
- Page 200 and 201:
Population data supplement The six
- Page 202 and 203:
Table 4. Factors influencing fertil
- Page 204 and 205:
190 Births and total fertility =Ice
- Page 206 and 207:
Table 1. Population projections Rat
- Page 208 and 209:
Table 2. Population composition Low
- Page 210 and 211:
Table 3. Contraceptive use and unme
- Page 212 and 213:
Table 5. Status of women Number enr
- Page 214 and 215:
Table 6. Family planning policy _ _
- Page 216 and 217:
Bibliographical note This Report ha
- Page 218 and 219:
Background papers Note: Source refe
- Page 220 and 221:
-1984. "The Malthusian Case: Preind
- Page 222 and 223:
I I
- Page 224 and 225:
Table 10. Structure of merchandise
- Page 226 and 227:
Key In each table, economies are li
- Page 228 and 229:
same order is used in all tables. T
- Page 230 and 231:
Population I~~~~ - * S: ~ -- ' X -
- Page 232 and 233:
Table 1. Basic indicators GNP per c
- Page 234 and 235:
Table 2. Growthi of production Aver
- Page 236 and 237:
Table 3. Structure of production GD
- Page 238 and 239:
Table 4. Growth of consumption-and
- Page 240 and 241:
Tadble 5. Structure of demand Distr
- Page 242 and 243:
Table 6. Agriculture and food Value
- Page 244 and 245:
Table 7. Industr Distribution of ma
- Page 246 and 247:
Table 8. Commercial energy Energy c
- Page 248 and 249:
Table 9. Growthi of merchandise tra
- Page 250 and 251:
Table 10. Structure of merchandise
- Page 252 and 253:
Table 11. Structure of merchandise
- Page 254 and 255:
Table 12. Origin and destination of
- Page 256 and 257:
Table 13. Origin and destination of
- Page 258 and 259:
Table 14. Balance of payments and r
- Page 260 and 261:
Table 15. Flow of public and public
- Page 262 and 263:
Table 16. External public debt and
- Page 264 and 265:
Table 17. Terms of public borrowing
- Page 266 and 267:
Table 18. Official development assi
- Page 268 and 269:
Table 19. Population growth and pro
- Page 270 and 271:
Table 20. Demographic and fertility
- Page 272 and 273:
Table 21. Labor force Percentage of
- Page 274 and 275:
Table 22. Urbanization Urban popula
- Page 276 and 277:
Table 23. Indicators related to lif
- Page 278 and 279:
Table 24. Health-related indicators
- Page 280 and 281:
Table 25. Education Number Number e
- Page 282 and 283:
Table 26. Central goverrnment expen
- Page 284 and 285:
Table 27. Central government curren
- Page 286 and 287:
Table 28. In-come distribution Perc
- Page 288 and 289:
Technical notes This edition of the
- Page 290 and 291:
difficulties in assigning subsisten
- Page 292 and 293:
series in national currencies are a
- Page 294 and 295:
Public loans are external obligatio
- Page 296 and 297:
estimates, the total fertility rate
- Page 298 and 299:
expenditure and current revenue sho
- Page 300:
Bibliography of data sources Nation