- Page 1:
Public Disclosure Authorized Public
- Page 4 and 5:
Oxford University Press NEW YORK OX
- Page 6 and 7:
labor markets. And they have a vest
- Page 8 and 9:
8 The policy agenda 155 Population
- Page 10 and 11:
Boxes 1.1 The arithmetic of populat
- Page 12 and 13:
Glossary Demographic terms informat
- Page 14 and 15:
I I
- Page 16 and 17:
countries regain their momentum of
- Page 18 and 19:
4 Box 1.1 The arithmetic of populat
- Page 20 and 21:
example. Between 1955 and 1980 inco
- Page 22 and 23:
ment-all the more so if human skill
- Page 24 and 25:
etween 1 and 2 percent-moderate com
- Page 26 and 27:
FIGURE 2.1 directions-with a lag in
- Page 28 and 29:
14 Distribution of product among se
- Page 30 and 31:
TABLE 2.2 Rates of growth in the re
- Page 32 and 33:
export restraints and orderly marke
- Page 34 and 35:
Box 2.2 Comparisons between the 193
- Page 36 and 37:
TABLE 2.6 indebtedness is denominat
- Page 38 and 39:
TABLE 2.7 Change in export prices a
- Page 40 and 41:
Burundi, Guinea, Mali, Malawi, and
- Page 42 and 43:
TABLE 2.9 Exports from developing c
- Page 44 and 45:
of rapid and painful adjustment for
- Page 46 and 47:
In many countries internal adjustme
- Page 48 and 49:
3 Prospects for sustained growth Wi
- Page 50 and 51:
TABLE 3.2 Growth of GDP per capita,
- Page 52 and 53:
TABLE 3.4 Current account balance a
- Page 54 and 55:
over time. The main focus of indust
- Page 56 and 57:
TABLE 3.6 Growth of trade in develo
- Page 58 and 59:
Box 3.3 Delinking from the world ec
- Page 60 and 61:
nal surplus. The resulting rise in
- Page 62 and 63:
Because the public sector in low-in
- Page 64 and 65:
developing-country creditworthiness
- Page 66 and 67:
themselves and, by caring for young
- Page 68 and 69:
fertility in a changing world is a
- Page 70 and 71:
nize contraceptive services. As wil
- Page 72 and 73:
Economic transformation: Europe, Ja
- Page 74 and 75:
scious control of family size, prob
- Page 76 and 77:
Box 4.3 The European fertility tran
- Page 78 and 79:
FIGURE 4.2 Birth and death rates an
- Page 80 and 81:
Box 4.4 Alternative measures of fer
- Page 82 and 83:
largest city in 1950, will not even
- Page 84 and 85:
FIGURE 4.4 Fertility in relation to
- Page 86 and 87:
government goal is a nationwide rat
- Page 88 and 89:
North America's population in 2000
- Page 90 and 91:
IBox 4.6 Three views of population
- Page 92 and 93:
TABLE 4.6 Population size and densi
- Page 94 and 95:
Box 5.1 Consequences of population
- Page 96 and 97:
implied by a simple division of tot
- Page 98 and 99:
and on farms. But the evidence on e
- Page 100 and 101:
get in GDP. Alternatively, all or p
- Page 102 and 103:
youths, who are presumably able to
- Page 104 and 105:
saving because they come from the c
- Page 106 and 107:
acre increased from 15.4 million to
- Page 108 and 109:
food they need. Although the amount
- Page 110 and 111:
is so scarce, they can do so only o
- Page 112 and 113:
from rural to urban areas mainly re
- Page 114 and 115:
other developing countries suggests
- Page 116 and 117:
emigration by providing information
- Page 118 and 119:
Box 5.7 Coping with rapid fertility
- Page 120 and 121:
6 Slowing population growth Experie
- Page 122 and 123:
feTtility; nor is it easy to judge
- Page 124 and 125:
the education of mothers increases
- Page 126 and 127:
etter education and health services
- Page 128 and 129:
TABLE 6.1 Total fertility rates and
- Page 130 and 131:
effectiveness of existing laws, ins
- Page 132 and 133:
in the 1950s and 1960s, fertility w
- Page 134 and 135:
FIGURE 6.6 Fertility dedine within
- Page 136 and 137:
Box 6.3 Mleasuring the value of chi
- Page 138 and 139:
few births; to encourage spacing, T
- Page 140 and 141:
Box 6.4 A deferred incentive scheme
- Page 142 and 143:
Box"7.1 Family planning for health
- Page 144 and 145:
FIGURE 71 88 in Romania (1979). Res
- Page 146 and 147:
132 Box 7.2 Birth planning technolo
- Page 148 and 149:
TABLE 7.2 Percentage of married wom
- Page 150 and 151:
TABLE 7.3 Discontinuation of contra
- Page 152 and 153:
may be delaying a first pregnancy,
- Page 154 and 155:
family planning and maternal and ch
- Page 156 and 157:
clients may develop can be promptly
- Page 158 and 159:
Box 7.6 The impact of service quali
- Page 160 and 161:
medical examination was not always
- Page 162 and 163:
measuring social acceptability, or
- Page 164 and 165:
Box 7.7 Military versus social expe
- Page 166 and 167:
costs per user. Public cost per use
- Page 168 and 169:
sanguine, however, as soon as one t
- Page 170 and 171:
TABLE 8.1 Population policy indicat
- Page 172 and 173:
Box 8.2 China's census: counting a
- Page 174 and 175:
FAMILY PLANNING. In many countries-
- Page 176 and 177:
improving the availability of famil
- Page 178 and 179:
Box 8.4 Africa: how much land, how
- Page 180 and 181: Box 8.5 Infertility: a challenge to
- Page 182 and 183: FIGURE 8.2 upper Egypt want no more
- Page 184 and 185: growth. Fertility has declined in t
- Page 186 and 187: Box 8.7 Changing policies and attit
- Page 188 and 189: FIGURE 8.6 childbearing age have un
- Page 190 and 191: able several types of condoms, pill
- Page 192 and 193: housing schemes to parents with onl
- Page 194 and 195: and training, data collection and a
- Page 196 and 197: 9 Ten years of experience Much that
- Page 198 and 199: ecause few effective methods are of
- Page 200 and 201: Population data supplement The six
- Page 202 and 203: Table 4. Factors influencing fertil
- Page 204 and 205: 190 Births and total fertility =Ice
- Page 206 and 207: Table 1. Population projections Rat
- Page 208 and 209: Table 2. Population composition Low
- Page 210 and 211: Table 3. Contraceptive use and unme
- Page 212 and 213: Table 5. Status of women Number enr
- Page 214 and 215: Table 6. Family planning policy _ _
- Page 216 and 217: Bibliographical note This Report ha
- Page 218 and 219: Background papers Note: Source refe
- Page 220 and 221: -1984. "The Malthusian Case: Preind
- Page 222 and 223: I I
- Page 224 and 225: Table 10. Structure of merchandise
- Page 226 and 227: Key In each table, economies are li
- Page 228 and 229: same order is used in all tables. T
- Page 232 and 233: Table 1. Basic indicators GNP per c
- Page 234 and 235: Table 2. Growthi of production Aver
- Page 236 and 237: Table 3. Structure of production GD
- Page 238 and 239: Table 4. Growth of consumption-and
- Page 240 and 241: Tadble 5. Structure of demand Distr
- Page 242 and 243: Table 6. Agriculture and food Value
- Page 244 and 245: Table 7. Industr Distribution of ma
- Page 246 and 247: Table 8. Commercial energy Energy c
- Page 248 and 249: Table 9. Growthi of merchandise tra
- Page 250 and 251: Table 10. Structure of merchandise
- Page 252 and 253: Table 11. Structure of merchandise
- Page 254 and 255: Table 12. Origin and destination of
- Page 256 and 257: Table 13. Origin and destination of
- Page 258 and 259: Table 14. Balance of payments and r
- Page 260 and 261: Table 15. Flow of public and public
- Page 262 and 263: Table 16. External public debt and
- Page 264 and 265: Table 17. Terms of public borrowing
- Page 266 and 267: Table 18. Official development assi
- Page 268 and 269: Table 19. Population growth and pro
- Page 270 and 271: Table 20. Demographic and fertility
- Page 272 and 273: Table 21. Labor force Percentage of
- Page 274 and 275: Table 22. Urbanization Urban popula
- Page 276 and 277: Table 23. Indicators related to lif
- Page 278 and 279: Table 24. Health-related indicators
- Page 280 and 281:
Table 25. Education Number Number e
- Page 282 and 283:
Table 26. Central goverrnment expen
- Page 284 and 285:
Table 27. Central government curren
- Page 286 and 287:
Table 28. In-come distribution Perc
- Page 288 and 289:
Technical notes This edition of the
- Page 290 and 291:
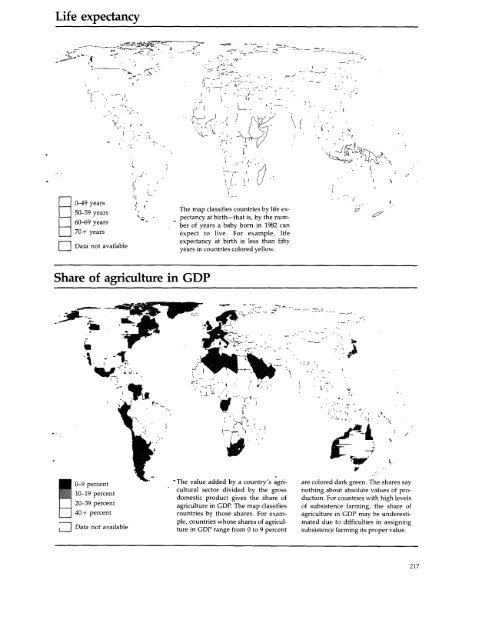
difficulties in assigning subsisten
- Page 292 and 293:
series in national currencies are a
- Page 294 and 295:
Public loans are external obligatio
- Page 296 and 297:
estimates, the total fertility rate
- Page 298 and 299:
expenditure and current revenue sho
- Page 300:
Bibliography of data sources Nation