Confined fluids and their role in pressure solution - Earth Science ...
Confined fluids and their role in pressure solution - Earth Science ...
Confined fluids and their role in pressure solution - Earth Science ...

Create successful ePaper yourself
Turn your PDF publications into a flip-book with our unique Google optimized e-Paper software.
<strong>Conf<strong>in</strong>ed</strong> <strong>fluids</strong> <strong>and</strong> <strong>their</strong> <strong>role</strong> <strong>in</strong> <strong>pressure</strong> <strong>solution</strong><br />
Aless<strong>and</strong>ro Anzalone a , James Boles c , George Greene b , Kev<strong>in</strong> Young a ,<br />
Jacob Israelachvili b , Norma Alcantar a,⁎<br />
a Department of Chemical Eng<strong>in</strong>eer<strong>in</strong>g, University of South Florida, Tampa, FL 33620, USA<br />
b Department of Chemical Eng<strong>in</strong>eer<strong>in</strong>g <strong>and</strong> Materials <strong>Science</strong> Department, University of California, Santa Barbara, CA 93105, USA<br />
c Department of Geology, University of California, Santa Barbara, CA 93105, USA<br />
Abstract<br />
Chemical Geology 230 (2006) 220–231<br />
Accepted 2 February 2006<br />
www.elsevier.com/locate/chemgeo<br />
The process of <strong>pressure</strong> <strong>solution</strong> is def<strong>in</strong>ed as the dis<strong>solution</strong> of materials under high stress at gra<strong>in</strong>-to-gra<strong>in</strong> contacts <strong>and</strong><br />
precipitation at <strong>in</strong>terfaces under low stress. The k<strong>in</strong>etics of this process are still poorly understood ma<strong>in</strong>ly because of the large<br />
timescales <strong>in</strong>volved. In this research, the Surface Forces Apparatus (SFA) technique was coupled with an optical <strong>in</strong>terference<br />
technique for <strong>in</strong> situ visualization of the nanoscale deformations <strong>and</strong> thickness changes. The SFA was used to measure the forces<br />
(or <strong>pressure</strong>s) <strong>and</strong> distances between two solid surfaces pressed together with a th<strong>in</strong> film between them. Us<strong>in</strong>g the SFA, comb<strong>in</strong>ed<br />
with geological observations, we are study<strong>in</strong>g the short-range colloidal forces between surfaces of mica <strong>and</strong> silica at the nanoscale<br />
such as van der Waals, electrostatic, <strong>and</strong> hydration forces.<br />
This study <strong>in</strong>volves two cases, the symmetric case of mica <strong>in</strong> contact with mica <strong>and</strong> the asymmetric case of a quartz surface <strong>in</strong><br />
contact with mica. Our results reveal highly subtle effects depend<strong>in</strong>g on the nature <strong>and</strong> concentration of the counterions present <strong>in</strong><br />
the <strong>solution</strong> either of Na + ,Ca 2+ , or mixtures of these ions, as well as on the pH. For the symmetric case, the equilibrium<br />
<strong>in</strong>teractions of force F or <strong>pressure</strong> P versus fluid film thickness T have been measured between the mica surfaces across aqueous<br />
films <strong>in</strong> the thickness range from T=25Å down to contact separations around T=0Å, <strong>and</strong> depend on the <strong>solution</strong> conditions <strong>and</strong><br />
applied lithostatic <strong>pressure</strong>. Measurements have also been made of the rates of diffusion of ions through such ultra-th<strong>in</strong> films <strong>and</strong><br />
on the precipitation <strong>and</strong> growth of ionic crystallite layers on the surfaces. Our results show that the diffusion coefficient of hydrated<br />
sodium is two orders of magnitude lower than the diffusion of water <strong>in</strong>to mica–mica cleavage <strong>and</strong> a factor of 40 lower than the<br />
coefficient of sodium ions <strong>in</strong> bulk water.<br />
For the asymmetric case, the dis<strong>solution</strong> of the quartz surface was observed to be dependent on the <strong>in</strong>terfacial fluid composition<br />
<strong>and</strong> pH, the externally applied ‘lithostatic’ <strong>pressure</strong>, <strong>and</strong> the type of crystall<strong>in</strong>e structure exposed to the mica surface. Our<br />
experiments also show that there is an <strong>in</strong>itial stage after fresh <strong>solution</strong> is added <strong>in</strong> which the spac<strong>in</strong>g between the surfaces <strong>in</strong>creases,<br />
however, the thickness started decreas<strong>in</strong>g steadily after approximately 4h of exposure <strong>in</strong>dependently of the crystall<strong>in</strong>ity of the<br />
quartz surface. For a particular set of conditions, the process eventually slows down <strong>and</strong> reaches equilibrium after some time, but a<br />
further <strong>in</strong>crease <strong>in</strong> <strong>pressure</strong> restarts the dis<strong>solution</strong> process. This is also true for the addition of fresh <strong>in</strong>terfacial <strong>solution</strong> dur<strong>in</strong>g the<br />
experiment after a period of thickness fluctuation. These results are consistent with the observation that <strong>pressure</strong> <strong>solution</strong> of quartz<br />
is greatly enhanced with the presence of mica.<br />
© 2006 Elsevier B.V. All rights reserved.<br />
⁎ Correspond<strong>in</strong>g author. Tel.: +1 813 974 8009; fax: +1 813 974 3651.<br />
E-mail address: alcantar@eng.usf.edu (N. Alcantar).<br />
0009-2541/$ - see front matter © 2006 Elsevier B.V. All rights reserved.<br />
doi:10.1016/j.chemgeo.2006.02.027
1. Introduction<br />
1.1. Pressure <strong>solution</strong><br />
Fluids conf<strong>in</strong>ed between m<strong>in</strong>eral <strong>in</strong>terfaces are<br />
ubiquitous <strong>in</strong> the natural world <strong>and</strong> are of great <strong>in</strong>terest<br />
for <strong>their</strong> geological <strong>in</strong>fluence <strong>and</strong> fundamental physicochemical<br />
properties at the submicroscopic <strong>and</strong> molecular<br />
levels. Those events are not well understood even though<br />
there is a considerable amount of data on <strong>in</strong>terfacial<br />
phenomena at m<strong>in</strong>eral surfaces <strong>in</strong> free <strong>solution</strong> (Pashley,<br />
1982; Kekicheff et al., 1993; Hochella, 1995). Fluids<br />
under conf<strong>in</strong>ement play a very important <strong>role</strong> <strong>in</strong> <strong>pressure</strong><br />
<strong>solution</strong> where processes such as the dis<strong>solution</strong> at<br />
stressed surfaces, diffusive transport of dissolved matter,<br />
<strong>and</strong> precipitation at less stressed surfaces are the result of<br />
<strong>pressure</strong> <strong>solution</strong> <strong>in</strong>terfacial mechanisms. Also, the<br />
<strong>in</strong>terpenetration of rocks, the dis<strong>solution</strong> of quartz <strong>in</strong><br />
contact with mica, <strong>and</strong> on a larger scale, the development<br />
of stylolites results from the preferential dis<strong>solution</strong> of<br />
m<strong>in</strong>erals along stressed gra<strong>in</strong> boundaries (Heald, 1955;<br />
Tada et al., 1987; Bjørkum, 1996).<br />
The broad explanation is that a th<strong>in</strong> film of water<br />
conf<strong>in</strong>ed between clay <strong>and</strong> crystal surfaces triggers what<br />
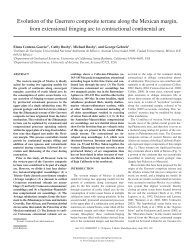
is recognized as <strong>pressure</strong> <strong>solution</strong> phenomena. Three<br />
accepted models have been developed to expla<strong>in</strong> <strong>their</strong><br />
mechanisms (den Brok, 1998; Renard et al., 1999)(Fig.<br />
1). Briefly, the Water Film Diffusion (WFD) model<br />
describes an absorbed water film layer where m<strong>in</strong>eral<br />
dis<strong>solution</strong> at the gra<strong>in</strong>–gra<strong>in</strong> contact area results <strong>in</strong> the<br />
precipitation of m<strong>in</strong>erals on the adjacent free gra<strong>in</strong><br />
surface (pore). Dis<strong>solution</strong> at the contact is stress<br />
enhanced ow<strong>in</strong>g to a difference of normal stress between<br />
the gra<strong>in</strong> <strong>in</strong>tersection <strong>and</strong> the pore. The second model<br />
relates to the Free Face Pressure Solution (FFPS) where<br />
dis<strong>solution</strong> starts at the edge of the contacts <strong>and</strong> creeps to<br />
the core by develop<strong>in</strong>g an attenuated brittle or plastic<br />
deformation with<strong>in</strong> the m<strong>in</strong>eral contacts. Thus, dis<strong>solution</strong><br />
at the contact is stra<strong>in</strong> enhanced. The third model<br />
assumes that the m<strong>in</strong>eral contact conta<strong>in</strong>s channel <strong>and</strong><br />
isl<strong>and</strong> structures rang<strong>in</strong>g from the nanometer to the<br />
micron-scale that <strong>in</strong>duce plastic or brittle deformations.<br />
All of these models assume that if the water film<br />
becomes very th<strong>in</strong> its structur<strong>in</strong>g will limit diffusion<br />
rates.<br />
One important characteristic <strong>in</strong> the models of<br />
<strong>pressure</strong> <strong>solution</strong> is the nature of the th<strong>in</strong> water film<br />
that is assumed to facilitate chemical reactions, be a<br />
transport medium, <strong>and</strong> have a stress dependent thickness.<br />
Additionally, the water film must be present so that<br />
large gradients can exist between the gra<strong>in</strong>-contact<br />
stresses <strong>and</strong> the fluid <strong>pressure</strong> <strong>in</strong> the pore. Thus, the<br />
A. Anzalone et al. / Chemical Geology 230 (2006) 220–231<br />
Fig. 1. Proposed models of <strong>pressure</strong> <strong>solution</strong> after (den Brok, 1998;<br />
Renard et al., 1999). Vertical arrows refer to normal <strong>pressure</strong>s or crack<br />
propagation directions. Horizontal arrows refer to material transport.<br />
diffusion coefficient of solutes along this film is<br />
expected to be higher than the coefficient of diffusion<br />
<strong>in</strong> solids (Renard <strong>and</strong> Ortoleva, 1997).<br />
The objective of this paper is to elucidate the <strong>role</strong> of<br />
clays like mica <strong>in</strong> the <strong>pressure</strong> <strong>solution</strong> of quartz. Some<br />
authors attribute the effect of quartz dis<strong>solution</strong> to<br />
thicker water films associated with mica–quartz contacts<br />
(Weyl, 1959; Rutter, 1983; Kruzhanov <strong>and</strong> Stöckhert,<br />
1998). However, clays such as kaol<strong>in</strong>ite <strong>and</strong><br />
chlorite do not seem to promote quartz dis<strong>solution</strong>,<br />
which appears <strong>in</strong>consistent with the idea of the<br />
importance of an enhanced water film. We have <strong>in</strong>itially<br />
characterized the mica–fluid–mica <strong>in</strong>terface <strong>in</strong> close<br />
contact (Alcantar et al., 2003). A summary of this work<br />
will be presented later <strong>in</strong> the paper <strong>and</strong> used to expla<strong>in</strong><br />
how fluid composition plays an important <strong>role</strong> <strong>in</strong> the<br />
behavior of dissimilar m<strong>in</strong>erals. In addition, the effect of<br />
conf<strong>in</strong>ed <strong>fluids</strong> <strong>and</strong> <strong>their</strong> composition <strong>in</strong> the mica–<br />
quartz system will be used to describe the effects of<br />
lithostatic <strong>pressure</strong> <strong>and</strong> surface structur<strong>in</strong>g on the crystal<br />
dis<strong>solution</strong> rates.<br />
1.2. The Surface Forces Apparatus technique<br />
221<br />
We have used the Surface Forces Apparatus (SFA) to<br />
determ<strong>in</strong>e the range of hydration (water structure-
222 A. Anzalone et al. / Chemical Geology 230 (2006) 220–231<br />
dependent) forces, the thickness of th<strong>in</strong> aqueous films,<br />
surface stra<strong>in</strong>, <strong>and</strong> the diffusion <strong>and</strong> dis<strong>solution</strong> rates<br />
between surfaces of mica <strong>and</strong> quartz while mimick<strong>in</strong>g<br />
geological conditions. The SFA can measure <strong>in</strong>termolecular<br />
forces <strong>in</strong>clud<strong>in</strong>g van der Waals, electrostatic,<br />
hydration (water structure-dependent), <strong>and</strong> steric (f<strong>in</strong>ite<br />
ion size-dependent) <strong>in</strong>teractions, which depend both on<br />
the nature of the surfaces (e.g., <strong>their</strong> chemistry, ionexchange<br />
capacity <strong>and</strong> whether amorphous or crystall<strong>in</strong>e)<br />
<strong>and</strong> the type of <strong>solution</strong> (e.g., concentration of salt<br />
present <strong>and</strong> pH).<br />
The Surface Forces Apparatus technique (Israelachvili<br />
<strong>and</strong> Adams, 1978) is conceptually similar to atomic force<br />
microscopy (AFM) or any other mechanical forcemeasur<strong>in</strong>g<br />
technique that employs a cantilever spr<strong>in</strong>g to<br />
measure forces <strong>and</strong> a series of spr<strong>in</strong>gs <strong>and</strong> piezoelectric<br />
crystals to control surface separations. What separates the<br />
SFA from AFM <strong>and</strong> similar techniques is that the distance<br />
between surfaces is determ<strong>in</strong>ed by an optical technique<br />
<strong>in</strong>dependent of the force measur<strong>in</strong>g mechanisms. This<br />
optical technique, Multiple Beam Interferometry (MBI) is<br />
based upon the <strong>in</strong>terferometer formed by two opposite<br />
silver mirrors <strong>in</strong> the backside of the surfaces <strong>in</strong> study<br />
(Israelachvili, 1973). MBI fr<strong>in</strong>ges, known as Fr<strong>in</strong>ges of<br />
Equal Chromatic Order (FECO), are used to accurately<br />
<strong>and</strong> unambiguously measure the absolute surface separation<br />
D to 1Å re<strong>solution</strong> as well as the mean refractive<br />
<strong>in</strong>dex n of the liquid or solid film (of thickness D)between<br />
the surfaces (Israelachvili, 1973). These <strong>in</strong>terference<br />
fr<strong>in</strong>ges are the same as observed <strong>in</strong> a quartz wedge <strong>in</strong> a<br />
petrographic microscope (Alcantar et al., 2003). By<br />
record<strong>in</strong>g the chang<strong>in</strong>g FECO fr<strong>in</strong>ge pattern with time<br />
us<strong>in</strong>g a video camera record<strong>in</strong>g system any changes <strong>in</strong><br />
these parameters can be visualized <strong>and</strong> monitored at the<br />
angstrom-level (10 −10 m), thus provid<strong>in</strong>g direct <strong>in</strong>formation<br />
of the force F or <strong>pressure</strong> P between two curved or flat<br />
surfaces, film thicknesses, optical activity, <strong>and</strong> surface<br />
morphology (Heuberger et al., 1997). As a consequence,<br />
ionic diffusion rates <strong>and</strong> changes <strong>in</strong> local stresses over<br />
f<strong>in</strong>ite periods of time can also be determ<strong>in</strong>ed. For <strong>in</strong>stance,<br />
if we record with the SFA a decrease <strong>in</strong> the thickness of<br />
15nm <strong>in</strong> one of the surfaces studied over a period of 4h<br />
this translates to measure a rate of diffusion of products<br />
from the surface dis<strong>solution</strong> process of the order of<br />
10 −12 m/s. This is very <strong>in</strong>terest<strong>in</strong>g because it means that<br />
geological phenomena that vary <strong>in</strong> ranges of 25mm <strong>in</strong><br />
800years (25mm/800years=10 −12 m/s) can be monitored<br />
<strong>in</strong> the laboratory with the SFA technique dur<strong>in</strong>g the<br />
course of an experiment. Consequently, the <strong>role</strong> of th<strong>in</strong><br />
conf<strong>in</strong>ed films <strong>in</strong> the deformation of rocks <strong>in</strong> the earth's<br />
crust by <strong>pressure</strong> <strong>solution</strong> can be accurately reproduced <strong>in</strong><br />
the laboratory with the expectation of underst<strong>and</strong><strong>in</strong>g how<br />
the m<strong>in</strong>eral crystals, <strong>and</strong> <strong>their</strong> <strong>in</strong>teractions, are responsible<br />
for the visible viscous creep of the rocks (Fig. 2).<br />
1.3. The <strong>role</strong> of molecular diffusion<br />
The development <strong>and</strong> underst<strong>and</strong><strong>in</strong>g of molecular<br />
diffusion <strong>in</strong> conf<strong>in</strong>ed <strong>fluids</strong> between m<strong>in</strong>eral surfaces<br />
can be described by the th<strong>in</strong> water film <strong>and</strong> its effects as<br />
a semi permeable membrane, as a charge carrier, or as a<br />
corrosion vehicle at the <strong>in</strong>terface. The properties of this<br />
film <strong>in</strong>clude the fact that the ionic concentration under<br />
conf<strong>in</strong>ement may be higher than the fluid concentration<br />
<strong>in</strong> the bulk <strong>and</strong> charged species (such as Na + ,Ca 2+ ,or<br />
Cl − ) create an osmotic <strong>pressure</strong> effect <strong>in</strong> the film that<br />
counteracts the contact stress. Therefore, molecular<br />
diffusion depends on the electric surface charge <strong>and</strong> the<br />
stability of the film structure that is caused by an<br />
osmotic force (Renard <strong>and</strong> Ortoleva, 1997).<br />
The two forces that depend on the surface charge<br />
density or electric potential of the surfaces <strong>and</strong> on the<br />
bulk dielectric properties of the media are the repulsive<br />
electrostatic “double-layer” force (based on the Poisson-<br />
Boltzmann equation) <strong>and</strong> the attractive van der Waals<br />
force (based on the Lifshitz theory). The so-called<br />
Derjagu<strong>in</strong>-L<strong>and</strong>au-Verwey-Overbeek (DLVO) theory of<br />
colloidal stability (Verwey <strong>and</strong> Overbeek, 1948)<br />
describes long-ranged colloidal forces <strong>and</strong> is a nonspecific,<br />
‘cont<strong>in</strong>uum’ theory that overlooks the discrete<br />
molecular nature of the surfaces or solvent at separations<br />
greater than 20–50Å <strong>and</strong>/or <strong>in</strong> dilute electrolyte<br />
<strong>solution</strong>s (Israelachvili, 1991). Conversely, at smaller<br />
surface separations, the DLVO theory breaks down.<br />
Non-DLVO forces appear to depend on the specific<br />
nature of the surfaces (chemically <strong>and</strong> physically) <strong>and</strong><br />
the <strong>solution</strong> conditions (type <strong>and</strong> concentration of<br />
electrolyte, pH, <strong>and</strong> temperature). These forces have<br />
been extensively reviewed for clay <strong>and</strong> m<strong>in</strong>eral systems<br />
<strong>in</strong> Pashley (1981), Pashley <strong>and</strong> Israelachvili (1984) <strong>and</strong><br />
Israelachvili (1991).<br />
A deeper underst<strong>and</strong><strong>in</strong>g of <strong>pressure</strong> <strong>solution</strong> mechanisms<br />
<strong>and</strong> m<strong>in</strong>eral surface <strong>in</strong>teractions requires knowledge<br />
of “steric-hydration” from previous experiments<br />
(Alcantar et al., 2003). That is the conf<strong>in</strong>ement of water<br />
molecules to surfaces produces an additional repulsion<br />
<strong>in</strong> both monovalent <strong>and</strong> divalent electrolyte <strong>solution</strong>s<br />
<strong>and</strong> <strong>in</strong>creases the apparent strength of the repulsive<br />
electrostatic force from the protrud<strong>in</strong>g charged groups<br />
that occur on amorphous silica surfaces (van Olphen,<br />
1977; Pashley, 1981; Christenson et al., 1982; Viani et<br />
al., 1983; Pashley <strong>and</strong> Israelachvili, 1984; Kjell<strong>and</strong>er et<br />
al., 1988). Other non-DLVO forces that produce<br />
additional short-range attractive <strong>in</strong>teractions (Frens
<strong>and</strong> Overbeck, 1972; Pashley, 1982; Vigil, Xu et al.,<br />
1994) are known as ion-bridg<strong>in</strong>g effects <strong>and</strong> result from<br />
polarizable counterions but are not <strong>in</strong>cluded <strong>in</strong> the<br />
Lifshitz theory of van der Waals forces (van Olphen,<br />
1977; Viani et al., 1983; Guldbr<strong>and</strong> et al., 1984; Pashley<br />
<strong>and</strong> Israelachvili, 1984; Kjell<strong>and</strong>er et al., 1988; Kjell<strong>and</strong>er<br />
et al., 1990; Kekicheff et al., 1993; Leckb<strong>and</strong> <strong>and</strong><br />
Israelachvili, 2001).<br />
Very little systematic or detailed work has been done<br />
to measure diffusion mechanisms between dissimilar<br />
surfaces, either experimentally or theoretically, because<br />
it is necessary to determ<strong>in</strong>e <strong>and</strong> monitor the characteristics<br />
of the <strong>in</strong>teract<strong>in</strong>g surfaces such as <strong>their</strong> roughness,<br />
local geometry, <strong>and</strong> force–distance profiles with an<br />
accuracy of about 1Å. This is precisely the sort of<br />
<strong>in</strong>formation that can be obta<strong>in</strong>ed with the SFA technique.<br />
2. Experiments<br />
2.1. Surfaces <strong>and</strong> <strong>solution</strong>s<br />
S<strong>in</strong>ce the scope of this paper is to describe the effects<br />
of conf<strong>in</strong>ed <strong>fluids</strong> <strong>in</strong> <strong>pressure</strong> <strong>solution</strong> special care has<br />
A. Anzalone et al. / Chemical Geology 230 (2006) 220–231<br />
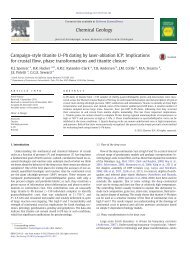
Fig. 2. Schematic representation of Surface Forces Apparatus (SFA) show<strong>in</strong>g the diagrams of the <strong>in</strong>terferometers produced for these experiments. The<br />
SFA technique is used to measure the force F as a function of the surface separation D (the distance of closest approach <strong>in</strong> the case of two curved<br />
surfaces). In the present study, more highly curved surfaces (lower R values) were often used to obta<strong>in</strong> lower flattened areas A <strong>and</strong>, therefore, higher<br />
<strong>pressure</strong>s P=F/A under a given force or load, F.<br />
223<br />
been taken to mimic geological studies at the molecular<br />
contact between mica–fluid–mica <strong>and</strong> mica–fluid–<br />
quartz systems. We will present the force vs. distance<br />
(or <strong>pressure</strong>–distance) profiles at several <strong>pressure</strong>s<br />
show<strong>in</strong>g short-distance regimes under geological pore<br />
water conditions. In the case of the mica–fluid–mica<br />
system, <strong>solution</strong>s of NaCl <strong>and</strong> CaCl2 <strong>in</strong> the range 6–<br />
600mM NaCl <strong>and</strong> 6–30mM CaCl2 were used as both<br />
pure <strong>and</strong> mixed electrolyte <strong>solution</strong>s. The pH was<br />
typically between 6 <strong>and</strong> 7 but a few measurements were<br />
also done at much lower <strong>and</strong> much higher pH. The water<br />
was sometimes purged with nitrogen gas to remove<br />
dissolved CO 2 (Alcantar et al., 2003). With the mica–<br />
fluid–quartz system, 30mM <strong>solution</strong>s of CaCl 2 were<br />
used at neutral pH or acidulated with nitric acid to pH<br />
3.8. Control <strong>solution</strong>s of HNO3 alone at pH 3.8 were<br />
used as a comparison. Applied <strong>pressure</strong>s P ranged from<br />
2 to 50MPa (20–500atm). These <strong>solution</strong> conditions<br />
were chosen because they showed the most pronounced<br />
adhesion <strong>and</strong> fastest ion diffusion rate between mica–<br />
mica surfaces compared with previous observations.<br />
Measurements for both systems were conducted at<br />
21°C.
224 A. Anzalone et al. / Chemical Geology 230 (2006) 220–231<br />
Freshly cleaved muscovite mica sheets of thickness<br />
2–3μm (ideal formula: KAl 2[Al,SiO 3]–O 10[OH] 2) were<br />
used as previously described (Israelachvili <strong>and</strong> Adams,<br />
1978). One of these mica sheets was placed <strong>in</strong> contact<br />
with th<strong>in</strong> quartz <strong>in</strong> the SFA. Quartz sheets (MTI Corp.)<br />
were obta<strong>in</strong>ed by polish<strong>in</strong>g one side of a thicker piece of<br />
quartz to a certa<strong>in</strong> thickness as described later <strong>in</strong> the<br />
procedure section. The sheets were glued to cyl<strong>in</strong>drically<br />
curved silica disks, each of radius R, <strong>and</strong> mounted<br />
<strong>in</strong> the SFA <strong>in</strong> a “crossed cyl<strong>in</strong>der” configuration which<br />
is equivalent to a sphere of radius R approach<strong>in</strong>g a flat,<br />
planar surface.<br />
2.2. Experimental procedure<br />
Sets of experiments were performed, each of them<br />
us<strong>in</strong>g mica aga<strong>in</strong>st mica or mica aga<strong>in</strong>st quartz surfaces<br />
depend<strong>in</strong>g on the experiment, <strong>in</strong> an SFA model Mark III<br />
<strong>and</strong> monitored us<strong>in</strong>g a Silicon Intensified Target (SIT)<br />
camera. The video images were recorded on Super VHS<br />
<strong>and</strong> digitized <strong>in</strong> order to perform the measurements<br />
required for the calculations. Once a digital image was<br />
available the surface position was determ<strong>in</strong>ed from the<br />
FECO fr<strong>in</strong>ges by measur<strong>in</strong>g the pixel position <strong>and</strong><br />
calculat<strong>in</strong>g the wavelength of each fr<strong>in</strong>ge of <strong>in</strong>terest<br />
us<strong>in</strong>g as reference the green <strong>and</strong> yellow l<strong>in</strong>es of a<br />
mercury lamp. Usually the lower disk held the mica<br />
surface <strong>and</strong> the upper disk held either mica or th<strong>in</strong><br />
centered-glued flat sheets of quartz.<br />
The quartz surface was prepared by reduc<strong>in</strong>g one of<br />
the optically polished sides of a thicker piece of silica<br />
(orig<strong>in</strong>ally 100μm thick) with a Hyprez flat lapp<strong>in</strong>g<br />
mach<strong>in</strong>e start<strong>in</strong>g with polish<strong>in</strong>g pads (used <strong>in</strong> decreas<strong>in</strong>g<br />
order from 15μm to1μm gra<strong>in</strong> size) <strong>and</strong> f<strong>in</strong>ish<strong>in</strong>g with<br />
a soft-cloth surface <strong>and</strong> diamond slurries (0.2μm Ra <strong>and</strong><br />
0.5μm Ra surface f<strong>in</strong>ish<strong>in</strong>g). Special care was taken <strong>in</strong><br />
controll<strong>in</strong>g the horizontal orientation of the quartz<br />
crystal normal to the polish<strong>in</strong>g surface. However,<br />
some samples showed a slight variation <strong>in</strong> the thickness<br />
that was corroborated by environmental SEM. Nonetheless,<br />
the SFA technique allows one to measure such<br />
variation <strong>in</strong> the contact position <strong>and</strong> to account for it <strong>in</strong><br />
the determ<strong>in</strong>ation of the separation distance.<br />
The surfaces were glued on transparent mount<strong>in</strong>g<br />
disks with cyl<strong>in</strong>drical curvature of ca. 1.5cm radii. The<br />
<strong>in</strong>itial contact position was obta<strong>in</strong>ed under dry conditions<br />
<strong>and</strong> verified by Newton r<strong>in</strong>gs on the contact area<br />
between mica–mica sheets <strong>and</strong> between mica <strong>and</strong> the<br />
center of the quartz sheet. The mica surfaces were<br />
freshly cleaved, wire cut, <strong>and</strong> back silvered. They<br />
showed a smooth adhesive contact. The quartz side <strong>in</strong><br />
contact with the mica surface was the side optically<br />
polished from the manufactur<strong>in</strong>g company. The other<br />
side was coated with the reflect<strong>in</strong>g silver layer to form<br />
the <strong>in</strong>terferometer. The mica thickness for our experiments<br />
varied from 3 to 4μm. We used two sources for<br />
the silica surfaces; pieces of quartz from a Z-cut 1 crystal<br />
<strong>and</strong> fused silica sheets polished down from 100 to 8 <strong>and</strong><br />
17μm, respectively.<br />
After mount<strong>in</strong>g the surfaces <strong>in</strong>to the SFA chamber, it<br />
was purged with clean, dry nitrogen gas <strong>and</strong> then filled<br />
with distilled water. The surfaces were then brought <strong>in</strong>to<br />
contact with one another. After establish<strong>in</strong>g that the<br />
contact was adhesive <strong>and</strong> perfectly flat across the whole<br />
contact circle (no particles <strong>in</strong> the contact zone), the zero<br />
of distance, D=0 for the system, was recorded from the<br />
positions (wavelengths) of the straight FECO fr<strong>in</strong>ges<br />
(Israelachvili, 1973). The surfaces were then separated<br />
<strong>and</strong> the electrolyte <strong>and</strong> pH were then changed <strong>in</strong><br />
succession, each time measur<strong>in</strong>g the colloidal forces<br />
between the surfaces on approach <strong>and</strong> separation, <strong>their</strong><br />
adhesion, <strong>and</strong> accompany<strong>in</strong>g surface deformations. In<br />
some cases, the <strong>solution</strong> <strong>in</strong> the chamber was changed<br />
while the surfaces were kept pressed together under a<br />
large force. By monitor<strong>in</strong>g the way the film thickness<br />
<strong>and</strong> contact area changed with time, it was possible to<br />
follow the rate of ion diffusion <strong>in</strong>to or out of the gap as<br />
well as establish the chang<strong>in</strong>g stresses around the<br />
contact junction from the chang<strong>in</strong>g shapes of the<br />
surfaces. In other measurements, two surfaces were<br />
allowed to rema<strong>in</strong> close together for a long time (hours)<br />
to see whether surface dis<strong>solution</strong> or crystal growth<br />
occurred around the contact region.<br />
The contact areas were usually large <strong>in</strong> the quartz<br />
experiments <strong>and</strong> had an elliptical shape (contact<br />
diameter 250–350μm) due to the flat nature of the<br />
quartz layer. No other contact position or adhesion<br />
between the two layers was observed.<br />
2.3. Calculation of force, diffusion measurements, <strong>and</strong><br />
thickness<br />
In a typical “force-run,” the force F is measured as a<br />
function of surface separation D between two cyl<strong>in</strong>drically<br />
curved surfaces of radius R. When the forces are<br />
weak (usually colloidal DLVO-type forces at longrange),<br />
one generally plots the results as F/R versus D.<br />
This enables comparison with other measurements us<strong>in</strong>g<br />
surfaces of different radii s<strong>in</strong>ce all colloidal forces are<br />
theoretically expected to scale l<strong>in</strong>early with <strong>their</strong> radius<br />
R (Israelachvili, 1991). In addition, one may plot<br />
1 Z cut refers to a quartz sheet with the major surface of the sheet<br />
perpendicular to the Z crystallographic axis.
<strong>pressure</strong> versus separation distance by us<strong>in</strong>g the wellestablished<br />
‘Derjagu<strong>in</strong> Approximation’ (Israelachvili,<br />
1991), which relates the forces between curved <strong>and</strong> flat<br />
surfaces accord<strong>in</strong>g to<br />
FðDÞ=R ¼ 2pEðDÞ for DbR ð1Þ<br />
where F(D) is the force–distance function between the<br />
two curved surfaces of radius R <strong>and</strong> where E(D) is the<br />
correspond<strong>in</strong>g energy–distance function between two<br />
flat (plane parallel) surfaces per unit area. The <strong>pressure</strong><br />
at D is then obta<strong>in</strong>ed by differentiat<strong>in</strong>g E(D) with respect<br />
to D:<br />
PðDÞ ¼dEðDÞ=dD ¼ dðF=2pRÞ=dD: ð2Þ<br />
Significant flatten<strong>in</strong>g of the surfaces occurs at<br />
<strong>pressure</strong>s above 10atm over an (directly measurable)<br />
area A or separations below ∼20Å. In this case, one can<br />
plot P=F(D)/A versus D, which gives the <strong>pressure</strong> as a<br />
function of water film thickness D.<br />
Eq. (1) was also used to determ<strong>in</strong>e the adhesion<br />
energy E0 per unit area from the measured adhesion or<br />
“pull-off” force Fad needed to detach the surfaces from<br />
adhesive contact (from or close to D=0):<br />
E0 ¼ Fad=2pR: ð3Þ<br />
The diffusion equation<br />
hxi 2 ¼ Dt ð4Þ<br />
was used to estimate the diffusion coefficient D of ions<br />
diffus<strong>in</strong>g a distance x through the th<strong>in</strong> water films over a<br />
time t. These parameters were measured by record<strong>in</strong>g<br />
the change <strong>in</strong> the FECO fr<strong>in</strong>ge patterns position with<br />
time.<br />
F<strong>in</strong>ally, the thickness of the quartz layer was<br />
calculated us<strong>in</strong>g contact <strong>in</strong>formation, the thickness of<br />
the mica layer, <strong>and</strong> the follow<strong>in</strong>g equation (Israelachvili,<br />
1973).<br />
4ðl 1Y þ l 3TÞ ¼nk: ð5Þ<br />
2.4. Surface morphology <strong>and</strong> chemical characterization<br />
techniques<br />
Environmental Scann<strong>in</strong>g Electron Microscopy (E-<br />
SEM) was used to characterize the quartz <strong>and</strong> mica<br />
surfaces before <strong>and</strong> after the experiments. An FEI Co.<br />
XL30 ESEM with a field emission gun (FEG) was used.<br />
The E-SEM was used because it prevents charg<strong>in</strong>g<br />
problems common <strong>in</strong> mica <strong>and</strong> quartz samples when<br />
us<strong>in</strong>g a normal SEM due to <strong>their</strong> low electrical<br />
conductivity. It was used <strong>in</strong> the wet mode, i.e. moderate<br />
A. Anzalone et al. / Chemical Geology 230 (2006) 220–231<br />
vacuum, where the sample chamber was flooded with<br />
water vapor, <strong>and</strong> the condensation on the specimen<br />
surface was managed via a temperature-controlled<br />
Peltier stage. The water vapor neutralizes any charge<br />
that builds up on the sample surfaces <strong>and</strong> as a result, it<br />
was not necessary to coat the surfaces with a conduct<strong>in</strong>g<br />
material. Thus, samples were imaged <strong>in</strong> <strong>their</strong> native<br />
state.<br />
A Philips X'PERT X-ray Diffractometer (XRD) was<br />
used primarily for determ<strong>in</strong><strong>in</strong>g crystal diffraction of the<br />
quartz surfaces. The X-ray beam is at 1.5405Å<br />
wavelength with two <strong>in</strong>cident beam optics. The<br />
<strong>in</strong>strument has a panalytical X'celerator detector for<br />
high-speed XRD measurements.<br />
Both X-ray Photoelectron Spectroscopy (XPS) <strong>and</strong><br />
Secondary Ion Mass Spectroscopy (SIMS) (Gardella,<br />
1995; Sherwood, 1995) were used to identify the<br />
composition of species present on the mica <strong>and</strong> quartz<br />
surfaces. For <strong>in</strong>stance, <strong>in</strong> our previous work we<br />
primarily identified the formation of crystals <strong>in</strong> mica–<br />
mica contacts. SIMS was used to corroborate the<br />
f<strong>in</strong>d<strong>in</strong>gs obta<strong>in</strong>ed with XPS <strong>and</strong> confirmed the existence<br />
of Ca on the surfaces <strong>and</strong> <strong>in</strong> the nucleated crystals<br />
(Alcantar et al., 2003).<br />
3. Results <strong>and</strong> analysis<br />
We describe the results of experiments on mica <strong>and</strong><br />
quartz aimed at identify<strong>in</strong>g <strong>and</strong> quantify<strong>in</strong>g some of the<br />
outst<strong>and</strong><strong>in</strong>g issues that relate dissimilar m<strong>in</strong>eral surface<br />
<strong>in</strong>teractions at the molecular level to <strong>pressure</strong> <strong>solution</strong>.<br />
Earlier studies focused ma<strong>in</strong>ly on the long-range DLVO<br />
<strong>in</strong>teractions between symmetric mica surfaces <strong>in</strong> pure<br />
(s<strong>in</strong>gle-component) electrolyte <strong>solution</strong>s (Israelachvili<br />
<strong>and</strong> Adams, 1978; Pashley, 1981; Pashley <strong>and</strong> Israelachvili,<br />
1984; Christenson et al., 1987; Kjell<strong>and</strong>er et al.,<br />
1988). Here, we will show the effects of the repulsive<br />
<strong>and</strong> attractive forces on the stresses <strong>and</strong> deformations<br />
they <strong>in</strong>duce on the m<strong>in</strong>eral surfaces, the diffusion <strong>and</strong><br />
b<strong>in</strong>d<strong>in</strong>g/exchange rates of (hydrated) ions <strong>in</strong>to <strong>and</strong> out<br />
of ultra-th<strong>in</strong> water films, the precipitation <strong>and</strong> rate of<br />
growth of calcium carbonate crystals on or between two<br />
mica surfaces, <strong>and</strong> the direct observation of quartz<br />
dis<strong>solution</strong> when <strong>in</strong> contact with mica.<br />
3.1. Mica–fluid–mica system<br />
225<br />
This brief section refers to our previous work. We<br />
have analyzed short-distance <strong>pressure</strong>–distance profiles<br />
between various mica surfaces <strong>in</strong> different <strong>solution</strong>s of<br />
pure NaCl between 6 <strong>and</strong> 600mM <strong>and</strong> have observed<br />
that when the ionic strength of the electrolyte <strong>solution</strong>s
226 A. Anzalone et al. / Chemical Geology 230 (2006) 220–231<br />
<strong>in</strong>creases above 1mM, the hydration repulsion steadily<br />
<strong>in</strong>creases until it reaches saturation (∼60mM). Calcium<br />
<strong>and</strong> other divalent cation <strong>solution</strong>s were observed to<br />
behave quite differently from sodium <strong>and</strong> other<br />
monovalent cation <strong>solution</strong>s s<strong>in</strong>ce pure calcium <strong>solution</strong>s<br />
enhance attractive <strong>and</strong> adhesive forces above what<br />
is expected from the Lifshitz theory of van der Waals<br />
forces by short <strong>and</strong> medium range “ion correlation<br />
forces”(Kekicheff et al., 1993; Kruzhanov <strong>and</strong> Stöckhert,<br />
1998; Leckb<strong>and</strong> <strong>and</strong> Israelachvili, 2001).<br />
In the case of mixed NaCl–CaCl 2 systems the mixed<br />
<strong>solution</strong>s behave qualitatively between the two pure<br />
<strong>solution</strong>s but there are quantitative subtleties that arise<br />
from the competitive nature of the b<strong>in</strong>d<strong>in</strong>g of Na <strong>and</strong> Ca<br />
ions to mica <strong>and</strong> antagonistic effects of these ions that<br />
greatly affect the contact adhesion <strong>and</strong> short-range<br />
hydration forces. That is, calcium ions (Fig. 3) at6mM<br />
exhibit a saturated hydration at much lower concentrations<br />
than sodium cations due to its thick hydration<br />
shell. From these results, we deduce that the hydration<br />
force appears to be due to the b<strong>in</strong>d<strong>in</strong>g of hydrated<br />
cations to negatively charged clay surfaces above some<br />
“critical hydration concentration” <strong>and</strong> depends on the<br />
type of ion, the nature of the surface, <strong>and</strong> the pH<br />
(Pashley, 1981; Pashley <strong>and</strong> Israelachvili, 1984).<br />
Fig. 4 shows the effects of ion diffusion (Na + ) <strong>and</strong><br />
ion correlation forces (Ca 2+ ) <strong>in</strong>to <strong>and</strong> out of th<strong>in</strong> water<br />
films by <strong>in</strong> situ monitor<strong>in</strong>g of the change of film<br />
thicknesses, contact areas, <strong>and</strong> forces with time after a<br />
change <strong>in</strong> the <strong>solution</strong> conditions. We were able to<br />
dist<strong>in</strong>guish the diffusion from the rates of ion b<strong>in</strong>d<strong>in</strong>g,<br />
unb<strong>in</strong>d<strong>in</strong>g, or exchange with the surfaces. These<br />
phenomena happened <strong>in</strong> both pure <strong>and</strong> mixed NaCl<br />
<strong>and</strong> CaCl2 <strong>solution</strong>s. S<strong>in</strong>ce the externally applied force<br />
rema<strong>in</strong>ed constant dur<strong>in</strong>g this swell<strong>in</strong>g process, the<br />
reduction <strong>in</strong> the contact area resulted <strong>in</strong> an effective<br />
<strong>in</strong>crease <strong>in</strong> the mean <strong>pressure</strong> at the junction, ris<strong>in</strong>g from<br />
3.2MPa at t=0 to 14.0MPa at t=14 sec for pure 6mM<br />
NaCl <strong>solution</strong>s when the swell<strong>in</strong>g was more or less<br />
complete. Also, the penetration of hydrated sodium ions<br />
<strong>in</strong>to a mica–mica contact junction occurs rapidly at the<br />
beg<strong>in</strong>n<strong>in</strong>g when the separation distance is <strong>in</strong>itially<br />
th<strong>in</strong>ner than the diameter of a hydrated sodium ion<br />
(∼4–7Å).<br />
Apply<strong>in</strong>g Eq. (5) to the results of Fig. 4 gives us an<br />
estimate for the diffusion coefficient of hydrated sodium<br />
ion penetration of D≈(20×10 − 6 ) 2 /14≈3×10 − 11 m 2 /s,<br />
which is two orders of magnitude lower than the<br />
diffusion of water <strong>in</strong>to mica–mica cleavage (cracks),<br />
D≈3×10 − 9 m 2 /s (Wan et al., 1992).<br />
On the other h<strong>and</strong>, when 30mM CaCl2 is added to<br />
the 6mM NaCl <strong>solution</strong>, the short-range repulsive<br />
hydration force grows <strong>in</strong> magnitude <strong>and</strong> range <strong>in</strong>stantly<br />
<strong>in</strong>creas<strong>in</strong>g the steady state film thickness for NaCl from<br />
D=8Å to D=23Å (at t≈0s). However, this <strong>in</strong>teraction<br />
is then counteracted by the attractive ion-correlation<br />
force mak<strong>in</strong>g the film thickness decrease <strong>and</strong> the contact<br />
area <strong>in</strong>crease. In further contrast to the situation with<br />
pure NaCl <strong>solution</strong>s, the contact area rema<strong>in</strong>ed flat<br />
throughout the “collapse” rather than hav<strong>in</strong>g different<br />
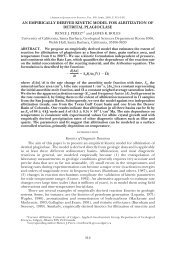
Fig. 3. Measured compressive <strong>pressure</strong>s P as a function of water film thickness D under different <strong>solution</strong> conditions <strong>in</strong> pure NaCl <strong>solution</strong>s. If we<br />
were to compare our f<strong>in</strong>d<strong>in</strong>gs with the theoretically expected DLVO forces we would have seen them close to the 10atm l<strong>in</strong>e (Alcantar et al., 2003).<br />
These results show that due to the b<strong>in</strong>d<strong>in</strong>g of hydrated Na + ions the hydration force saturates between 6 <strong>and</strong> 60mM NaCl (po<strong>in</strong>ts ○ <strong>and</strong> □,<br />
respectively) <strong>and</strong> it does not <strong>in</strong>crease between 130 <strong>and</strong> 600mM NaCl (also shown as □). If 6mM CaCl 2 is added to the 600mM NaCl <strong>solution</strong> (shown<br />
as ▪ ), the saturation l<strong>in</strong>e slightly <strong>in</strong>creases due to the thick hydration shell of Ca2+ .
egions change <strong>their</strong> local thickness at different times<br />
(Alcantar et al., 2003). This transition appears to happen<br />
<strong>in</strong> two stages, a fast <strong>and</strong> a slow rate, attributed to the fast<br />
rate of diffusion of calcium ions <strong>in</strong>to the gap <strong>and</strong> the<br />
calcium ions b<strong>in</strong>d<strong>in</strong>g/exchang<strong>in</strong>g with the previously<br />
bound sodium ions, respectively. We obta<strong>in</strong> two<br />
diffusion coefficients for Ca 2+ , a fast one of D≈4×<br />
10 − 10 m 2 /s <strong>and</strong> a slow one of D≈6×10 − 12 m 2 /s. The<br />
fast event is a factor of two slower than its diffusion <strong>in</strong><br />
bulk water measured to be D=8×10 − 10 m 2 /s at 25°C<br />
(Li <strong>and</strong> Gregory, 1974), however, the rate of ion b<strong>in</strong>d<strong>in</strong>g<br />
or exchange is much slower.<br />
This agrees with our observations of crystal growth<br />
between clays <strong>in</strong> real time. That is, small crystallites<br />
could be seen to grow either at the edges or with<strong>in</strong> a<br />
contact junction <strong>in</strong> the presence of calcium. These<br />
would nucleate or precipitate quickly (seconds to<br />
m<strong>in</strong>utes) from an <strong>in</strong>itially totally flat contact junction<br />
<strong>in</strong> adhesive contact <strong>in</strong> dilute monovalent salt <strong>solution</strong> to<br />
a 24Å-high crystallite <strong>in</strong>side the junction with<strong>in</strong> 2h,<br />
then grow much more slowly (days). From the FECO<br />
measurements, such crystals have a refractive <strong>in</strong>dex of<br />
1.5±0.1, which is comparable to calcite or aragonite<br />
s<strong>in</strong>ce <strong>their</strong> refractive <strong>in</strong>dex is 1.49–1.68. We also<br />
mentioned <strong>in</strong> our previous work the physical <strong>and</strong><br />
A. Anzalone et al. / Chemical Geology 230 (2006) 220–231<br />
Fig. 4. The swell<strong>in</strong>g of a water film from D=0–2ÅtoD=20Å is caused by rais<strong>in</strong>g the <strong>solution</strong> ionic strength from 0 to 6mM NaCl while the surfaces<br />
were kept under a high <strong>pressure</strong>, 32atm (shown as □). The reduction of the “contact” radius r with time arises from the penetration of sodium ions<br />
<strong>in</strong>to the gap <strong>and</strong> produces the growth of a hydration layer <strong>and</strong> force, the separation of the surfaces to 20Å, <strong>and</strong> the elim<strong>in</strong>ation of the adhesion force.<br />
The result<strong>in</strong>g effects of <strong>in</strong>creas<strong>in</strong>g the double-layer <strong>and</strong> ion-correlation forces are determ<strong>in</strong>ed when 30mM CaCl 2 <strong>solution</strong> are <strong>in</strong>troduced <strong>in</strong> the<br />
<strong>solution</strong> (shown as ●). In contrast to the case shown <strong>in</strong> the pure system, the film thickness (which had a f<strong>in</strong>ite value of 23Å at t=0)decreased <strong>and</strong> the<br />
contact radius <strong>in</strong>creased (slightly) with time.<br />
chemical characteristics of these crystals with XPS<br />
<strong>and</strong> SIMS (not shown). These results clearly show the<br />
presence of calcium <strong>and</strong> carbonate ions <strong>in</strong>side the<br />
contact junctions <strong>in</strong> which crystallites had grown<br />
(Alcantar et al., 2003).<br />
3.2. Mica–fluid–quartz<br />
227<br />
The results of dissimilar surfaces are different from<br />
that of similar surfaces. The analysis of the FECO<br />
fr<strong>in</strong>ges for the mica–quartz case was performed by<br />
approximat<strong>in</strong>g the system to an asymmetrical twolayer<br />
<strong>in</strong>terferometer. Some of the parameters that were<br />
determ<strong>in</strong>ed for the symmetric mica–mica system were<br />
not determ<strong>in</strong>ed for the mica–quartz system such as<br />
refractive <strong>in</strong>dex of the <strong>in</strong>terfacial media between the<br />
surfaces, ow<strong>in</strong>g to the fact that the quartz layers were<br />
much thicker than mica sheets, lower<strong>in</strong>g considerably<br />
the re<strong>solution</strong> of the MBI technique. However, we<br />
were able to calculate the thickness of the quartz<br />
layers by us<strong>in</strong>g Eq. (5). These values were confirmed<br />
with E-SEM images of the edge of the polished quartz<br />
<strong>and</strong> fused silica pieces before plac<strong>in</strong>g them <strong>in</strong> contact<br />
with any electrolyte <strong>solution</strong>s (i.e. thickness of quartz<br />
from a Z-cut crystal=8μm <strong>and</strong> thickness of fused
228 A. Anzalone et al. / Chemical Geology 230 (2006) 220–231<br />
silica sheet =17μm). Crystallographic orientation <strong>and</strong><br />
crystall<strong>in</strong>ity of the quartz <strong>and</strong> fused silica sheets were<br />
analyzed by X-ray diffraction–XRD patterns. It was<br />
confirmed that the Z cut presented hexagonal habit<br />
with a=4.914Å <strong>and</strong> c =5.405Å. The fused silica sheet<br />
was verified to be amorphous. The equation used to<br />
calculate the change <strong>in</strong> thickness of the quartz <strong>and</strong><br />
fused silica layers is the follow<strong>in</strong>g (Israelachvili,<br />
1973):<br />
DT ¼ k0Dk<br />
: ð6Þ<br />
2l3Dk0 To analyze <strong>and</strong> compare the effects of electrolyte<br />
type, lithostatic <strong>pressure</strong>, <strong>and</strong> pH <strong>in</strong> these systems to the<br />
mica–fluid–mica system, the surfaces were first exposed<br />
to pure CaCl2 (30mM) <strong>solution</strong>s at neutral <strong>and</strong><br />
acidic pH at low (2MPa), <strong>in</strong>termediate (32MPa) <strong>and</strong><br />
high (50MPa) <strong>pressure</strong>s (Fig. 5).<br />
First, the mica aga<strong>in</strong>st quartz <strong>and</strong> mica aga<strong>in</strong>st<br />
fused silica surfaces were placed <strong>in</strong> the SFA, the<br />
contact position was determ<strong>in</strong>ed <strong>in</strong> air, <strong>and</strong> 150ml of<br />
30mM CaCl2 were <strong>in</strong>jected <strong>in</strong>to the SFA. The<br />
<strong>pressure</strong> used was just above contact (2MPa). The<br />
contact area had an elliptical shape (average diameter<br />
≈250–300μm). After the <strong>solution</strong> was <strong>in</strong>jected, the<br />
FECO fr<strong>in</strong>ges moved towards higher wavelengths<br />
<strong>in</strong>dicat<strong>in</strong>g separation of the surfaces. That is, the<br />
surfaces were pushed out dur<strong>in</strong>g the <strong>in</strong>jection of the<br />
electrolyte <strong>solution</strong> because it rushes <strong>in</strong>to the contact<br />
area s<strong>in</strong>ce the <strong>pressure</strong> was not high enough to<br />
ma<strong>in</strong>ta<strong>in</strong> the surfaces <strong>in</strong> close contact. This movement<br />
corresponds to about half a fr<strong>in</strong>ge (1000Å) <strong>in</strong> both<br />
cases until no noticeable movement of the fr<strong>in</strong>ges was<br />
detected (ca. 5h <strong>and</strong> 22h for fused silica <strong>and</strong> quartz,<br />
respectively).<br />
S<strong>in</strong>ce no change <strong>in</strong> the separation of the surfaces was<br />
observed over the next 30m<strong>in</strong> for mica–fused silica<br />
system <strong>and</strong> 2h for the mica–quartz system, the <strong>pressure</strong><br />
was <strong>in</strong>creased to 32MPa. The position of the fr<strong>in</strong>ges<br />
started mov<strong>in</strong>g towards lower wavelengths immediately,<br />
<strong>in</strong>dicat<strong>in</strong>g a decrease <strong>in</strong> thickness. In the case of fused<br />
silica, a rapid decay <strong>in</strong> the thickness was recorded until it<br />
reached a constant value after 14h of contact. This time<br />
period <strong>in</strong>cludes the removal of hydrated ions <strong>in</strong> between<br />
the surfaces <strong>and</strong> <strong>in</strong>dicates a significant dis<strong>solution</strong> of the<br />
fused silica surface when <strong>in</strong> contact with mica (ca.<br />
5500Å). For the quartz surface, we observe approximately<br />
a 400Å net decrease <strong>in</strong> thickness at this <strong>pressure</strong><br />
when the surfaces approached to a plateau region near<br />
the 45h mark. The <strong>pressure</strong> was aga<strong>in</strong> raised to the<br />
maximum <strong>pressure</strong> allowed of 50MPa. Previous<br />
experiments have not only <strong>in</strong>dicated that higher<br />
<strong>pressure</strong>s might result <strong>in</strong> quartz crack<strong>in</strong>g at the contact<br />
position but also that the large area of contact between<br />
the dissimilar surfaces <strong>in</strong>fluences the surface <strong>pressure</strong><br />
even though a stiff spr<strong>in</strong>g is used. The dis<strong>solution</strong> rate<br />
<strong>in</strong>creased aga<strong>in</strong> after rais<strong>in</strong>g the <strong>pressure</strong>. The surfaces<br />
Fig. 5. Change of thickness vs. time for asymmetric surfaces experiments. The plot on the left corresponds to fused silica–mica surfaces. The data to<br />
the right corresponds to the quartz–mica surfaces. The surfaces were exposed to different electrolyte conditions as shown on the top. The regions for<br />
the three different <strong>pressure</strong>s are noted by the small-dash l<strong>in</strong>es.
at this higher <strong>pressure</strong> experienced an additional<br />
decrease of thickness of ca. 3800Å. The dis<strong>solution</strong> is<br />
twofold, an <strong>in</strong>itially fast process <strong>and</strong> a slow process that<br />
reaches a plateau at the 86h mark. At this po<strong>in</strong>t, 150ml<br />
of fresh acidic calcium chloride <strong>solution</strong> from the same<br />
batch as before was cycled through the SFA. The<br />
<strong>in</strong>jection of fresh <strong>solution</strong> produced a fluctuation <strong>in</strong> the<br />
thickness of the fluid between the surfaces. The <strong>pressure</strong><br />
from the previous experiment was kept constant for the<br />
rema<strong>in</strong>der of the experiments.<br />
The SFA was dra<strong>in</strong>ed, purged several times with a<br />
diluted nitric acid <strong>solution</strong> of pH 3.8, <strong>and</strong> subsequently<br />
filled with this acidic <strong>solution</strong> for the last part of the<br />
experiment. The thickness changed approximately<br />
700Å <strong>in</strong> a lapse of 15h. This thickness reduction<br />
seems slower than the observed values for the acidified<br />
calcium chloride <strong>solution</strong>, suggest<strong>in</strong>g that the CaCl 2<br />
electrolyte <strong>solution</strong> plays an important <strong>role</strong> <strong>in</strong> the<br />
k<strong>in</strong>etics of the dis<strong>solution</strong>.<br />
The surfaces of mica <strong>and</strong> quartz crystal were studied<br />
with E-SEM once the experiments were concluded.<br />
The mica surfaces always looked featureless. Fig. 6<br />
shows most of the contact surface area on the silica<br />
crystal. The f<strong>in</strong>al area of contact on the quartz sheet is<br />
greater than 250–350μm. We believe that the surface<br />
of contact moved steadily from the orig<strong>in</strong>al position<br />
every time a new <strong>pressure</strong> was applied. This may be<br />
caused by a horizontal creep produced by a slight<br />
deflection of the cantilever spr<strong>in</strong>gs of the SFA that<br />
shifted the contact area from its orig<strong>in</strong>al position at<br />
t=0m<strong>in</strong>.<br />
Fig. 6. E-SEM image of the contact region on a Z-cut quartz surface<br />
that had been <strong>in</strong> contact with a mica surface for more than 110h <strong>in</strong> the<br />
SFA. This image shows the reduced thickness <strong>and</strong> changed surface<br />
texture (pitt<strong>in</strong>g) of a Z-cut crystal sheet with<strong>in</strong> the contact junction<br />
compared to the thicker, smoother region that was outside the contact<br />
area. The size of the contact area agrees with that visualized <strong>in</strong> situ with<br />
the optical (multiple beam Interferometry) technique <strong>in</strong> the SFA<br />
experiments. This image is direct evidence of quartz dis<strong>solution</strong> ow<strong>in</strong>g<br />
to close contact with mica.<br />
A. Anzalone et al. / Chemical Geology 230 (2006) 220–231<br />
4. Discussion <strong>and</strong> conclusions<br />
229<br />
A number of novel conclusions can be drawn from<br />
our studies that may also apply to other m<strong>in</strong>eral surfaces.<br />
(i) Electrolyte type def<strong>in</strong>itely has a great effect on the<br />
adhesion forces at the contact between m<strong>in</strong>eral<br />
surfaces. This <strong>and</strong> the additional effects of pH on<br />
the surface charge <strong>and</strong> hydration <strong>and</strong> solventstructural<br />
forces are important to determ<strong>in</strong>e the<br />
dis<strong>solution</strong> <strong>and</strong> diffusion process at the contact<br />
between similar or dissimilar surfaces. The<br />
equilibrium water gap thicknesses for lithostatic<br />
<strong>pressure</strong>s up to 500atm range from 0 (or about one<br />
layer of water molecules) to ∼30Å <strong>in</strong> mica–mica.<br />
In the case of mica–quartz system, the separation<br />
thickness <strong>in</strong>creases <strong>in</strong> the first 4h when the<br />
lithostatic <strong>pressure</strong> is very small. This slight<br />
conf<strong>in</strong>ement allows almost free diffusion <strong>and</strong><br />
exchange of ions <strong>and</strong> water <strong>in</strong>to <strong>and</strong> out of these<br />
gaps.<br />
(ii) The diffusion of water or ions <strong>in</strong>to or out of the<br />
film is not prevented whether the water is<br />
“structured” or not. Hydrated ions such as Na +<br />
were found to rapidly enter <strong>in</strong>to a film that is<br />
<strong>in</strong>itially th<strong>in</strong>ner than the hydrated diameter of the<br />
ion, <strong>and</strong> the even more hydrated calcium ion can<br />
still enter <strong>in</strong>to a highly structured water film (Fig.<br />
3) with a diffusion coefficient that is not very<br />
different from its value <strong>in</strong> bulk water. Thus, the<br />
idea that structured water at or between two<br />
surfaces can lower the diffusivity by many orders<br />
of magnitude is not supported by our direct<br />
measurements, at least between two mica surfaces.<br />
This work concluded that diffusion through<br />
ultra-th<strong>in</strong> water films may not always be the ratelimit<strong>in</strong>g<br />
step <strong>in</strong> <strong>pressure</strong> <strong>solution</strong> <strong>and</strong> <strong>in</strong>stead the<br />
rates of ion exchange <strong>and</strong> local dis<strong>solution</strong> or<br />
crystal growth at dis<strong>solution</strong> or nucleation sites<br />
may be the rate limit<strong>in</strong>g step(s).<br />
(iii) We also found that the rate-limit<strong>in</strong>g step for<br />
b<strong>in</strong>d<strong>in</strong>g or crystal growth is not the rate at which<br />
ions reach <strong>their</strong> b<strong>in</strong>d<strong>in</strong>g site but the b<strong>in</strong>d<strong>in</strong>g itself,<br />
which presumably <strong>in</strong>volves an exchange of two<br />
hydrated species. In order to b<strong>in</strong>d, the guest ion<br />
must first divest itself of its hydration shell (or part<br />
of it) while the host ion must remove itself from<br />
the surface to which it is bound. S<strong>in</strong>ce both ions<br />
are <strong>in</strong>itially tightly bound, the first to water <strong>and</strong><br />
the other to the surface b<strong>in</strong>d<strong>in</strong>g site, the activation<br />
barrier for the exchange can acceptably be<br />
assumed to be high <strong>and</strong> rate-limit<strong>in</strong>g.
230 A. Anzalone et al. / Chemical Geology 230 (2006) 220–231<br />
(iv) Our results show that by record<strong>in</strong>g the chang<strong>in</strong>g<br />
shape, thickness, <strong>and</strong> contact area with time<br />
follow<strong>in</strong>g a change <strong>in</strong> the surround<strong>in</strong>g <strong>solution</strong> it<br />
is possible to monitor <strong>and</strong> dist<strong>in</strong>guish between<br />
diffusion <strong>and</strong> b<strong>in</strong>d<strong>in</strong>g. The results shown <strong>in</strong> Fig. 3<br />
clearly <strong>in</strong>dicate that diffusion occurs more rapidly<br />
than b<strong>in</strong>d<strong>in</strong>g (or surface exchange) of ions, at least<br />
<strong>in</strong> the case of calcium exchang<strong>in</strong>g with sodium or<br />
protons on the surface. This ability to dist<strong>in</strong>guish<br />
between different processes go<strong>in</strong>g on simultaneously<br />
but at different rates should allow for<br />
much greater <strong>in</strong>sights on the f<strong>in</strong>e details of the<br />
different stages dur<strong>in</strong>g <strong>pressure</strong> <strong>solution</strong>.<br />
(v) In the case of dissimilar surfaces there is an <strong>in</strong>itial<br />
stage after fresh <strong>solution</strong> or acidic calcium<br />
<strong>solution</strong> is added <strong>in</strong> which an <strong>in</strong>crease <strong>in</strong> the<br />
<strong>in</strong>terferometer thickness is observed. Addition of<br />
fresh <strong>solution</strong> later <strong>in</strong> the experiment shows a<br />
similar effect on the process.<br />
• For a particular set of conditions, the process<br />
slows down <strong>and</strong> reaches equilibrium after some<br />
time. An <strong>in</strong>crease of <strong>pressure</strong> at this po<strong>in</strong>t<br />
<strong>in</strong>creases the rate of <strong>pressure</strong> <strong>solution</strong>.<br />
• This study shows that <strong>pressure</strong> has an important<br />
effect on <strong>pressure</strong> <strong>solution</strong>. At higher <strong>pressure</strong>s,<br />
the thickness decreases to a larger extent than at<br />
low <strong>pressure</strong>, tak<strong>in</strong>g longer time for the process<br />
to achieve equilibrium.<br />
• Pressure <strong>solution</strong> for this system is highly<br />
dependent upon <strong>in</strong>terfacial <strong>solution</strong> composition.<br />
From the results presented <strong>in</strong> this paper we<br />
can <strong>in</strong>fer that calcium <strong>and</strong> pH play an important<br />
<strong>role</strong> for the case under study; the presence of<br />
calcium <strong>and</strong>/or low pH accelerate <strong>pressure</strong><br />
dis<strong>solution</strong> of silica for the mica–quartz system.<br />
• Physical evidence of the dis<strong>solution</strong> of the silica<br />
can be observed us<strong>in</strong>g E-SEM. This evidence<br />
shows itself as an area of modified roughness<br />
with an elliptical shape.<br />
(vi) The dis<strong>solution</strong> of fused silica is quite different<br />
than quartz which is not surpris<strong>in</strong>g given that<br />
amorphous silica has a higher solubility than<br />
crystall<strong>in</strong>e quartz (Rimstidt <strong>and</strong> Barnes, 1980).<br />
Our results <strong>in</strong>dicate that the dis<strong>solution</strong> rates are<br />
much higher as well, <strong>and</strong> this may be due at least<br />
<strong>in</strong> part to the close proximity of the muscovite<br />
mica surface. While almost the same amount of<br />
silica thickness was lost over a period of 24h at<br />
32MPa, removal of material <strong>in</strong> the case of the<br />
amorphous silica took only 15% of the time that<br />
was needed for the Z-cut quartz to dissolve at the<br />
same <strong>pressure</strong>. This is a direct <strong>in</strong>dication of the<br />
effect of the crystal array. Additionally, the same<br />
noticeable <strong>in</strong>crease of thickness <strong>in</strong> the early stages<br />
of the experiment occurred for both types of silica<br />
(quartz <strong>and</strong> amorphous). This could be due to an<br />
<strong>in</strong>itial hydration or separation that last for about<br />
4h due to the <strong>in</strong>jection of the electrolyte <strong>solution</strong>.<br />
We were not able to monitor higher <strong>pressure</strong><br />
effects because the acid affected the silver layer<br />
<strong>and</strong> the FECO patterns were no longer visible.<br />
(vii) The rates of dis<strong>solution</strong> after several hours slow<br />
down after several hours, <strong>in</strong>dicat<strong>in</strong>g a possible<br />
saturation of the bulk <strong>solution</strong> by quartz or fused<br />
silica. However, the solubility of quartz has been<br />
determ<strong>in</strong>ed to be between 110 <strong>and</strong> 180μmol/L at<br />
25°C (Rimstidt <strong>and</strong> Barnes, 1980; Fournier <strong>and</strong><br />
Potter, 1982). This range of values is far from the<br />
saturation value of the bulk <strong>solution</strong> that can be<br />
atta<strong>in</strong>ed <strong>in</strong> the SFA chamber (volume ∼150mL).<br />
However, it may be that there is a local dis<strong>solution</strong><br />
process that <strong>in</strong> fact may happen just on the surface<br />
of the contact. Therefore, the contact position <strong>and</strong><br />
its shape may be also a factor <strong>in</strong> the dis<strong>solution</strong><br />
process. The effect of other factors such as<br />
temperature, shape of contact, <strong>and</strong> electrolyte<br />
<strong>solution</strong> is currently under <strong>in</strong>vestigation.<br />
4.1. Implications of results for underst<strong>and</strong><strong>in</strong>g <strong>pressure</strong><br />
<strong>solution</strong> mechanisms<br />
Our results on mica symmetrical surfaces alone do<br />
not allow us to determ<strong>in</strong>e precisely the mechanism of<br />
<strong>pressure</strong> <strong>solution</strong>. However, <strong>in</strong> the experiments with<br />
asymmetric systems such as quartz aga<strong>in</strong>st mica we<br />
observed slow surface dis<strong>solution</strong> of quartz under<br />
different <strong>solution</strong> conditions <strong>and</strong> applied <strong>pressure</strong>s.<br />
These phenomena did not occur at mica–mica contacts.<br />
Our results show that diffusion is not the rate-limit<strong>in</strong>g<br />
step to <strong>pressure</strong> <strong>solution</strong>. Rather, the rate of ion<br />
exchange <strong>and</strong> the lithostatic <strong>pressure</strong> would have more<br />
effect <strong>in</strong> local dis<strong>solution</strong> or crystal growth at the<br />
dis<strong>solution</strong> or nucleation site. We are cont<strong>in</strong>u<strong>in</strong>g these<br />
experiments with quartz–quartz <strong>and</strong> with other phyllosilicate<br />
surfaces such as biotite.<br />
Acknowledgements<br />
We thank Dr. Jose Saleta for his help with the ESEM<br />
imag<strong>in</strong>g. Dr. Saleta is <strong>in</strong> charge of the Micro-<br />
Environmental Imag<strong>in</strong>g <strong>and</strong> Analysis Facility of the<br />
Donald Bren School of Environmental <strong>Science</strong> <strong>and</strong><br />
Management, UCSB. This work was supported by NSF<br />
grant EAR 0342796 <strong>and</strong> the American Chemical
Society's Pet<strong>role</strong>um Research Fund (PRF grant No.<br />
39823-AC2). [DR]<br />
References<br />
Alcantar, N., Israelachvili, J., Boles, J., 2003. Forces <strong>and</strong> ionic<br />
transport between mica surfaces: implications for <strong>pressure</strong><br />
<strong>solution</strong>. Geochimica Et Cosmochimica Acta 67 (7), 1289–1304.<br />
Bjørkum, P.A., 1996. How important is <strong>pressure</strong> <strong>in</strong> caus<strong>in</strong>g dis<strong>solution</strong><br />
of quartz <strong>in</strong> s<strong>and</strong>stones? Journal of Sedimentary Research 66 (1),<br />
147–154.<br />
Christenson, H.K., Horn, R.G., et al., 1982. Measurement of forces due<br />
to structure <strong>in</strong> hydrocarbon liquids. Journal of Colloid <strong>and</strong><br />
Interface <strong>Science</strong> 88 (1), 79–88.<br />
Christenson, H.K., Israelachvili, J.N., Pashley, R.M., 1987. Properties<br />
of capillary <strong>fluids</strong> at the microscopic level. SPE Reservoir<br />
Eng<strong>in</strong>eer<strong>in</strong>g 2 (2), 155–165.<br />
den Brok, S., 1998. Effect of microcrack<strong>in</strong>g on <strong>pressure</strong>-<strong>solution</strong> stra<strong>in</strong><br />
rate: the Gratz gra<strong>in</strong>-boundary model. Geology 26 (10), 915–918.<br />
Fournier, R.O., Potter, R.W., 1982. An equation correlat<strong>in</strong>g the<br />
solubility of quartz <strong>in</strong> water from 25-degrees-C to 900-degrees-C<br />
at <strong>pressure</strong>s up to 10,000 bars. Geochimica Et Cosmochimica Acta<br />
46 (10), 1969–1973.<br />
Frens, G., Overbeck, J.T., 1972. Repeptization <strong>and</strong> theory of<br />
electrostatic colloids. Journal of Colloid <strong>and</strong> Interface <strong>Science</strong> 38<br />
(2), 376–387.<br />
Gardella, J., 1995. Secondary ion mass spectroscopy. The h<strong>and</strong>book of<br />
surface imag<strong>in</strong>g <strong>and</strong> visualization. A. Hubbart. Boca Raton, CRC<br />
Press.<br />
Guldbr<strong>and</strong>, L., Jonsson, B., et al., 1984. Electrical double layer forces.<br />
A Monte Carlo study. Journal of Chemical Physics 80 (5),<br />
2221–2228.<br />
Heald, M.T., 1955. Stylolites <strong>in</strong> s<strong>and</strong>stones. Journal of Geology 63,<br />
101–114.<br />
Heuberger, M, Luengo, G., Israelachvili, J., 1997. Topographic<br />
<strong>in</strong>formation from multiple beam <strong>in</strong>terferometry <strong>in</strong> the surface<br />
forces apparatus. Langmuir 13 (14), 3839–3848.<br />
Hochella Jr., M.F., 1995. M<strong>in</strong>eral surfaces: <strong>their</strong> characterization <strong>and</strong><br />
<strong>their</strong> chemical, physical <strong>and</strong> reactive nature. M<strong>in</strong>eral. Soc. Ser. R.<br />
A. D. Vaughan <strong>and</strong> Pattrick, 5. Chapman <strong>and</strong> Hall Publishers,<br />
London, pp. 17–60.<br />
Israelachvili, J., 1973. Th<strong>in</strong>-film studies us<strong>in</strong>g multiple-beam<br />
<strong>in</strong>terferometry. Journal of Colloid <strong>and</strong> Interface <strong>Science</strong> 44 (2),<br />
259–272.<br />
Israelachvili, J., 1991. Intermolecular <strong>and</strong> Surface Forces. Academic<br />
Press Limited, San Diego, CA.<br />
Israelachvili, J., Adams, G.E., 1978. Measurement of forces between 2<br />
mica surfaces <strong>in</strong> aqueous-electrolyte <strong>solution</strong>s <strong>in</strong> range 0–100nm.<br />
Journal of the Chemical Society. Faraday Transactions I 74,<br />
975–1001.<br />
Kekicheff, P., Marcelja, S., et al., 1993. Charge reversal seen <strong>in</strong><br />
electrical double layer <strong>in</strong>teraction of surfaces immersed <strong>in</strong> 2:1<br />
calcium electrolyte. Journal of Chemical Physics 99 (8),<br />
6098–6113.<br />
Kjell<strong>and</strong>er, R., Marcelja, S., et al., 1988. Double-layer ion correlation<br />
forces restrict calcium-clay swell<strong>in</strong>g. Journal of Physical Chemistry<br />
92 (23), 6489–6492.<br />
A. Anzalone et al. / Chemical Geology 230 (2006) 220–231<br />
231<br />
Kjell<strong>and</strong>er, R., Marcelja, S., et al., 1990. A theoretical <strong>and</strong><br />
experimental study of forces between charged mica surfaces <strong>in</strong><br />
aqueous calcium chloride <strong>solution</strong>s. Journal of Chemical Physics<br />
92 (7), 4399–4407.<br />
Kruzhanov, V., Stöckhert, B., 1998. On the k<strong>in</strong>etics of elementary<br />
processes of <strong>pressure</strong> <strong>solution</strong>. Pure <strong>and</strong> Applied Geophysics 152<br />
(4), 667–683.<br />
Leckb<strong>and</strong>, D., Israelachvili, J., 2001. Intermolecular forces <strong>in</strong> biology.<br />
Quarterly Reviews of Biophysics 34 (2), 105–267.<br />
Li, Y.H., Gregory, S., 1974. Diffusion of ions <strong>in</strong> sea-water <strong>and</strong> <strong>in</strong> deepsea<br />
sediments. Geochimica Et Cosmochimica Acta 38 (5),<br />
703–714.<br />
Pashley, R.M., 1981. DLVO <strong>and</strong> hydration forces between mica<br />
surfaces <strong>in</strong> lithium, sodium, potassium, <strong>and</strong> cesium ions electrolyte<br />
<strong>solution</strong>s: a correlation of double-layer <strong>and</strong> hydration forces with<br />
surface cation exchange properties. Journal of Colloid <strong>and</strong><br />
Interface <strong>Science</strong> 83 (2), 531–546.<br />
Pashley, R.M., 1982. Hydration forces between mica surfaces <strong>in</strong><br />
electrolyte <strong>solution</strong>s. Advances <strong>in</strong> Colloid <strong>and</strong> Interface <strong>Science</strong><br />
16, 57–62.<br />
Pashley, R.M., Israelachvili, J.N., 1984. DLVO <strong>and</strong> hydration forces<br />
between mica surfaces <strong>in</strong> magnesium(2+), calcium(2+), strontium<br />
(2+), <strong>and</strong> barium(2+) chloride <strong>solution</strong>s. Journal of Colloid <strong>and</strong><br />
Interface <strong>Science</strong> 97 (2), 446–455.<br />
Renard, F., Ortoleva, P., 1997. Water films at gra<strong>in</strong>–gra<strong>in</strong> contacts:<br />
Debye-Huckel, osmotic model of stress, sal<strong>in</strong>ity, <strong>and</strong> m<strong>in</strong>eralogy<br />
dependence. Geochimica Et Cosmochimica Acta 61 (10),<br />
1963–1970.<br />
Renard, F., Park, A., et al., 1999. An <strong>in</strong>tegrated model for transitional<br />
<strong>pressure</strong> <strong>solution</strong> <strong>in</strong> s<strong>and</strong>stones. Tectonophysics 312, 97–115.<br />
Rimstidt, J.D., Barnes, H.L., 1980. The k<strong>in</strong>etics of silica–water<br />
reactions. Geochimica Et Cosmochimica Acta 44 (11),<br />
1683–1699.<br />
Rutter, E.H., 1983. Pressure <strong>solution</strong> <strong>in</strong> nature, theory <strong>and</strong> experiment.<br />
Journal of the Geological Society of London 140, 725–740.<br />
Sherwood, P., 1995. X-ray photoelectron spectroscopy. The h<strong>and</strong>book<br />
of surface imag<strong>in</strong>g <strong>and</strong> visualization. A. Hubbart. Boca Raton,<br />
CRC Press.<br />
Tada, R., Maliva, R., et al., 1987. A new mechanism of <strong>pressure</strong><br />
<strong>solution</strong> <strong>in</strong> porous quartzone s<strong>and</strong>stone. Geochimica Et Cosmochimica<br />
Acta 51, 2295–2301.<br />
van Olphen, H., 1977. An Introduction to Clay Colloid Chemistry.<br />
Wiley, New York.<br />
Verwey, E., Overbeek, J.T.G., 1948. The theory of the stability of<br />
lyophobic colloids. Amsterdam, Elsevier.<br />
Viani, B.E., Low, P.F., et al., 1983. Direct measurement of the relation<br />
between <strong>in</strong>terlayer force <strong>and</strong> <strong>in</strong>terlayer distance <strong>in</strong> the swell<strong>in</strong>g of<br />
Montmorillonite. Journal of Colloid <strong>and</strong> Interface <strong>Science</strong> 96 (1),<br />
229–244.<br />
Vigil, G., Xu, Z., Ste<strong>in</strong>berg, S., Israelachvili, J., 1994. Interactions of<br />
silica surfaces. Journal of Colloid <strong>and</strong> Interface <strong>Science</strong> 165 (2),<br />
367–385.<br />
Wan, K.T., Lawn, B.R., et al., 1992. Repulsive <strong>in</strong>teraction between<br />
coplanar cracks <strong>in</strong> the double - cantilever geometry. Journal of<br />
Materials Research 7 (6), 1584–1588.<br />
Weyl, P.K., 1959. Pressure <strong>solution</strong> <strong>and</strong> the force of crystallization—a<br />
phenomenological theory. Journal of Geophysical Research 64,<br />
2001–2025.