Occupational Exposure to Cotton Dust in Cottonseed Oil Mills
Occupational Exposure to Cotton Dust in Cottonseed Oil Mills
Occupational Exposure to Cotton Dust in Cottonseed Oil Mills

Create successful ePaper yourself
Turn your PDF publications into a flip-book with our unique Google optimized e-Paper software.
Applied <strong>Occupational</strong> and Environmental Hygiene<br />
Volume 17(2): 121–130, 2002<br />
Copyright c○ 2002 Applied Industrial Hygiene<br />
1047-322X/02 $12.00 + .00<br />
<strong>Occupational</strong> <strong>Exposure</strong> <strong>to</strong> Cot<strong>to</strong>n <strong>Dust</strong> <strong>in</strong> Cot<strong>to</strong>nseed<br />
<strong>Oil</strong> <strong>Mills</strong><br />
Semion Tabak, 1 David M. Broday, 1 Ilya Tabak, 2 and Gedalyahu Manor 1<br />
1 Faculty of Agricultural Eng<strong>in</strong>eer<strong>in</strong>g, Technion-Israel Institute of Technology, Haifa, Israel;<br />
2 Robert Ett<strong>in</strong>ger Associate Consult<strong>in</strong>g Eng<strong>in</strong>eers Inc., New York, New York<br />
Air samples were collected at breath<strong>in</strong>g height <strong>in</strong> the<br />
hull<strong>in</strong>g-separation department of a modern cot<strong>to</strong>nseed oil<br />
mill <strong>in</strong> Uzbekistan. The average elutriated mass concentration<br />
measured by standard cot<strong>to</strong>n dust samplers was<br />
4.6 mg/m 3 , much lower than the average <strong>to</strong>tal dust concentration<br />
measured by stationary personal samplers,<br />
12.49 mg/m 3 , and by personal samplers attached <strong>to</strong> workers,<br />
14.53 mg/m 3 . Differences <strong>in</strong> read<strong>in</strong>gs among the vertical elutria<strong>to</strong>rs,<br />
stationary personal samplers, and rov<strong>in</strong>g personal<br />
samplers are attributed <strong>to</strong> the dist<strong>in</strong>ct sampl<strong>in</strong>g nature and<br />
dynamics of these samplers. The data suggest that most of<br />
the dust consisted of particles larger than 15 µm, the particle<br />
size cu<strong>to</strong>ff of the vertical elutria<strong>to</strong>r. Differences <strong>in</strong> read<strong>in</strong>gs<br />
among stationary and rov<strong>in</strong>g personal samplers are statistically<br />
significant, presumably represent<strong>in</strong>g biased sampl<strong>in</strong>g<br />
by the rov<strong>in</strong>g personal samplers of regions characterized<br />
by high dust concentration (due <strong>to</strong> mach<strong>in</strong>es malfunction<strong>in</strong>g),<br />
the nonstatic nature of the sampl<strong>in</strong>g, and the <strong>in</strong>teraction<br />
between the sampler and the worker (the personal<br />
cloud). Cot<strong>to</strong>n dust concentrations <strong>in</strong> the hull<strong>in</strong>g-separation<br />
room were nonuniform, peak<strong>in</strong>g <strong>in</strong> front of and between the<br />
huller-separa<strong>to</strong>r pairs. The high <strong>to</strong>tal mass read<strong>in</strong>gs show<br />
that workers were exposed <strong>to</strong> very high levels of nonthoracic<br />
airborne dust, which upon <strong>in</strong>halation tends <strong>to</strong> deposit<br />
<strong>in</strong> the extrathoracic airways. The high elutriated mass concentrations<br />
suggest that workers were exposed <strong>to</strong> respirable<br />
cot<strong>to</strong>n dust at levels higher than 1 mg/m 3 mean concentration,<br />
the current <strong>Occupational</strong> Safety and Health Adm<strong>in</strong>istration<br />
(OSHA) Permissible <strong>Exposure</strong> Limit (PEL) for<br />
cot<strong>to</strong>n dust. Regressions between dust concentrations measured<br />
by stationary vertical elutria<strong>to</strong>rs and by personal samplers<br />
attached <strong>to</strong> workers serve for estimat<strong>in</strong>g the potential<br />
occupational exposure <strong>to</strong> cot<strong>to</strong>n dust of workers <strong>in</strong> the<br />
hull<strong>in</strong>g-separation room.<br />
Keywords <strong>Dust</strong> Particles, Personal Samplers, Cot<strong>to</strong>nseed <strong>Oil</strong> Mill<br />
INTRODUCTION<br />
Orig<strong>in</strong> of <strong>Dust</strong> <strong>in</strong> Cot<strong>to</strong>nseed <strong>Oil</strong> <strong>Mills</strong><br />
Cot<strong>to</strong>nseed oil mills are an <strong>in</strong>tegrated part of the cot<strong>to</strong>n <strong>in</strong>dustry,<br />
contribut<strong>in</strong>g significantly <strong>to</strong> the agricultural economy<br />
<strong>in</strong> cot<strong>to</strong>n-grow<strong>in</strong>g countries. Cot<strong>to</strong>nseed oil mills produce a<br />
number of products such as oil for human consumption, hulls<br />
and feed for lives<strong>to</strong>ck, and l<strong>in</strong>ters for the paper and cellulose<br />
<strong>in</strong>dustries.<br />
The cot<strong>to</strong>nseed delivered <strong>to</strong> the mill is contam<strong>in</strong>ated with<br />
vary<strong>in</strong>g amounts of trash such as soil, pieces of boll hull, cot<strong>to</strong>n<br />
locks, large pieces of foreign materials (balls, rocks, wood),<br />
loose meats, leaves, black seeds, and f<strong>in</strong>e debris. All the foreign<br />
matter must be separated from the seeds <strong>in</strong> the clean<strong>in</strong>g process.<br />
The most effective way <strong>to</strong> remove the trash is by shakers and<br />
pneumatic separa<strong>to</strong>rs. (1,2) This process <strong>in</strong>volves air flow that imp<strong>in</strong>ges<br />
on the seeds as they are discharged from the feeder on<strong>to</strong><br />
the conveyor trays. The air is then emitted as dust jet both <strong>in</strong>side<br />
and outside of the mill. Convey<strong>in</strong>g, and <strong>in</strong> particular pneumoconvey<strong>in</strong>g,<br />
contributes considerably <strong>to</strong> dust emanation <strong>in</strong> the mill<br />
work<strong>in</strong>g environments as well. <strong>Dust</strong> is also generated from seed<br />
del<strong>in</strong>t<strong>in</strong>g and hull<strong>in</strong>g, and dur<strong>in</strong>g the separation of kernels from<br />
hulls. (1,3) Specifically, <strong>in</strong> preparation for press<strong>in</strong>g and oil extraction,<br />
l<strong>in</strong>ters are removed from the seeds and the del<strong>in</strong>tered seeds<br />
are conveyed <strong>to</strong> the hull<strong>in</strong>g-separation apparatus, where seed<br />
embryos (meats) are separated from the seed coat (hull). Handl<strong>in</strong>g,<br />
displacement, charg<strong>in</strong>g, and discharg<strong>in</strong>g of cot<strong>to</strong>nseed<br />
cakes also contribute <strong>to</strong> the emergence of dust dur<strong>in</strong>g normal<br />
processes <strong>in</strong> the cot<strong>to</strong>nseed oil manufactur<strong>in</strong>g <strong>in</strong>dustry.<br />
Sometimes dust levels <strong>in</strong> cot<strong>to</strong>nseed oil mills may be higher<br />
than any accepted occupational health standard, pos<strong>in</strong>g a threat<br />
<strong>to</strong> the workers’ well-be<strong>in</strong>g. Indeed, <strong>in</strong>creased amounts of airborne<br />
f<strong>in</strong>e particles were reported <strong>in</strong> dust-laden air <strong>in</strong> cot<strong>to</strong>nseed<br />
oil mills, (4) with an average of ∼28% oil content. (5) Nonuniform<br />
cot<strong>to</strong>n dust composition and size distribution were found <strong>in</strong><br />
hull<strong>in</strong>g-separation departments of cot<strong>to</strong>nseed oil mills (6) , while<br />
dust <strong>in</strong> del<strong>in</strong>t<strong>in</strong>g and bal<strong>in</strong>g work areas was rich <strong>in</strong> cellulosic<br />
components, dust <strong>in</strong> the hull<strong>in</strong>g area had higher prote<strong>in</strong> content.<br />
121
122 S. TABAK ET AL.<br />
<strong>Occupational</strong> <strong>Exposure</strong> <strong>to</strong> <strong>Dust</strong> <strong>in</strong> Cot<strong>to</strong>nseed <strong>Oil</strong> <strong>Mills</strong><br />
<strong>Occupational</strong> exposure <strong>to</strong> bioactive dust is oftentimes found<br />
<strong>in</strong> the cot<strong>to</strong>n, hemp, flax, and sisal <strong>in</strong>dustries. Susceptible workers<br />
that are exposed via <strong>in</strong>halation <strong>to</strong> bioactive agents such as<br />
bacterial endo<strong>to</strong>x<strong>in</strong> may develop reversible acute lung disorders<br />
and allergic reactions. (7,8) Repeated exposures <strong>to</strong> cot<strong>to</strong>n<br />
dust may lead <strong>to</strong> chronic bronchitis, emphysema, and byss<strong>in</strong>osis,<br />
a disabl<strong>in</strong>g asthma-like respira<strong>to</strong>ry disease which is characterized<br />
by decrement <strong>in</strong> the forced expira<strong>to</strong>ry volume <strong>in</strong> one<br />
second (FEV1). (9) Controll<strong>in</strong>g the dust level <strong>in</strong> the mill reduces<br />
the risks of adverse health effects <strong>to</strong> workers, decreases<br />
the worker discomfort, and helps ma<strong>in</strong>ta<strong>in</strong> the plant<br />
facilities. (10)<br />
To prevent occupational exposure lead<strong>in</strong>g <strong>to</strong> byss<strong>in</strong>osis and<br />
other disabl<strong>in</strong>g respira<strong>to</strong>ry diseases, the textile and yarn manufactur<strong>in</strong>g<br />
<strong>in</strong>dustries, among other workplaces, are required <strong>to</strong><br />
comply with the occupational safety and health standards promulgated<br />
under the <strong>Occupational</strong> Safety and Health Act of 1970.<br />
In the act, the National Institute for <strong>Occupational</strong> Safety and<br />
Health (NIOSH) was authorized <strong>to</strong> develop and establish recommended<br />
occupational safety and health standards, and <strong>to</strong> conduct<br />
research and experimental programs for development and<br />
improvement of criteria for occupational safety and health standards.<br />
Specific <strong>to</strong> the cot<strong>to</strong>n and yarn <strong>in</strong>dustries, employers are<br />
required <strong>to</strong>: (1) limit the amount of respirable cot<strong>to</strong>n dust <strong>in</strong><br />
the air by utiliz<strong>in</strong>g dust control measures (i.e. efficient ventilation,<br />
enclos<strong>in</strong>g the process equipment and plac<strong>in</strong>g it under<br />
negative pressure); (2) provide provisions for medical moni<strong>to</strong>r<strong>in</strong>g<br />
of workers; (3) supply the workers with personal protective<br />
equipment; and (4) <strong>in</strong>clude adm<strong>in</strong>istrative controls<br />
(i.e. rules and policies such as the requirement <strong>to</strong> use face<br />
masks).<br />
In contrast with the National Ambient Air Quality Standards<br />
(NAAQS), set by the Environmental Protection Agency (EPA)<br />
for regulat<strong>in</strong>g ambient levels of PM10,PM2.5, and other criteria<br />
pollutants, the NIOSH Recommended <strong>Exposure</strong> Limits (RELs)<br />
and the OSHA PELs were set for the purpose of regulat<strong>in</strong>g<br />
threshold levels of worker exposure <strong>to</strong> <strong>in</strong>door (occupational and<br />
residential) airborne contam<strong>in</strong>ants. The current OSHA PEL for<br />
cot<strong>to</strong>n dust (raw) <strong>in</strong> the cot<strong>to</strong>n, textile, and yarn manufactur<strong>in</strong>g<br />
<strong>in</strong>dustries range from 0.2 <strong>to</strong> 1 mg/m3 . These values represent<br />
a time-weighted-average (TWA) concentration that must not be<br />
exceeded dur<strong>in</strong>g any 8-hour work shift <strong>in</strong> a 40-hour workweek.<br />
The NIOSH REL for cot<strong>to</strong>n dust (raw), represent<strong>in</strong>g the highest<br />
allowable airborne concentration that is not expected <strong>to</strong> <strong>in</strong>jure<br />
workers, is set at 0.2 mg/m3 , based on TWA for up <strong>to</strong> 10 hour/day<br />
dur<strong>in</strong>g a 40-hour workweek.<br />
The American Conference of Governmental Industrial Hygienists<br />
(ACGIH ○R<br />
) also set the threshold limit value (TLV ○R<br />
)<br />
for cot<strong>to</strong>n dust at 0.2 mg/m3 . The TLV represents cot<strong>to</strong>n dust<br />
concentration <strong>to</strong> which it is believed that nearly all workers may<br />
be exposed, day after day, without develop<strong>in</strong>g adverse health<br />
effects. Nevertheless, evidence suggests that dust-related accelerated<br />
decl<strong>in</strong>e <strong>in</strong> lung function among cot<strong>to</strong>n textile workers<br />
who smoke occurs even when the 0.2 mg/m 3 standard is strictly<br />
imposed. (11,12)<br />
Although for cot<strong>to</strong>n dust the three <strong>in</strong>door/occupational exposure<br />
limits outl<strong>in</strong>ed above co<strong>in</strong>cide, only the OSHA PEL has<br />
an enforcement power as a legal standard. Therefore, it is noteworthy<br />
that although OSHA PELs for cot<strong>to</strong>n dust exist for specific<br />
operations and <strong>in</strong>dustries (e.g., yarn manufactur<strong>in</strong>g, cot<strong>to</strong>n<br />
wash<strong>in</strong>g, textile waste houses, slash<strong>in</strong>g and weav<strong>in</strong>g operations,<br />
cot<strong>to</strong>n waste recycl<strong>in</strong>g and garnett<strong>in</strong>g), there is unfortunately<br />
no specific PEL for cot<strong>to</strong>n dust <strong>in</strong> cot<strong>to</strong>nseed oil mills. Accord<strong>in</strong>gly,<br />
although workers <strong>in</strong> cot<strong>to</strong>nseed oil mills (and other<br />
nontextile cot<strong>to</strong>n <strong>in</strong>dustries) breath dust similar <strong>in</strong> content and<br />
size distribution <strong>to</strong> the dust found <strong>in</strong> the textile <strong>in</strong>dustry, (13)<br />
and although such dust is known <strong>to</strong> <strong>in</strong>duce respira<strong>to</strong>ry diseases,<br />
such as byss<strong>in</strong>osis, and lung disorders among susceptible<br />
workers, cot<strong>to</strong>nseed process<strong>in</strong>g operations have no specificlegal<br />
standard.<br />
The OSHA recommended sampl<strong>in</strong>g procedure for determ<strong>in</strong><strong>in</strong>g<br />
occupational exposure <strong>to</strong> l<strong>in</strong>t-free respirable cot<strong>to</strong>n dust utilizes<br />
a vertical elutria<strong>to</strong>r cot<strong>to</strong>n dust sampler (or an equivalent),<br />
with a particle size cu<strong>to</strong>ff at approximately 15 µm aerodynamic<br />
diameter when operat<strong>in</strong>g at a flow rate of 7.4 ± 0.2 L/m<strong>in</strong>. (14)<br />
Elutriated dust concentrations <strong>in</strong> cot<strong>to</strong>nseed oil mills are expected<br />
<strong>to</strong> be almost uniform over the whole work<strong>in</strong>g area, with<br />
an average vary<strong>in</strong>g from 0.5 <strong>to</strong> 2.0 mg/m. (3,11) In fact, this assumption<br />
is prerequisite if workers’ exposures <strong>to</strong> cot<strong>to</strong>n dust is<br />
<strong>to</strong> be surrogated by dust concentrations measured by a stationary<br />
central vertical elutria<strong>to</strong>r. Yet both Parnel et al. (3) and Matlock<br />
et al. (15) reported nonuniform dust concentrations, with consistently<br />
higher dust concentrations <strong>in</strong> the hull<strong>in</strong>g-separation and<br />
the clean<strong>in</strong>g areas.<br />
The objectives of this work was <strong>to</strong> collect data on respirable<br />
dust levels dur<strong>in</strong>g normal process operations <strong>in</strong> a high-capacity<br />
hull<strong>in</strong>g-separation department of a modern cot<strong>to</strong>nseed oil mill,<br />
and <strong>to</strong> use these data for evaluat<strong>in</strong>g the recommended method<br />
for assess<strong>in</strong>g occupational exposure <strong>to</strong> cot<strong>to</strong>n dust <strong>in</strong> cot<strong>to</strong>nseed<br />
oil mills. Consequently, airborne cot<strong>to</strong>n dust was analyzed <strong>in</strong><br />
terms of (1) <strong>to</strong>tal and elutriated airborne mass, and (2) particle<br />
size distribution. Elutriated concentrations collected by OSHA’s<br />
recommended vertical elutria<strong>to</strong>r method were correlated aga<strong>in</strong>st<br />
<strong>to</strong>tal mass concentrations measured by stationary and rov<strong>in</strong>g<br />
personal samplers, <strong>in</strong> order <strong>to</strong> predict the workers’ exposure via<br />
<strong>in</strong>halation <strong>to</strong> cot<strong>to</strong>n dust.<br />
METHODS AND PROCEDURE<br />
Data were collected dur<strong>in</strong>g 1996 <strong>in</strong> the hull<strong>in</strong>g-separation department<br />
of a modern cot<strong>to</strong>nseed oil mill <strong>in</strong> Uzbekistan, which<br />
processed 1200 <strong>to</strong>ns/day of cot<strong>to</strong>nseed. A double hull<strong>in</strong>g-separation<br />
scheme was applied <strong>in</strong> the mill dur<strong>in</strong>g the data acquisition.<br />
The mill was equipped with new cot<strong>to</strong>nseed cleaners, disk<br />
hullers, and separa<strong>to</strong>rs of kernel and hull fractions. The layout<br />
of the second floor of the hull<strong>in</strong>g-separation room, <strong>in</strong> which the<br />
process equipment is located, is shown <strong>in</strong> Figure 1. Both the
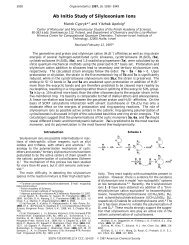
FIGURE 1<br />
The second floor plan of the hull<strong>in</strong>g-separation room <strong>in</strong> the<br />
mill. H1, H2, S1, and S2 are the hullers and shakers <strong>in</strong> the first<br />
and second hull<strong>in</strong>g-separation l<strong>in</strong>es, respectively. V(1) and<br />
SP(1) are the sampl<strong>in</strong>g locations of the vertical elutria<strong>to</strong>rs and<br />
the stationary personal samplers, respectively. Dimensions<br />
are <strong>in</strong> mm.<br />
disk hullers and the shakers were significant dust sources; the<br />
hullers (rotat<strong>in</strong>g at 1000–1200 rpm) as a result of air jet discharged<br />
<strong>to</strong>gether with the hulled seeds, and the shakers due <strong>to</strong><br />
the hulled seed separation. The air jet issued from the hullers<br />
<strong>in</strong>creased the pressure <strong>in</strong> the enclosure over the shakers, significantly<br />
boost<strong>in</strong>g emission of dust <strong>to</strong> the work<strong>in</strong>g environment.<br />
In contrast, the hull beaters <strong>in</strong> the first floor of the hull<strong>in</strong>gseparation<br />
room were fully enclosed and under negative pressure,<br />
thus efficiently prevent<strong>in</strong>g dust buildup and spread <strong>in</strong><strong>to</strong><br />
the work<strong>in</strong>g environment. All workers were supplied with personal<br />
respira<strong>to</strong>rs but these were used only occasionally, ma<strong>in</strong>ly<br />
when dust concentrations were extremely high and affected the<br />
visibility.<br />
Gravimetric Concentration Measurement<br />
Vertical Elutria<strong>to</strong>rs<br />
In accordance with the <strong>Occupational</strong> Safety and Health Standard,<br />
(14) concentrations of l<strong>in</strong>t-free respirable cot<strong>to</strong>n dust were<br />
determ<strong>in</strong>ed by two vertical elutria<strong>to</strong>r cot<strong>to</strong>n dust samplers (Sierra<br />
Instruments Inc., Carmel Valley, CA). The vertical elutria<strong>to</strong>r<br />
(VE) is a size-selective area sampler with a particle size cu<strong>to</strong>ff<br />
at 15 µm aerodynamic diameter when operat<strong>in</strong>g at a flow rate<br />
of 7.4 ± 0.2 L/m<strong>in</strong>. For sampl<strong>in</strong>g airborne dust at typical human<br />
breath<strong>in</strong>g height, the VEs were set with their <strong>in</strong>lets ∼1.6 m<br />
above the floor. <strong>Dust</strong> samples were collected on 37 mm polyv<strong>in</strong>yl<br />
chloride filters with a 5 µm pore size (SKC Inc., Eighty Four,<br />
PA). Samples were gathered simultaneously by two vertical elutria<strong>to</strong>rs<br />
<strong>in</strong> a <strong>to</strong>tal of seven locations (see Figure 1) adjacent <strong>to</strong><br />
the huller-separ<strong>to</strong>r pairs, provid<strong>in</strong>g representative samples of air<br />
<strong>to</strong> which the workers were exposed. Each sampl<strong>in</strong>g po<strong>in</strong>t was<br />
sampled at random multiple times (see Table I).<br />
OCCUPATIONAL EXPOSURE TO COTTON DUST 123<br />
Personal Samplers<br />
Sampl<strong>in</strong>g of <strong>to</strong>tal dust mass <strong>in</strong> the hull<strong>in</strong>g-separation room<br />
was carried out by stationary personal samplers (SPSs) sampl<strong>in</strong>g<br />
at breath<strong>in</strong>g height, and by personal samplers attached <strong>to</strong> workers<br />
(RPSs) and sampl<strong>in</strong>g the breath<strong>in</strong>g zone. Open-face type<br />
stationary personal samplers were used, collect<strong>in</strong>g samples on<br />
37 mm polyv<strong>in</strong>yl chloride filters with a 5 µm pore size (SKC<br />
Inc.). Total mass concentrations were measured simultaneously<br />
by four stationary personal samplers <strong>in</strong> a <strong>to</strong>tal of 15 locations<br />
with<strong>in</strong> the hull<strong>in</strong>g-separation room (see Figure 1), provid<strong>in</strong>g<br />
representative samples of air at breath<strong>in</strong>g height. Each sampl<strong>in</strong>g<br />
po<strong>in</strong>t was sampled at random multiple times (see Table I).<br />
IOM Inhalable <strong>Dust</strong> Samplers (SKC Inc.) with reusable filter<br />
cassettes and sampl<strong>in</strong>g heads designed <strong>to</strong> better measure the<br />
worker exposure <strong>to</strong> <strong>to</strong>tal airborne particulate matter (PM) were<br />
used as rov<strong>in</strong>g samplers (RPSs). Each sampler was made of a<br />
37 mm cyl<strong>in</strong>der with a 15 mm circular open<strong>in</strong>g shaped like a th<strong>in</strong><br />
lip protrud<strong>in</strong>g outward from one of its ends. The samplers were<br />
attached <strong>to</strong> personal air pumps (M<strong>in</strong>e Safety Appliances Co.,<br />
Pittsburgh, PA) that drew air at 2.0 L/m<strong>in</strong>. Theoretically, such<br />
air flow enables the IOM sampler <strong>to</strong> effectively collect particles<br />
with a diameter up <strong>to</strong> 100 µm. (16) The sampler filter cassette held<br />
a25mmfilter with a 5 µm pore size. The cassette and the filter<br />
were weighed <strong>to</strong>gether before and after sampl<strong>in</strong>g. Therefore,<br />
dust on both the filter and the <strong>in</strong>ner walls of the cassette is<br />
conta<strong>in</strong>ed <strong>in</strong> the data, which typically <strong>in</strong>clude large particles that<br />
are considered <strong>in</strong>halable but nonrespirable (10 < d < 100 µm).<br />
Sampl<strong>in</strong>g was performed by 6–8 samplers simultaneously. The<br />
worker mobility dur<strong>in</strong>g sampl<strong>in</strong>g was restricted <strong>to</strong> prescribed<br />
locations and their neighborhoods (see Table I).<br />
Weigh<strong>in</strong>g<br />
In accordance with the OSHA guidel<strong>in</strong>es, sampl<strong>in</strong>g lasted<br />
8 hours dur<strong>in</strong>g normal operat<strong>in</strong>g conditions and was repeated<br />
16–42 times at each location. The calibration of all samplers<br />
was checked frequently. An analytical balance with sensitivity<br />
of 10 µg (Sar<strong>to</strong>rius AG, Gött<strong>in</strong>gen, Germany), located <strong>in</strong><br />
a dust-free air-conditioned room with temperature and relative<br />
humidity set at 24 ◦ C and 45 percent, respectively, was used<br />
for weigh<strong>in</strong>g. The filters were held <strong>in</strong> the weigh<strong>in</strong>g room for<br />
24 hours prior <strong>to</strong> weigh<strong>in</strong>g. Three blank (control) filters as well<br />
as a reference mass of approximately the same weight as the<br />
filter were weighed <strong>to</strong>gether with the filters. The field blanks<br />
were used <strong>to</strong> correct the weight of the field samples. (17,18) <strong>Dust</strong><br />
concentration was calculated by divid<strong>in</strong>g the adjusted mass collected<br />
on the filters by the volume of sampled air.<br />
Particle Size Measurement<br />
<strong>Dust</strong> samples for particle size analysis were collected with the<br />
same sampl<strong>in</strong>g equipment used for gravimetric analysis. (19,20)<br />
The most efficient filters for collect<strong>in</strong>g ambient airborne particles<br />
for subsequent size analysis are membrane filters made of<br />
cellulose esters. (18) These filters are soluble <strong>in</strong> ace<strong>to</strong>ne, mak<strong>in</strong>g<br />
it possible <strong>to</strong> dissolve the filter and collect the deposits on
124<br />
TABLE I<br />
Cot<strong>to</strong>n dust concentrations <strong>in</strong> the hull<strong>in</strong>g-separation room at the sampl<strong>in</strong>g locations shown <strong>in</strong> Figure 1<br />
Vertical elutria<strong>to</strong>r Rov<strong>in</strong>g personal sampler<br />
Sampler # of Mean SD M<strong>in</strong>. Max. # of Mean SD M<strong>in</strong>. Max.<br />
location samples [mg/m3 ] [mg/m3 ] [mg/m3 ] [mg/m3 ] samples [mg/m3 ] [mg/m3 ] [mg/m3 ] [mg/m3 ]<br />
V1 33 7.21 5.64 1.16 28.1 28 15.24 12.04 3.18 84.52<br />
V2 42 3.83 4.12 0.62 8.62 24 14.87 13.12 2.96 86.35<br />
V3 28 5.89 4.11 0.38 23.8 24 15.92 12.48 4.11 116.27<br />
V4 36 1.61 1.23 0.1 4.18 31 5.46 5.11 0.46 26.95<br />
V5 38 4.81 2.84 0.42 13 23 12.54 10.16 2.18 68.18<br />
V6 38 3.25 2.14 0.18 16.3 28 11.06 8.96 1.84 74.25<br />
V7 26 6.94 3.86 0.74 32.1 27 14.58 12.31 0.98 84.14<br />
Weighted average 4.60 4.03<br />
Stationary personal sampler<br />
SP1 18 18.24 16.22 2.12 49.9 22 19.32 14.89 2.63 174.54<br />
SP2 16 11.38 8.12 0.63 32.4 28 16.88 16.35 2.19 112.96<br />
SP3 32 17.85 14.26 3.04 169 21 18.65 15.86 3.84 156.18<br />
SP4 28 13.65 11.83 0.82 56.8 22 15.86 12.95 3.81 76.19<br />
SP5 27 14.68 11.28 1.08 72.6 29 16.25 11.8 4.29 58.87<br />
SP6 31 16.45 12.46 0.31 82.4 26 16.92 9.24 3.32 136.49<br />
SP7 22 6.83 6.56 0.62 41.4 23 8.12 4.14 0.72 52.19<br />
SP8 28 4.43 3.18 1.14 12.1 26 6.89 3.78 0.84 54.27<br />
SP9 29 6.12 4.92 0.83 22.3 21 9.14 6.18 0.79 59.21<br />
SP10 28 12.58 11.06 0.56 56.2 24 18.43 15.86 2.71 126.81<br />
SP11 19 15.14 12.82 1.06 34.9 28 17.94 16.19 1.28 49.16<br />
SP12 29 16.35 7.35 1.19 48.2 27 18.51 12.09 3.31 86.48<br />
SP13 17 10.95 9.58 0.95 27.4 29 14.89 10.26 3.28 39.35<br />
SP14 17 13.1 14.26 1.26 39.2 26 16.23 14.39 2.12 52.18<br />
SP15 22 14.1 15.29 0.62 68.3 25 17.43 18.59 1.88 84.52<br />
Weighted average 12.49 11.67 14.53 12.70
surfaces suitable for further exam<strong>in</strong>ation. Mixed Cellulose Esters<br />
(MCE) membrane filters with a 0.45 µm pore size (SKC,<br />
Inc.) were used <strong>in</strong> the vertical elutria<strong>to</strong>rs for this purpose. Sampl<strong>in</strong>g<br />
was carried on for 30–60 m<strong>in</strong> <strong>to</strong> get an adequate deposition<br />
of dust on the filters but <strong>to</strong> avoid overload<strong>in</strong>g. Post exposure, the<br />
filters were placed on dry microscope slides above an ace<strong>to</strong>ne<br />
bath, the vapors of which rendered the filters transparent with<strong>in</strong><br />
a few m<strong>in</strong>utes. After dry<strong>in</strong>g for five m<strong>in</strong>utes, the filters were<br />
ready for further analysis.<br />
Size measurements were performed with a computer vision<br />
and image process<strong>in</strong>g system (BarGold Electronics Ltd., Haifa,<br />
Israel), which is a digital signal processor (DSP) video system<br />
that captures images of particles on the transparent filter and<br />
subsequently analyzes their size. The hardware consists of a<br />
charge-coupled devices (CCD) camera with magnify<strong>in</strong>g lenses<br />
and a dedicated illum<strong>in</strong>ation source. The CCD is an array of pho<strong>to</strong>sites<br />
(pixels) on a silicon substrate that record light as electrical<br />
signal by convert<strong>in</strong>g pho<strong>to</strong>ns <strong>to</strong> electrons. The sensitivity of a<br />
standard CCD with ∼50 percent quantum efficiency (the number<br />
of pho<strong>to</strong>ns converted <strong>to</strong> electrons) is tenfold that of the fastest<br />
film. A high performance stand-alone image process<strong>in</strong>g system<br />
was used for analyz<strong>in</strong>g the particle images. This unit consists of<br />
a proprietary software that outputs the particle size distribution<br />
among other statistics.<br />
RESULTS<br />
Table I lists average dust concentrations measured <strong>in</strong> the second<br />
floor of the hull<strong>in</strong>g-separation room. The weighted average<br />
elutriated concentration was 4.60 ± 4.03 mg/m 3 (n = 241, where<br />
n is the number of filters analyzed). This concentration is more<br />
than fourfold the OSHA PEL for cot<strong>to</strong>n dust <strong>in</strong> the cot<strong>to</strong>n textile<br />
<strong>in</strong>dustry (1 mg/m 3 ), and is higher with<strong>in</strong> more than an order<br />
of magnitude than the recommended advisory exposure guidel<strong>in</strong>es,<br />
the NIOSH REL and the ACGIH TLV, for cot<strong>to</strong>n dust<br />
(0.2 mg/m 3 ). In fact, local average concentrations were much<br />
higher than the action level of any yarn, cot<strong>to</strong>n, and textile<br />
operation (see Table I). Total mass concentrations measured<br />
by the stationary personal samplers <strong>in</strong> adjacent locations averaged<br />
12.49 ± 11.67 mg/m 3 (n = 363). <strong>Dust</strong> concentration measured<br />
by the rov<strong>in</strong>g personal samplers averaged 14.53 ± 12.7<br />
mg/m 3 (n = 562). The huge difference <strong>in</strong> airborne dust concentrations<br />
measured by the <strong>to</strong>tal mass samplers and the vertical<br />
elutria<strong>to</strong>rs resulted ma<strong>in</strong>ly from a considerable amount of short<br />
nonrespirable airborne fibers (l<strong>in</strong>t; see also Discussion section).<br />
The highest elutriated concentrations were found <strong>in</strong> between<br />
the huller-separa<strong>to</strong>r pairs (<strong>in</strong> locations V1, V3, V5, V7, see<br />
Figure 1). The stationary personal samplers (SPSs), however, did<br />
not give such dist<strong>in</strong>ctive results. M<strong>in</strong>imum read<strong>in</strong>gs by any measurement<br />
technique were achieved <strong>in</strong> the alley between the two<br />
rows of huller-separa<strong>to</strong>r pairs (<strong>in</strong> locations V4, SP7, SP8, and<br />
SP9). This f<strong>in</strong>d<strong>in</strong>g was predicted based on the huller-separa<strong>to</strong>r<br />
design and the central feed<strong>in</strong>g of the two huller rows, caus<strong>in</strong>g<br />
dust emanation away from the symmetry plane <strong>in</strong> Figure 1.<br />
Similarly, read<strong>in</strong>gs of personal samplers attached <strong>to</strong> opera<strong>to</strong>rs<br />
OCCUPATIONAL EXPOSURE TO COTTON DUST 125<br />
spend<strong>in</strong>g more time near the locations V4, SP7, SP8, and SP9<br />
were much lower (50% or less) than those of workers <strong>in</strong> other<br />
locations (Table I). The high concentrations of cot<strong>to</strong>n dust reported<br />
here are <strong>in</strong> good agreement with the f<strong>in</strong>d<strong>in</strong>gs of Matlock<br />
et al., (15) who found an average concentration of 13.2 mg/m 3<br />
<strong>in</strong> the hull<strong>in</strong>g and clean<strong>in</strong>g area, and of Parnell et al., (3) who<br />
found that the hull<strong>in</strong>g-separation room had consistently higher<br />
dust concentrations than other regions <strong>in</strong> the mill.<br />
Typical size distributions of cot<strong>to</strong>n dust particulate matter<br />
generated dur<strong>in</strong>g normal operations <strong>in</strong> the hull<strong>in</strong>g-separation<br />
room are listed <strong>in</strong> Table II. About 30–60 percent (by count) of the<br />
measured particles were < 2 µm, and ∼70–90 percent had a diameter<br />
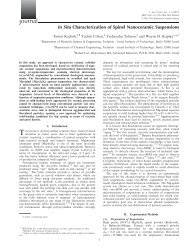
< 8 µm. Figures 2a and 2b depict two typical examples of<br />
FIGURE 2<br />
Size distribution of dust particles collected by vertical elutria<strong>to</strong>r<br />
<strong>in</strong> sampl<strong>in</strong>g locations V2 (a) and V5 (b). The area of each bar<br />
is proportional <strong>to</strong> the sample number fraction <strong>in</strong> that size b<strong>in</strong>.
126 S. TABAK ET AL.<br />
TABLE II<br />
Size distribution of cot<strong>to</strong>n dust particles collected by the vertical elutria<strong>to</strong>r.<br />
Data are given <strong>in</strong> terms of frequency [%] and standardized frequency [% µm −1 ]<br />
B<strong>in</strong> size<br />
Sampl<strong>in</strong>g 0.5–1 1–2 2–4 4–8 8–16 16–32 32–64 64–128<br />
po<strong>in</strong>t [µm] [µm] [µm] [µm] [µm] [µm] [µm] [µm]<br />
Mean<br />
size<br />
[µm]<br />
[%] 15.4 44.2 20 11.2 5.1 2.65 1.45<br />
V1 3.99<br />
[% µm −1 ] 30.8 44.2 10 2.8 0.6 0.2 0.05<br />
[%] 16.7 32.2 27.8 16.7 2.2 2.2 1.7 0.5<br />
V2 4.53<br />
[% µm −1 ] 33.4 32.2 13.9 4.2 0.3 0.15 0.05 0.01<br />
[%] 29.7 23 23 11.5 5.5 5.5 1.8<br />
V3 4.79<br />
[% µm −1 ] 59.4 23 11.5 2.9 0.7 0.34 0.06<br />
[%] 13.4 19.1 34.3 13.4 8.6 7.62 2.9 0.95<br />
V4 4.39<br />
[% µm −1 ] 26.8 19.1 17.2 3.4 1.1 0.5 0.1 0.01<br />
[%] 16.3 23.1 21 11.6 9.6 6.7 5.8<br />
V5 7.34<br />
[% µm −1 ] 32.6 23.1 10.5 2.9 1.2 0.4 0.2<br />
[%] 19.2 20 36.9 16.2 4.6 2.3 0.8<br />
V6 3.08<br />
[% µm −1 ] 38.4 20 18.5 4.1 0.6 0.14 0.03<br />
[%] 14.1 22.8 37 19.7 3.2 2.4 0.8<br />
V7 4.47<br />
[% µm −1 ] 28.2 22.8 18.5 4.9 0.4 0.15 0.01<br />
the particle number distribution <strong>in</strong> the hull<strong>in</strong>g-separation room<br />
<strong>in</strong> terms of the ratio between the particle fraction accommodated<br />
<strong>in</strong> each b<strong>in</strong> (%) and the average particle size <strong>in</strong> the b<strong>in</strong><br />
(µm). This presentation makes the area of any bar <strong>in</strong> the his<strong>to</strong>gram<br />
(“the area under the curve”) proportional <strong>to</strong> the fraction<br />
of particles measured <strong>in</strong> that size range. With the exception<br />
of size distributions measured <strong>in</strong> the locations V1 and V3, the<br />
former due <strong>to</strong> a relatively high read<strong>in</strong>g <strong>in</strong> the second b<strong>in</strong> (1–<br />
2 µm) and the latter due <strong>to</strong> a relatively high read<strong>in</strong>g <strong>in</strong> the first<br />
b<strong>in</strong> (0.5–1 µm), the shape of the cot<strong>to</strong>n dust aerosol is generally<br />
preserved. Therefore, it seems that the size distribution of<br />
the coarse fraction (> 0.5 µm) of dust <strong>in</strong> the mill is <strong>in</strong>dependent<br />
of the <strong>to</strong>tal amount of dust suspended <strong>in</strong> the air and<br />
of the sampl<strong>in</strong>g po<strong>in</strong>t. This result is supported by the fact that,<br />
exclud<strong>in</strong>g the location V5 for be<strong>in</strong>g an outlier, the particle mean<br />
size varied relatively little among the different sampl<strong>in</strong>g<br />
po<strong>in</strong>ts, d ¯=<br />
4.21 ± 0.61 µm (i.e. coefficient of variability of<br />
14.5%).<br />
Figures 2a and 2b show a decrease <strong>in</strong> the particle number<br />
with the <strong>in</strong>crease <strong>in</strong> size. Due <strong>to</strong> lack of size measurements <strong>in</strong><br />
the range d < 0.5 µm, it is impossible <strong>to</strong> conclude whether the<br />
aerosol has an exponential shape, which typically results from<br />
mechanical shap<strong>in</strong>g processes such as cutt<strong>in</strong>g, slic<strong>in</strong>g, gr<strong>in</strong>d<strong>in</strong>g,<br />
and pound<strong>in</strong>g, (21) or a trimmed lognormal shape, which<br />
frequently describes the shape of an ambient aged aerosol. (22)<br />
Regardless, a large fraction of the dust emanated dur<strong>in</strong>g normal<br />
operations <strong>in</strong> the cot<strong>to</strong>nseed oil mill is respirable. Due <strong>to</strong> its biogenic<br />
composition it has the potential <strong>to</strong> irritate the respira<strong>to</strong>ry<br />
airways, and therefore this dust is considered an occupational<br />
hazard. From an eng<strong>in</strong>eer<strong>in</strong>g perspective, this imposes str<strong>in</strong>gent<br />
requirements on the solutions that should be employed <strong>to</strong> control<br />
dust emanation and workplace PM levels. Namely, suction<br />
of air and ma<strong>in</strong>ta<strong>in</strong><strong>in</strong>g of negative pressure <strong>in</strong> the enclosures of<br />
the technological equipment, and effective removal of f<strong>in</strong>e dust<br />
particles from the air are the core requirements from any air<br />
clean<strong>in</strong>g system.
DISCUSSION<br />
Our results show a considerable variation <strong>in</strong> dust levels <strong>in</strong><br />
the hull<strong>in</strong>g-separation room, with the highest read<strong>in</strong>gs obta<strong>in</strong>ed<br />
<strong>in</strong> between huller-separa<strong>to</strong>r units on the same row. This is <strong>in</strong><br />
accordance with the f<strong>in</strong>d<strong>in</strong>gs of Jones et al. (11) that average dust<br />
concentrations <strong>in</strong> cot<strong>to</strong>nseed oil mills were nonuniform, rang<strong>in</strong>g<br />
from 0.3 <strong>to</strong> 7.6 mg/m3 . Clearly, though, the spatial concentration<br />
variation is specific <strong>to</strong> the arrangement of the technological<br />
equipment <strong>in</strong> the mill, and therefore has <strong>to</strong> be exam<strong>in</strong>ed <strong>in</strong> any<br />
particular mill before conclusions can be drawn.<br />
The <strong>in</strong>homogeneity of cot<strong>to</strong>n dust concentrations <strong>in</strong> the<br />
hull<strong>in</strong>g-separation room suggests that stationary samplers per<br />
se may be <strong>in</strong>adequate for assess<strong>in</strong>g the potential occupational<br />
exposure of workers (i.e. the concentrations <strong>in</strong> contact with<br />
humans (23,24) <strong>in</strong> cot<strong>to</strong>nseed oil mills. Specifically, <strong>to</strong> secure a<br />
cont<strong>in</strong>uous and profitable operation of the mill mach<strong>in</strong>ery, at<br />
least some opera<strong>to</strong>rs may be more prone <strong>to</strong> work <strong>in</strong> areas characterized<br />
by a potential for process failure. Such critical operations<br />
<strong>in</strong>clude the cot<strong>to</strong>nseed cake handl<strong>in</strong>g: seed charg<strong>in</strong>g on<strong>to</strong> and<br />
discharge from the feeder, smooth runn<strong>in</strong>g of the pneumoconveyors,<br />
and efficient del<strong>in</strong>t<strong>in</strong>g and hull<strong>in</strong>g of the seeds. Yet these<br />
processes, which frequently require mach<strong>in</strong>ery ma<strong>in</strong>tenance,<br />
are also the ones associated with the major dust emissions <strong>in</strong><br />
the mill.<br />
A valid question is the significance of the small difference<br />
between the read<strong>in</strong>gs of the stationary personal samplers (SPSs)<br />
and those of the rov<strong>in</strong>g samplers (RPSs). We assume that the data<br />
collected by the SPS (designated by X) and the RPS (Y) consist<br />
of <strong>in</strong>dependent random samples drawn from two populations<br />
that are not necessarily identical, s<strong>in</strong>ce Y represents a population<br />
of airborne PM that potentially <strong>in</strong>teracted with the worker (i.e.,<br />
were affected by its mere presence or were biasedly sampled as<br />
a result of the worker’s task). However, test<strong>in</strong>g the hypothesis<br />
H0:µx = µy when σ 2 x = σ 2 y (the Behrens-Fisher problem) is<br />
one of the acknowledged unsolved problems <strong>in</strong> statistics, which<br />
is worked out only by approximation methods. (25) Yet when<br />
σ 2 x = σ 2 y = σ 2 accept<strong>in</strong>g or reject<strong>in</strong>g H0 follows a standard<br />
two-sample t-test. Thus, <strong>in</strong> order <strong>to</strong> be able <strong>to</strong> compare the two<br />
samples (SPS vs. RPS) the test of H0:σ 2 x = σ 2 y should precede<br />
the test of H0:µx = µy. To test the hypothesis H0:σ 2 x = σ 2 y versus<br />
H1:σ 2 x = σ 2 y we employ a standard F-test for X ∼ N(µx,σ2 x ) and<br />
Y ∼ N(µy,σ2 y ); H0 is accepted at the α level of significance if<br />
F1−α/2,m−1,n−1 < S2 y<br />
S 2 x<br />
OCCUPATIONAL EXPOSURE TO COTTON DUST 127<br />
< Fα/2,m−1,n−1. [1]<br />
Tak<strong>in</strong>g the level of significance at α = 2% and us<strong>in</strong>g the data <strong>in</strong><br />
Table I H0 cannot be rejected, and we therefore accept the null<br />
assumption that the SPSs and the RPSs drew air samples (at proximate<br />
locations) from populations hav<strong>in</strong>g identical variance. In<br />
fact, s<strong>in</strong>ce Sy/Sx ∼ = 1 and the sample size is large (Table I), the<br />
central limit theorem implies that the t-test is robust enough <strong>to</strong><br />
withstand small deviations from the null assumption. (26)<br />
Next, we test the hypotheses H0:µx = µy versus H1:µx =<br />
µy, employ<strong>in</strong>g a standard t-test for two <strong>in</strong>dependent random<br />
samples: X ∼ N(µx,σ 2 ) and Y ∼ N(µy,σ 2 ). Def<strong>in</strong><strong>in</strong>g the<br />
pooled variance,<br />
S 2 p = (n − 1)S2 x + (m − 1)S2 y<br />
, [2]<br />
n + m − 2<br />
where n and m are the sample size of SPS and RPS, respectively,<br />
and<br />
T = ¯X − ¯Y − (µx − µy)<br />
, [3]<br />
Sp<br />
1<br />
n<br />
+ 1<br />
m<br />
H0 is accepted at the α level of significance if −tα/2,n+m−2 <<br />
T < tα/2,n + m−2. Our data show that at 5 percent level of significance<br />
H0 should be rejected, suggest<strong>in</strong>g that the SPSs and the<br />
RPSs sample different populations. The power of this calculation<br />
(associated with mak<strong>in</strong>g a Type II error—accept<strong>in</strong>g a false H0)<br />
is 0.7, i.e. β = 30%. It is noteworthy that, rigorously, both the F<br />
and t tests are suitable for normal populations rather than <strong>to</strong> lognormal<br />
(or other) populations, which usually better represent<br />
the size distribution of airborne PM. Nevertheless, the probabilistic<br />
behavior of these robust tests for n, m ≫ 1 is usually<br />
m<strong>in</strong>imally affected by the non-normality of the two populations<br />
be<strong>in</strong>g sampled. (25)<br />
A major fraction of the elutriated cot<strong>to</strong>n dust found <strong>in</strong> the<br />
hull<strong>in</strong>g-separation room consisted of respirable particles (Table<br />
II). For quantify<strong>in</strong>g potential exposure of workers <strong>in</strong> the hull<strong>in</strong>gseparation<br />
department <strong>to</strong> respirable cot<strong>to</strong>n dust, a correlation<br />
between the average concentration of cot<strong>to</strong>n dust at breath<strong>in</strong>g<br />
height, as measured by the stationary VEs, and the concentration<br />
actually <strong>in</strong> contact with the workers, as measured by the<br />
RPSs, is required. To accomplish this task, the relationships<br />
among the VE, SPS, and RPS measurements were sought. A<br />
regression analysis between elutriated concentrations (the <strong>in</strong>dependent<br />
variable) and SPS <strong>to</strong>tal mass read<strong>in</strong>gs (the dependent<br />
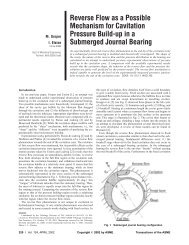
variable) <strong>in</strong> adjacent locations is shown <strong>in</strong> Figure 3.<br />
For low airborne dust load<strong>in</strong>g (< 15 mg/m 3 ) a l<strong>in</strong>ear regression<br />
between the VE and SPS read<strong>in</strong>gs seems <strong>to</strong> be adequate<br />
(R 2 = 0.9972). Differences between the sampler read<strong>in</strong>gs result<br />
from the 15 µm cu<strong>to</strong>ff size of the VE cot<strong>to</strong>n dust sampler,<br />
which read<strong>in</strong>gs therefore do not <strong>in</strong>clude most of the airborne<br />
l<strong>in</strong>t. Yet due <strong>to</strong> their shape these short fibers may still be<br />
<strong>in</strong>halable, (27) as evident from the high concentrations measured<br />
by the RPSs (see Table I). For high airborne dust load<strong>in</strong>g (<strong>to</strong>tal<br />
mass concentration ∼15 mg/m 3 ) there is no correlation between<br />
the VE and SPS read<strong>in</strong>gs. While the <strong>to</strong>tal suspended mass varies<br />
very little, elutriated concentrations almost doubled from < 4<strong>to</strong><br />
> 7 mg/m 3 .<br />
We suggest that the variability <strong>in</strong> VE read<strong>in</strong>gs can be attributed<br />
<strong>to</strong> changes <strong>in</strong> the humidity content of the particulate<br />
matter. The humidity content of the seeds, which <strong>in</strong> order <strong>to</strong> be<br />
accepted <strong>to</strong> the mill should not exceed 12 percent, directly affects
128 S. TABAK ET AL.<br />
FIGURE 3<br />
Regression of <strong>to</strong>tal mass concentrations measured by<br />
stationary personal samplers (SPS) aga<strong>in</strong>st elutriated dust<br />
concentrations (VE) measure simultaneously <strong>in</strong> adjacent<br />
locations. The filled squares are data po<strong>in</strong>ts from Table I, the<br />
horizontal l<strong>in</strong>e is an eye guide only.<br />
the size distribution of dust released dur<strong>in</strong>g hull<strong>in</strong>g-separation–<br />
oil extraction processes. First, the higher the water content of<br />
the dust, the more adhesive the particles are; at high concentrations<br />
this causes the mode of the size distribution <strong>to</strong> shift <strong>to</strong>ward<br />
larger particles. Second, low humidity of the cot<strong>to</strong>nseeds may<br />
lead <strong>to</strong> higher dust concentrations, characterized by a vary<strong>in</strong>g<br />
coarse fraction of particles >15 µm.<br />
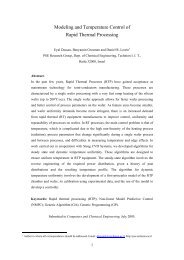
Figure 4 depicts the relationship between the SPS and the<br />
RPS read<strong>in</strong>gs. S<strong>in</strong>ce similar samplers were used for stationary<br />
and the rov<strong>in</strong>g sampl<strong>in</strong>g, and s<strong>in</strong>ce the sampler mode of<br />
operation and the sampl<strong>in</strong>g height were identical, it is a common<br />
error <strong>to</strong> seek a l<strong>in</strong>ear regression between the two data<br />
sets. The positive <strong>in</strong>tercept of such a regression l<strong>in</strong>e is often<br />
taken <strong>to</strong> represent the personal cloud. However, the best l<strong>in</strong>ear<br />
regression l<strong>in</strong>e fitt<strong>in</strong>g our data is characterized by only<br />
R 2 = 0.86, whereas higher order polynomial regressions are<br />
characterized by higher R 2 values (see Figure 4). It seems that<br />
the different dynamics of SPS and RPS sampl<strong>in</strong>g, which can<br />
be attributed ma<strong>in</strong>ly <strong>to</strong> the dist<strong>in</strong>ct sampl<strong>in</strong>g k<strong>in</strong>ematics and<br />
<strong>to</strong> the associated flow fields prevail<strong>in</strong>g at the samplers open<strong>in</strong>gs,<br />
gives rise <strong>to</strong> a nonl<strong>in</strong>ear relationship even among like<br />
samplers.<br />
Figure 5 reveals that the nonl<strong>in</strong>ear relationships presented<br />
<strong>in</strong> Figures 3 and 4 lead <strong>to</strong> a third-order polynomial regression<br />
curve between concentrations measured by VE accord<strong>in</strong>g <strong>to</strong> the<br />
OSHA guidel<strong>in</strong>es and read<strong>in</strong>gs obta<strong>in</strong>ed by personal samplers<br />
attached <strong>to</strong> workers. The nature of the nonl<strong>in</strong>ear relationship<br />
arises from (1) different cu<strong>to</strong>ff size of the samplers, (2) different<br />
dynamics of the samplers, and (3) different conditions at the<br />
sampler <strong>in</strong>lets that reflect on the characteristics of the particle<br />
<strong>in</strong>flux.<br />
FIGURE 4<br />
Regression analysis between average dust concentrations<br />
measured by stationary personal samplers (SPS) and personal<br />
samplers (RPS) attached <strong>to</strong> workers who were work<strong>in</strong>g <strong>in</strong><br />
nearby locations <strong>in</strong> the hull<strong>in</strong>g-separation room. Data (filled<br />
squares) were collected simultaneously dur<strong>in</strong>g normal<br />
operation conditions.<br />
Us<strong>in</strong>g the empirical expression given <strong>in</strong> Figure 5, occupational<br />
exposure of workers <strong>in</strong> cot<strong>to</strong>nseed oil mills can be predicted<br />
from measurements made by stationary vertical elutria<strong>to</strong>rs.<br />
Although implementation of this procedure is not<br />
economically sound (due <strong>to</strong> the higher cost of VEs vs. personal<br />
samplers), predictions based on elutriated concentrations may be<br />
more reliable for estimat<strong>in</strong>g the average exposure <strong>to</strong> l<strong>in</strong>t-free respirable<br />
cot<strong>to</strong>n dust of the whole shift. Elutriated concentrations<br />
FIGURE 5<br />
Surrogate <strong>to</strong> cot<strong>to</strong>n dust occupational exposure of workers <strong>in</strong><br />
the hull<strong>in</strong>g-separation room. The solid l<strong>in</strong>e is the best<br />
empirical prediction of respirable particulate matter from<br />
stationary sampl<strong>in</strong>g of airborne PM by vertical elutria<strong>to</strong>r.
are also more convenient and easy <strong>to</strong> obta<strong>in</strong> by an <strong>in</strong>dustrial<br />
hygienist. Nevertheless, without correct<strong>in</strong>g the stationary VEs<br />
read<strong>in</strong>gs us<strong>in</strong>g the third-order polynomial regression curve presented<br />
<strong>in</strong> Figure 5, predictions of worker’s exposure <strong>to</strong> airborne<br />
cot<strong>to</strong>n dust <strong>in</strong> cot<strong>to</strong>nseed oil mills (and possibly other cot<strong>to</strong>n,<br />
textile, and yarn manufactur<strong>in</strong>g <strong>in</strong>dustries) are significantly<br />
underestimated.<br />
There is an ongo<strong>in</strong>g debate whether endo<strong>to</strong>x<strong>in</strong> is the primary<br />
cause of respira<strong>to</strong>ry diseases. However, respira<strong>to</strong>ry disorders<br />
undoubtedly appear <strong>to</strong> be more pronounced <strong>in</strong> people exposed<br />
<strong>to</strong> higher concentrations of airborne endo<strong>to</strong>x<strong>in</strong>. 6−8,27,28 Indeed,<br />
endo<strong>to</strong>x<strong>in</strong> is a more specific <strong>in</strong>dex of exposure <strong>to</strong> cot<strong>to</strong>n dust,<br />
show<strong>in</strong>g a much stronger dose-response relationship, (28) than<br />
airborne dust concentrations obta<strong>in</strong>ed by gravimetric methods.<br />
Therefore, <strong>to</strong> predict occupational exposure more accurately it<br />
will be helpful if endo<strong>to</strong>x<strong>in</strong> could be correlated aga<strong>in</strong>st elutriated<br />
concentrations. This will render endo<strong>to</strong>x<strong>in</strong> as a quantitative,<br />
rather than a qualitative, surrogate marker for the yet unknown<br />
pathogenic components of cot<strong>to</strong>n dust. If such a correlation between<br />
endo<strong>to</strong>x<strong>in</strong> and VE read<strong>in</strong>gs can be found, our results comb<strong>in</strong>ed<br />
with this correlation may provide a way of predict<strong>in</strong>g the<br />
<strong>in</strong>haled endo<strong>to</strong>x<strong>in</strong> dose.<br />
CONCLUSIONS<br />
Nonuniform airborne dust concentrations were found at<br />
breath<strong>in</strong>g height <strong>in</strong> the hull<strong>in</strong>g-separation department of a cot<strong>to</strong>nseed<br />
oil mill. A major fraction of the dust (wt %) consisted of<br />
particles larger than 15 µm. Differences <strong>in</strong> read<strong>in</strong>gs of the vertical<br />
elutria<strong>to</strong>rs, stationary personal samplers, and rov<strong>in</strong>g personal<br />
samplers are statistically significant, and are attributed <strong>to</strong> the dist<strong>in</strong>ct<br />
nature of the sampler dynamics dur<strong>in</strong>g sampl<strong>in</strong>g. The high<br />
<strong>to</strong>tal mass read<strong>in</strong>gs show that workers were exposed <strong>to</strong> very high<br />
levels of nonthoracic airborne dust, which upon <strong>in</strong>halation tends<br />
<strong>to</strong> deposit <strong>in</strong> the extrathoracic airways. The high elutriated mass<br />
concentrations suggest that workers were exposed <strong>to</strong> respirable<br />
cot<strong>to</strong>n dust levels higher than the 1 mg/m 3 OSHA PEL for cot<strong>to</strong>n<br />
dust. Regression analysis was performed on data obta<strong>in</strong>ed by<br />
the stationary vertical elutria<strong>to</strong>rs (<strong>in</strong>dependent variable) and data<br />
gathered by personal samplers attached <strong>to</strong> workers (dependent<br />
variable). The empirical expression obta<strong>in</strong>ed can be used for estimat<strong>in</strong>g<br />
the potential occupational exposure <strong>to</strong> cot<strong>to</strong>n dust of<br />
workers <strong>in</strong> the hull<strong>in</strong>g-separation room of cot<strong>to</strong>nseed oil mills.<br />
For a cot<strong>to</strong>nseed batch characterized by uniform endo<strong>to</strong>x<strong>in</strong> content,<br />
it is reasonable <strong>to</strong> assume that the higher the level of dust<br />
the higher the workers’ exposure <strong>to</strong> potential respira<strong>to</strong>ry disease<br />
<strong>in</strong>duc<strong>in</strong>g bioactive agents.<br />
ACKNOWLEDGMENTS<br />
Semion Tabak gratefully acknowledges support from the<br />
Center for Absorption <strong>in</strong> Science, Israeli M<strong>in</strong>istry of Immigrant<br />
Absorption. The authors would like <strong>to</strong> thank the general<br />
manager of the cot<strong>to</strong>nseed oil mill for allow<strong>in</strong>g the mill <strong>to</strong> be<br />
sampled.<br />
OCCUPATIONAL EXPOSURE TO COTTON DUST 129<br />
REFERENCES<br />
1. Bailey, A.E.; Hilditch, T.P.; Longenecker, H.E.; Markley, K.S.:<br />
Cot<strong>to</strong>nseed and Cot<strong>to</strong>nseed Products. Interscience Publishers, Inc.,<br />
New York (1948).<br />
2. Morey, P.R.: Bract and Leaf <strong>in</strong> the Process Stream <strong>in</strong> Cot<strong>to</strong>nseed<br />
<strong>Oil</strong> <strong>Mills</strong>. Am Indus Hyg Assoc J 42:244–246 (1981).<br />
3. Parnel, C.B.; Gracy, J.A.; Clark, C.P.; et al.: Eng<strong>in</strong>eer<strong>in</strong>g Controls<br />
<strong>to</strong> Lower <strong>Dust</strong> Level <strong>in</strong> Cot<strong>to</strong>nseed <strong>Oil</strong> <strong>Mills</strong>. Transactions of the<br />
ASAE 25(1):170–174 (1982).<br />
4. Smith, K.J.: Status of Cot<strong>to</strong>nseed <strong>Oil</strong> <strong>Mills</strong> Compliance with Environmental<br />
and Safety Regulations. <strong>Oil</strong> Mill Gazetteer 79(11):36–<br />
38 (1975).<br />
5. Tabak, S.; Chernenko, T.; Glushenkova, A.: Lipid Composition of<br />
<strong>Oil</strong> Component <strong>in</strong> <strong>Dust</strong>. J Chem Nat Comp 3:142–143 (1989).<br />
6. Rylander, R.; Morrey, P.; Bethea, R.: Endo<strong>to</strong>x<strong>in</strong> Content <strong>in</strong> Cot<strong>to</strong>nseed<br />
<strong>Oil</strong> Mill <strong>Dust</strong>. Am Indus Hyg Assoc J 44(5):330–332 (1983).<br />
7. Smid, T.; Heederick, D.; Houba, R.; et al.: <strong>Dust</strong> and Endo<strong>to</strong>x<strong>in</strong>-<br />
Related Respira<strong>to</strong>ry Effects <strong>in</strong> the Animal Feed Industry. Am Rev<br />
Respir Dis 146:1474–1479 (1992).<br />
8. Sigsgaard, T.; Pedersen, O.F.; Juul, S.; et al.: Respira<strong>to</strong>ry Disorders<br />
and A<strong>to</strong>py <strong>in</strong> Cot<strong>to</strong>n, Wool, and Other Textile Mill Workers <strong>in</strong><br />
Denmark. Am J Indus Med 22:163–184 (1992).<br />
9. Gl<strong>in</strong>dmeyer, H.V.; Lefant, J.J.; Jones, R.N.; et al.: Cot<strong>to</strong>n <strong>Dust</strong> and<br />
Across-Shift Change <strong>in</strong> FEV1 as Predic<strong>to</strong>rs <strong>to</strong> Annual Change <strong>in</strong><br />
FEV1. Am J Respir Crit Care Med 149:584–590 (1994).<br />
10. Lear, D.H.: Controll<strong>in</strong>g <strong>Dust</strong> <strong>in</strong> Cot<strong>to</strong>nseed and Soybean <strong>Mills</strong>. <strong>Oil</strong><br />
Mill Gazetteer 89(12):36–40,42 (1985).<br />
11. Jones, R.N.; Carr, J.; Gl<strong>in</strong>dmeyer, H.; et al.: Respira<strong>to</strong>ry Health and<br />
<strong>Dust</strong> Levels <strong>in</strong> Cot<strong>to</strong>nseed <strong>Oil</strong> <strong>Mills</strong>. Thorax 32:281–286 (1977).<br />
12. Gl<strong>in</strong>dmeyer, H.W.; Lefant, J.J.; Jones, R.N.; et al.: <strong>Exposure</strong>-<br />
Related Decl<strong>in</strong>es <strong>in</strong> Lung Function of Cot<strong>to</strong>n Textile Workers:<br />
Relationship <strong>to</strong> Current Workplace Standards. Am Rev Respir Dis<br />
144:675–683 (1991).<br />
13. Zey, J.N.; Piacitelli, G.M.; Gones, W.G.: Characterization of Airborne<br />
Cot<strong>to</strong>n <strong>Dust</strong> Concentrations <strong>in</strong> the Non-Textile Cot<strong>to</strong>n Industry.<br />
Am Indus Hyg Assoc J 45(8):538–546 (1984).<br />
14. 43 Fed. Reg. 27351. <strong>Occupational</strong> Safety and Health Adm<strong>in</strong>istration:<br />
<strong>Occupational</strong> <strong>Exposure</strong> <strong>to</strong> Cot<strong>to</strong>n <strong>Dust</strong>; F<strong>in</strong>al Manda<strong>to</strong>ry<br />
<strong>Occupational</strong> Safety and Health Standards. Codified at 29 CFR<br />
1910.1043 (1978), and 50 Fed. Reg. 51120. <strong>Occupational</strong> Safety<br />
and Health Adm<strong>in</strong>istration: <strong>Occupational</strong> <strong>Exposure</strong> <strong>to</strong> Cot<strong>to</strong>n <strong>Dust</strong>;<br />
F<strong>in</strong>al Rule. Codified at 29 CFR 1910.1043 (1985).<br />
15. Matlock, S.W.; Wiederhold, L.R.; Parnel, C.B.: Particle Siz<strong>in</strong>g of<br />
<strong>Dust</strong> Found <strong>in</strong> Cot<strong>to</strong>nseed <strong>Oil</strong> Mill. Transactions of the ASAE<br />
19(5):970–976 (1976).<br />
16. Mark, D.; V<strong>in</strong>cent, J.H.: A New Personal Sampler for Airborne<br />
Total <strong>Dust</strong> <strong>in</strong> Workplaces. Ann Occup Hyg 30:89–102 (1986).<br />
17. H<strong>in</strong>ds, W.C.: Aerosol Technology. Properties, Behavior, and Measurement<br />
of Airborne Particles. John Wiley & Sons, Inc., New York<br />
(1999).<br />
18. Allen, T.: Particle Size Measurement. Chapman and Hall, London<br />
(1990).<br />
19. American Society of Heat<strong>in</strong>g, Refrigeration, and Air Condition<strong>in</strong>g<br />
Eng<strong>in</strong>eers: Handbook of Fundamentals of Heat<strong>in</strong>g, Refrigeration,<br />
and Air Condition<strong>in</strong>g. ASHRAE Inc., Atlanta (1997).<br />
20. American Conference of Governmental Industrial Hygienists:<br />
Advances <strong>in</strong> Air Sampl<strong>in</strong>g. ACGIH, C<strong>in</strong>c<strong>in</strong>nati, OH (1988).<br />
21. Kragelsky, I.V.; Dobych<strong>in</strong>, M.N.; Kombalov, V.S.: Friction and<br />
Wear Calculation Methods. Pergamon Press, Oxford, UK (1982).
130 S. TABAK ET AL.<br />
22. Environmental Protection Agency: Air Quality Criteria for Particulate<br />
Matter, Vol. I. EPA Pub. No. EPA/600/P-95/001bF. EPA,<br />
Wash<strong>in</strong>g<strong>to</strong>n, DC (1996).<br />
23. Lioy, P.: Assess<strong>in</strong>g Total Human <strong>Exposure</strong> <strong>to</strong> Contam<strong>in</strong>ants. Environ<br />
Sci Technol 24(7):938–945 (1990).<br />
24. Georgopoulos, P.G.; Lioy, P.: Conceptual and Theoretical<br />
Aspects of Human <strong>Exposure</strong> and Dose Assessment.<br />
J Expos Anal Environ Epidemiol 4(3):253–285<br />
(1994).<br />
25. Larsen, R.J.; Mark, M.L.: An Introduction <strong>to</strong> Mathematical Statistics<br />
and Its Applications. Prentice-Hall, Englewood Cliffs, NJ<br />
(1986).<br />
26. Johnson, R.A.; Bhattacharyya, G.K.: Statistics Pr<strong>in</strong>ciples and<br />
Methods. John Wiley & Sons, Inc., New York (1992).<br />
27. Broday, D.M.; Fichman, M.; Shapiro, M.; et al.: Motion of<br />
Spheroidal Particles <strong>in</strong> Viscous Vertical Shear Flows. Phys Fluids<br />
10:86–100 (1998).<br />
28. Rylander, R; Hagl<strong>in</strong>d, P.: <strong>Exposure</strong> of Cot<strong>to</strong>n Workers <strong>in</strong> an Experimental<br />
Cardroom with Reference <strong>to</strong> Airborne Endo<strong>to</strong>x<strong>in</strong>s. Environ<br />
Health Perspect 66:83–86 (1986).<br />
29. Castellan, R.M.; Olenchock, S.A.; K<strong>in</strong>sley, K.B.; et al.: Inhaled<br />
Endo<strong>to</strong>x<strong>in</strong> and Decreased Spirometric Values: An <strong>Exposure</strong>–<br />
Response Relation for Cot<strong>to</strong>n <strong>Dust</strong>. N Eng J Med 317:605–610<br />
(1987).