143-156 - International Glaciological Society
143-156 - International Glaciological Society
143-156 - International Glaciological Society

You also want an ePaper? Increase the reach of your titles
YUMPU automatically turns print PDFs into web optimized ePapers that Google loves.
Journal of Glaciology, Vo!. 23, No. 89, 1979<br />
SIMULATED GLACIER SLIDING OVER AN OBSTACLE<br />
By R. BREPSON<br />
(Alsthom-Atlantique, Grenoble<br />
and Laboratoire de Glaciologie du CNRS, 2 rue Tres-Cloitres, 3803 I Grenoble Cedex, France)<br />
ABSTRACT. The sliding of temperate ice over two obstacles with sine-wave profiles (wavelength, 0.53 m;<br />
maximum slope, 0.22) and low thermal conductivity has been reproduced at full scale within a steel chamber.<br />
As expected, large cavities form between the ice and the obstacles so that the drag is limited. However,<br />
the delayed elasticity of bubbly ice modifies the expected behaviour. At the base of the ice a fine-grained,<br />
bubble-free blue ice layer develops. The shear strain concentrates on the up-stream side of bumps and in<br />
the blue ice layer. Tap-water ions enhance tertiary creep-rates.<br />
RESUME. Simulation du glissement d'un glacier sur une bosse. On a reproduit le glissement d'un glacier tempere<br />
sur deux bosses (Iongueur d'onde, 0,53 m; pente maximale, 0,22) en vraie grandeur dans une chambre<br />
d'acier. I1 se forme vraiment de grandes cavites, qui empechent le frottement de s'eJever, mais I'elasticite<br />
differee de la glace bulbeuse modi fie le comportement auque1 on s'attendait. A la base se developpe une<br />
couche de glace bleue, sans bulles et it grains fins. Le cisaillement se con centre sur la face amont des bosses<br />
et dans la couche de glace bleue. Les ions de l' au de ville favorisent le fluage tertiaire.<br />
ZUSAMMENFASSUNG. Simulation des Gletschergleitens uber einen Buckel. Das Gleiten eines temperierten<br />
Gletschers iiber zwei Bucke1 (Wellenlange, 0,53 m; maximales Gefalle, 0,22) wurde im Originalmassstab<br />
innerhalb einer Stahlkammer nachgebildet. Es bilden si ch tatsachlich grosse Hohlraume, die ein Anwachsen<br />
des Zugwiderstandes verhindern, doch verandert die verzogerte Elastizitat blasenreichen Eises das erwartete<br />
Verhalten. An der Unterseite entwickelt sich eine Schicht feinkornigen, blasenfreien Blaueises. Die Scherspannung<br />
konzentriert sich auf die stromaufwarts gelegene Seite der Buckel in der B1aueisschicht. Die Ionen<br />
des Leitungswasser begunstigen tertiares Kriechen.<br />
INTRODUCTION<br />
The idea of reproducing in the laboratory the conditions which exist at the ice-bedrock<br />
interface originated in February 1962 during a seminar given by Professor L. Lliboutry on<br />
the theory of glacier sliding. He showed that the laws describing permanent and transient<br />
creep in ice were ill-defined, calculations relating to the creep were in their infancy, and<br />
important processes had not been considered. The complexity of the creep law made it<br />
difficult to change the time scale and, since at least two other parameters were important, the<br />
machine had to be designed on a large scale. The technological problems looked formidable,<br />
but this was an inducement to carry out the work. A viscometer named "Penelope", was<br />
constructed in 1964 and modified several times between 1966 and 1977.<br />
In spite of its imperfections, the viscometer has enabled deep insight to be made into the<br />
processes occurring at the ice-rock interface. In the meantime, sliding theory has been<br />
considerably improved (Lliboutry, 1968; Nye, 1969; Kamb, 1970). Thus, the experiments<br />
carried out using Penelope are now quantitative. Strain-rates around a bump can be<br />
measured in order to check the assumptions of sliding theories.<br />
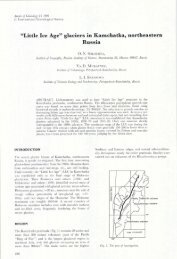
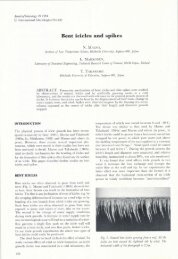
DESCRIPTION OF THE VISCOMETER<br />
Mechanical details<br />
Since a linear machine would have to be prohibitively long to be able to reach a steady<br />
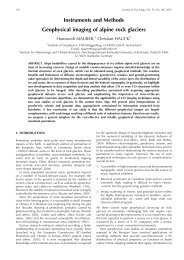
state, a circular design similar to that of a large Couette viscometer was preferred (Fig. I).<br />
The outer, moving part consists of two steel hemispheres (1-2), with a steel annulus between<br />
them. On the inside of this annulus, another annulus made of plastic-impregnated wood (3)<br />
is fastened. This has 20 cogs which pull a circle of ice around, simulating the drag of basal<br />
ice by a glacier. The arrangement is secured by threaded bolts and nuts (9). This almost<br />
spherical enclosure of about 0.60 m diameter can withstand a pressure of 100 bar.<br />
<strong>143</strong>
144 JOURNAL OF GLACIOLOGY<br />
Fig. 1. Diagram of the viscometer.<br />
A cog wheel moved by a worm gear (6) is driven by an electrical motor through two gearboxes<br />
and a speed reducer. A drum made of moulded plastic (Hi) with diametricallyopposite<br />
raised obstacles simulates the bedrock, it is attached to a stationary steel hub (10).<br />
The hub transmits the torque to a calibrated steel rod (8); the opposing torques on this rod<br />
and on the worm gear balance through the U-shaped supports (7). At its upper end the hub<br />
is fastened to a flared hollow column (5) which centres the upper surface.<br />
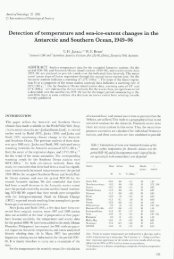
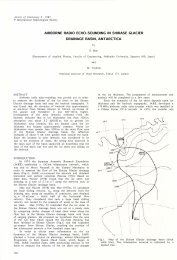
Between the toothed annulus and the drum an ice ring is formed. Its dimensions are<br />
given in Figure 2. When the machine operates the flow is two-dimensional and the sliding<br />
on the cogs (principally by melting-refreezing) is negligible. The velocity on the bumps is<br />
100 m/year if the mobile enclosure makes one revolution in 98.5 h. Experiments were made<br />
with velocities in the range 60-1 000 m/year.<br />
Pressure control<br />
The pressurized enclosure is divided into two chambers by a base (4). The upper chamber<br />
is filled with water, the lower one with oil. The same pressure, provided by a nitrogen<br />
cylinder, is applied to the water through (17) and to the oil through (19). This arrangement<br />
was designed because the viscometer was not originally in a cold room. At that time the oil<br />
chamber was cooled and the machine was insulated with a polyurethane jacket. The main<br />
difficulties were that it was impossible to remove the ice from the viscometer at the end of<br />
an experiment, because of the delayed elastic response of bubbly ice. It was also difficult to<br />
keep both sides of the ice watertight, in order to allow the water pressure in the cavities to be<br />
independent of the confining pressure. Further, it was difficult to maintain the ice at the<br />
melting-point for a long time with only negligible melting. This problem was solved when a<br />
new building for the Laboratoire de Glaciologie was constructed in 1973. Today, with the
SIMULATED GLACIER SLIDING<br />
312<br />
A A<br />
,<br />
\\<br />
\\<br />
\ T<br />
/'"<br />
/ A<br />
Fig. 2. The drum with its two obstfle/es fllld the ice fllI/IIIIII.
JO URNAL OF GLACIOLOGY<br />
keep the upper cheek reliably watertight, a slight refreezing along the ring (16) has been<br />
used since 1977. The refrigeration comes from another cooling system which moves with the<br />
steel enclosure.<br />
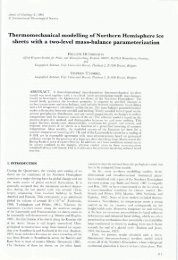
Temperature control<br />
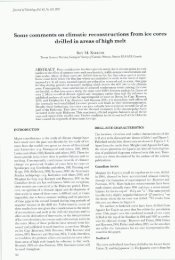
Temperature control was difficult until the viscometer was set up in a room at o°C. Three<br />
thermistors were originally provided (Fig. 3): one inside the hub (SI), another within the ice<br />
(S2), and a third on the driving cogs (s3). The first thermistor, since it had a much faster<br />
response to changes in the cooling-rate, was used for temperature regulation. In the present<br />
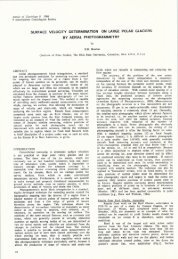
version of the viscometer, the thermistors on the obstacles (Fig. 4) achieve an adequate temperature<br />
control. The temperature variations on the up-stream side of the bumps are<br />
recorded in the most recent tests, the temperature response is almost instantaneous.<br />
- A B<br />
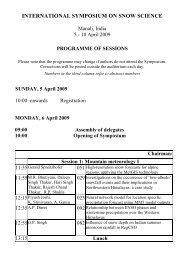
Fig. 3. February 1973 experimetlt.<br />
A. The appearance of the marks bifore diformation.<br />
B. Subsequent appearance of the marks after 5.05 revolutions.<br />
There is significant diformation in the "basal" layer.<br />
CAVITY FORMATION AND TORQUE MEASUREMENTS<br />
Formation cif cavities<br />
The upper hemisphere is now fitted with observation ports for the observation of the ice,<br />
but iu' modifications were originally observed by releasing the confining pressure and opening<br />
the chamber.<br />
The ice annulus is made by soaking crushed ice with melt water fr om similar ice (or tap<br />
water in the case of commercial ice), and cooling the mixture. Air bubbles cannot be completely<br />
eliminated, and the normal density of this artificial, isotropic ice is about 0.86 Mg/m3.<br />
There was originally a large gap between the upper surface of the drum and the driving<br />
cogs in order to allow ice to flow outwards during the formation of the cavities. This process<br />
has not, in fact, been observed, probably because bubbly ice is compressible. Under the<br />
pressure of several tens of bars, generated at the up-stream surface of the obstacles, the bubbly<br />
ice contracts by about 4 % by collapse of the air bubbles. Bubbly ice behaves as a viscoelastic<br />
material, with a large delayed elasticity. Thus, on the down-stream side of the bumps there is<br />
no immediate elastic rebound, and cavities are fo rmed from the beginning of the experiment.<br />
They grow a good deal during the first half revolution, and very slowly after this.
SIMULATED GLACIER SLIDING<br />
/'<br />
Upstream<br />
PreS5urf' gouge<br />
Oowns!rf'om<br />
"', ,<br />
'-..<br />
COV;f<br />
Fig. 4. Diagram showillg the sensors attached to each obstacle.<br />
Consequences of this are: (I) a large torque is measured even when both the confining<br />
pressure and the pressure in the cavities are at atmospheric pressure; (2) at the beginning of<br />
the experiment, when the cavities are not yet formed, the torque does not rise to very high<br />
values, even with high sliding velocities. The torque will be expressed as a mean drag over the<br />
"bedrock" Tb. Tb is always less than 3 bar, even for a sliding velocity U of 145 m/year.<br />
A new drum with larger cheeks was constructed after the discovery of this unexpected<br />
behaviour. This increase in size does not allow any ice outflow, but does permit any water at<br />
the working pressure to penetrate between the ice annulus and the driving cogs. Of course,<br />
there is a danger that, if the bubbly ice is not compressible enough to allow the formation of<br />
large cavities, the mean pressure within the ice ring will rise well above the confining pressure.<br />
This is prevented by allowing the ice annulus to melt very slowly (rather than freeze very<br />
slowly by cooling too strongly). This is a makeshift arrangement which makes very accurate<br />
and continuous control necessary. In Penelope's successor (a new machine called Telemachus)<br />
a much better solution has been adopted; the confining pressure is obtained by squeezing the<br />
ice with a ram coupled to a hydraulic jack.<br />
Variation of the drag with time<br />
Surprisingly, the variations in the torque when the machine starts are almost independent<br />
of the size of the cavities. Figure 5 is an example of this behaviour, it refers to an experiment<br />
of May 1970, with a sliding velocity U = I I I m/year, in the autonomous regime, using ice<br />
frozen from tap water. There was no confining pressure, but the mean pressure in the ice was<br />
certainly higher than atmospheric.<br />
At time t = 0, the machine was started, at this stage cavities are not present. The rapid<br />
increase in the drag should be governed by the elasticity of bubbly ice (the machine is stiff<br />
enough to make its elastic deformation almost negligible). At t = 16,5 h (0.188 revolution)<br />
and 5 1.5 h (0.586 revolution) the machine was stopped; the drag was observed to faU exponentially,<br />
this shows the delayed elasticity. When the machine was set in motion again there was:<br />
147
JOURNAL OF GLACIOLOGY<br />
:,?::=£<br />
o
Estimation of the real pressure within the ice<br />
SIMULATED GLACIER SLIDING 149<br />
As already explained, we can have no confidence that the mean pressure in ice Pi (which<br />
simulates the glacier weight) equals the confining water pressure Pc. Nevertheless, this<br />
important parameter has been estimated by the following procedure:<br />
If the pressure in the cavities is suddenly changed by - 6.p (the length of the cavities<br />
having no time to change), the change of the drag 6.Tb is the same as if the pressure of ice<br />
against the up-stream side of the obstacles had been increased by 6.p. Following Lliboutry's<br />
notation (Lliboutry, 1975) let N = Pi-P be Terzaghi's effective pressure and s the ratio of<br />
the area in contact to the total area of the "bedrock". The mean pressure of ice against the<br />
obstacle where there is contact is N/s. Since it has been shown in many experiments that<br />
6.Tb is exactly proportional to 6.p, we assume that the same ratio exists between Tb and N/s.<br />
It is then sufficient to measure Tb, 6.Tb/6.P, and s to obtain N.<br />
For example, during the experiment of February 1973, with V = 208 m/year,<br />
6.Tb/6.P = 0.066±0.00I. Since Tb = 3.7 bar,<br />
N 3.7<br />
-:;:- = = 56 bar.<br />
0.066<br />
Now the length of ice in contact with each obstacle was 9.0±0.2 cm, and since ..\=53.6 cm,<br />
s = 9.0/53.6 = o. I 7, and thus N = 9.5 bar. During this experiment P = 0 and Pc = 5 bar,<br />
relative to atmospheric pressure. If we had assumed Pi = pc, we should have obtained the<br />
incorrect value for N of 5 bar. Nevertheless, this estimation is still not entirely accurate<br />
because s changes progressively when P is altered. For this reason, and because it has not been<br />
possible until recently to maintain pressure values steady for several weeks, we cannot give<br />
any law for Tb(N) at the moment.<br />
I CE PETROLOGY<br />
The thermal conductivity of "Afcodur-PVC" (1.6 kJ/m/deg/h) is of the same order of<br />
magnitude as that of rock (e.g. 3.6 kJ /m/deg/h for limestone). Some regelation ice is found<br />
in the cavities, near the point where the ice annulus separates from the "bedrock". Nevertheless,<br />
as will be shown in the next section, most of the sliding comes from plastic deformation.<br />
This is consistent with the theory without cavitation, which indicates that<br />
Up/Vr = ("\/)..>/-)2,<br />
where Up is the plastic sliding contribution, UI is the contribution to sliding made by the<br />
melting-refreezing process, and ..\>/- is the transition wavelength. The latter is estimated by<br />
Lliboutry (1975), in the metre-bar-year unit system, as<br />
..\>/- = 0.63(UTh)-".<br />
In all our experiments U> 60 m/year and Th> I bar, whence ..\>/- < 0.16 m. Since<br />
..\ = 0.536 m, we have Up/Ur > I I.<br />
After 1.5 revolutions the ice nearest to the hub becomcs slightly clearer. After 8.5 revolutions<br />
a layer of blue, perfectly bubble-free ice, 3 cm thick, has been fo rmed. We shall see that<br />
this "basal" ice close to the obstacles and the cavities has been deformed the most. It is not<br />
regelation ice because small geometric figures marked in the ice during experiments become<br />
deformed but do not disappear (Fig. 3). The ice crystals are very minute (about I mm'<br />
in cross-sectional area, as measured on thin sections), and the air bubbles have been expelled<br />
into the cavities, where the pressure is less. Merrill (1960) has already observed a slow<br />
migration of bubbles near a sampling hole dug in the wall of a tunnel in cold ice. With<br />
temperate ice, large strain-rates, and a strong recrystallization the expulsion of air bubbles is<br />
much faster.
JOURNAL OF GLACIOLOGY<br />
A strong ice fabric develops during the experiments which is similar to one observed in<br />
glaciers (Rigsby, 1960; Vallon and others, 1976). It is very well developed in the blue ice. A<br />
stereogram is given (Fig. 7). The c-axes cluster in a girdle with four maxima, two of the<br />
maxima (with 25% of the crystals in each one) point laterally at about 45° from the plane of<br />
symmetry, another (15% of the population) points backwards (when seen from above, i.e.<br />
from the driving cogs towards the hub), the fourth maximum points forward. This ice fabric,<br />
already observed in glaciers, was reproduced for the first time in our laboratory, in 1968 using<br />
Penelope. Since then Duval (1976, in press) has shown that this ice fabric always forms by<br />
syntectonic (parakinematic) recrystallization when the state of strain is not simple shear.<br />
OBSERVED STRAINS<br />
First rough technique<br />
x xX<br />
x x<br />
Fig. 7. Ice fabric formed in blue ice.<br />
The first method used to observe strains was to put a square frame (47 X 47 mm2) within<br />
the ice in a plane perpendicular to the axis of the machine with two sides parallel to the<br />
"bedrock" (the circumference of the drum). The sides of the frame were 5 mm thick, and<br />
saw-cuts were made at the four corners to allow it to deform to a rhombus. Successive<br />
positions of the frames are shown in Figure 6. The deviations of these frame angles from 1T/2<br />
are given in Table 1. In both experiments the ice was made with tap water. Deformation<br />
occurred whilst the frame was moving along the up-stream side of the obstacle. There was no<br />
significant deformation after this until the second obstacle was reached, only rotation occurred,<br />
with the "upper side" moving faster. The deformation over the second obstacle was less,<br />
probably because the rhombus no longer had two sides parallel to the "bedrock".<br />
TABLE 1. DEVIATIONS OF THE FRAME ANGLES FROM 1'(/2 rad<br />
Experiment A (Fig. 6A)<br />
Experiment B (Fig. 6B)<br />
Sliding<br />
velocity<br />
m/year<br />
425<br />
425<br />
425<br />
III<br />
II I<br />
Time<br />
h<br />
5<br />
27<br />
42<br />
9<br />
26,3<br />
* Shown as a clear square in Figure 6B.<br />
t Shown as a dotted square in Figure 6B.<br />
rrame angles<br />
rad<br />
0.26±0.04<br />
0.29±0.04<br />
0·47±0.03<br />
0.007 ±0.001 * 0.065± 0.01 5 t<br />
o.132±0.003* O.053±O.013t
SIM ULATED GLACIER SLIDING 151<br />
In Experiment B, when passing over the first three-quarters of a bump, the clear frame<br />
(Fig. 6) was deformed by 0.125 rad. When passing over the second half of an obstacle, the<br />
dotted frame was deformed by 0.065 rad. Thus, on this occasion, the deformation went on<br />
in the same direction over the down-stream side of the obstacle. Over the whole bump it<br />
was about 0.16 rad instead ofo.29 rad as in Experiment A. Rotation was negligible in B.<br />
Explanation of the results<br />
The only simple analytical solution with which these results may be compared is that for<br />
the case of no cavitation, infinitesimal slopes, and Newtonian viscous ice. These assumptions<br />
are so far from the truth that we may assume without inconvenience that the ice slides over a<br />
sine curve z = a cos wx from x = - CA) to + 00 instead of considering circular sliding where<br />
r = ro+a cos we. It can be shown that the variations in pressure over the driving cogs<br />
(wz = 1.4) are 3.019 times larger than for a semi-infinite solid (Appendix). On the bumps<br />
(z = 0) the pressure variations are 2.443 times larger, the same applies for the drag which is<br />
Tb = 2-4431)Ua2w3.<br />
The frames were put midway between the cogs and the bumps (wz = 0.7). If cavitation<br />
does not occur in the Newtonian-viscous case, the total rotations on the up-stream side of a<br />
bump should be n = -0.008 rad and the shear deformation €xz should equal -0.072.<br />
This is not the case in our experiments, because the general shear caused by the drag has been<br />
ignored. This shear for a full wavelength is<br />
Yb = 2·443Ua2wlT = 2·443a2w3,\<br />
= 2.443 X 2'TTa2w2 = 0.443 6.<br />
The experiments show that, in the case of cavitation, most of this shear concentrates over<br />
the area where ice and bedrock are in contact, the more so as the sliding velocity increases.<br />
Much more precise numerical computations are in progress, using the finite-difference<br />
method and the finite-element method. They will be published elsewhere.<br />
A more accurate technique for the measurement of strain<br />
In order to measure the normal strains as well as the angular deformations, small plastic<br />
markers were put within the ice, along different radii, numbered 0 to 19. One layer] was<br />
5 cm from the lower side, another layer R at 4 cm from the upper side. Their motion was<br />
identical, indicating that the flow was effectively two-dimensional. Only a fe w marker<br />
positions are indicated on Figure 8. In this figure, A indicates the starting point and 0 the<br />
10<br />
-<br />
12 I 13<br />
8 17<br />
7<br />
Fig. 8. Motion of marks during the January 1973 experiment.<br />
15<br />
0<br />
16<br />
19<br />
18
JOURNAL OF GLACIOLOGY<br />
end point. The position of the marks was accurately determined by measuring their distance<br />
to several driving cogs.<br />
Experiment of January 1973 (tap-water ice)<br />
Only 1.323 revolutions were carried out at a sliding velocity of 145 m/year. The experiment<br />
was so short that blue ice did not form. The results are plotted in Figure g. The markers<br />
which were on the same radius remained in a straight line. For the marks RO and JO, which<br />
passed over two obstacles, the total angular deviation was 0.2 11 ±0.012 rad. For the marks<br />
J8, RI2, and JI2, which passed over three obstacles, the deviation was 0.476±0.023 rad.<br />
It may be that during the first traverses over the obstacles the cavities were not yet well<br />
developed and the strain was less concentrated. The ice crystals, although still not very<br />
large, were of a significant size after 80 h (Fig. 10).<br />
x<br />
/'<br />
1<br />
/<br />
r<br />
i/jI<br />
I<br />
, ,Q<br />
I1 .<br />
I I- I<br />
I / /<br />
J8<br />
j RI2<br />
JO /<br />
j}12<br />
Cogs<br />
Fig. 9. The ObSer1'fd shFar after 1.323 revolutiolls at a speed oJ 145 m/year ill the .Jalluary 1973 experiment,<br />
Fig. 10. IceJabricJrolll the .January 1973 experiment; tap-water ice deJonuedJor 80 h.
Experiment of February 1973 (tap-water ice)<br />
SIMULATED GLACIER SLIDING 153<br />
The velocity was <strong>143</strong> m/year for the first 1.3 revolutions and subsequently 208 m/year.<br />
The markers were placed as indicated on Figure 3A. After 5.05 revolutions lasting 270 h<br />
the situation was as shown in Figures 3B and I I. A bottom layer of blue ice, 2 cm thick,<br />
formed where the shear strain was strongest (Yxz :::: : 0.83). Above it, in the bubbly layer, the<br />
square of 47 X 47 mm2 became a rectangle of 53 X 40 mm2• Final values for the strain are<br />
and<br />
Yxz = 0.13 ±0.03,<br />
Exx = 0.I2,<br />
EZZ = -0.16.<br />
The density of the bubbly ice has thus increased by 4 % (0.860 to 0.895 Mg/m3). Figure<br />
13 shows crystals with very fine grain size in the boundary layer of the blue ice.<br />
r R8 RI2 RI8<br />
,/ / tc'/<br />
/0 / T<br />
R2 l /x /<br />
I/o /<br />
dl-<br />
'1<br />
/<br />
' . /<br />
II<br />
, xl<br />
I I<br />
If'<br />
1<br />
I<br />
o<br />
,<br />
,<br />
x--- -+- -- -- -- -- -- -<br />
Cogs<br />
Fig. 11. Observed shear in the FebruaT}' 1973 experiment; tap-water ice diformed by 5.05 revolutions.<br />
Fig. 12. Ice fabric from the February 1973 experiment; tap-water ice diformedfor 200 h.
JOURNAL OF GLACIOLOGY<br />
I<br />
fJO<br />
f<br />
+f<br />
If<br />
9<br />
f<br />
x-- ---<br />
-- -- -- -- --<br />
Cogs<br />
Fig. 13. Observed shear in the April 1973 experiment; distilled-water ice deformed by 5.30 revolutions.<br />
Fig. 14. lee fabric jrom the April 1973 experimmt; distilled-water ice deformedfor 365 h.<br />
Experiment of April [973<br />
The velocity in this experiment was <strong>143</strong> m/year for a total duration of 365 h (5.30 revolutions).<br />
On this occasion the ice was made from distilled water instead of the tap water used<br />
in previous experiments. The same layer of blue ice about 3 cm thick was formed, but within<br />
it the shear strain was substantially less, as shown in Figure 14. On the other hand, "Tb was<br />
1.66 times' higher. Figure 14 shows the much larger blue-ice crystals which are obtained with<br />
distilled water. This indicates that the ions present in tap water enhance ice recrystallization<br />
and creep.<br />
CONCLUSIONS<br />
Although they have certain errors, the experiments carried out in 1970 and 1973 with<br />
the viscometer indicate that important facts are ignored in the present theories. The delayed<br />
elasticity of bubbly ice, which is much more important than the pseudo-elasticity of Duval<br />
([1977]) and which is of the Kelvin not of the Maxwell type, cannot be ignored; it increases<br />
the drag. The progressive elimination of air bubbles from the bottom ice of glaciers would
SIMULATED GLACIER SLIDING<br />
appear to be an important process. A better simulation of sliding processes would occur if<br />
bubble-free ice were used. Kamb's (1970) statement that the layer of blue ice found at the<br />
bottom of glaciers is caused by regelation may be questioned; in the ice tested here it is not<br />
the case. This is consistent with the findings of Souchez and others (1978) who have shown<br />
that the ionic composition of base glacier ice cannot arise as a result of a classical melting-<br />
. refreezing process.<br />
Creep-rates in ice are considerably altered by the presence of ions. This makes it very<br />
difficult to reproduce the exact mode of basal deformation over an obstacle. At best we may<br />
determine the friction law over a sine profile for different known ionic contents.<br />
A new viscometer, a development of Pen elope, is now ready to work in Grenoble. Nevertheless,<br />
Penelope will still be useful because the flow in it is two-dimensional and very high<br />
confining pressures can be attained; this will not be possible with the new viscometer.<br />
ACKNOWLEDGEMENTS<br />
My thanks are due to Alsthom-Atlantique who provided time for the present work, to<br />
Professor Lliboutry for his help in interpreting the results and in writing this paper, to Miss<br />
M. 1. Clement for her assistance with the experimental work, to Mr A. Chaillou and Mr L.<br />
Philippe for their electronic and mechanical expertise, and to CNRS for the provision of<br />
funds.<br />
The profile of the "bedrock" is given by<br />
the boundary conditions are<br />
for z = h,<br />
(I) forward velocity u = V, a constant;<br />
(2) transverse velocity w = 0;<br />
for z :::: :: 0,<br />
(3) shear strain-rate<br />
APPENDIX<br />
": = a cos wx,<br />
ou ow<br />
)lxz = az + ox = 0 ;<br />
(4) to second order, q(x, z) denotes the strain function, q = 0 gives z = a cos wx.<br />
A general solution of the biharmonic equation y4q = 0 is<br />
q = f(z) cos wx+g (z) sin wx+C,z+C,z'+CJz"<br />
f(z) and g(z) being of the form (A+Bwz) exp (wz)+ (C+Dwz) exp (-wz). The boundary conditions are then<br />
(I) f'(h) = 0, g' (h) = 0,<br />
C,+2C,h+3CJh' = V,<br />
(2) f(h) = 0, g(h) = 0,<br />
(3) f" (o)+w'f (o) = 0, g" (o)+w'g (o) = 0,<br />
C, = 0,<br />
(4) f(o) = -Va, g(o) = o.<br />
The four relations<br />
g(h) = g' (h) = g(o) = g" (o) = 0<br />
imply that g(z) = o. In order not to have a constant term for<br />
C, = 0 is needed.<br />
Hence,<br />
ca", OTxz<br />
Tx -az-'<br />
C=-A-Va, D=B-Va, }<br />
A (exp (2wh)-I)+Bwh (exp (2wh)+I) =<br />
.<br />
Va (l+wh),<br />
2A exp (2wh)+B[ (1+2Wh) exp (2wh)+I] = Va.<br />
(A-I)
JO URNAL OF GLACIOLOGY<br />
In our case, h = 0.12 m and wh = 1.4. Finally,<br />
u = [U+ Uaw2z exp (-wz) cos wx] + Uaw(0.727 cosh wz-o.716wz sinh wz) cos wX }<br />
W = [- Uaw( 1+ wz) exp ( - wz) sin wx] + Uaw( 1.443 sinh wz-o. 716wz cosh wz) sin wx,<br />
the terms in square brackets are the solution for h = 00. With a uniform velocity at a finite distance the modification<br />
is not negligible, in particular, against the "bedrock" the forward velocity u increases over the bump. The<br />
normal stress at is calculated as<br />
aUt ( a'u a2U)<br />
Tz = -1/ 3 aX2 + aZ2 .<br />
(A-3)<br />
It yields<br />
at = [-Pi + 2TJUaw2( 1+ wz) exp (- wz) sin wx] +<br />
+ 2TJUaw'(1.443 cosh wz-o.716wz sinh wz) sin wz,<br />
o 0<br />
au dx<br />
·<br />
[ 8<br />
] ·<br />
= az U = -0.471 aw Sin wz ->/, = -0.080,<br />
-T/2 -AI.<br />
J au d<br />
t<br />
az I<br />
o<br />
aw<br />
J<br />
[WJ"<br />
ax dt = 7J -,,,<br />
- Tt2<br />
= [ -0.378 65aw sin wx]w = -0.054.<br />
REFERENCES<br />
Brepson, R. 1966. Premiers resullats obtenus avec le viscosimetre a glace de Grenoble. Comptes Rmdus Hebdomadaires<br />
des Seances de l'Academie des Scietlces (Paris), Ser. B, Tom. 263, No. 15, p. 876-79.<br />
Duval, P. 1976. Fluage et recristallisation des glaces polycristallines. Publication du Laboratoire de Glaciologie du<br />
CNRS, GrClloble, No. 215.<br />
Duval, P. [1977.] Lois du fluage transitoire ou permanent de la glace polycristalline pour divers etats de contrainte.<br />
All/wles de Geophysique, Tom. 32, No. 4, 1976, p. 335-50.<br />
Duval, P. In press. Creep and fabrics of temperate polycrystalline ice under shear and compression. Journal oJ<br />
Glaciology.<br />
Kamb, "v. B. 1970. Sliding motion of glaciers: theory and observation. Reviews of Geophysics and Space Physics,<br />
Vol. 8, No. 4, p. 673-728.<br />
Lliboutry, L. A. 1968. General theory of subglacial cavitation and sliding of temperate glaciers. Journal of<br />
Glaciology, Vol. 7, No. 49, p. 21-58.<br />
Lliboutry, L. A. 1975. Loi de glissemcnt d'un glacier sans cavitation. AII/wles de Geophysique, Tom. 31, No. 2,<br />
p. 207-25.<br />
Merrill, W. M. 1960. Structures in glacier ice, north ice cap, northwest Greenland. Report of the <strong>International</strong><br />
Geological Congress, XXI Session, Norden, 1960, Pt. 2 I, p. 68-80.<br />
Michel, B. 1978. A mechanical model of creep of polycrystalline ice. Calladiall Geotec/mical Joumal, Vol. 15,<br />
No. 2, p. 155-70.<br />
Nye, J. F. 1969. A calculation on the sliding of ice over a wavy surface using a Newtonian viscous approximation.<br />
Proceedings of the Royal <strong>Society</strong> of London, Set". A, Vol. 311, No. 1506, p. 445-67.<br />
Rigsby, G. P. 1960. Crystal orientation in glacier and in experimentally deformed ice. Joumal of Glaciology,<br />
Vol. 3, No. 27, p. 589-606.<br />
Souchez, R. A., and others. 1978. Pressure-melting within a glacier indicated by the chemistry of re-gelation ice,<br />
[by] R. [A.] Souchez, M. [M.] Lemmens, R. [D.] Lorrain, J.-L. Tison. Nature, Vol. 273, No. 5662, p. 454-56.<br />
Vallon, M., and others. 1976. Study of an ice core to the bedrock in the accumulation zone of an Alpine glacier,<br />
by M. Vallon, J.-R. Petit, and B. Fabre. Journal of Glaciology, Vol. 17, No. 75, p. 13-28.<br />
(A-2)<br />
(A-4)