Sarhad Provincial Conservation Strategy - IUCN
Sarhad Provincial Conservation Strategy - IUCN Sarhad Provincial Conservation Strategy - IUCN
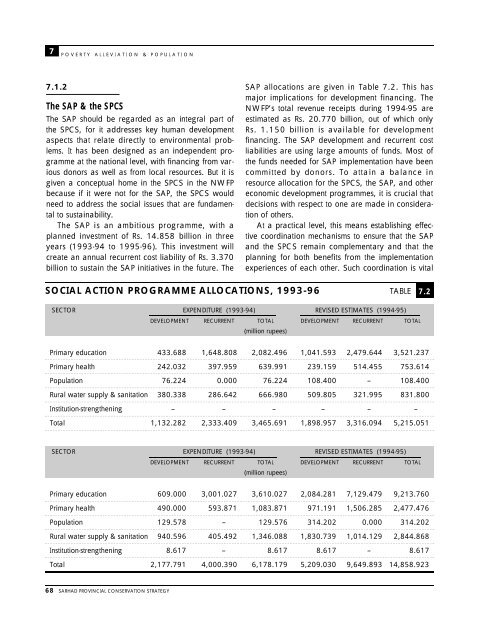
7 7 . 1 . 2 P O V E R T Y A L L E V I A T I O N & P O P U L A T I O N The SAP & the SPCS The SAP should be regarded as an integral part of the SPCS, for it addresses key human development aspects that relate directly to environmental problems. It has been designed as an independent programme at the national level, with financing from various donors as well as from local resources. But it is given a conceptual home in the SPCS in the NWFP because if it were not for the SAP, the SPCS would need to address the social issues that are fundamental to sustainability. The SAP is an ambitious programme, with a planned investment of Rs. 14.858 billion in three years (1993-94 to 1995-96). This investment will create an annual recurrent cost liability of Rs. 3.370 billion to sustain the SAP initiatives in the future. The 68 SARHAD PROVINCIAL CONSERVATION STRATEGY SAP allocations are given in Table 7.2. This has major implications for development financing. The NWFP’s total revenue receipts during 1994-95 are estimated as Rs. 20.770 billion, out of which only Rs. 1.150 billion is available for development financing. The SAP development and recurrent cost liabilities are using large amounts of funds. Most of the funds needed for SAP implementation have been committed by donors. To attain a balance in resource allocation for the SPCS, the SAP, and other economic development programmes, it is crucial that decisions with respect to one are made in consideration of others. At a practical level, this means establishing effective coordination mechanisms to ensure that the SAP and the SPCS remain complementary and that the planning for both benefits from the implementation experiences of each other. Such coordination is vital SOCIAL ACTION PROGRAMME ALLOCATIONS, 1993-96 TABLE SECTOR EXPENDITURE (1993-94) REVISED ESTIMATES (1994-95) DEVELOPMENT RECURRENT TOTAL DEVELOPMENT RECURRENT TOTAL (million rupees) Primary education 433.688 1,648.808 2,082.496 1,041.593 2,479.644 3,521.237 Primary health 242.032 397.959 639.991 239.159 514.455 753.614 Population 76.224 0.000 76.224 108.400 – — 108.400 Rural water supply & sanitation 380.338 286.642 666.980 509.805 321.995 831.800 Institution-strengthening – — – — – — – — – — – — Total 1,132.282 2,333.409 3,465.691 1,898.957 3,316.094 5,215.051 SECTOR EXPENDITURE (1993-94) REVISED ESTIMATES (1994-95) DEVELOPMENT RECURRENT TOTAL DEVELOPMENT RECURRENT TOTAL (million rupees) Primary education 609.000 3,001.027 3,610.027 2,084.281 7,129.479 9,213.760 Primary health 490.000 593.871 1,083.871 971.191 1,506.285 2,477.476 Population 129.578 – — 129.576 314.202 0.000 314.202 Rural water supply & sanitation 940.596 405.492 1,346.088 1,830.739 1,014.129 2,844.868 Institution-strengthening 8.617 – — 8.617 8.617 – — 8.617 Total 2,177.791 4,000.390 6,178.179 5,209.030 9,649.893 14,858.923 7.2
for the SAP also. The supply of piped water does not essentially mean clean water. It will be only through the abatement of rural pollution sought under the SPCS that cleaner water will be available for drinking. Conversely, rural sanitation pursued under the SAP will contribute directly to the reduction in rural depopulation. Similarly, while such large investments are being made in primary education, they can be made more meaningful if environmental considerations are included. The coordination cell for the SAP and the Environment Section are both part of Planning, Environment, and Development Department, and it should not be difficult to bring about the desired coordination. SAP implementation will greatly contribute to furthering the SPCS agenda of social reformation and poverty alleviation. Nevertheless, the potential environmental impacts of the small but numerous SAP activities remain a concern. This has not yet been addressed in the SAP, which is yet another reason why the SAP and the SPCS must be partners. 7 . 2 P O V E RTY AND DEPRIVAT I O N Poverty in either rural or urban environments is a multidimensional problem. One key dimension is economic poverty. This includes the actual level of consumption of a household or individual that falls below a certain minimum subsistence level or ‘poverty line’, which is the lowest acceptable standard of basic need for an individual. Poverty also encompasses other dimensions of social or human development, such as a high rate of child and maternal mortality, a high rate of disease, high illiteracy, or lack of access to clean drinking water and safe sanitation facilities. A provincial comparison of poverty is shown in Table 7.3. It indicates that the NWFP in 1991 had the highest concentration of poor people relative to its share in the national population and that the ratio of those living in poverty was some 50% higher in rural areas as in urban areas. This fact has been fully supported by the SPCS consultations, which revealed that people consider poverty to be a major cause of environment deterioration. This is believed to be due to the narrow and weak industrial and commercial P O V E R T Y A L L E V I A T I O N & P O P U L A T I O N 7 economic base and therefore the heavy dependence, overexploitation, and unsustainable consumption of natural resources. This is particularly true in rural areas, where more than 84% of the NWFP population and more than 80% of all the poor live. Where the poor have been able to get a larger share of any progress, such gains have not been enough to compensate for existing poverty and deprivation. Continuing deprivation in the face of real provincial economic growth underlines the difficulties of tackling underdevelopment and endemic poverty in lowincome rural economies, notwithstanding past and current approaches towards rural development. The impact of this inequitable distribution of resources on the rural society is seen in rising unemployment, a concentration of landholdings, lower crop yields, displacement of labour due to mechanization, lower availability of inputs to small farmers, inadequate allocation of resources to agriculture, inaccessibility to rural credit, and inadequate financial allocation for health, education, and other basic needs. The subsistence economy in rural areas, limited employment opportunities, decreasing size of landholdings, centralized planning, and absence of local participation in rural development schemes are causing a rural-urban migration that drains human resources from rural society, further widening the gap in rural economic activity. In the past, while economic poverty has declined at the national level and the household income distribution has remained fairly stable, households towards the bottom of income distribution have not shared significantly in the economic gains made during the period. Poverty alleviation, however, is a complex issue, and isolated step measures will not achieve the desired objectives rapidly. Rather it requires an integrated approach and the combination of a variety of measures. Improving the social and economic conditions of the rural and low-income urban communities requires integrated development initiatives, including sustainable natural resource management, provision of basic services, extension of more education and health facilities, and skills training, with a heavy emphasis on community involvement. There is a parallel need to boost the local economies and to increase the opportunities for gainful employment. SARHAD PROVINCIAL CONSERVATION STRATEGY 69
- Page 48 and 49: 3 3 . 1 R E S P O N D I N G T O T H
- Page 50 and 51: 3 R E S P O N D I N G T O T H E I S
- Page 52 and 53: 3 R E S P O N D I N G T O T H E I S
- Page 54 and 55: 24 SARHAD PROVINCIAL CONSERVATION S
- Page 56 and 57: 4 4 . 1 T O W A R D S T H E S A R H
- Page 58 and 59: 4 T O W A R D S T H E S A R H A D P
- Page 60 and 61: 4 T O W A R D S T H E S A R H A D P
- Page 62 and 63: 4 4.5 THE PUBLIC CONSULTATION PROCE
- Page 64 and 65: 4 T O W A R D S T H E S A R H A D P
- Page 66 and 67: 4 T O W A R D S T H E S A R H A D P
- Page 68 and 69: 38 SARHAD PROVINCIAL CONSERVATION S
- Page 70 and 71: Unsustainable Population Growth 71
- Page 72 and 73: Forestry 133 Eliminating Political
- Page 74 and 75: 10.3 Average Concentration of Carbo
- Page 76 and 77: 5 5 . 1 G O A L S , O B J E C T I V
- Page 78 and 79: 48 SARHAD PROVINCIAL CONSERVATION S
- Page 80 and 81: 6 G O V E R N A N C E & C A P A C I
- Page 82 and 83: 6 G O V E R N A N C E & C A P A C I
- Page 84 and 85: 6 A similar situation persists in t
- Page 86 and 87: 6 G O V E R N A N C E & C A P A C I
- Page 88 and 89: 6 from polythene bags. Consumer cho
- Page 90 and 91: 6 G O V E R N A N C E & C A P A C I
- Page 92 and 93: 6 6 . 1 2 G O V E R N A N C E & C A
- Page 94 and 95: 6 G O V E R N A N C E & C A P A C I
- Page 96 and 97: 7 P O V E R T Y A L L E V I A T I O
- Page 100 and 101: 7 P O V E R T Y A L L E V I A T I O
- Page 102 and 103: 7 in cropping patterns and intensit
- Page 104 and 105: 7 public concern about poverty alle
- Page 106 and 107: 7 P O V E R T Y A L L E V I A T I O
- Page 108 and 109: 7 their role in development, combin
- Page 110 and 111: 7 P O V E R T Y A L L E V I A T I O
- Page 112 and 113: 8 8 . 1 N O N - G O V E R N M E N T
- Page 114 and 115: 8 would focus on social welfare pro
- Page 116 and 117: 8 organized. Institutions like FRC
- Page 118 and 119: 8 Substantial development activitie
- Page 120 and 121: 90 SARHAD PROVINCIAL CONSERVATION S
- Page 122 and 123: 9 9 . 1 C O M M U N I C A T I O N &
- Page 124 and 125: 9 9 . 1 . 3 C O M M U N I C A T I O
- Page 126 and 127: 9 C O M M U N I C A T I O N & E D U
- Page 128 and 129: 9 9 . 2 . 3 C O M M U N I C A T I O
- Page 130 and 131: 9 C O M M U N I C A T I O N & E D U
- Page 132 and 133: 9 C O M M U N I C A T I O N & E D U
- Page 134 and 135: 9 C O M M U N I C A T I O N & E D U
- Page 136 and 137: 106 SARHAD PROVINCIAL CONSERVATION
- Page 138 and 139: 10 U R B A N E N V I R O N M E N T
- Page 140 and 141: 10 U R B A N E N V I R O N M E N T
- Page 142 and 143: 10 U R B A N E N V I R O N M E N T
- Page 144 and 145: 10 U R B A N E N V I R O N M E N T
- Page 146 and 147: 10 U R B A N E N V I R O N M E N T
7<br />
7 . 1 . 2<br />
P O V E R T Y A L L E V I A T I O N & P O P U L A T I O N<br />
The SAP & the SPCS<br />
The SAP should be regarded as an integral part of<br />
the SPCS, for it addresses key human development<br />
aspects that relate directly to environmental problems.<br />
It has been designed as an independent programme<br />
at the national level, with financing from various<br />
donors as well as from local resources. But it is<br />
given a conceptual home in the SPCS in the NWFP<br />
because if it were not for the SAP, the SPCS would<br />
need to address the social issues that are fundamental<br />
to sustainability.<br />
The SAP is an ambitious programme, with a<br />
planned investment of Rs. 14.858 billion in three<br />
years (1993-94 to 1995-96). This investment will<br />
create an annual recurrent cost liability of Rs. 3.370<br />
billion to sustain the SAP initiatives in the future. The<br />
68 SARHAD PROVINCIAL CONSERVATION STRATEGY<br />
SAP allocations are given in Table 7.2. This has<br />
major implications for development financing. The<br />
NWFP’s total revenue receipts during 1994-95 are<br />
estimated as Rs. 20.770 billion, out of which only<br />
Rs. 1.150 billion is available for development<br />
financing. The SAP development and recurrent cost<br />
liabilities are using large amounts of funds. Most of<br />
the funds needed for SAP implementation have been<br />
committed by donors. To attain a balance in<br />
resource allocation for the SPCS, the SAP, and other<br />
economic development programmes, it is crucial that<br />
decisions with respect to one are made in consideration<br />
of others.<br />
At a practical level, this means establishing effective<br />
coordination mechanisms to ensure that the SAP<br />
and the SPCS remain complementary and that the<br />
planning for both benefits from the implementation<br />
experiences of each other. Such coordination is vital<br />
SOCIAL ACTION PROGRAMME ALLOCATIONS, 1993-96 TABLE<br />
SECTOR EXPENDITURE (1993-94) REVISED ESTIMATES (1994-95)<br />
DEVELOPMENT RECURRENT TOTAL DEVELOPMENT RECURRENT TOTAL<br />
(million rupees)<br />
Primary education 433.688 1,648.808 2,082.496 1,041.593 2,479.644 3,521.237<br />
Primary health 242.032 397.959 639.991 239.159 514.455 753.614<br />
Population 76.224 0.000 76.224 108.400 – — 108.400<br />
Rural water supply & sanitation 380.338 286.642 666.980 509.805 321.995 831.800<br />
Institution-strengthening – — – — – — – — – — – —<br />
Total 1,132.282 2,333.409 3,465.691 1,898.957 3,316.094 5,215.051<br />
SECTOR EXPENDITURE (1993-94) REVISED ESTIMATES (1994-95)<br />
DEVELOPMENT RECURRENT TOTAL DEVELOPMENT RECURRENT TOTAL<br />
(million rupees)<br />
Primary education 609.000 3,001.027 3,610.027 2,084.281 7,129.479 9,213.760<br />
Primary health 490.000 593.871 1,083.871 971.191 1,506.285 2,477.476<br />
Population 129.578 – — 129.576 314.202 0.000 314.202<br />
Rural water supply & sanitation 940.596 405.492 1,346.088 1,830.739 1,014.129 2,844.868<br />
Institution-strengthening 8.617 – — 8.617 8.617 – — 8.617<br />
Total 2,177.791 4,000.390 6,178.179 5,209.030 9,649.893 14,858.923<br />
7.2


