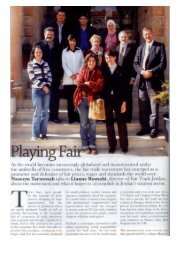
Sarhad Provincial Conservation Strategy - IUCN
Sarhad Provincial Conservation Strategy - IUCN
Sarhad Provincial Conservation Strategy - IUCN

You also want an ePaper? Increase the reach of your titles
YUMPU automatically turns print PDFs into web optimized ePapers that Google loves.
S U S T A I N A B L E I N D U S T R I A L D E V E L O P M E N T 11<br />
INDUSTRIAL PROJECTS, INVESTMENT & EMPLOYMENT TABLE<br />
IN THE NWFP<br />
PERIOD UNITS EMPLOYMENT INVESTMENT<br />
(number) (number) (million rupees)<br />
Up to 1947 11 1,063 81.621<br />
1948-1950 15 2,218 277.362<br />
1951-1955 36 11,468 1,709.948<br />
1956-1960 46 12,465 1,969.329<br />
1961-1965 74 19,562 3,609.369<br />
1966-1970 153 22,001 4,040.451<br />
1971-1975 217 24,366 4,668.659<br />
1976-1980 360 28,326 5,700.701<br />
1981-1985 632 35,153 9,961.691<br />
1986-1990 1,033 42,411 12,331.691<br />
1991-1993 1,513 59,053 22,128.869<br />
S o u r c e: Industries, Commerce, Labour, Mineral Development & Transport Department. 1993. Directory of Industrial Establishment. Government of NWFP.<br />
p. 169.<br />
INDUSTRIAL UNITS IN THE NWFP, BY SECTOR TABLE<br />
INDUSTRY UNITS EMPLOYMENT INVESTMENT<br />
(number) (%) (number) (%) (million rupees) (%)<br />
Food beverage & tobacco 392 25.9 14,661 24.8 4,872.567 22.0<br />
Textile apparel<br />
& leather products 384 25.4 20,301 34.4 6,331.391 28.6<br />
Wood & wood products 72 4.8 1,052 1.8 479.595 2.2<br />
Paper & paper products 37 2.4 2,509 4.2 995.783 4.5<br />
Chemical, petroleum,<br />
rubber & plastic products 244 16.1 6,940 11.7 3,893.750 17.6<br />
Mineral products 198 13.1 5,353 9.1 3,562.734 16.1<br />
Metal & metal products 164 10.8 7,662 13.0 1,865.049 8.4<br />
Other manufacturing industries 22 1.5 575 1.0 127.714 0.6<br />
Total 1,513 59,053 21,128.583<br />
Source: Industries, Commerce, Labour, Mineral Development & Transport Department. 1993. Directory of Industrial Establishment. Government of NWFP.<br />
11.1<br />
11.2<br />
SARHAD PROVINCIAL CONSERVATION STRATEGY 125