Logical Decisions - Classweb
Logical Decisions - Classweb Logical Decisions - Classweb
You can create a new Matrix view by selecting the View::Matrix option. When you select this option, you are shown the dialog box in Figure 6-6. Figure 6-6. Matrix options dialog box. The goal you select from the list at the left of the dialog box determines which measures will be shown in the matrix. Only those measures below the selected goal in the goals hierarchy will be shown. When you check the box labeled "Show Categories", LDW will display the columns for the measure categories associated with the measures in the matrix. If you don't check the box, the measure category columns will be hidden. You will be able to view them later by selecting the Matrix::Show Measure Categories option. The Matrix Menu. When you have selected a matrix view window as the active window, LDW will display the Matrix menu item, which has the following options: ! Show/Hide Measure Categories -- this option is only available when you have selected a measure that has one or more measure categories When the option is on, LDW displays the columns for the measure's categories in the matrix. 6-12 Section 6 -- Using LDW 1: Structuring
! Define Probability -- this option is only available when you have selected a level cell in the matrix view. When you select it, LDW will display the "Define a Probabilistic Level" dialog box, where you can define a probability distribution for the active level. You can also get to this dialog box by double clicking on a level cell. The Quick Entry View The quick entry view is designed to let you quickly structure your analysis without worrying about measure scales and levels. The Quick Entry view is a tree structure like those seen in the Windows Explorer Folders option. You select the Quick Entry view with the View::Quick Entry option. LDW displays a tree window like the one shown in Figure 6-7. Figure 6-7. Example of Quick Entry view. Section 6 -- Using LDW 1: Structuring 6-13
- Page 44 and 45: 1. Select the Assess::Common Units
- Page 46 and 47: When you do this, the tradeoff grap
- Page 48 and 49: 1. Select "Performance" and "Price"
- Page 50 and 51: 8. Click on the "Equal" button to t
- Page 52 and 53: Figure 4-11. Display generated by R
- Page 54 and 55: Figure 4-13. Overall ranking for tr
- Page 56 and 57: Figure 4-15. Graph showing sensitiv
- Page 58 and 59: You can see the completed introduct
- Page 61 and 62: Advanced Tutorial This tutorial sec
- Page 63 and 64: Probabilities There is a problem wi
- Page 65 and 66: This information indicates that the
- Page 67 and 68: A uniform distribution is defined b
- Page 69 and 70: On the left is a list of the possib
- Page 71 and 72: Figure 5-2. Example of Results::Unc
- Page 73 and 74: screen a large database for the alt
- Page 75 and 76: 9. LDW will ask if you want to appe
- Page 77 and 78: commit to buying their truck before
- Page 79 and 80: see that the rankings for all the a
- Page 81: S E C T I O N Using LDW 1: Structur
- Page 84 and 85: The Edit::Insert option. The Insert
- Page 86 and 87: ! Summary -- view a dialog box that
- Page 88 and 89: structure like an organization char
- Page 90 and 91: If you check the Show Assessment St
- Page 92 and 93: saves it for later pasting. When yo
- Page 96 and 97: The quick entry view shows the alte
- Page 98 and 99: Structuring Goals The goals in an L
- Page 100 and 101: these two fields to describe each m
- Page 102 and 103: the hierarchy. In the Matrix view,
- Page 104 and 105: ! Point Estimate -- use a single nu
- Page 106 and 107: Figure 6-12. Example of a measure l
- Page 108 and 109: Figure 6-14. Example of a measure l
- Page 110 and 111: pass, LDW replaces each probabilist
- Page 112 and 113: Figure 6-17. Dialog box for definin
- Page 114 and 115: Figure 6-18. Measure Category Dialo
- Page 117: S E C T I O N Using LDW 2: Assessin
- Page 120 and 121: measure utility functions for the g
- Page 122 and 123: information as possible when you ch
- Page 124 and 125: measures with categories require mu
- Page 126 and 127: The "Reset" button deletes any asse
- Page 128 and 129: You can change the shape of the cur
- Page 130 and 131: Figure 7-4. Utility Assessment Scre
- Page 132 and 133: very different from the average of
- Page 134 and 135: Figure 7-6. Assessment matrix for A
- Page 136 and 137: You can, however, leave the assessm
- Page 138 and 139: properties dialog box can be select
- Page 140 and 141: the same level. LDW provides a grap
- Page 142 and 143: options in the Hierarchy menu to ad
! Define Probability -- this option is only available<br />
when you have selected a level cell in the matrix<br />
view. When you select it, LDW will display the<br />
"Define a Probabilistic Level" dialog box, where<br />
you can define a probability distribution for the<br />
active level. You can also get to this dialog box by<br />
double clicking on a level cell.<br />
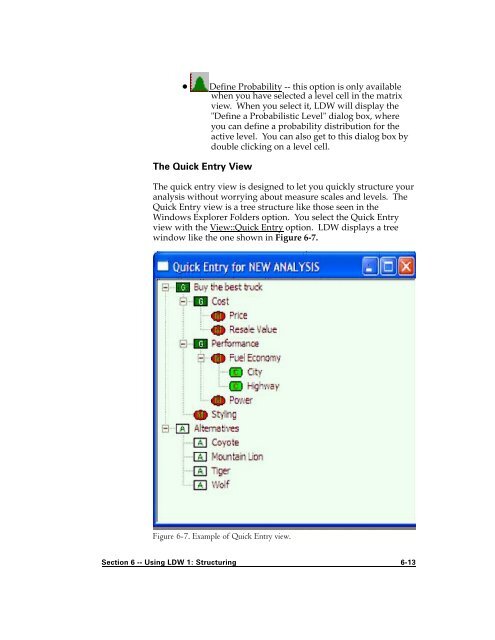
The Quick Entry View<br />
The quick entry view is designed to let you quickly structure your<br />
analysis without worrying about measure scales and levels. The<br />
Quick Entry view is a tree structure like those seen in the<br />
Windows Explorer Folders option. You select the Quick Entry<br />
view with the View::Quick Entry option. LDW displays a tree<br />
window like the one shown in Figure 6-7.<br />
Figure 6-7. Example of Quick Entry view.<br />
Section 6 -- Using LDW 1: Structuring 6-13


