- Page 1 and 2:
Logical Decisions Decision Support
- Page 3 and 4:
Table of Contents Table of Contents
- Page 5 and 6:
Assessing Weights with Weight Ratio
- Page 7:
Assessing Interactions Between Meas
- Page 11 and 12:
Introduction Real decisions aren't
- Page 13:
S E C T I O N Requirements and Inst
- Page 16 and 17:
"Logical Decisions". This program g
- Page 19 and 20:
Quick Start Introduction This secti
- Page 21 and 22:
Defining goals and measures. In LDW
- Page 23 and 24:
Figure 3-1. The SUF for "Years of E
- Page 25 and 26:
weights of the measures. All of the
- Page 27:
S E C T I O N Basic Tutorial 4
- Page 30 and 31:
Figure 4-1. Tutorial overview. 4-2
- Page 32 and 33:
Now lets make sure the alternatives
- Page 34 and 35:
Assume you have decided that you wi
- Page 36 and 37:
Next we will enter the measures for
- Page 38 and 39:
Defining Preferences The alternativ
- Page 40 and 41:
1. Select the Assess::Common Units
- Page 42 and 43:
almost equally unacceptable, while
- Page 44 and 45:
1. Select the Assess::Common Units
- Page 46 and 47:
When you do this, the tradeoff grap
- Page 48 and 49:
1. Select "Performance" and "Price"
- Page 50 and 51:
8. Click on the "Equal" button to t
- Page 52 and 53:
Figure 4-11. Display generated by R
- Page 54 and 55:
Figure 4-13. Overall ranking for tr
- Page 56 and 57:
Figure 4-15. Graph showing sensitiv
- Page 58 and 59:
You can see the completed introduct
- Page 61 and 62:
Advanced Tutorial This tutorial sec
- Page 63 and 64:
Probabilities There is a problem wi
- Page 65 and 66:
This information indicates that the
- Page 67 and 68:
A uniform distribution is defined b
- Page 69 and 70:
On the left is a list of the possib
- Page 71 and 72:
Figure 5-2. Example of Results::Unc
- Page 73 and 74:
screen a large database for the alt
- Page 75 and 76:
9. LDW will ask if you want to appe
- Page 77 and 78:
commit to buying their truck before
- Page 79 and 80:
see that the rankings for all the a
- Page 81:
S E C T I O N Using LDW 1: Structur
- Page 84 and 85:
The Edit::Insert option. The Insert
- Page 86 and 87:
! Summary -- view a dialog box that
- Page 88 and 89:
structure like an organization char
- Page 90 and 91:
If you check the Show Assessment St
- Page 92 and 93:
saves it for later pasting. When yo
- Page 94 and 95:
You can create a new Matrix view by
- Page 96 and 97:
The quick entry view shows the alte
- Page 98 and 99:
Structuring Goals The goals in an L
- Page 100 and 101:
these two fields to describe each m
- Page 102 and 103:
the hierarchy. In the Matrix view,
- Page 104 and 105:
! Point Estimate -- use a single nu
- Page 106 and 107:
Figure 6-12. Example of a measure l
- Page 108 and 109:
Figure 6-14. Example of a measure l
- Page 110 and 111:
pass, LDW replaces each probabilist
- Page 112 and 113:
Figure 6-17. Dialog box for definin
- Page 114 and 115:
Figure 6-18. Measure Category Dialo
- Page 117:
S E C T I O N Using LDW 2: Assessin
- Page 120 and 121:
measure utility functions for the g
- Page 122 and 123:
information as possible when you ch
- Page 124 and 125:
measures with categories require mu
- Page 126 and 127:
The "Reset" button deletes any asse
- Page 128 and 129:
You can change the shape of the cur
- Page 130 and 131:
Figure 7-4. Utility Assessment Scre
- Page 132 and 133:
very different from the average of
- Page 134 and 135:
Figure 7-6. Assessment matrix for A
- Page 136 and 137:
You can, however, leave the assessm
- Page 138 and 139:
properties dialog box can be select
- Page 140 and 141:
the same level. LDW provides a grap
- Page 142 and 143:
options in the Hierarchy menu to ad
- Page 144 and 145:
The check box labeled "Allow Repres
- Page 146 and 147:
Next you will see a tradeoff assess
- Page 148 and 149: The Tradeoff::Use Alternatives to S
- Page 150 and 151: Figure 7-13. Example of Direct Entr
- Page 152 and 153: You can think of the importance num
- Page 154 and 155: Figure 7-15. Assessment Screen for
- Page 156 and 157: When you have selected two members
- Page 158 and 159: ("importance strength") that best d
- Page 160 and 161: clicking on the "Initialize" button
- Page 162 and 163: Set a Small k. The Enter Small k op
- Page 164 and 165: select the tradeoff you would like
- Page 166 and 167: Figure 7-18. Effects of consistency
- Page 169 and 170: Using LDW 3: Reviewing Results Intr
- Page 171 and 172: The curve shows how the utility fun
- Page 173 and 174: The tradeoff graph has one measure
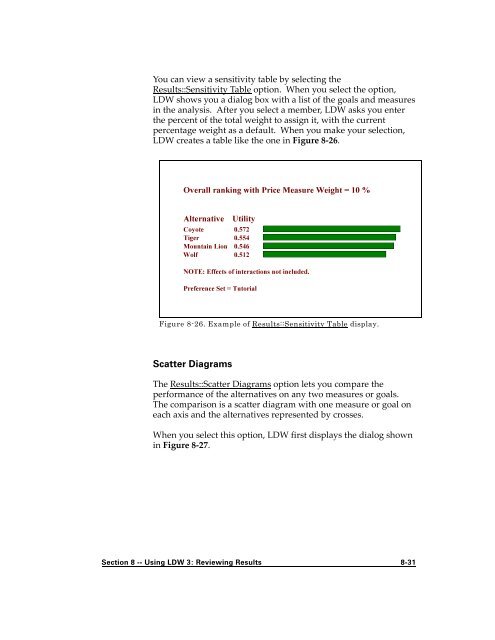
- Page 175 and 176: When you select the option, you are
- Page 177 and 178: the relative weights of the "Price"
- Page 179 and 180: epresents a computer alternative wi
- Page 181 and 182: Figure 8-11. Example of Review::Ass
- Page 183 and 184: e true even if the measure has a ve
- Page 185 and 186: an analysis are included in exactly
- Page 187 and 188: Graph Weights The Graph Weights dis
- Page 189 and 190: Figure 8-16. Results::Rank Alternat
- Page 191 and 192: Figure 8-18. Dialog box for Results
- Page 193 and 194: You can use the measure equivalents
- Page 195 and 196: simulation for each alternative usi
- Page 197: Sensitivity Graphs Sensitivity grap
- Page 201 and 202: Figure 8-28. Example of Results::Sc
- Page 203 and 204: Figure 8-30. Example of Results::Sc
- Page 205 and 206: In the dialog box, you are asked to
- Page 207 and 208: Figure 8-34. Dialog box for Results
- Page 209 and 210: Graph an Alternative The graph an a
- Page 211 and 212: Figure 8-38. Example of Results::Gr
- Page 213 and 214: Finally, the two radio buttons on t
- Page 215 and 216: Figure 8-43. Example of Results::Co
- Page 217 and 218: Printing and Saving Windows You can
- Page 219 and 220: The dialog box will show you the fi
- Page 221 and 222: Figure 8-45. Dialog box for Edit::C
- Page 223 and 224: Changing the range for utility. You
- Page 225 and 226: Figure 8-50. Dialog box for Prefere
- Page 227 and 228: the current color for that type of
- Page 229 and 230: copies the selected objects to the
- Page 231 and 232: analysis with the skeleton analysis
- Page 233 and 234: Figure 8-55. Dialog box for File::I
- Page 235 and 236: the other measures. The measure nam
- Page 237 and 238: The idea of the Import Structure op
- Page 239 and 240: Next, LDW asks you if it should app
- Page 241 and 242: Other Options utility function for
- Page 243: In addition, the Window menu contai
- Page 247 and 248: In Depth Introduction This section
- Page 249 and 250:
A third example is a portfolio deci
- Page 251 and 252:
Each alternative has a raw score (c
- Page 253 and 254:
into more specific goals continues
- Page 255 and 256:
Measures in LDW You define measures
- Page 257 and 258:
computed measure levels to common u
- Page 259 and 260:
Converting the Measures to Common U
- Page 261 and 262:
Figure 9-2. Example of linear (stra
- Page 263 and 264:
For an example of the mid-level spl
- Page 265 and 266:
Since U(L0) = U(80) = 0 and U(L1) =
- Page 267 and 268:
Figure 9-5. Summary of SUF assessme
- Page 269 and 270:
describe two alternatives: A, which
- Page 271 and 272:
with equal chances of 40 and 70 per
- Page 273 and 274:
In the original formulation of the
- Page 275 and 276:
1 Equal Importance Two activities c
- Page 277 and 278:
You begin the process by selecting
- Page 279 and 280:
Figure 9-7. Effects of goals with a
- Page 281 and 282:
0.5. Then the weight assigned to "P
- Page 283 and 284:
! You can use the "Smarter Method"
- Page 285 and 286:
allocates this weight before comput
- Page 287 and 288:
nth root of the product of the rati
- Page 289 and 290:
Figure 9-8. Summary of estimating t
- Page 291 and 292:
on the decision maker's response, L
- Page 293 and 294:
Figure 9-10. MUF assessment figure
- Page 295 and 296:
Now think of adjusting P so that th
- Page 297 and 298:
Another approach is to use the rang
- Page 299 and 300:
Figure 9-12. Quantitative range vs.
- Page 301 and 302:
If a measure’s range changes, LDW
- Page 303 and 304:
Figure 9-14 is an example of the ov
- Page 305 and 306:
Similarly, a single member can have
- Page 307 and 308:
chance having 160 hp (the most pref
- Page 309 and 310:
A probability of less than 0.5 for
- Page 311 and 312:
Interpreting the Ranking Results LD
- Page 313:
S E C T I O N Examples 10
- Page 316 and 317:
the idea that other manufactures an
- Page 318 and 319:
The completed goals hierarchy is sh
- Page 320 and 321:
Buying a House The ranking results
- Page 322 and 323:
Figure 10-5. Goals hierarchy for bu
- Page 324 and 325:
Overall goal Quality goal Costs goa
- Page 326 and 327:
The preference assessments were don
- Page 328 and 329:
Figure 10-9. Goals hierarchy for re
- Page 330 and 331:
! Noise, ! Agricultural Impacts, an
- Page 333:
S E C T I O N Commands Summary 11
- Page 336 and 337:
Assess Menu Edit Menu The Assess me
- Page 338 and 339:
File Menu Edit::Insert Lets you add
- Page 340 and 341:
utility function” if the active g
- Page 342 and 343:
Matrix Menu ! Hierarchy -- options
- Page 344 and 345:
Results::Dynamic Sensitivity See th
- Page 346 and 347:
Review::Compute Utilities Compute t
- Page 348 and 349:
Tradeoff Menu View Menu LDW display
- Page 351:
S E C T I O N Glossary 12
- Page 354 and 355:
Common Units Certainty Equivalent C
- Page 356 and 357:
LDW File Level Lottery Measure assi
- Page 358 and 359:
MUF MUF Formula See also: Alternati
- Page 360 and 361:
Preference Set Probabilistic Level
- Page 362 and 363:
Tradeoff Trial program decides whic
- Page 365:
Bibliography B
- Page 368 and 369:
The classic reference on multiple m
- Page 371 and 372:
Appendix This appendix describes th
- Page 373:
= .125 Thus the weight for cost is
- Page 377 and 378:
Index adjusted AHP ................
- Page 379:
computing ................8 - 3 int