2011 - Cooperative Institute for Research in Environmental Sciences ...
2011 - Cooperative Institute for Research in Environmental Sciences ...
2011 - Cooperative Institute for Research in Environmental Sciences ...

Create successful ePaper yourself
Turn your PDF publications into a flip-book with our unique Google optimized e-Paper software.
AMOS-03 Prediction,<br />
Model Development and Evaluation<br />
n CSD-02 Chemical Transport Model <strong>Research</strong><br />
n PSD-16 Ra<strong>in</strong>drop Size Distributions<br />
n PSD-17 <strong>Environmental</strong> Monitor<strong>in</strong>g and Prediction<br />
n GSD-01 Numerical Weather Prediction<br />
n GSD-03 Verification Techniques <strong>for</strong> the Evaluation of Aviation<br />
Weather Forecasts<br />
n GSD-05 Numerical Prediction Developmental Testbed Center<br />
n GSD-06 <strong>Environmental</strong> In<strong>for</strong>mation Systems<br />
n NGDC-03 Space Weather<br />
n SWPC-01 Solar Disturbances <strong>in</strong> the Geospace Environment<br />
n SWPC-02 Model<strong>in</strong>g the Upper Atmosphere<br />
CSD-02ChemicalTransportModel<strong>Research</strong><br />
FEDERAL LEAD: MICHAEL TRAINER<br />
CIRES LEAD: CHRISTINE ENNIS<br />
NOAA Goal 3: Weather and Water<br />
Project Goal: Undertake research that contributes to the ability<br />
to <strong>for</strong>ecast regional air quality and improves the understand<strong>in</strong>g<br />
of the budget of ozone <strong>in</strong> the upper troposphere.<br />
Milestone 1. Conduct a detailed study of the Cali<strong>for</strong>nia<br />
ozone budget dur<strong>in</strong>g the CalNex field study <strong>in</strong> the spr<strong>in</strong>g of<br />
2010. Impact: This CIRES research will result <strong>in</strong> the first measurement-based<br />
tropospheric ozone budget <strong>for</strong> Cali<strong>for</strong>nia.<br />
The f<strong>in</strong>d<strong>in</strong>gs will enable scientists and air quality mangers to<br />
quantify the contribution of basel<strong>in</strong>e ozone to the exceedances<br />
of ozone air quality standards <strong>in</strong> Cali<strong>for</strong>nia.<br />
S<strong>in</strong>ce 1997, monitor<strong>in</strong>g of tropospheric basel<strong>in</strong>e ozone at<br />
the U.S. West Coast has been limited to the weekly ozonesondes<br />
from Tr<strong>in</strong>idad Head, Calif. To explore basel<strong>in</strong>e<br />
ozone at other latitudes, an ozonesonde network was<br />
implemented dur<strong>in</strong>g spr<strong>in</strong>g 2010, with four launch sites<br />
along the Cali<strong>for</strong>nia coast. Three <strong>in</strong>land sites <strong>in</strong>dicated the<br />
impact of ozone production downw<strong>in</strong>d of the basel<strong>in</strong>e sites.<br />
Modeled North America pollution impacted the Cali<strong>for</strong>nia<br />
coast primarily below 3 km, with no significant impact on<br />
the median coastal ozone profiles. Vertical and latitud<strong>in</strong>al<br />
variation <strong>in</strong> free tropospheric basel<strong>in</strong>e ozone appears to be<br />
partly expla<strong>in</strong>ed by polluted and stratospheric air masses<br />
that descend isentropically along the West Coast. Above 3<br />
km, the dom<strong>in</strong>ant sources of ozone precursors were Ch<strong>in</strong>a<br />
and <strong>in</strong>ternational shipp<strong>in</strong>g, while <strong>in</strong>ternational shipp<strong>in</strong>g<br />
was the greatest source below 2 km. Approximately 8 percent<br />
to 10 percent of the basel<strong>in</strong>e ozone that enters Cali<strong>for</strong>nia<br />
<strong>in</strong> the 0-6 km range impacts the surface of the United<br />
States, but very little reaches the eastern United States.<br />
With<strong>in</strong> Cali<strong>for</strong>nia, the major impact of basel<strong>in</strong>e ozone that<br />
enters the state above 2 km is on the high-elevation terra<strong>in</strong><br />
of eastern Cali<strong>for</strong>nia. Basel<strong>in</strong>e ozone below 2 km has its<br />
strongest impact on the low-elevation sites throughout the<br />
state. Compared to basel<strong>in</strong>e sites, we found no <strong>in</strong>crease <strong>in</strong><br />
lower tropospheric ozone <strong>in</strong> the northern Central Valley,<br />
while ozone <strong>in</strong>creases of 12 percent to 24 percent were<br />
found over the rest of the Central Valley. Enhancements<br />
above Joshua Tree National Park were similar, 16 percent<br />
altitude, km a.s.l.<br />
14<br />
13<br />
12<br />
11<br />
10<br />
9<br />
a.<br />
K E<br />
8<br />
TH S H<br />
7<br />
R Y<br />
6<br />
5<br />
P S<br />
J T<br />
4<br />
3<br />
2<br />
S N<br />
1<br />
0<br />
b.<br />
10 20 30 40 50 60 70 80 90 100<br />
median ozone, ppbv<br />
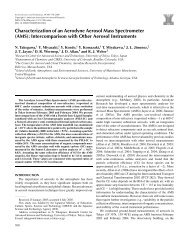
Figure 1. a.) Median ozone profiles above the IONS-2010 ozonesonde sites us<strong>in</strong>g all available<br />
profiles. L<strong>in</strong>e colors correspond to the site label colors <strong>in</strong> panel b. b.) Locations of the seven<br />
IONS-2010 ozonesonde sites. Also shown are the NOAA P3 sampl<strong>in</strong>g locations (blue dots) of the<br />
Figure 1: a) Median ozone profiles above the IONS-2010 ozonesonde sites<br />
us<strong>in</strong>g all available profiles. L<strong>in</strong>e colors correspond to the site label colors<br />
measurements used <strong>in</strong> the Central Valley and LA Bas<strong>in</strong> ozone composite profiles.<br />
<strong>in</strong> panel b; b) Locations of the seven IONS-2010 ozonesonde sites. Also<br />
shown are the NOAA P-3 sampl<strong>in</strong>g locations (blue dots) of the measurements<br />
used <strong>in</strong> the Central Valley and L.A. Bas<strong>in</strong> ozone composite profiles.<br />
to 21 percent, while the greatest ozone enhancements occurred<br />
over the Los Angeles Bas<strong>in</strong>, 29 percent to 60 percent.<br />
Product: Cooper, OR, SJ Oltmans, BJ Johnson, J Brioude,<br />
W Angev<strong>in</strong>e, M Tra<strong>in</strong>er, DD Parrish, TR Ryerson, I Pollack,<br />
PD Cullis, MA Ives, DW Tarasick, J Al-Saadi, and I Stajner<br />
(<strong>2011</strong>), Measurement of western U.S. basel<strong>in</strong>e ozone from<br />
the surface to the tropopause and assessment of downw<strong>in</strong>d<br />
impact regions, J. Geophys. Res., <strong>in</strong> review.<br />
Milestone 2. Use exist<strong>in</strong>g <strong>in</strong>ventories, available field and<br />
satellite measurements, and models to improve the emission<br />
<strong>in</strong>ventories <strong>for</strong> chemical transport models; and <strong>in</strong>itiate a multiagency<br />
ef<strong>for</strong>t to coord<strong>in</strong>ate U.S. research on emissions and<br />
enhance access to emission data sets and tools <strong>for</strong> their evaluation.<br />
Impact: These comparisons will provide an evaluation<br />
of the status of the most recent <strong>in</strong>ventories and the temporal<br />
trends <strong>in</strong> emissions that have been seen over the last decade.<br />
The multiagency <strong>in</strong>itiative will strengthen the research relationships<br />
between the <strong>in</strong>ventory development, observations<br />
and model<strong>in</strong>g communities.<br />
Task 1: We evaluated U.S. <strong>Environmental</strong> Protection<br />
Agency (EPA) 2005 National Emission Inventory<br />
(NEI2005) estimates of air pollution emissions. We focused<br />
on Houston and Dallas, Texas, which regularly violate<br />
Federal air-quality standards (Figure 2). We compared<br />
an atmospheric chemical-transport model to satellite and<br />
NOAA aircraft data of direct pollution emissions (nitrogen<br />
oxides, or NOx, and two highly reactive organic compounds,<br />
ethylene and propylene) and the secondary pollutants<br />
(ozone and <strong>for</strong>maldehyde) <strong>for</strong>med by atmospheric<br />
chemical reactions of these emissions. We found that the<br />
NEI2005 provides reasonable estimates of 2006 Dallas and<br />
Houston motor vehicle emissions. The NEI2005 <strong>in</strong>accurately<br />
represents NOx, ethylene and propylene emissions<br />
from Houston’s petrochemical <strong>in</strong>dustry and NOx<br />
emissions from Houston’s <strong>in</strong>-port commercial shipp<strong>in</strong>g.<br />
Reduc<strong>in</strong>g NEI2005 <strong>in</strong>dustrial and port NOx emissions and<br />
<strong>in</strong>creas<strong>in</strong>g NEI2005 petrochemical ethylene and propylene<br />
emissions <strong>in</strong> Houston improved the model’s ability to<br />
simulate secondary ozone and <strong>for</strong>maldehyde <strong>in</strong> the city’s<br />
pollution plumes.<br />
Task 2: The Community Initiative <strong>for</strong> Emissions <strong>Research</strong><br />
and Applications (CIERA) was <strong>in</strong>itiated through<br />
a partnership of the U.S. EPA, NOAA, the Federation<br />
of Earth Science In<strong>for</strong>mation Partners (ESIP), Department<br />
of Energy (DOE), International Global Atmospheric<br />
Chemistry (IGAC), NCAR, several academic <strong>in</strong>stitutions<br />
CIRES Annual Report <strong>2011</strong> 93