2011 - Cooperative Institute for Research in Environmental Sciences ...
2011 - Cooperative Institute for Research in Environmental Sciences ...
2011 - Cooperative Institute for Research in Environmental Sciences ...

Create successful ePaper yourself
Turn your PDF publications into a flip-book with our unique Google optimized e-Paper software.
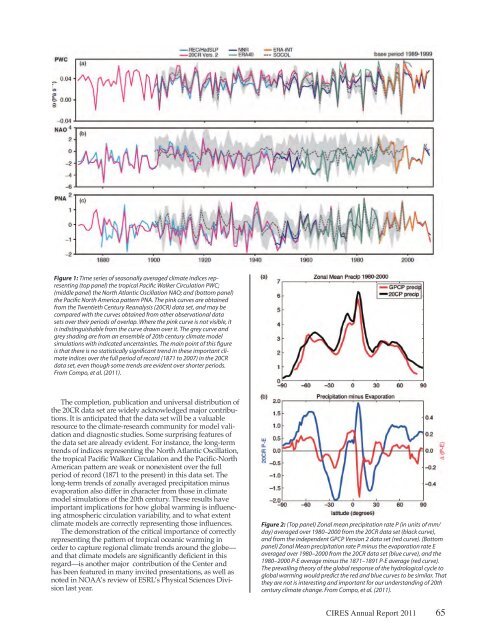
Figure 1: Time series of seasonally averaged climate <strong>in</strong>dices represent<strong>in</strong>g<br />
(top panel) the tropical Pacific Walker Circulation PWC;<br />
(middle panel) the North Atlantic Oscillation NAO; and (bottom panel)<br />
the Pacific North America pattern PNA. The p<strong>in</strong>k curves are obta<strong>in</strong>ed<br />
from the Twentieth Century Reanalysis (20CR) data set, and may be<br />
compared with the curves obta<strong>in</strong>ed from other observational data<br />
sets over their periods of overlap. Where the p<strong>in</strong>k curve is not visible, it<br />
is <strong>in</strong>dist<strong>in</strong>guishable from the curve drawn over it. The grey curve and<br />
grey shad<strong>in</strong>g are from an ensemble of 20th century climate model<br />
simulations with <strong>in</strong>dicated uncerta<strong>in</strong>ties. The ma<strong>in</strong> po<strong>in</strong>t of this figure<br />
is that there is no statistically significant trend <strong>in</strong> these important climate<br />
<strong>in</strong>dices over the full period of record (1871 to 2007) <strong>in</strong> the 20CR<br />
data set, even though some trends are evident over shorter periods.<br />
From Compo, et al. (<strong>2011</strong>).<br />
The completion, publication and universal distribution of<br />
the 20CR data set are widely acknowledged major contributions.<br />
It is anticipated that the data set will be a valuable<br />
resource to the climate-research community <strong>for</strong> model validation<br />
and diagnostic studies. Some surpris<strong>in</strong>g features of<br />
the data set are already evident. For <strong>in</strong>stance, the long-term<br />
trends of <strong>in</strong>dices represent<strong>in</strong>g the North Atlantic Oscillation,<br />
the tropical Pacific Walker Circulation and the Pacific-North<br />
American pattern are weak or nonexistent over the full<br />
period of record (1871 to the present) <strong>in</strong> this data set. The<br />
long-term trends of zonally averaged precipitation m<strong>in</strong>us<br />
evaporation also differ <strong>in</strong> character from those <strong>in</strong> climate<br />
model simulations of the 20th century. These results have<br />
important implications <strong>for</strong> how global warm<strong>in</strong>g is <strong>in</strong>fluenc<strong>in</strong>g<br />
atmospheric circulation variability, and to what extent<br />
climate models are correctly represent<strong>in</strong>g those <strong>in</strong>fluences.<br />
The demonstration of the critical importance of correctly<br />
represent<strong>in</strong>g the pattern of tropical oceanic warm<strong>in</strong>g <strong>in</strong><br />
order to capture regional climate trends around the globe—<br />
and that climate models are significantly deficient <strong>in</strong> this<br />
regard—is another major contribution of the Center and<br />
has been featured <strong>in</strong> many <strong>in</strong>vited presentations, as well as<br />
noted <strong>in</strong> NOAA’s review of ESRL’s Physical <strong>Sciences</strong> Division<br />
last year.<br />
Figure 2: (Top panel) Zonal mean precipitation rate P (<strong>in</strong> units of mm/<br />
day) averaged over 1980–2000 from the 20CR data set (black curve),<br />
and from the <strong>in</strong>dependent GPCP Version 2 data set (red curve). (Bottom<br />
panel) Zonal Mean precipitation rate P m<strong>in</strong>us the evaporation rate E<br />
averaged over 1980–2000 from the 20CR data set (blue curve), and the<br />
1980–2000 P-E average m<strong>in</strong>us the 1871–1891 P-E average (red curve).<br />
The prevail<strong>in</strong>g theory of the global response of the hydrological cycle to<br />
global warm<strong>in</strong>g would predict the red and blue curves to be similar. That<br />
they are not is <strong>in</strong>terest<strong>in</strong>g and important <strong>for</strong> our understand<strong>in</strong>g of 20th<br />
century climate change. From Compo, et al. (<strong>2011</strong>).<br />
CIRES Annual Report <strong>2011</strong> 65