2011 - Cooperative Institute for Research in Environmental Sciences ...
2011 - Cooperative Institute for Research in Environmental Sciences ...
2011 - Cooperative Institute for Research in Environmental Sciences ...

Create successful ePaper yourself
Turn your PDF publications into a flip-book with our unique Google optimized e-Paper software.
Konrad Steffen<br />
with William Colgan<br />
Melt-Flow Acceleration<br />
of the Greenland Ice Sheet<br />
FUNDING: NASA GODDARD SPACE FLIGHT CENTER<br />
This research is <strong>in</strong><br />
support of the cont<strong>in</strong>uous<br />
GPS network on the<br />
Greenland Ice Sheet <strong>in</strong><br />
the vic<strong>in</strong>ity of the Swiss<br />
Camp (SC, Figure 1),<br />
at the western slope of<br />
the ice sheet at approximately<br />
70° N. The GPS<br />
network consists of a<br />
total of eight GPS Trimble<br />
4000 SSE, R5 and R7 receivers<br />
with the objective<br />
to monitor the meltflow<br />
acceleration and<br />
surface-height change.<br />
The GPS receivers are<br />
aligned along the ma<strong>in</strong><br />
flow direction of the ice<br />
sheet (UP50 to JAR2),<br />
and three receivers were placed at the mean equilibrium<br />
l<strong>in</strong>e altitude (ELA) at Swiss Camp, Up50 and S16. Up50 is<br />
located 50 km from SC, N70 is 70 km north of SC and S16<br />
is approximately 16 km south of SC.<br />
At present, Greenland’s mass loss appears to be equally<br />
split between surface mass balance (i.e., melt and runoff)<br />
and ice dynamics (i.e., ice discharge). Predict<strong>in</strong>g the relative<br />
contributions of these two terms to future sea-level<br />
rise is complicated by potential nonl<strong>in</strong>ear feedbacks.<br />
Generally, however, the future ice-dynamic contribution<br />
is regarded as more difficult to <strong>for</strong>ecast than its surfacemass-balance<br />
counterpart. This is due to the <strong>in</strong>ability to<br />
establish the mechanism responsible <strong>for</strong> the recent widespread<br />
acceleration of outlet glaciers.<br />
The research conducted over the past year has focused<br />
on better understand<strong>in</strong>g mechanisms by which (i) <strong>in</strong>creased<br />
surface meltwater production results <strong>in</strong> enhanced<br />
basal slid<strong>in</strong>g and (ii) the recent acceleration may be the onset<br />
of a long-term response to <strong>in</strong>creased effective driv<strong>in</strong>g<br />
stress stemm<strong>in</strong>g from a loss of term<strong>in</strong>us back-stress. The<br />
ablation zone northeast of Ilulissat has an annual velocity<br />
cycle comprised of a summer speedup event followed<br />
by a fall slowdown event<br />
(Figure 2). At the onset<br />
of this project, it was not<br />
evident whether seasonally<br />
enhanced basal slid<strong>in</strong>g<br />
or seasonally reduced<br />
term<strong>in</strong>us back-stress was<br />
responsible <strong>for</strong> this annual<br />
velocity cycle. Our f<strong>in</strong>d<strong>in</strong>gs<br />
now suggest that enhanced<br />
basal slid<strong>in</strong>g is more important<br />
than reduced term<strong>in</strong>us<br />
back-stress <strong>in</strong> determ<strong>in</strong><strong>in</strong>g<br />
<strong>in</strong>land ice velocities.<br />
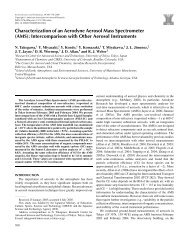
Figure 1: GPS network on the western slope of the Greenland Ice Sheet<br />
monitors the melt-flow acceleration northwest of Ilulissat. The box<br />
around the graph gives the latitude and longitude coord<strong>in</strong>ates; the blue<br />
l<strong>in</strong>e depicts the ice-sheet marg<strong>in</strong>.<br />
Figure 2: Observed 10-day mean ice-surface velocities (grey) and<br />
cumulative positive-degree days (PDD; red) <strong>in</strong> 2005 and 2006 at Swiss<br />
Camp (SC), JAR1 and JAR2 (where available) versus Julian Date. Black<br />
l<strong>in</strong>es denote the bi-Gaussian characterization of the annual ice-surface<br />
velocity cycle at each station.<br />
Above: Nunataks on the eastern slope of the Greenland Ice Sheet close to<br />
Kulusuk—blue ice areas <strong>for</strong>m on the downw<strong>in</strong>d side of the mounta<strong>in</strong>s.<br />
Left: GPS unit with solar panels and climate <strong>in</strong>struments at S16 (see Figure 1).<br />
CIRES Annual Report <strong>2011</strong> 51