2011 - Cooperative Institute for Research in Environmental Sciences ...
2011 - Cooperative Institute for Research in Environmental Sciences ...
2011 - Cooperative Institute for Research in Environmental Sciences ...

You also want an ePaper? Increase the reach of your titles
YUMPU automatically turns print PDFs into web optimized ePapers that Google loves.
Noah Fierer<br />
Microbial Life <strong>in</strong> the Atmosphere<br />
NATIONAL SCIENCE FOUNDATION, U.S. DEPARTMENT OF<br />
AGRICULTURE, ENVIRONMENTAL PROTECTION AGENCY<br />
Bacteria are abundant<br />
<strong>in</strong> the atmosphere, with the<br />
near-surface atmosphere<br />
conta<strong>in</strong><strong>in</strong>g more than 106<br />
bacterial cells per cubic<br />
meter of air. Atmospheric<br />
transport is<br />
a key mode of microbial<br />
dispersal,<br />
and the transmission<br />
of airborne<br />
plant and animal<br />
pathogens can<br />
significantly affect<br />
ecosystems,<br />
agriculture and<br />
human health. For<br />
example, recent<br />
work implicates<br />
bacteria found <strong>in</strong><br />
outdoor air—rather than pollen or fungi—as be<strong>in</strong>g one of<br />
the dom<strong>in</strong>ant triggers of allergies and asthmatic reactions <strong>in</strong><br />
many locations. In addition, recent evidence suggests that airborne<br />
bacteria may be able to alter atmospheric dynamics by<br />
facilitat<strong>in</strong>g atmospheric ice nucleation and cloud condensation.<br />
Our ongo<strong>in</strong>g work addresses two fundamental questions<br />
regard<strong>in</strong>g bacteria <strong>in</strong> the atmosphere:<br />
1) What is the full extent of bacterial diversity <strong>in</strong> the nearsurface<br />
atmosphere?, 2) How does the abundance, composition<br />
and diversity of airborne bacterial communities change<br />
seasonally and across the cont<strong>in</strong>ental U.S.?<br />
We have been address<strong>in</strong>g these questions with a series of<br />
studies conducted across a range of sites <strong>in</strong>clud<strong>in</strong>g: the Colorado<br />
Front Range, a mounta<strong>in</strong>top research facility <strong>in</strong> northern<br />
Colorado (Storm Peak Laboratory, Figure 2) and metropolitan<br />
areas across the Midwest. We used a range of molecular techniques,<br />
<strong>in</strong>clud<strong>in</strong>g high-throughput pyrosequenc<strong>in</strong>g and flow<br />
cytometry, to characterize bacterial diversity and cell abundances<br />
<strong>in</strong> the collected air samples. We have analyzed more<br />
than 400 <strong>in</strong>dividual air samples yield<strong>in</strong>g the largest and most<br />
comprehensive survey of airborne bacterial diversity conducted<br />
to date. We have found that bacterial cells often represent<br />
an unexpectedly large portion (typically more than 20 percent)<br />
of total aerosol particles, with the average cubic meter of air<br />
harbor<strong>in</strong>g more than 100 unique bacterial species. We observe<br />
strong geographic and seasonal changes <strong>in</strong> airborne bacterial<br />
community composition that are largely driven by changes <strong>in</strong><br />
land-surface characteristics.<br />
We are currently expand<strong>in</strong>g on this work to exam<strong>in</strong>e<br />
airborne bacterial diversity across broader spatial and<br />
temporal gradients <strong>in</strong> order to build predictive models of<br />
airborne bacterial abundances and diversity. We also have<br />
<strong>in</strong>itiated a ‘citizen-science’ project, the MiASMA project<br />
(Mapp<strong>in</strong>g and Integrated AnalySis of Microbes <strong>in</strong> the Atmosphere;<br />
http://t<strong>in</strong>yurl.com/3tybvmt), to build an atlas of<br />
airborne microbial diversity across the cont<strong>in</strong>ental U.S.<br />
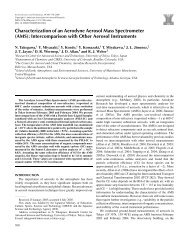
Figure 1: Network analysis of the airborne bacterial communities collected<br />
from the Storm Peak Laboratory. Individual samples are denoted<br />
by the larger circles and color coded by season with the smaller black<br />
dots <strong>in</strong>dicat<strong>in</strong>g <strong>in</strong>dividual bacterial species. L<strong>in</strong>es <strong>in</strong>dicate species shared<br />
between samples. This plot not only shows the high levels of bacterial<br />
diversity found <strong>in</strong> the collected air samples, but it also <strong>in</strong>dicates that the<br />
species composition changes seasonally.<br />
Figure 2: Views of Storm Peak Laboratory (Steamboat, Colo., 3220 M.A.S.L.)<br />
dur<strong>in</strong>g each of the air-sampl<strong>in</strong>g campaigns (photos taken by R. Bowers).<br />
CIRES Annual Report <strong>2011</strong> 35