2011 - Cooperative Institute for Research in Environmental Sciences ...
2011 - Cooperative Institute for Research in Environmental Sciences ...
2011 - Cooperative Institute for Research in Environmental Sciences ...

You also want an ePaper? Increase the reach of your titles
YUMPU automatically turns print PDFs into web optimized ePapers that Google loves.
Tom Chase<br />
Land and Ocean Surface Impacts<br />
on Global Hydrology<br />
We cont<strong>in</strong>ue to exam<strong>in</strong>e<br />
the impact of surface<br />
hydrology on climate,<br />
particularly <strong>in</strong> the massively<br />
irrigated regions<br />
of Asia, and have found<br />
evidence of substantial<br />
impacts both <strong>in</strong> observational<br />
and model simulation<br />
studies. For example,<br />
irrigation <strong>in</strong> India seems<br />
to have reduced monsoon<br />
ra<strong>in</strong>fall and slowed the<br />
East Asian Jet maximum,<br />
<strong>in</strong>dicat<strong>in</strong>g that circulations<br />
around the globe<br />
could be affected by<br />
human disturbances to<br />
the land surface <strong>in</strong> remote<br />
areas.<br />
We have cont<strong>in</strong>ued exam<strong>in</strong><strong>in</strong>g m<strong>in</strong>imum temperature<br />
regulation by convection at high latitudes and have<br />
updated our observational analysis of this phenomenon <strong>in</strong><br />
the last year. This work documents that mid-tropospheric<br />
temperatures at high latitudes reach a m<strong>in</strong>imum (about<br />
-40°C) early <strong>in</strong> the w<strong>in</strong>ter and then never get much colder,<br />
despite the lack of solar <strong>in</strong>put <strong>for</strong> months. We hypothesize<br />
that this is due to convective heat<strong>in</strong>g driven by sea-surface<br />
temperature slightly below 0°C <strong>in</strong> cold air masses that<br />
migrate over the ocean. Surface air rises moist adiabatically<br />
to reach the observed m<strong>in</strong>imum by 500 mb. We are propos<strong>in</strong>g<br />
to extend this to maximum temperatures and lower<br />
latitudes <strong>in</strong> future work.<br />
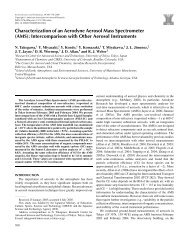
F<strong>in</strong>ally, we also have been look<strong>in</strong>g <strong>in</strong>to low-level <strong>in</strong>versions<br />
<strong>in</strong> the Western United States, which we found to<br />
have substantially decreased <strong>in</strong> frequency—but <strong>in</strong>creased<br />
<strong>in</strong> strength—over the period of record <strong>in</strong> six Western cities<br />
(Figures 1 and 2 show trends <strong>in</strong> <strong>in</strong>version frequency and<br />
strength <strong>in</strong> Denver, Colo.). This is of <strong>in</strong>terest because air<br />
quality <strong>in</strong> the West is a function of <strong>in</strong>version frequency and<br />
strength and because climate models have predicted that<br />
<strong>in</strong>versions would be more frequent <strong>in</strong> a warm<strong>in</strong>g climate.<br />
0.5<br />
0.4<br />
0.3<br />
0.2<br />
0.1<br />
0<br />
-0.1<br />
-0.2<br />
-0.3<br />
Denver, Colorado<br />
Frequency Anomaly<br />
L<strong>in</strong>ear Regression<br />
Locally Weighted Regression<br />
-0.4<br />
1994 1996 1998 2000 2002 2004 2006 2008<br />
Figure 1: Monthly anomalies <strong>in</strong> the occurrence of two or more consecutive<br />
days <strong>in</strong> Denver, Colo., dur<strong>in</strong>g which low-level daytime <strong>in</strong>versions were present.<br />
Y-axis is fraction of days per month, and x-axis is calendar year. Locally<br />
weighted regressions smooth the orig<strong>in</strong>al data us<strong>in</strong>g a 0.7 span.<br />
6<br />
5<br />
4<br />
3<br />
2<br />
1<br />
Denver, Colorado<br />
Monthly Mean Strength<br />
L<strong>in</strong>ear Regression<br />
0<br />
1994 1996 1998 2000 2002 2004 2006 2008<br />
Figure 2: Monthly anomalies <strong>in</strong> frequencies (fraction of days per month<br />
dur<strong>in</strong>g which <strong>in</strong>versions were present) of low-level <strong>in</strong>versions. Y-axis is<br />
fraction of days per month, and x-axis is calendar year.<br />
CIRES Annual Report <strong>2011</strong> 29