2011 - Cooperative Institute for Research in Environmental Sciences ...
2011 - Cooperative Institute for Research in Environmental Sciences ...
2011 - Cooperative Institute for Research in Environmental Sciences ...

Create successful ePaper yourself
Turn your PDF publications into a flip-book with our unique Google optimized e-Paper software.
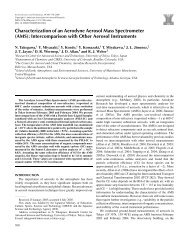
Several climate-monitor<strong>in</strong>g products created by the Physical <strong>Sciences</strong> Division.<br />
PSD-07 Experimental Climate Data<br />
and Web Services<br />
FEDERAL LEADS: NICK WILDE AND RANDALL DOLE<br />
CIRES LEADS: PRASHANT SARDESHMUKH<br />
AND CATHERINE SMITH<br />
NOAA Goal 2: Climate<br />
Project Goal: Improve public access to climate <strong>in</strong><strong>for</strong>mation<br />
and <strong>for</strong>ecast products to facilitate research, to <strong>in</strong><strong>for</strong>m public<br />
plann<strong>in</strong>g and policy decisions, and to assist any <strong>in</strong>terested<br />
parties impacted by climate.<br />
Milestone 1. Improve PSD’s visualization and analysis of<br />
climate data to support experimental monitor<strong>in</strong>g and explanation<br />
of current and evolv<strong>in</strong>g climate conditions, and<br />
to advance understand<strong>in</strong>g of the climate system through<br />
imag<strong>in</strong>g and animation.<br />
The Physical <strong>Sciences</strong> Division (PSD) has created a<br />
number of products that make it easier to monitor the<br />
current climate and the processes that affect the climate.<br />
One research topic was look<strong>in</strong>g at the factors affect<strong>in</strong>g<br />
hurricane <strong>for</strong>mation and ma<strong>in</strong>tenance. Web pages were<br />
developed to monitor the 2010 Atlantic hurricane season,<br />
present<strong>in</strong>g current and historic w<strong>in</strong>d shear and sea surface<br />
temperature (SST) plots. An analysis of the 2010 Rus-<br />
122 CIRES Annual Report <strong>2011</strong><br />
sian Heat Wave was presented on the climate attribution<br />
(CSI) page, <strong>in</strong>corporat<strong>in</strong>g an <strong>in</strong>teractive map and plots of<br />
climate model simulations.<br />
The PSD maproom website, which is an ongo<strong>in</strong>g collection<br />
of climate/weather monitor<strong>in</strong>g plots, has been<br />
revamped with a new look and better graphics. Interactive,<br />
animated visualizations are displayed cont<strong>in</strong>uously<br />
<strong>in</strong> the Climate/Weather Visualization Lab (see photo) <strong>for</strong><br />
real-time monitor<strong>in</strong>g of climate conditions.<br />
Web applications <strong>for</strong> plott<strong>in</strong>g maps and time series have<br />
been developed <strong>for</strong> the 20th Century Reanalysis to allow<br />
comparison of past and present climate. PSD has also<br />
generated Science-on-a-Sphere animations of this data set.<br />
Experimental web pages <strong>in</strong>clude an updated tropical SST<br />
<strong>for</strong>ecast page and a page <strong>for</strong>ecast<strong>in</strong>g outgo<strong>in</strong>g long-wave<br />
radiation (OLR) <strong>for</strong> tropical weather prediction. Significant<br />
updates to our climate monitor<strong>in</strong>g data sets this past year<br />
<strong>in</strong>clude the 20th Century V2 Reanalysis, the NOAA merged<br />
SST and the NOAA high-resolution SST and ice data set.<br />
Product: Dole, R, M Hoerl<strong>in</strong>g, J Perlwitz, J Eischeid,<br />
P Pegion, T Zhang, X Quan, T Xu, and D Murray<br />
(2010), Was there a basis <strong>for</strong> anticipat<strong>in</strong>g the 2010<br />
Russian Heat Wave?, Geophys. Res. Lett., 38, L06702,<br />
doi:10.1029/2010GL046582.