2011 - Cooperative Institute for Research in Environmental Sciences ...
2011 - Cooperative Institute for Research in Environmental Sciences ...
2011 - Cooperative Institute for Research in Environmental Sciences ...

Create successful ePaper yourself
Turn your PDF publications into a flip-book with our unique Google optimized e-Paper software.
feedbacks, on the SSTs <strong>in</strong> the models, whereas differences<br />
<strong>in</strong> the representation of the tropical oceanic wave dynamics<br />
are likely less important.<br />
Product: Sh<strong>in</strong>, SI, PD Sardeshmukh, and K Pegion (2010),<br />
Realism of local and remote feedbacks on tropical sea surface<br />
temperatures <strong>in</strong> climate models, J. Geophys. Res., 115,<br />
D21110, doi:10.1029/2010JD013927.<br />
PSD-15SurfaceProcesses<br />
FEDERAL LEAD: CHRIS FAIRALL<br />
CIRES LEAD: OLA PERRSON<br />
NOAA Goal 2: Climate<br />
Project Goal: Comb<strong>in</strong>e state-of-the-art observations of<br />
surface fluxes, boundary-layer structure and mesoscale<br />
features with high-resolution numerical model<strong>in</strong>g. Current<br />
work focuses on boundary layers over ice/snow surfaces and<br />
the effects of terra<strong>in</strong> on coastal precipitation. High quality<br />
observations of surface turbulent, radiative and precipitation<br />
fluxes are comb<strong>in</strong>ed with radar measurements and mesoscale<br />
model simulations. Parameterizations are be<strong>in</strong>g developed<br />
<strong>for</strong> stable surface-layer flux-profile relationships and l<strong>in</strong>k<strong>in</strong>g<br />
terra<strong>in</strong> slopes and w<strong>in</strong>d-vector profiles to spatial patterns of<br />
precipitation accumulations.<br />
Milestone 1. Analyze data from Surface Heat Budget of the<br />
Arctic (SHEBA); Arctic Summer Cloud Ocean Study (ASCOS);<br />
Arctic Mechanisms of Interaction between Surface and Atmosphere<br />
(AMISA); and other field programs to understand<br />
the l<strong>in</strong>ks between the clouds, atmospheric boundary layer,<br />
and surface processes over sea ice. Evaluate their respective<br />
contributions to the net surface energy fluxes<br />
Analyses of the sound<strong>in</strong>gs, surface energy budget and<br />
surface temperatures at SHEBA and ASCOS and analyses<br />
of sound<strong>in</strong>gs and surface temperatures from Soviet drift<strong>in</strong>g<br />
stations have provided <strong>in</strong>sights <strong>in</strong>to the processes produc<strong>in</strong>g<br />
the onset and end of melt over sea ice. A paper submitted <strong>for</strong><br />
publication on describ<strong>in</strong>g the SHEBA melt transitions l<strong>in</strong>ks the<br />
surface energy budget to free-troposphere synoptic variables,<br />
clouds, precipitation and <strong>in</strong>-ice temperatures.<br />
The key results are 1) SHEBA melt-season transitions are<br />
associated with atmospheric synoptic events; 2) onset of melt<br />
clearly occurs on May 28, while the end of melt is produced<br />
by a sequence of three atmospheric storm events over a 28day<br />
period produc<strong>in</strong>g step-like reductions <strong>in</strong> the net surface<br />
energy flux—the last one occurs on Aug. 22; 3) Melt onset is<br />
primarily due to large <strong>in</strong>creases <strong>in</strong> the downwell<strong>in</strong>g longwave<br />
radiation and modest decreases <strong>in</strong> the surface albedo; 4)<br />
decreases <strong>in</strong> the downwell<strong>in</strong>g longwave radiation occur <strong>for</strong> all<br />
end-of-melt transition steps, while <strong>in</strong>creases <strong>in</strong> surface albedo<br />
occur <strong>for</strong> the first two; 5) changes <strong>in</strong> downwell<strong>in</strong>g shortwave<br />
radiation contributes only to the first end-of-melt transition<br />
step; 6) spr<strong>in</strong>gtime free-tropospheric warm<strong>in</strong>g preconditions<br />
the atmosphere-ice system <strong>for</strong> the subsequent melt onset; and<br />
7) melt-season transitions also mark transitions <strong>in</strong> system responses<br />
to radiative energy flux changes because of <strong>in</strong>variant<br />
melt-season surface temperatures. (See Figure 1.)<br />
The last result is the reason that the length of the summer<br />
melt season has a large impact on the mass balance of the<br />
sea ice. Significant energy flux excess, and hence ice loss, can<br />
only occur when the surface temperature is fixed and unable<br />
to radiatively compensate <strong>for</strong> large positive energy fluxes.<br />
The extensive SHEBA observations enable an understand<strong>in</strong>g<br />
118 CIRES Annual Report <strong>2011</strong><br />
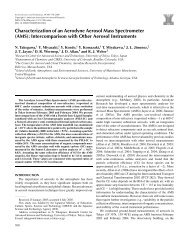
Figure 1: Temperature <strong>in</strong> the a) atmosphere and c) snow and ice from<br />
April 30 (YD485) to June 20 (YD536), 1998 at SHEBA. Panel b) shows the<br />
daily mean net energy fluxes and the time of melt onset (vertical black<br />
bar). In a) and c), the 0°C isotherm is shown <strong>in</strong> bold red and the height of<br />
the maximum RHw <strong>for</strong> RHw > 95% is shown <strong>in</strong> bold black <strong>in</strong> a). In b), the<br />
times of spr<strong>in</strong>gtime synoptic events discussed are shaded but unlabeled,<br />
while P1 and P2 are discussed <strong>in</strong> Table 3. In c), the snow surface is shown<br />
by the green l<strong>in</strong>e, the snow-ice <strong>in</strong>terface by the blue l<strong>in</strong>e, and the ice bottom<br />
by the thick black l<strong>in</strong>e. Temperatures near the top of the snow may<br />
be biased by solar radiation<br />
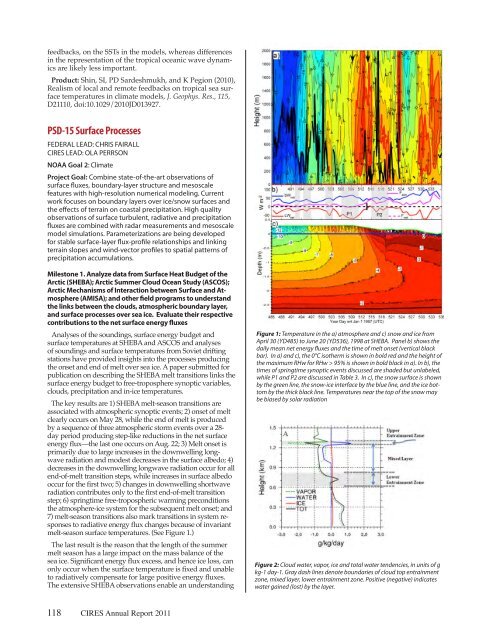
Figure 2: Cloud water, vapor, ice and total water tendencies, <strong>in</strong> units of g<br />
kg-1 day-1. Gray dash l<strong>in</strong>es denote boundaries of cloud top entra<strong>in</strong>ment<br />
zone, mixed layer, lower entra<strong>in</strong>ment zone. Positive (negative) <strong>in</strong>dicates<br />
water ga<strong>in</strong>ed (lost) by the layer.