2011 - Cooperative Institute for Research in Environmental Sciences ...
2011 - Cooperative Institute for Research in Environmental Sciences ...
2011 - Cooperative Institute for Research in Environmental Sciences ...

Create successful ePaper yourself
Turn your PDF publications into a flip-book with our unique Google optimized e-Paper software.
Milestone 4. Analyze balloon-borne measurements of water<br />
vapor <strong>in</strong> the UTLS to reveal multiple-year trends and<br />
attempt to attribute them to geophysical processes.<br />
A statistical analysis of the 30-year record of stratospheric<br />
water vapor mix<strong>in</strong>g ratios over Boulder, Colo., was per<strong>for</strong>med<br />
to quantify multiple-year trends [Hurst, et al., <strong>2011</strong>].<br />
The record was compiled from more than 300 balloon flights<br />
carry<strong>in</strong>g the NOAA frost po<strong>in</strong>t hygrometer. The long measurement<br />
record was divided <strong>in</strong>to four dist<strong>in</strong>ct time periods<br />
(roughly 1980–1989, 1990–2000, 2001–2005 and 2006–2010)<br />
and analyzed <strong>for</strong> trends <strong>in</strong> 2-km altitude layers. Overall,<br />
stratospheric water vapor <strong>in</strong>creased by 1±0.2 ppmv (27±6%)<br />
from 1980 to 2010. Net <strong>in</strong>creases were found <strong>for</strong> all but the<br />
2001–2005 period, when water vapor mix<strong>in</strong>g ratios dropped<br />
precipitously due to a decl<strong>in</strong>e <strong>in</strong> tropical tropopause temperatures<br />
driven by <strong>in</strong>creased tropical upwell<strong>in</strong>g. Increased<br />
methane oxidation <strong>in</strong> the stratosphere dur<strong>in</strong>g 1980–2010<br />
can expla<strong>in</strong> only 30 percent of the net water vapor <strong>in</strong>crease.<br />
Attempts to f<strong>in</strong>d a long-term warm<strong>in</strong>g trend <strong>in</strong> tropical<br />
tropopause temperatures that would cause an <strong>in</strong>crease <strong>in</strong><br />
stratospheric water vapor have been unsuccessful. It has<br />
been suggested that a gradual widen<strong>in</strong>g of the tropics and/<br />
or <strong>in</strong>crease <strong>in</strong> the strength of the Brewer-Dobson circulation<br />
dur<strong>in</strong>g Northern Hemisphere summer would br<strong>in</strong>g additional<br />
moisture from the troposphere <strong>in</strong>to the stratosphere.<br />
Recent water vapor sound<strong>in</strong>gs over Boulder <strong>in</strong>dicate that<br />
stratospheric water vapor mix<strong>in</strong>g ratios had nearly recovered<br />
to pre-2001 values by the end of 2010 and cont<strong>in</strong>ued<br />
to <strong>in</strong>crease dur<strong>in</strong>g the first half of <strong>2011</strong>. Work cont<strong>in</strong>ues to<br />
determ<strong>in</strong>e the causal mechanisms <strong>for</strong> these significant variations<br />
<strong>in</strong> midlatitude stratospheric water vapor abundance.<br />
CSV-03 Stratospheric Ozone Depletion<br />
n CSD-04 Photochemical and Dynamical Processes That<br />
Influence Upper Troposphere/ Lower Stratosphere Ozone<br />
n GMD-05 Ozone Depletion<br />
CSD-04PhotochemicalandDynamicalProcesses<br />
thatInfluenceUpperTroposphere/Lower<br />
StratosphereOzone<br />
FEDERAL LEAD: KAREN ROSENLOF<br />
CIRES LEAD: CHRISTINE ENNIS<br />
114 CIRES Annual Report <strong>2011</strong><br />
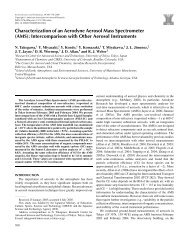
Figure 2: Smoothed representation<br />
of the 30-year ‘Boulder<br />
Record’ of stratospheric water<br />
vapor mix<strong>in</strong>g ratios. A net<br />
<strong>in</strong>crease of 1.0±0.2 ppmv<br />
(27±6%) was determ<strong>in</strong>ed<br />
<strong>for</strong> 1980–2010 [Hurst, et al.,<br />
<strong>2011</strong>].<br />
NOAA Goal 2: Climate<br />
Project Goal: Improve theoretical capabilities to predict the<br />
natural and human <strong>in</strong>fluences on the stratospheric ozone<br />
layer. Characterize the photochemical reactions relat<strong>in</strong>g to the<br />
anthropogenic loss of ozone <strong>in</strong> the stratosphere. Carry out <strong>in</strong><br />
situ studies of the photochemical and dynamical processes<br />
that <strong>in</strong>fluence the stratospheric ozone layer.<br />
Milestone 1. Use ozone data from flights of the National<br />
Center <strong>for</strong> Atmospheric <strong>Research</strong> HIAPER Gulfstream-V<br />
aircraft and the Global Hawk unmanned aircraft system<br />
to exam<strong>in</strong>e transport and photochemical processes <strong>in</strong> the<br />
upper troposphere and lower stratosphere. Impact: The<br />
data and <strong>in</strong>tercomparisons with high-resolution models<br />
will offer new <strong>in</strong>sights <strong>in</strong>to how ozone can be used to constra<strong>in</strong><br />
transport and photochemical processes <strong>in</strong> global<br />
models.<br />
In situ measurements of ozone <strong>in</strong> the upper troposphere<br />
and lower stratosphere (UTLS) have been made <strong>in</strong> the<br />
past several years from the NCAR/NSF HIAPER G-V<br />
(High-per<strong>for</strong>mance Instrumented Airborne Plat<strong>for</strong>m <strong>for</strong><br />
<strong>Environmental</strong> <strong>Research</strong> Gulfstream V) and the NASA<br />
Global Hawk UAS (Unmanned Aircraft System) <strong>in</strong> the Pacific<br />
Ocean and Arctic regions, spann<strong>in</strong>g a latitude range<br />
from 85° N to 67° S. These measurements provide an<br />
excellent data set <strong>for</strong> comparison with satellite measurements<br />
and high-resolution models. To date, the data from<br />
one of the HIAPER Pole-to-Pole Observations (HIPPO)<br />
missions have been compared with output of the Realtime<br />
Air Quality Model<strong>in</strong>g System (RAQMS). RAQMS<br />
simulates ozone based on model physics and chemistry,<br />
Global Forecast System meteorology and constra<strong>in</strong>ts<br />
from assimilated Ozone Monitor<strong>in</strong>g Instrument cloudcleared<br />
total column ozone and Microwave Limb Sounder<br />
stratospheric ozone profiles from the NASA Aura satellite.<br />
Initial comparisons between the satellite-constra<strong>in</strong>ed<br />
RAQMS <strong>for</strong>ecasts (2° x 2° grid) and <strong>in</strong> situ ozone measurements<br />
<strong>in</strong>dicate that 1) the model does not fully reproduce<br />
the variability observed throughout the extratropical<br />
UTLS region and 2) the model exhibits a low bias <strong>in</strong> the<br />
high-latitude lower stratosphere. The model-measurement<br />
differences exceeded 40 percent <strong>for</strong> nearly one-third of the<br />
extratropical UTLS data. Some of these discrepancies are<br />
likely related to the systematic profil<strong>in</strong>g of the G-V aircraft<br />
near the tropopause <strong>in</strong> the extratropics where the vertical<br />
ozone gradients are large and significant variations occur<br />
at scales not resolved by RAQMS.