2011 - Cooperative Institute for Research in Environmental Sciences ...
2011 - Cooperative Institute for Research in Environmental Sciences ...
2011 - Cooperative Institute for Research in Environmental Sciences ...

Create successful ePaper yourself
Turn your PDF publications into a flip-book with our unique Google optimized e-Paper software.
CSD-12EmissionsandAtmosphericComposition<br />
FEDERAL LEAD: SUSAN SOLOMON<br />
CIRES LEAD: CHRISTINE ENNIS<br />
NOAA Goal 2: Climate<br />
Project Goal: Improve understand<strong>in</strong>g of past and projected<br />
future anthropogenic and natural emissions of atmospheric<br />
trace gases that <strong>in</strong>fluence climate and climate variability.<br />
Milestone 1. Evaluate anthropogenic and natural surface<br />
emissions of atmospheric chemical compounds dur<strong>in</strong>g<br />
the past two decades by mak<strong>in</strong>g detailed comparisons of<br />
available emissions <strong>in</strong>ventories, and evaluate the consistency<br />
between global and regional emissions, and the impact<br />
on the composition of the atmosphere. Impact: This<br />
study will provide <strong>in</strong><strong>for</strong>mation used as <strong>in</strong>puts <strong>in</strong> climate<br />
models, focus<strong>in</strong>g on the chemical compounds detected<br />
from space (CO, NO2, ozone) and on hydrocarbons from<br />
natural and anthropogenic orig<strong>in</strong>s.<br />
Several different <strong>in</strong>ventories of global and regional<br />
anthropogenic and biomass burn<strong>in</strong>g emissions have been<br />
assessed <strong>for</strong> the 1980-2010 period. The species considered<br />
so far are CO, NOx, SO2 and black carbon. The Atmospheric<br />
Chemistry and Climate Model Intercomparison Project<br />
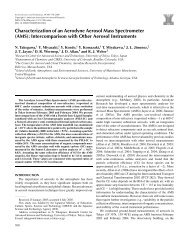
Figure 1: Comparison of SO2 emissions <strong>in</strong> Ch<strong>in</strong>a from 1980 to 2010 from<br />
different surface emissions <strong>in</strong>ventories.<br />
Figure 2: European-wide composite of modelled and observed monthly<br />
means of NO2 trend (µg/m 3 ) at the air quality monitor<strong>in</strong>g stations of<br />
background suburban and rural type. The straight l<strong>in</strong>e shows the best<br />
l<strong>in</strong>ear least square fit <strong>for</strong> each model results.<br />
110 CIRES Annual Report <strong>2011</strong><br />
(ACCMIP) historical emissions developed <strong>in</strong> support of the<br />
simulations <strong>for</strong> the Intergovernmental Panel on Climate<br />
Change Fifth Assessment Report are also considered. Emissions<br />
from the Representative Concentration Pathways<br />
(RCPs) are also <strong>in</strong>cluded. Large discrepancies between the<br />
global and regional emissions are identified, which shows<br />
that there is still no consensus on the best estimates <strong>for</strong><br />
surface emissions. At the global scale, anthropogenic emissions<br />
of CO, NOx and SO2 show the best agreement <strong>for</strong><br />
most years, although agreement does not necessarily mean<br />
that uncerta<strong>in</strong>ty is low. The agreement is low <strong>for</strong> BC emissions,<br />
particularly <strong>in</strong> the period prior to 2000. The best consensus<br />
is <strong>for</strong> NOx emissions <strong>for</strong> all periods and all regions,<br />
except <strong>for</strong> Ch<strong>in</strong>a, where emissions <strong>in</strong> 1980 and 1990 need<br />
to be better def<strong>in</strong>ed. Emissions of CO need better quantification<br />
<strong>for</strong> all periods. The agreement between the different<br />
SO2 emissions data sets is rather good <strong>for</strong> the United<br />
States, but better quantification is needed elsewhere. The<br />
comparisons show that the use of RCP 8.5 <strong>for</strong> the extension<br />
of the ACCMIP <strong>in</strong>ventory beyond 2000 is reasonable,<br />
until more global or regional estimates become available.<br />
Biomass burn<strong>in</strong>g <strong>in</strong>ventories agree with<strong>in</strong> 50-80 percent,<br />
depend<strong>in</strong>g on the year and season. The large differences<br />
between datasets are due to differences <strong>in</strong> the estimates of<br />
burned areas from the different available products, as well<br />
as <strong>in</strong> the amount of biomass burned.<br />
Product: Granier, C, B Bessagnet, T Bond, A D’Angiola,<br />
H Denier van der Gon, G Frost, A Heil, J Kaiser, S K<strong>in</strong>ne,<br />
Z Klimont, JF Lamarque, C Liousse, T Masui, F Meleux, A<br />
Mieville, T Ohara, K Riahi, M Schultz, S Smith, A Thomson,<br />
J van Aardenne and G van der Werf (<strong>2011</strong>), Evolution<br />
of anthropogenic and biomass burn<strong>in</strong>g emissions at global<br />
and regional scales dur<strong>in</strong>g the 1980-2010 period,<br />
Clim. Change, accepted <strong>for</strong> publication.<br />
Milestone 2. Evaluate the evolution of the chemical<br />
composition of the atmosphere dur<strong>in</strong>g the next two to<br />
three decades, us<strong>in</strong>g the different emissions scenarios<br />
developed <strong>in</strong> support of the Intergovernmental Panel on<br />
Climate Change (IPCC) Fifth Assessment Report (AR5) to<br />
assess different Representative Concentrations Pathways<br />
(RCPs). Impact: This research will support the IPCC AR5<br />
report by determ<strong>in</strong><strong>in</strong>g the effects of different RCPs on the<br />
distribution of chemical species and on their deposition<br />
at the surface, which will enable improved understand<strong>in</strong>g<br />
and model<strong>in</strong>g of the effect of atmospheric chemical<br />
composition on climate.<br />
The proposed work has started with an evaluation of<br />
the capability of chemistry-transport models to reproduce<br />
past trends <strong>in</strong> air quality. Document<strong>in</strong>g these strengths<br />
and weaknesses on the basis of historical simulations is<br />
essential be<strong>for</strong>e the models can be used to assess future<br />
air-quality projections. Different regional and global models<br />
have been used to simulate the evolution of air quality<br />
dur<strong>in</strong>g the 1997-2008 period. The analysis has so far<br />
focused on ozone and nitrogen dioxide, <strong>for</strong> which surface,<br />
as well as satellite, observations are available. A paper has<br />
been submitted <strong>in</strong> June <strong>2011</strong>, which focuses on the results<br />
obta<strong>in</strong>ed <strong>for</strong> the European region. The analysis of the<br />
model results has shown that the year-to-year <strong>in</strong>terannual<br />
changes <strong>in</strong> the distributions of the constituents are rather<br />
well reproduced, although captur<strong>in</strong>g the more moderate<br />
trends of chemically produced species such as O3 is more<br />
challeng<strong>in</strong>g. The modeled monthly variability is consistent<br />
with the observations but the year-to-year variability is<br />
generally underestimated.