2011 - Cooperative Institute for Research in Environmental Sciences ...
2011 - Cooperative Institute for Research in Environmental Sciences ...
2011 - Cooperative Institute for Research in Environmental Sciences ...

Create successful ePaper yourself
Turn your PDF publications into a flip-book with our unique Google optimized e-Paper software.
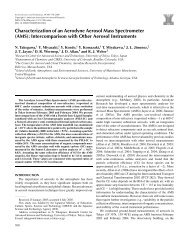
Figure 1: Emissions reductions per nautical mile of travel from the<br />
Margrethe Maersk <strong>for</strong> all Species as a Result of the State of Cali<strong>for</strong>nia<br />
fuel switch and vessel speed regulations. Contribution of the fuel switch<br />
regulation (vessel speed regulation) to emission reductions shown <strong>in</strong> dark<br />
grey (light grey).<br />
over urban, rural and agricultural regions throughout the<br />
South Coast Air Bas<strong>in</strong> and extensively over the <strong>in</strong>land<br />
San Joaqu<strong>in</strong> and Sacramento valleys. These flights were<br />
used to collect data that will be used <strong>in</strong> <strong>in</strong>verse model<strong>in</strong>g<br />
experiments to further improve emission <strong>in</strong>ventories of<br />
climate-<strong>for</strong>c<strong>in</strong>g agents such as CO2 and CH4.<br />
Product: Lack, DA, et al., Observed changes <strong>in</strong> climateand<br />
air quality–relevant shipp<strong>in</strong>g emissions due to vessel<br />
fuel quality and speed regulation, submitted to Environ.<br />
Sci. Technol.<br />
Cappa, CD, et al., The <strong>in</strong>fluence of operat<strong>in</strong>g speed on<br />
gas and particle-phase shipp<strong>in</strong>g emissions: Results from<br />
the R/V Miller Freeman, submitted to Environ. Sci. Technol.<br />
Milestone 3. Investigate the climate impact of changes <strong>in</strong><br />
stratospheric ozone and water vapor concentrations us<strong>in</strong>g<br />
the National Center <strong>for</strong> Atmospheric <strong>Research</strong> (NCAR)<br />
Community Atmosphere Model (CAM) with the slab ocean<br />
component (SOM), us<strong>in</strong>g time slice simulations and sensitivity<br />
studies and mak<strong>in</strong>g use of new and improved ozone<br />
and water vapor data sets. Impact: The experiments aim to<br />
quantify the importance of these gases to both the modeled<br />
stratospheric and tropospheric climates. Also, the<br />
results will show the effect of us<strong>in</strong>g improved ozone data<br />
as a model boundary condition, which will be of great use<br />
and <strong>in</strong>terest to the global model<strong>in</strong>g community.<br />
The f<strong>in</strong>al version of the National <strong>Institute</strong> of Water<br />
and Atmospheric <strong>Research</strong> (NIWA) ozone data set was<br />
released <strong>in</strong> January <strong>2011</strong>, and a manuscript describ<strong>in</strong>g the<br />
regression fit to the observational data is currently be<strong>in</strong>g<br />
prepared (Bodeker, et al.). Several long CAM <strong>in</strong>tegrations<br />
have been completed, with the goal to <strong>in</strong>vestigate the<br />
dependence of the modeled climate response to late-20thcentury<br />
ozone depletion to the ozone data set (compar<strong>in</strong>g<br />
the NIWA data aga<strong>in</strong>st the Intergovernmental Panel on<br />
Climate Change Fourth and Fifth Assessment Reports<br />
‘standard’). Results are be<strong>in</strong>g prepared <strong>for</strong> submission<br />
(Young, et al.), and they suggest that many of the signals<br />
of Antarctic ozone depletion (e.g., temperature and<br />
southern annular mode changes) are significantly stronger<br />
when us<strong>in</strong>g the NIWA data set, which will be of particular<br />
<strong>in</strong>terest to the model<strong>in</strong>g community.<br />
An ad hoc collaboration with Dr. Paul<br />
Kushner at the University of Toronto also<br />
has been <strong>in</strong>itiated, us<strong>in</strong>g his expertise with<br />
analyz<strong>in</strong>g dynamics <strong>in</strong> climate model<br />
output to <strong>in</strong>vestigate the model results <strong>in</strong><br />
more depth. This extended analysis also<br />
will <strong>in</strong>clude an <strong>in</strong>vestigation of the possible<br />
role of the (slab) ocean <strong>in</strong> <strong>in</strong>tensify<strong>in</strong>g the<br />
ozone climate signal <strong>in</strong> the NCAR model.<br />
CAM simulations have been completed<br />
us<strong>in</strong>g imposed stratospheric water vapor<br />
(SWV) concentrations <strong>in</strong> the radiation code,<br />
<strong>in</strong>vestigat<strong>in</strong>g the potential role of the pre/<br />
post-2000 change <strong>in</strong> SWV <strong>in</strong> decadal scale<br />
climate variability. Early <strong>in</strong>dications suggest<br />
the change did not yield a significant impact<br />
on modeled temperatures. It is planned<br />
to revisit this topic with a revised method<br />
and/or repeat<strong>in</strong>g the study with a newer model.<br />
Products: Ozone dataset: “Comb<strong>in</strong>ed vertical ozone profile<br />
database,”available from Bodeker Scientific (http://<br />
www.bodekerscientific.com)<br />
Bodeker, GE, B Hassler, et al., A vertically resolved,<br />
global, gap-free ozone database <strong>for</strong> assess<strong>in</strong>g or constra<strong>in</strong><strong>in</strong>g<br />
global climate model simulations, <strong>in</strong> prep.<br />
Young, PJ, S Solomon, et al., Model<strong>in</strong>g the impact of late<br />
20th century stratospheric ozone changes: Sensitivity to<br />
different ozone <strong>for</strong>c<strong>in</strong>g data sets, <strong>in</strong> prep.<br />
Figure 2: Latitude-time plots of column (250-5 hPa) anomalies <strong>for</strong> the (a)<br />
Randel and Wu (2007), (b) SPARC (Cionni et al., <strong>2011</strong>) and (c) BDBP-based<br />
(Hassler et al., 2009) climate model ozone data sets, <strong>in</strong> Dobson Units (DU).<br />
Anomalies are computed relative to the 1979-2005 climatology <strong>for</strong> each<br />
data set. Note the deeper blue colors at high latitudes <strong>in</strong> (c) <strong>in</strong>dicat<strong>in</strong>g<br />
more ozone depletion <strong>in</strong> that data.<br />
CIRES Annual Report <strong>2011</strong> 109