2011 - Cooperative Institute for Research in Environmental Sciences ...
2011 - Cooperative Institute for Research in Environmental Sciences ...
2011 - Cooperative Institute for Research in Environmental Sciences ...

Create successful ePaper yourself
Turn your PDF publications into a flip-book with our unique Google optimized e-Paper software.
Milestone 3. Apply a CloudSat method <strong>for</strong> simultaneous<br />
retrievals of mean ra<strong>in</strong> rate and ice water path <strong>in</strong><br />
strati<strong>for</strong>m precipitat<strong>in</strong>g systems to multi-year data sets<br />
collected dur<strong>in</strong>g the CloudSat overpasses <strong>in</strong> the vic<strong>in</strong>ity<br />
of the ARM Southern Great Pla<strong>in</strong>s Climate <strong>Research</strong><br />
Facility (ACRF). The CloudSat retrievals will be analyzed<br />
<strong>for</strong> possible correlations between parameters of the ice<br />
parts of precipitat<strong>in</strong>g systems (e.g., ice water path) and<br />
the resultant ra<strong>in</strong>fall. The satellite retrievals will be also<br />
compared to the ARM retrievals, so a consistency between<br />
space-borne and ground-based estimates of hydrometeor<br />
parameters <strong>in</strong> precipitat<strong>in</strong>g cloud systems will be <strong>in</strong>vestigated.<br />
A method to retrieve ice water path (IWP), mean ra<strong>in</strong>fall<br />
rate and cloud liquid water path (CLWP) <strong>in</strong> the same<br />
vertical atmospheric column was developed and <strong>in</strong>itially<br />
applied <strong>for</strong> strati<strong>for</strong>m-like precipitation events observed<br />
at the Southern Great Pla<strong>in</strong>s (SGP) site of the Atmospheric<br />
Radiation Measurement (ARM) Program. The retrieval<br />
method is based on multi-frequency radar measurements<br />
at W-, Ka and S-band. The radar measurements<br />
also provide a robust separation of the liquid, mixed and<br />
ice hydrometeor layers. Apply<strong>in</strong>g the method to case<br />
studies <strong>in</strong>dicates that characteristic values of CLWP are<br />
about 300-400 g/m2, although values up to 1,000 g/m2<br />
and higher are not uncommon. IWP, which represents the<br />
precipitat<strong>in</strong>g cloud part of the atmospheric column that<br />
is observed above the freez<strong>in</strong>g level, usually significantly<br />
exceeds cloud liquid water path and can reach values of<br />
approximately 10,000 g/m2 and even higher. There is lowto-medium<br />
correlation between IWP and mean ra<strong>in</strong> rate.<br />
On average, mean ra<strong>in</strong>fall <strong>in</strong> the liquid layer, R, <strong>in</strong>creases<br />
with an <strong>in</strong>crease <strong>in</strong> ice mass observed above the melt<strong>in</strong>g<br />
layer. Figure 1 shows an example of retrievals.<br />
Figure 2: Example of a retrieval.<br />
Milestone 4. Ma<strong>in</strong>ta<strong>in</strong> configurations and web access to<br />
the real-time water vapor flux tool <strong>for</strong> use by researchers<br />
and weather <strong>for</strong>ecasters to assess and monitor extreme<br />
precipitation events along the West Coast of the United<br />
States.<br />
In support of the near-real-time water vapor flux tool,<br />
which is used by researchers and <strong>for</strong>ecasters to help monitor<br />
and study extreme orographic precipitation events,<br />
104 CIRES Annual Report <strong>2011</strong><br />
automated software operations and configurations were<br />
ma<strong>in</strong>ta<strong>in</strong>ed <strong>for</strong> 10 different NOAA and cooperative agency<br />
sites along the U.S West Coast. The ma<strong>in</strong>tenance and<br />
configuration of software to distribute the tool’s numerical<br />
flux data was also per<strong>for</strong>med. Lastly, monitor<strong>in</strong>g of data<br />
and product quality as well as near-real-time availability<br />
was accomplished on a daily basis to support research and<br />
<strong>for</strong>ecast<strong>in</strong>g ef<strong>for</strong>ts dur<strong>in</strong>g the NOAA HMT and CalWater<br />
campaigns.<br />
Milestone 5. The CalWater experiment is a multi-year<br />
ef<strong>for</strong>t supported by NOAA and the Cali<strong>for</strong>nia Energy Commission<br />
to study the impact of anthropogenic aerosols<br />
and climate change on precipitation and associated water<br />
supply <strong>in</strong> Cali<strong>for</strong>nia. Aerosol and meteorological observ<strong>in</strong>g<br />
<strong>in</strong>struments will be deployed <strong>in</strong> key locations <strong>in</strong> Cali<strong>for</strong>nia.<br />
Part of this ef<strong>for</strong>t will be to diagnose the vertical<br />
structure of the precipitat<strong>in</strong>g cloud systems <strong>in</strong> the context<br />
of collocated aerosol observations. Another part of this<br />
ef<strong>for</strong>t will entail analysis of meteorological observations<br />
to characterize the Sierra barrier jet, its modulation by<br />
atmospheric rivers and the resultant spatio-temporal<br />
distribution of precipitation.<br />
Dur<strong>in</strong>g the first year of the CalWater experiment, a major<br />
accomplishment was the <strong>in</strong>stallation of NOAA radars and<br />
surface meteorological <strong>in</strong>struments at three field sites <strong>in</strong><br />
Cali<strong>for</strong>nia <strong>for</strong> the 2010-<strong>2011</strong> w<strong>in</strong>ter season field campaign.<br />
The sites <strong>in</strong>cluded Sugar P<strong>in</strong>e Dam, Mariposa airport and<br />
L<strong>in</strong>coln airport. <strong>Research</strong>ers from the University of Cali<strong>for</strong>nia<br />
at San Diego <strong>in</strong>stalled aerosol sampl<strong>in</strong>g <strong>in</strong>struments<br />
at all three sites. While the first year of CalWater focused<br />
on collect<strong>in</strong>g data dur<strong>in</strong>g the 2010-<strong>2011</strong> w<strong>in</strong>ter season field<br />
campaign, next year will focus on analyz<strong>in</strong>g and <strong>in</strong>terpret-<br />
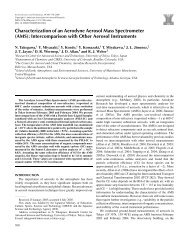
NOAA <strong>in</strong>strumentation at the Mariposa airport dur<strong>in</strong>g sunset. From left<br />
to right, the photo shows a vertically po<strong>in</strong>t<strong>in</strong>g S-band (2.8 GHz) profil<strong>in</strong>g<br />
radar, a Parsivel disdrometer and an anemometer mounted on a 10-m<br />
tower.