Scientific Theme: Advanced Modeling and Observing Systems
Scientific Theme: Advanced Modeling and Observing Systems
Scientific Theme: Advanced Modeling and Observing Systems

Create successful ePaper yourself
Turn your PDF publications into a flip-book with our unique Google optimized e-Paper software.
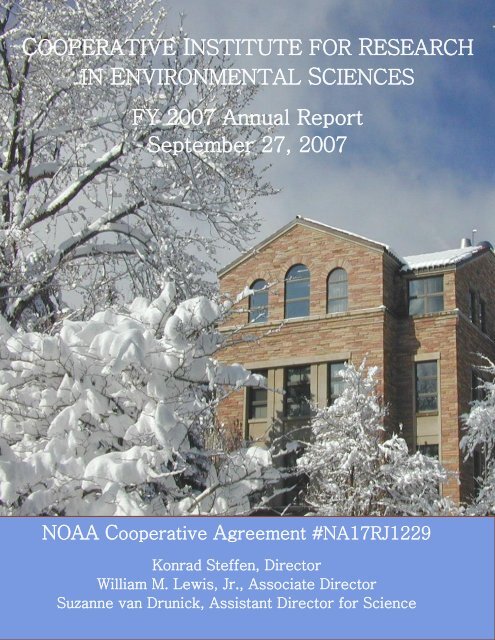
COOPERATIVE INSTITUTE FOR RESEARCH<br />
IN ENVIRONMENTAL SCIENCES<br />
FY 2007 Annual Report<br />
September 27, 2007<br />
NOAA Cooperative Agreement #NA17RJ1229<br />
Konrad Steffen, Director<br />
William M. Lewis, Jr., Associate Director<br />
Suzanne van Drunick, Assistant Director for Science
Cover photo by Paul Sperry
Table of Contents<br />
Letter from the Director ............................................................................................................................... iii<br />
Executive Summary <strong>and</strong> Research Highlights .............................................................................................. 1<br />
CIRES in 2006-2007 ..................................................................................................................................... 6<br />
Administration <strong>and</strong> Funding ..................................................................................................................... 6<br />
Contributions to NOAA‘s Strategic Vision ............................................................................................ 11<br />
Creating a Dynamic Research Environment ........................................................................................... 13<br />
<strong>Theme</strong> Reports ............................................................................................................................................ 19<br />
<strong>Scientific</strong> <strong>Theme</strong>: ADVANCED MODELING AND OBSERVING SYSTEMS .................................. 19<br />
<strong>Scientific</strong> <strong>Theme</strong>: CLIMATE SYSTEM VARIABILITY...................................................................... 44<br />
<strong>Scientific</strong> <strong>Theme</strong>: GEODYNAMICS ..................................................................................................... 68<br />
<strong>Scientific</strong> <strong>Theme</strong>: PLANETARY METABOLISM ................................................................................ 84<br />
<strong>Scientific</strong> <strong>Theme</strong>: REGIONAL PROCESSES ....................................................................................... 88<br />
Complementary Research ......................................................................................................................... 103<br />
Faculty Fellows Research ..................................................................................................................... 103<br />
Education <strong>and</strong> Outreach Program ......................................................................................................... 129<br />
CIRES‘ <strong>Scientific</strong> Centers .................................................................................................................... 131<br />
Innovative Research Program ............................................................................................................... 141<br />
CIRES Visiting Fellows ....................................................................................................................... 153<br />
Appendices................................................................................................................................................ 157<br />
Governance <strong>and</strong> Management .............................................................................................................. 157<br />
Student Diversity Programs .................................................................................................................. 161<br />
Personnel Demographics ...................................................................................................................... 162<br />
Publications from Calendar Year 2006 ................................................................................................. 163<br />
Refereed Publications Published during Calendar Year 2006 ......................................................... 163<br />
Non-Refereed Publications Published during Calendar Year 2006 ................................................. 188<br />
Refereed Journals in which CIRES Scientists Published in 2006 .................................................... 197<br />
Honors <strong>and</strong> Awards: Calendar Year 2006 ............................................................................................ 199<br />
Service: Calendar Year 2006 ................................................................................................................ 203<br />
Acronyms <strong>and</strong> Abbreviations ............................................................................................................... 207<br />
i
Director’s Welcome<br />
Letter from the Director<br />
We had another exiting year with numerous accomplishments, awards,<br />
recognitions of our faculty, researchers, <strong>and</strong> staff – too numerous to mention in<br />
detail here. Congratulations to all of CIRES. Research highlights are mentioned<br />
in detail in the Executive Summary of this report, <strong>and</strong> again, they were so<br />
numerous that it was hard to choose which to feature in the Summary.<br />
We completed our University Program Review, a recurring event every seven<br />
years. I am proud to announce that we received high grades in the review process<br />
<strong>and</strong> CIRES was recognized as an important asset for the University of Colorado<br />
at Boulder (University). CIRES is a large <strong>and</strong> complex organization, which<br />
interacts in a variety of ways with academic departments <strong>and</strong> institutes at the<br />
University, as well as the many relevant NOAA laboratories <strong>and</strong> centers, located<br />
in the David Skaggs Research Center in Boulder. Despite this complexity, CIRES<br />
is working well <strong>and</strong> we are succeeding in meeting our missions <strong>and</strong> goals.<br />
The Members‘ Council organized the second CIRES ―Rendezvous Symposium‖ in spring. This highly successful<br />
endeavor was devoted to a full day of science presentations <strong>and</strong> discussions across all disciplines, engaging over 300<br />
scientists, students, <strong>and</strong> staff. We have institutionalized the ―Rendezvous Symposium‖ as an annual event.<br />
CIRES continues to be the world leader in environmental sciences, as we are committed to identifying <strong>and</strong> pursuing<br />
innovative research in earth system science, <strong>and</strong> to fostering public awareness of this research. Our research budget<br />
continues to grow <strong>and</strong> has reached over $47 M, including the faculty support from the University for our CIRES<br />
faculty lines, supporting a total of 580 employees, graduate <strong>and</strong> undergraduate students. We have published over<br />
880 papers in peer-reviewed science journals, participated in a number of news conferences, U.S. Congressional<br />
briefings, <strong>and</strong> outreach activities. The outcome <strong>and</strong> findings of our research is important in forming policies that are<br />
crucial for future generations.<br />
We welcome one new CIRES tenure-track faculty researcher, Dr. Baylor Fox-Kemper, assistant professor in the<br />
Department of Atmospheric <strong>and</strong> Oceanic Sciences with expertise in experimental ocean modeling. In addition, the<br />
University authorized CIRES to search for a new director for our Center for the Study of Earth from Space,<br />
following the retirement of Professor Alex Goetz, <strong>and</strong> for a new director for our Center for Science <strong>and</strong> Technology<br />
Policy Research. With these new Graduate School faculty lines, CIRES will increase its faculty to a total of<br />
nineteen.<br />
We also welcome our new Assistant Director for Science, Dr. Suzanne van Drunick who comes to us from the<br />
National Research Council in Washington, DC, where she was a Senior Program Officer for studies on<br />
environmental science <strong>and</strong> toxicology. Suzanne is already engaged in a number of activities, including this new<br />
CIRES annual report.<br />
The annual report is a collaborative effort of a number of people in CIRES – researchers as well as administrative<br />
staff – <strong>and</strong> they all deserve credit for what you will find on the following pages. In particular, I would like to<br />
acknowledge the effort of Assistant Director Dr. Suzanne van Drunick who was instrumental in coordinating this<br />
effort. Enjoy your reading!<br />
iii
Executive Summary <strong>and</strong> Research Highlights<br />
Executive Summary <strong>and</strong> Research Highlights<br />
Since 1967, the Cooperative Institute for Research in Environmental Sciences (CIRES) has provided a dynamic<br />
setting for teaching <strong>and</strong> collaborative, interdisciplinary research in environmental sciences. CIRES is an organized<br />
research institute of the University of Colorado at Boulder (University), <strong>and</strong> is based on a cooperative agreement<br />
(Agreement) between the University <strong>and</strong> the National Oceanic <strong>and</strong> Atmospheric Administration (NOAA). CIRES‘<br />
collaborative research is organized <strong>and</strong> aligned with NOAA‘s research by six scientific themes identified in the<br />
Agreement. These themes include advanced modeling <strong>and</strong> observing systems, climate system variability,<br />
geodynamics, planetary metabolism, regional processes, <strong>and</strong> integrating activities. Select research highlights from<br />
each of the scientific themes are presented below.<br />
From July 30, 2006 to July 1, 2007 (FY07), CIRES supported 182 Research Scientists, 208 Associate Scientists, 18<br />
Visiting Scientists, 14 postdoctoral researchers, 32 administrative staff, 80 graduate students, <strong>and</strong> 44 undergraduate<br />
students. In total, CIRES supported approximately 580 scientists, administrative staff, <strong>and</strong> students with an overall<br />
extramural research budget of $44,400,000, an increase of almost 3.5% compared to FY06. Including University<br />
faculty support, the total budget is almost $47,600,000, of which NOAA funds accounted for approximately<br />
$23,500,000 (49%).<br />
CIRES received approval for one new faculty line <strong>and</strong> two reappointments for positions vacated by a retirement <strong>and</strong><br />
departure of a CIRES faculty member. A new tenure-track faculty researcher, Dr. Baylor Fox-Kemper, was hired as<br />
an assistant professor in the Department of Atmospheric <strong>and</strong> Oceanic Sciences. Fox-Kemper‘s area of expertise is<br />
experimental modeling of oceanic eddies <strong>and</strong> ocean heat transport. Faculty searches are underway for a new director<br />
for the Center for Science <strong>and</strong> Technology Policy Research <strong>and</strong> a new director for the Center for the Study of Earth<br />
from Space. CIRES also hired a new Assistant Director for Science in December 2006. A part-time science news<br />
writer position was created to help convey CIRES‘ research findings to the news media <strong>and</strong> public. Communication<br />
of CIRES‘ mission <strong>and</strong> activities was further enhanced by the creation <strong>and</strong> broad dissemination of a new CIRES<br />
brochure.<br />
In July 2006, the CIRES-NOAA FY 2007 <strong>and</strong> FY 2008 <strong>Scientific</strong> Workplan (Workplan) was completed <strong>and</strong><br />
implemented. The Workplan describes collaborative research that integrates scientific projects conducted by CIRES<br />
under each of the six scientific themes. The Workplan accounts for Task III research of the Agreement, however, it<br />
integrates several scientific objectives of earth system science. These objectives are the drivers of the Workplan,<br />
which identifies goals <strong>and</strong> approaches for each objective, <strong>and</strong> incorporates milestones <strong>and</strong> impacts for each project.<br />
The new Workplan closely resembles the previous version, which NOAA <strong>and</strong> the Department of Commerce<br />
approved as a scientific roadmap with increased clarity <strong>and</strong> accountability.<br />
The University‘s Program Review Panel (PRP) released its final report for CIRES in February 2007. The final<br />
report was based on a review of three separate reports. Those were (1) the CIRES Self-Study, which was prepared<br />
by a ten-member team comprised of the CIRES Associate Director, CIRES Fellows, Research Associates, graduate<br />
students, <strong>and</strong> administrative staff; (2) the report by the Internal Review Committee, which was comprised of non-<br />
CIRES faculty <strong>and</strong> graduate students; <strong>and</strong> (3) the report by the External Review Committee, which was comprised<br />
of two distinguished academics not affiliated with the University. The findings of the PRP final report included<br />
praise for the very high quality of the faculty engaged in CIRES, high degree of productivity among the Fellows,<br />
<strong>and</strong> effectiveness of administrative staff. CIRES‘ leadership was concluded to be very strong. The connections<br />
between CIRES <strong>and</strong> NOAA‘s Earth System Research Laboratory (ESRL) <strong>and</strong> other research organizations were<br />
credited with enhancing <strong>and</strong> strengthening CIRES research.<br />
CIRES‘ Education <strong>and</strong> Outreach (E/O) program continued to strengthen the link between education <strong>and</strong> research<br />
related to science, technology, <strong>and</strong> math for the purpose of increasing public underst<strong>and</strong>ing of issues related to earth<br />
system science. To celebrate the launch of the International Polar Year, E/O organized a community-wide event, Ice<br />
Fest, which included a wide variety of activities focused on the cryosphere, polar research, <strong>and</strong> climate studies.<br />
In addition, another exciting CIRES FY07 highlight was the announcement of a new CIRES-NOAA Exchange<br />
Fellowship Program. Guidelines are being developed to enable CIRES <strong>and</strong> ESRL researchers to exchange laboratory<br />
<strong>and</strong> field research roles.<br />
1
Executive Summary <strong>and</strong> Research Highlights<br />
Research Highlights <strong>and</strong> Accomplishments from CIRES-NOAA Partnership by <strong>Scientific</strong> <strong>Theme</strong><br />
<strong>Advanced</strong> <strong>Modeling</strong> <strong>and</strong> <strong>Observing</strong> <strong>Systems</strong><br />
This theme includes the optimization of modeling <strong>and</strong> observing systems for disciplines such as atmospheric<br />
chemistry, physical atmospheric <strong>and</strong> oceanic processes, cryospheric processes, space weather, non-linear systems<br />
applications, data centers, <strong>and</strong> data management. Research ranges from local to regional <strong>and</strong> global scales.<br />
Quantitative characterization of the response of the cavity ring-down single-particle aerosol instrument was<br />
performed. The completed instrument, containing improvements over the 2005 prototype, was successfully<br />
deployed aboard NOAA R/V Ronald H. Brown for the TexAQS 2006/GoMACCS field campaign from<br />
August to mid-September in the western Gulf of Mexico/Houston Ship Channel region; aerosol samples<br />
were collected.<br />
Two lidars were deployed during the 2006 Texas Air Quality Study to measure ozone <strong>and</strong> aerosol profiles.<br />
The TOPAZ airborne lidar, aboard a NOAA Twin Otter airplane, flew 22 missions during which it mapped<br />
out the three-dimensional distribution of ozone <strong>and</strong> aerosols over eastern Texas <strong>and</strong> the Gulf of Mexico.<br />
The OPAL ship-based lidar, aboard the NOAA R/V Ronald H. Brown, measured profiles of ozone <strong>and</strong><br />
aerosol backscatter. Recent improvements to ship-based <strong>and</strong> aircraft-based lidar systems include more<br />
accurate photodetectors, a simpler optical receiver, <strong>and</strong> new aerosol data processing methods.<br />
A ship-based remote sensing lidar to measure wind <strong>and</strong> turbulence profiles was developed by making<br />
improvements to NOAA‘s High Resolution Doppler Lidar.<br />
A new ozone sensor for ship-based measurements of ozone flux was developed. The sensor system was<br />
deployed on the R/V Ronald H. Brown in the TexAQS field program in later summer 2006.<br />
During the Texas Air Quality Study, the TOPAZ airborne ozone lidar, <strong>and</strong> the ship-based ozone <strong>and</strong><br />
Doppler lidars, collected data for comparison with model computations of ozone formation, transport, <strong>and</strong><br />
mixing processes, to investigate the ability of models to represent important boundary layer parameters.<br />
Diurnal sampling <strong>and</strong> inter-satellite bias corrections were applied to the High-resolution Radiation Sounder<br />
satellite radiances.<br />
Enhancements to the Gridpoint Statistical Interpolation (GSI) code were incorporated to improve use of<br />
surface weather observations (METARs), <strong>and</strong> GSD-developed procedures were introduced into GSI to<br />
incorporate three-dimensional, high-frequency National Weather Service WSR-88D radar data in the<br />
initialization of cloud <strong>and</strong> precipitation hydrometeors.<br />
The Real-Time Verification System was re-designed by enhancing the functionality of the database, webinterface,<br />
<strong>and</strong> real-time processing modules of the system to support verification of aviation parameters,<br />
such as icing, turbulence, <strong>and</strong> convective weather.<br />
New verification techniques were developed for evaluating the accuracy of convective echo tops, high<br />
resolution automated convective probabilistic forecasts, <strong>and</strong> ceiling <strong>and</strong> visibility forecast lead times.<br />
Results from statistical evaluations of turbulence <strong>and</strong> convective weather forecasts were summarized in<br />
written reports.<br />
The GOES X-ray instrument was calibrated with selected solar observations <strong>and</strong> 2005 rocket underflight<br />
data.<br />
A fully operational version of the Coronal Mass Ejection (CME) Locator was developed based on whitelight<br />
corona observations from the NASA STEREO mission. EUV dimming properties (intensity, solar<br />
location, <strong>and</strong> mass) were compared with associated CME properties as observed by the Extreme Ultraviolet<br />
Imaging Telescope.<br />
A ten-year study of the stability of the CUCF‘s reference UVB broadb<strong>and</strong> radiometers <strong>and</strong> 50+ network<br />
UVB radiometers was published.<br />
Climate System Variability<br />
Climate variability affects all natural systems <strong>and</strong> human activities. Climate directly influences agriculture, water<br />
quality, <strong>and</strong> human health. Underst<strong>and</strong>ing <strong>and</strong> potentially predicting climate change is critical to the public interest,<br />
as well as to a broad array of decision makers within federal <strong>and</strong> state government, industry, resources management,<br />
<strong>and</strong> hazard mitigation.<br />
A newly updated ozone-profile database was assessed for trends <strong>and</strong> changes in trends, <strong>and</strong> validated<br />
against ozone products derived from remote <strong>and</strong> in situ measuring systems such as satellites <strong>and</strong> ozone<br />
sounding.<br />
2
Executive Summary <strong>and</strong> Research Highlights<br />
The global impacts of the ENSO-related <strong>and</strong> ENSO-unrelated tropical sea surface temperature (SST) trends<br />
over the last 50 years were assessed using the NCAR/CAM3 <strong>and</strong> the NCEP/GFS atmospheric general<br />
circulation models (GCM), with particular emphasis on the impacts on precipitation trends over the<br />
Americas, western Africa, <strong>and</strong> Europe. Both GCMs indicate substantial precipitation trend responses in<br />
these regions to the tropical SST trends, which are generally in excellent mutual agreement, <strong>and</strong> with the<br />
observed precipitation trends. Both the ENSO-related <strong>and</strong> the ENSO-unrelated portions of the tropical SST<br />
trends are found to be important in this regard.<br />
The possibility of abrupt climate change over North America in the next several decades triggered by<br />
continued warming of the Indian Ocean was assessed. These runs suggest that the continued tropical ocean<br />
warming will gradually modify the atmospheric jet streams to the point where the ability of the jet streams<br />
to channel atmospheric disturbances along the upper tropospheric waveguide will undergo a relatively<br />
sudden shift sometime in the next century. This will cause relatively rapid shifts in the climates of North<br />
America <strong>and</strong> Europe.<br />
The impacts of coupled air-sea interactions, decadal ocean dynamics, l<strong>and</strong>-surface feedbacks, <strong>and</strong> l<strong>and</strong>-use<br />
changes on decadal atmospheric variability were assessed. It was concluded that the North Atlantic <strong>and</strong><br />
European climate response to Indian Ocean warming might be considerably greater than hitherto judged<br />
from analyses of atmospheric model experiments alone.<br />
The Gulf of Mexico Atmospheric Composition <strong>and</strong> Climate Study was planned, <strong>and</strong> executed between July<br />
1 <strong>and</strong> October 15, 2006, throughout Texas <strong>and</strong> the northwestern Gulf of Mexico. Three NOAA/ESRL <strong>and</strong><br />
CIRES‘ platforms were deployed: a NOAA WP-3 aircraft, a NOAA Twin Otter, <strong>and</strong> the NOAA/ESRL R/V<br />
Ronald H. Brown. This intensive field study provided significant new information that is required to afford<br />
a better underst<strong>and</strong>ing of the sources, <strong>and</strong> atmospheric processes responsible for the formation <strong>and</strong><br />
distribution, of ozone <strong>and</strong> aerosols in the atmosphere <strong>and</strong> the influence that these species have on the<br />
radiative forcing of climate regionally <strong>and</strong> globally, as well as their impact on human health <strong>and</strong> regional<br />
haze.<br />
Fire, fossil fuel, <strong>and</strong> ocean carbon modules were implemented with the ensemble Kalman filter system,<br />
commonly referred to as CarbonTracker: http://www.esrl.noaa.gov/gmd/ccgg/carbontracker.<br />
Two new tall-tower sites were established as part of the NOAA/GMD North America Carbon <strong>Observing</strong><br />
System (Carbon America) during FY07: One near Boulder, CO, <strong>and</strong> the other near West Branch, IA.<br />
Continuous in-situ CO2/CO mixing ratios <strong>and</strong> regular air samples are being used as part of the Carbon<br />
Tracker system mentioned above.<br />
A temperature/humidity/GPS system to augment current trace-gas vertical-profile measurements was<br />
developed <strong>and</strong> field-tested, allowing for automated measurements of the ambient temperature <strong>and</strong><br />
humidity, <strong>and</strong> the position <strong>and</strong> altitude of each sample, in a vertical profile. The system was installed at five<br />
sites in the NOAA/GMD Carbon America aircraft network.<br />
A new index for assessing changes in the atmospheric burden of ozone-depleting gases was made available<br />
from the NOAA website. The Ozone Depleting Gas Index provides a summary of progress being made in<br />
the global effort to reduce the atmospheric burden of ozone-depleting gases.<br />
The representation of physical processes <strong>and</strong> the Madden-Julian Oscillation in the NCEP Global<br />
Forecasting System was investigated <strong>and</strong> improved by studying fourteen coupled general circulation<br />
models (CGCMs) used in the Intergovernmental Panel on Climate Change Fourth Assessment Report<br />
(IPCC AR4). The results show that all current state-of-the-art CGCMs have significant problems in<br />
simulating tropical intra-seasonal variability.<br />
A study examining the double-ITCZ problem in CGCMs participating in the IPCC AR4 was completed.<br />
The results show that most of these CGCMs have a double-ITCZ problem.<br />
Images of 401 glacier photographs were posted online.<br />
A major paper was published in Journal of Geophysical Research synthesizing a variety of atmospheric<br />
<strong>and</strong> oceanic data to examine the large-scale energy budget of the Arctic. The seasonal cycles of vertically<br />
integrated atmospheric energy storage <strong>and</strong> the convergence of energy transport from ERA-40, as evaluated<br />
for the polar cap, compare well with realizations from the NCEP/NCAR reanalysis over the period 1979-<br />
2001.<br />
Development of seasonal forecast guidance tools for the U.S., based on the predictability of tropical SSTs<br />
several seasons in advance, <strong>and</strong> training these tools on the atmospheric responses to different types of<br />
anomalous tropical SSTs in large new sets of seasonal integrations made with the NCAR, GFDL, <strong>and</strong><br />
NCEP GCMs, continued. Results indicate that, compared to the forecast tool currently being used in real-<br />
3
Executive Summary <strong>and</strong> Research Highlights<br />
time experimental seasonal forecasts, the new forecast tool has the potential to make improved forecasts of<br />
U.S. seasonal precipitation <strong>and</strong> surface temperature.<br />
Geodynamics<br />
The goal of geodynamics is to characterize the internal processes of the planet, including the properties of the coremantle<br />
boundary, convection within the Earth‘s mantle, <strong>and</strong> the effects of convection on the surface of the planet.<br />
A global spherical-harmonic degree-720 model of the Earth‘s crustal magnetic field was created from a<br />
joint inversion of all available marine magnetic, aeromagnetic, <strong>and</strong> CHAMP satellite magnetic<br />
measurements. This model is the first step in the development of an Enhanced Magnetic Model needed for<br />
improved navigation by ships, aircraft, <strong>and</strong> near-Earth orbiting spacecraft.<br />
Bathymetric-topographic digital elevation models sufficient for tsunami propagation, run up <strong>and</strong> inundation<br />
prediction for 19 priority regions, defined by the U.S. tsunami community, were produced. This project is a<br />
priority for NOAA, has been presented to Congressional staffers, <strong>and</strong> featured on the NOAA website.<br />
Public access to the tsunami inundation DEMs has been provided at the ―NGDC Tsunami Inundation<br />
Gridding Project‖ website (http://www.ngdc.noaa.gov/mgg/inundation/). On this site, visitors may<br />
download completed DEMs, with corresponding metadata <strong>and</strong> documentation.<br />
Planetary Metabolism<br />
Planetary metabolism is the complex web of biochemical <strong>and</strong> ecological processes <strong>and</strong> their interaction with the<br />
lithosphere, atmosphere <strong>and</strong> hydrosphere. Both natural <strong>and</strong> anthropogenic disturbances drive the structure <strong>and</strong><br />
dynamics of natural systems, <strong>and</strong> a thorough underst<strong>and</strong>ing of these complex processes is essential to protect the<br />
biosphere from adverse effects due to pollution, destruction of natural l<strong>and</strong>scapes, <strong>and</strong> inadvertent alteration of<br />
climate.<br />
Annual estimates of national <strong>and</strong> global gas flaring for the years 1995 through 2006 using low-light<br />
imaging data acquired by the Defense Meteorological Satellite Program (DMSP) spacecraft have been<br />
developed. In 2006, the gas flaring estimate of 168 billion cubic meters represented 27% of the natural gas<br />
consumption by the United States, with a potential market value of $69 billion. Global gas flaring adds<br />
more than 84 million metric tons of carbon to the atmosphere each year.<br />
A global poverty map with 30-arc second resolution, using a derived poverty index calculated by dividing<br />
population count by the brightness of satellite-observed nighttime lighting for the DMSP spacecraft, has<br />
been developed. The total estimate of the numbers of individuals living in poverty is 2.3 billion, slightly<br />
under the World Development Indicators‘ estimate of 2.6 billion. This significant work demonstrates a new<br />
technique for determining global poverty rates.<br />
Regional Processes<br />
Many of the research endeavors within CIRES <strong>and</strong> NOAA have a regional focus because they address a particular<br />
confluence of geography, demographics, or weather <strong>and</strong> climatic regimes. The effect of climate variability is often<br />
regionally focused, thus influencing very specific populations, economic systems, <strong>and</strong> ecosystems.<br />
A twelve-year (1993-2004) global oceanic data set of near-surface humidity has been developed using<br />
SSM/I <strong>and</strong> SSM/T-2 satellite sensors, <strong>and</strong> a seven-year (1999-2005) data set of both near-surface humidity<br />
<strong>and</strong> temperature has been developed combining AMSU-A <strong>and</strong> SSM/I satellite sensors.<br />
Daily ozone profile measurements at Trinidad Head, CA <strong>and</strong> Boulder, CO were performed during the<br />
intensive Measurements of Ozone over North America study in August 2006. The purpose was to<br />
determine the role of various sources to the tropospheric ozone budget over North America. A key finding<br />
of this intensive campaign was the important contribution to the upper tropospheric (6-11 km) ozone<br />
budget from lightning-produced nitrogen oxides.<br />
Research conducted by CIRES staff on data sets collected onboard the NOAA R/V Ronald H. Brown<br />
during the 2004 New Engl<strong>and</strong> Air Quality Study has resulted in several successful research publications in<br />
peer-reviewed journals.<br />
Measurements obtained from the NOAA P-3 aircraft in the summer of 2004 during the International<br />
Consortium for Atmospheric Research on Transport <strong>and</strong> Transformation study have been used to examine<br />
the transport of pollutants from the United States over the Atlantic Ocean.<br />
The relative-humidity dependence of aerosol light extinction for surrogate atmospheric aerosol using cavity<br />
ring-down aerosol extinction spectroscopy was studied. Findings suggest that neglecting the water uptake<br />
4
Executive Summary <strong>and</strong> Research Highlights<br />
by the organic fraction of atmospheric particles could lead to significant underestimation of the cooling at<br />
the Earth‘s surface due to light scattering by aerosol.<br />
Integrating Activities<br />
CIRES engages in a wide range of integrating activities in research, education, <strong>and</strong> outreach that encompass each of<br />
the Institute‘s research themes <strong>and</strong> contribute to the overall mission of the Institute, University, <strong>and</strong> NOAA. The<br />
primary focus is on five overlapping categories that include (1) K-16 Interdisciplinary Education <strong>and</strong> Outreach, (2)<br />
Graduate <strong>and</strong> Post-Graduate Education, (3) <strong>Scientific</strong> Assessments, (4) Interdisciplinary Research, <strong>and</strong> (5) Science<br />
<strong>and</strong> Technology Policy Research.<br />
The final preparation of the World Meteorological Organization/United Nations Environment Programme<br />
2006 scientific state-of-underst<strong>and</strong>ing assessment of the ozone layer for the Montreal Protocol was<br />
completed. CIRES scientists participated as coauthors, contributors, reviewers, <strong>and</strong> coordinating editor for<br />
the report.<br />
The many forces that impact water dem<strong>and</strong> in a major Denver suburb, Aurora, with infrastructure<br />
requirements over the next ten years in excess of $1 billion, were investigated. How the recent drought,<br />
climate variables, demographics, pricing, irrigation technology, in-home water meters, <strong>and</strong> other variables<br />
affect dem<strong>and</strong> were studied. A number of papers about water dem<strong>and</strong> in the Denver area <strong>and</strong> a review<br />
paper on factors influencing residential water dem<strong>and</strong> were published. Additionally, multiple presentations<br />
directed to these topics were delivered in Colorado <strong>and</strong> Arizona. A new website ―Water Dem<strong>and</strong> <strong>and</strong><br />
Conservation‖ was created: http://wwa.colorado.edu/resources/water_dem<strong>and</strong>_<strong>and</strong>_conservation/.<br />
Analysis of paleoclimatological streamflow reconstructions, future streamflow projections from models <strong>and</strong><br />
other sources, <strong>and</strong> native streamflow reconstructions were synthesized to improve underst<strong>and</strong>ing of stream<br />
flows. A workshop held to assist the U.S. Bureau of Reclamation in assessing the state of climate change<br />
science in its Colorado River planning studies, led to the preparation of a peer-reviewed report, which may<br />
become an appendix in Reclamation‘s ongoing Environmental Impact Statement for the ―shortage sharing‖<br />
<strong>and</strong> combined operation of Lake Powell <strong>and</strong> Lake Mead. This is the first report of its kind by Reclamation<br />
anywhere in the U.S.<br />
5
CIRES in 2006-2007: Administration <strong>and</strong> Funding<br />
CIRES in 2006-2007<br />
Administration <strong>and</strong> Funding<br />
The Cooperative Institute for Research in Environmental Sciences (CIRES) is a joint institute established in 1967<br />
between the University of Colorado <strong>and</strong> the National Oceanic <strong>and</strong> Atmospheric Administration (NOAA). The<br />
purpose of CIRES is to maintain an interdisciplinary environment for research on the geosphere, biosphere,<br />
atmosphere, hydrosphere <strong>and</strong> cryosphere. CIRES conducts basic research in support of NOAA‘s goals for<br />
application of environmental science to advance the public welfare. CIRES strengthens the scientific foundation<br />
upon which NOAA‘s many services depend. CIRES‘ connections with NOAA‘s Office of Oceanic <strong>and</strong> Atmospheric<br />
Research <strong>and</strong> sister Cooperative Institutes also provide an avenue for coordinated studies on a scale that could not be<br />
addressed by university research units on their own.<br />
Vision <strong>and</strong> Mission<br />
As a world leader in Environmental Sciences, CIRES is committed to identifying <strong>and</strong> pursuing<br />
innovative research in Earth System Science <strong>and</strong> fostering public awareness of these<br />
processes to ensure a sustainable future environment. CIRES is dedicated to fundamental <strong>and</strong><br />
interdisciplinary research targeted at all aspects of Earth System Science <strong>and</strong> to communicating<br />
these findings to the global scientific community, to decision makers, <strong>and</strong> to the public.<br />
CIRES‘ direction is provided through its Council of Fellows, its executive committee, <strong>and</strong> committees working on<br />
focused objectives such as maintaining excellence in computing facilities (Figure 1). Interdisciplinary science at<br />
CIRES is fostered through centers that cross traditional boundaries, <strong>and</strong> these include the Center for the Study of<br />
Earth from Space (CSES), the Center for Limnology, the National Snow <strong>and</strong> Ice Data Center (NSIDC), the Center<br />
for Science <strong>and</strong> Technology Policy Research (CSTPR), <strong>and</strong> the Climate Diagnostics Center (CDC). CIRES‘ campus<br />
affiliation provides NOAA labs <strong>and</strong> centers a breadth of connections in 11 university departments <strong>and</strong> programs<br />
(Figure 2). Communication is facilitated through a members‘ council, scientific retreats, research symposiums,<br />
regular town meetings, <strong>and</strong> outreach. Career progression <strong>and</strong> excellence are promoted through a career track <strong>and</strong> an<br />
outst<strong>and</strong>ing employee recognition program. A vibrant academic <strong>and</strong> research environment is fostered through a<br />
graduate research fellowship program, a visiting faculty <strong>and</strong> postdoctoral program, an innovative research program,<br />
<strong>and</strong> a distinguished lecture series. <strong>Advanced</strong> research tools are provided through an instrument design group,<br />
machine shop, glassblowing, numerical climate models, <strong>and</strong> access to remote sensing <strong>and</strong> analytical instrumentation.<br />
Figure 1. Organization of CIRES.<br />
6
Chemical Sciences<br />
Division (CSD)<br />
CIRES in 2006-2007: Administration <strong>and</strong> Funding<br />
NOAA LABORATORIES AND CENTERS<br />
NOAA EARTH SYSTEM RESEARCH LABORATORY (ESRL)<br />
Cryospheric<br />
<strong>and</strong> Polar<br />
Processes<br />
Environmental<br />
Observations, <strong>Modeling</strong><br />
<strong>and</strong> Forecasting<br />
Center for<br />
Limnology<br />
Aerospace<br />
Engineering<br />
Sciences<br />
Ecology <strong>and</strong><br />
Evolutionary<br />
Biology<br />
Molecular, Cellular<br />
<strong>and</strong> Developmental<br />
Biology<br />
Global Monitoring<br />
Division (GMD)<br />
National Geophysical<br />
Data Center (NGDC)<br />
NOAA CENTERS<br />
7<br />
Global <strong>Systems</strong><br />
Division (GSD)<br />
Space Environment<br />
Center (SEC)<br />
CIRES DIVISIONS<br />
Environmental<br />
Biology<br />
Solid Earth<br />
Sciences<br />
CIRES INTERDISCIPLINARY CENTERS<br />
Center for Science<br />
<strong>and</strong> Technology<br />
Policy Research<br />
(CSTPR)<br />
Center for the<br />
Study of Earth<br />
from Space<br />
(CSES)<br />
National Snow<br />
<strong>and</strong> Ice<br />
Data Center<br />
(NSIDC)<br />
Physical Sciences<br />
Division (PSD)<br />
Environmental<br />
Chemistry<br />
Weather <strong>and</strong><br />
Climate Dynamics<br />
UNIVERSITY DEPARTMENTS AND PROGRAMS<br />
Atmospheric<br />
<strong>and</strong> Ocean<br />
Sciences<br />
Electrical<br />
<strong>and</strong> Computer<br />
Engineering<br />
Physics<br />
Chemistry<br />
<strong>and</strong><br />
Biochemistry<br />
Geological<br />
Sciences<br />
Environmental<br />
Studies<br />
Program<br />
Climate<br />
Diagnostics<br />
Center (CDC)<br />
Civil, Environmental<br />
<strong>and</strong> Architectural<br />
Engineering<br />
Geography<br />
Figure 2. CIRES’ divisions, centers, <strong>and</strong> affiliated departments <strong>and</strong> programs; NOAA laboratories <strong>and</strong> centers.
CIRES in 2006-2007: Administration <strong>and</strong> Funding<br />
In recent years, CIRES has maintained modest <strong>and</strong> steady growth (Figure 3). The largest increment of CIRES‘<br />
funding (49%) is provided by the Agreement with NOAA, of which expenditures have increased slightly faster than<br />
inflation over the past five years. The Agreement provides a financial foundation to help support CIRES faculty <strong>and</strong><br />
research scientists in their active pursuit of funding from outside federal <strong>and</strong> non-federal contracts <strong>and</strong> grants. Their<br />
continued, collective success in obtaining external research awards has also regularly increased at a rate that slightly<br />
exceeds the rate of inflation. The University‘s monetary contribution to CIRES primarily covers faculty salaries, <strong>and</strong><br />
varies slightly due to year-over-year changes in the CIRES-affiliated University faculty roster.<br />
$25,000,000<br />
$20,000,000<br />
$15,000,000<br />
$10,000,000<br />
$5,000,000<br />
$0<br />
$19,416,537<br />
$20,486,086<br />
$17,806,124 $18,850,849 $19,269,133<br />
02-03 03-04 04-05 05-06 06-07<br />
Figure 3. CIRES expenditures 2003 – 2007. Continued growth over five years in University-sponsored funding,<br />
individual federal <strong>and</strong> non-federal contracts <strong>and</strong> grants, <strong>and</strong> NOAA Cooperative Agreement research support.<br />
8<br />
$21,989,557 $22,521,519 $23,432,561<br />
$20,440,477<br />
$2,485,604 $2,931,451 $3,107,435 $3,095,989 $3,175,951<br />
$20,979,787<br />
U. of Colo. Contracts/Grants Cooperative Agreement
CIRES in 2006-2007: Administration <strong>and</strong> Funding<br />
Agreement expenditures by task for FY07 are shown in Figure 4. Task I expenditures include CIRES administration<br />
<strong>and</strong> internal scientific programs such as the Visiting Fellows program. Task II provides partial funding for the<br />
National Snow <strong>and</strong> Ice Data Center, the largest of CIRES‘ five interdisciplinary scientific centers. Task III funds<br />
CIRES‘ collaboration with NOAA‘s Earth System Research Laboratory, National Geophysical Data Center, <strong>and</strong><br />
Space Environment Center. Task IV was created to serve as an efficient administrative mechanism for directing<br />
NOAA research grants <strong>and</strong> awards, which would otherwise be st<strong>and</strong>-alone grants <strong>and</strong> awards outside the<br />
Agreement, to University researchers in fields allied with CIRES‘ mission. Water in the West is a CIRES‘ program<br />
to provide water research <strong>and</strong> decision support to policy makers throughout the western U.S.<br />
Task III (83%)<br />
$19,398,479<br />
Figure 4. Cooperative Agreement expenses by task for FY07.<br />
The largest share (43%) of Task I supports CIRES administration, primarily salaries <strong>and</strong> benefits for the<br />
administrative staff (Figure 5). The Visiting Fellows program receives the second largest share (31%) of Task I<br />
expenditures <strong>and</strong> is supported by other funding as well. Task I also provides partial support of CIRES‘ Education<br />
<strong>and</strong> Outreach program, other research, <strong>and</strong> the physical plant facilities.<br />
9<br />
Task IV (1%)<br />
$218,298<br />
Water in the West (2%)<br />
$473,729<br />
Task I (13%)<br />
$3,161,461<br />
Task II (1%)<br />
$198,599
Other Research Support<br />
10%<br />
Outreach<br />
10%<br />
Visiting Fellows<br />
31%<br />
CIRES in 2006-2007: Administration <strong>and</strong> Funding<br />
Figure 5. CIRES Task I base fund expenditures for FY07.<br />
Task I funding is supplemented by CIRES‘ portion of the University‘s indirect cost recovery (ICR), which is<br />
distributed annually to academic units as a proportion of indirect costs funded through University researchers‘ grants<br />
<strong>and</strong> awards (Figure 6).<br />
Other Research Support<br />
19%<br />
Outreach<br />
6%<br />
Student Support<br />
5%<br />
Visiting Fellows<br />
10%<br />
Facilities<br />
9%<br />
Figure 6. CIRES Task I base fund plus ICR return expenditures for FY07.<br />
10<br />
Facilities<br />
6%<br />
Administration<br />
43%<br />
Administration<br />
51%
CIRES in 2006-2007: Contributions to NOAA’s Strategic Vision<br />
Contributions to NOAA’s Strategic Vision<br />
Cross-cutting, interdisciplinary research priorities within CIRES complement NOAA‘s current Five-Year Research<br />
Plan priorities, which aim to enhance the underst<strong>and</strong>ing <strong>and</strong> prediction the of Earth‘s environment. The Five-Year<br />
Research Plan reflects NOAA‘s response to some of the nation‘s most challenging environmental needs, as<br />
identified in the 20-Year Research Vision, <strong>and</strong> supports the four mission goal areas identified in the NOAA<br />
Strategic Plan – Ecosystems, Climate, Weather <strong>and</strong> Water, <strong>and</strong> Commerce <strong>and</strong> Transportation. The following are<br />
examples of CIRES research that supports NOAA‘s mission goals.<br />
Ecosystem Mission Goal: Protect, restore, <strong>and</strong><br />
manage the use of coastal <strong>and</strong> ocean resources<br />
through ecosystem based management.<br />
CIRES contributes to the ecosystem mission goal through<br />
observations <strong>and</strong> research on habitat, ecosystems, <strong>and</strong><br />
extreme events. Toward this goal, CIRES is a valuable<br />
contributor to research on ocean temperature <strong>and</strong> climate.<br />
CIRES researchers are diagnosing impacts of changes in<br />
tropical sea surface temperature over the last 50 years, <strong>and</strong><br />
determining sensitivity to past <strong>and</strong> future temperature<br />
changes in different parts of the tropical oceans. Using a<br />
satellite retrieval method recently developed by ESRL<br />
researchers, CIRES is creating a multi-year global oceanic data set of near-surface temperatures <strong>and</strong> humidity.<br />
Crossing disciplines, CIRES is evaluating data on ocean warming to assess the possibility of abrupt climate change<br />
over North America, <strong>and</strong> using global chemistry/dynamics models to examine the effect of future ship traffic in the<br />
Arctic northern passages on Arctic pollution.<br />
Ecosystem management includes the assessment of potential hazards based on the collection <strong>and</strong> interpretation of<br />
environmental data. CIRES is developing a U.S. Tsunami Hazard Assessment that will describe tsunami sources <strong>and</strong><br />
estimate tsunami frequency based on historical <strong>and</strong> geological tsunami data.<br />
Climate Mission Goal: Underst<strong>and</strong> climate variability<br />
<strong>and</strong> change to enhance society’s ability to plan <strong>and</strong><br />
respond.<br />
CIRES is a respected leader in areas of climate science research<br />
relevant to NOAA‘s climate mission goal. Researchers at CIRES<br />
have contributed substantially towards climate observations,<br />
analysis, <strong>and</strong> predictions; climate forcing; <strong>and</strong> climate effects on<br />
ecosystems across various spatial <strong>and</strong> temporal scales. Basic<br />
research at CIRES has advanced our underst<strong>and</strong>ing of observed<br />
long-term climate variations <strong>and</strong> recent unexpected changes,<br />
especially in the polar regions. Spatially, CIRES‘ vast research<br />
spans from the sea surface, l<strong>and</strong>, <strong>and</strong> ice to the lower <strong>and</strong> upper<br />
atmospheres <strong>and</strong> space environment.<br />
CIRES develops methods <strong>and</strong> processes for integrating multiple<br />
types of climate research data, <strong>and</strong> making the data more<br />
streamlined <strong>and</strong> accessible to facilitate interoperability within the scientific community for the purpose of<br />
knowledge extraction, data quality control <strong>and</strong> validation, <strong>and</strong> trend detection. Tools are also being created for the<br />
public <strong>and</strong> policy makers to increase access to climate science information <strong>and</strong> forecast products.<br />
11
CIRES in 2006-2007: Contributions to NOAA’s Strategic Vision<br />
Weather <strong>and</strong> Water Mission Goal: Serve society’s needs for weather <strong>and</strong> water information.<br />
CIRES contributes to NOAA‘s mission to provide essential<br />
information on weather, which critically influences regional<br />
air quality, through its research on new approaches <strong>and</strong><br />
instrumentation to conduct atmospheric observations. CIRES<br />
researchers analyze pollutant ozone <strong>and</strong> fine particles, <strong>and</strong><br />
their intercontinental transport, to better underst<strong>and</strong> how they<br />
affect overall air quality <strong>and</strong> its impacts on public health.<br />
CIRES participates in the Texas <strong>and</strong> New Engl<strong>and</strong> Air Quality<br />
Studies <strong>and</strong> undertakes research that contributes to enhanced<br />
regional air quality prediction <strong>and</strong> to improved regional-scale<br />
weather forecasts, including forecasts of severe weather<br />
events.<br />
CIRES contributes to the need for state-of-the-art information<br />
on water through its investigations on novel approaches for<br />
streamflow reconstructions <strong>and</strong> future streamflow projections.<br />
Efforts are also ongoing to provide support activities for the National Integrated Drought Information System <strong>and</strong> to<br />
provide input to the Climate Prediction Center to assist in the planning of water operations during droughts, as well<br />
as to develop guidelines for estimating the economic costs of drought in Western states.<br />
Commerce <strong>and</strong> Transportation Mission Goal: Support the nation’s commerce with information for<br />
safe, efficient, <strong>and</strong> environmentally sound transportation.<br />
CIRES contributes to the transportation goal primarily in relation to aviation. Enhancing database <strong>and</strong> web-interface<br />
functionality <strong>and</strong> improving real-time processing modules supports verification of aviation parameters, such as<br />
icing, turbulence, <strong>and</strong> convective weather. These new tools <strong>and</strong> verification approaches provide information about<br />
the quality of aviation forecasts to aviation decision makers.<br />
12
CIRES in 2006-2007: Creating a Dynamic Research Environment<br />
Creating a Dynamic Research Environment<br />
CIRES has created a number of programs <strong>and</strong> initiatives to stimulate interdisciplinary collaborations between<br />
CIRES, NOAA <strong>and</strong> University Departments. The following paragraphs summarize our main programs. Detailed<br />
descriptions <strong>and</strong> specific research outcomes can be found in the Complementary Research section of this report.<br />
CIRES’ Outst<strong>and</strong>ing Performance Awards Program<br />
The CIRES Awards Committee, comprised of CIRES‘ Members‘ Council representatives, annually reviews the<br />
nominations <strong>and</strong> recommends awards for outst<strong>and</strong>ing professional achievement. Five awards of $2,000 each were<br />
given this year, three in the science <strong>and</strong> engineering category <strong>and</strong> two in the service category. The awards were<br />
presented to each individual or research team at the CIRES‘ Members‘ Council Rendezvous symposium (see below).<br />
This year, CIRES recognized Joost de Gouw (CSD), David Stone <strong>and</strong> Kelvin Fedrick (SEC), <strong>and</strong> Jonathan Kofler<br />
(GMD) for outst<strong>and</strong>ing performance in Science <strong>and</strong> Engineering, <strong>and</strong> Allaina Howard (NSIDC), <strong>and</strong> John Maurer<br />
(NSIDC) for outst<strong>and</strong>ing achievements in Service.<br />
In 2006, NOAA presented its 2006 Bronze Award to NOAA employees for demonstrating the usefulness of<br />
unmanned aircraft systems in accomplishing NOAA‘s mission, including operational <strong>and</strong> research goals. Several<br />
CIRES members were integral members of this stellar team, <strong>and</strong> in April 2007, CIRES presented them each with<br />
plaques recognizing their contributions. These CIRES members are Dale Hurst (GMD), Fred Moore (GMD),<br />
Geoffrey Dutton (GMD) David Nance (GMD), Brian Vasel (GMD), Marian Klein (formerly PSD) Vladimir<br />
Leuski (formerly PSD), <strong>and</strong> Eric Ray (CSD).<br />
Visiting Fellows Program<br />
CIRES annually conducts a competitive Visiting Fellows program that promotes collaborative research at the<br />
forefront of scientific knowledge. One-year fellowships are made to Ph.D. scholars <strong>and</strong> university faculty planning<br />
sabbatical leave to continue their education in research positions that may foster interdisciplinary training <strong>and</strong><br />
exposure to scientific assessments <strong>and</strong> policy research. Since 1967, CIRES has awarded more than 220 Visiting <strong>and</strong><br />
Sabbatical Fellowships. Recipients have included previous CIRES Director, Susan Avery, <strong>and</strong> current Director,<br />
Konrad Steffen. Selections are based in part on the likelihood of stimulating academic interactions <strong>and</strong> the degree to<br />
which both parties will benefit from the exchange of new ideas. To further this goal, the competition is open to<br />
scientists from all countries, <strong>and</strong> priority is given to c<strong>and</strong>idates with research experience at institutions outside the<br />
Boulder scientific community.<br />
Fellowships are offered to scientists with research interests in the following areas:<br />
Physics, chemistry, <strong>and</strong> dynamics of the Earth system (atmosphere, biosphere, hydrosphere, lithosphere,<br />
cryosphere)<br />
Global <strong>and</strong> regional environmental change<br />
Climate system monitoring, diagnostics, <strong>and</strong> modeling<br />
Remote sensing <strong>and</strong> in situ measurement techniques for the Earth system<br />
Interdisciplinary research themes<br />
Graduate Research Fellowship Program<br />
CIRES has long supported a Graduate Research Fellowship program to promote student scholarship <strong>and</strong> research<br />
excellence. The program embraces a dual approach by (1) attracting the outst<strong>and</strong>ing students at the outset of their<br />
graduate careers, <strong>and</strong> (2) enabling current students to place a greater emphasis on completing <strong>and</strong> publishing their<br />
research results. Support ranges from a summer stipend to tuition, stipend <strong>and</strong> partial health insurance for one year<br />
(12 months). Fellowships are restricted to Ph.D. students advised by a CIRES Fellow or any prospective or current<br />
graduate student who might be advised by a CIRES Fellow. Evaluations by a committee of CIRES Fellows are<br />
based on the c<strong>and</strong>idate‘s University application, accomplishments, <strong>and</strong> the likelihood of their contribution to<br />
environmental science. Independence, passion for science, <strong>and</strong> ability to communicate are also considered. This<br />
year, CIRES awarded fellowships to seven students, five of whom were new recruits, to explore topics ranging from<br />
climate change <strong>and</strong> the mass balance of the Greenl<strong>and</strong> ice sheet to natural carbon storage in ecosystems <strong>and</strong> the role<br />
of organic haze in the early Earth‘s atmosphere.<br />
13
CIRES in 2006-2007: Creating a Dynamic Research Environment<br />
Innovative Research Program (IRP)<br />
The purpose of the CIRES-wide competitive Innovative Research<br />
Program is to stimulate a creative research environment within CIRES <strong>and</strong><br />
encourage synergy between<br />
disciplines <strong>and</strong> research colleagues.<br />
The program encourages novel,<br />
unconventional <strong>and</strong>/or fundamental<br />
research that may quickly provide<br />
concept viability or rule out further<br />
consideration. Activities are not<br />
tightly restricted <strong>and</strong> can range from<br />
instrument development, lab testing,<br />
<strong>and</strong> field observations to model<br />
advancement. Funded projects are<br />
inventive, often opportunistic, <strong>and</strong><br />
do not necessarily have an<br />
immediate practical application or<br />
guarantee of success. Each year, an interdisciplinary team selects the award<br />
recipients, <strong>and</strong> the results of their research are presented the following year at a<br />
poster reception. The winners of the ninth annual Innovative Research Program<br />
competition include projects to improve hurricane forecasting <strong>and</strong> explore the<br />
use of bacteria in cleaning up <strong>and</strong> converting toxins found in crude oil <strong>and</strong> tar.<br />
Education <strong>and</strong> Outreach (EO)<br />
The CIRES‘ Education <strong>and</strong> Outreach program provides science education opportunities for educators, students <strong>and</strong><br />
scientists. Their work emphasizes scientific inquiry, links with current research, <strong>and</strong> underst<strong>and</strong>ing of foundational<br />
concepts in geoscience. Examples of programs for educators include Earthworks, a week-long Earth System Science<br />
retreat for science teachers, <strong>and</strong> the Northeast Front Range Math <strong>and</strong> Science Partnership summer institutes.<br />
Programs designed for students include the National Ocean Sciences Bowl <strong>and</strong> the EVE-MESA high school course<br />
for English Language Learners. Programs supporting scientists include the Resources for Scientists in Partnerships<br />
with Education (ReSciPE) workshops <strong>and</strong> collaboration with scientists preparing geoscience research proposals to<br />
include educational components. While EO does work across the breadth of CIRES research topics, the group has<br />
developed a suite of work in climate sciences, including video products <strong>and</strong> mechanisms to help climate scientists<br />
communicate about their research to the public.<br />
Western Water Assessment (WWA)<br />
The Western Water Assessment is CIRES‘ signature integrating<br />
activity that involves personnel from the Climate Diagnostics<br />
Center, the Center for Science <strong>and</strong> Technology Policy Research,<br />
the Center for Limnology, the National Climatic Data Center, the<br />
Natural Resources Law Center, the Institute for Behavioral<br />
Studies, <strong>and</strong> the Institute for Arctic <strong>and</strong> Alpine Research. Its<br />
mission is to identify <strong>and</strong> characterize regional vulnerabilities to<br />
climate variability <strong>and</strong> change <strong>and</strong> to develop information,<br />
products <strong>and</strong><br />
processes to<br />
assist waterresource<br />
decision<br />
makers throughout the Intermountain West. WWA is responsive to<br />
NOAA‘s mission, strategic goals, <strong>and</strong> cross-cutting priorities, as<br />
well as other congressional NOAA m<strong>and</strong>ates, including the U.S.<br />
Global Change Research Act <strong>and</strong> the Climate Change Strategic<br />
Program. WWA is funded by the NOAA Office of Global<br />
Programs as part of their Regional Integrated Sciences <strong>and</strong><br />
Assessments program.<br />
14
CIRES in 2006-2007: Creating a Dynamic Research Environment<br />
Rendezvous! CIRES’ Members’ Council Symposium<br />
The CIRES‘ Members‘ Council held its second annual research<br />
symposium on April 10, 2007. Mirroring the purpose of the old west‘s<br />
gathering of tribes, traders <strong>and</strong> settlers for an exchange of goods,<br />
information <strong>and</strong> good will, the meeting was dubbed ―Rendezvous.‖<br />
This one-day symposium featured presentations by Director Konrad<br />
Steffen, the six associate directors, the directors of the Center for<br />
Science <strong>and</strong> Technology Policy Research <strong>and</strong> the Education Outreach<br />
Program, <strong>and</strong> brief introductions by the presenters of approximately 80<br />
posters. CIRES took<br />
advantage of the occasion<br />
to honor the winners of<br />
the 2007 Outst<strong>and</strong>ing<br />
Performance Awards. Two poster sessions <strong>and</strong> a luncheon rounded out<br />
the successful day. CIRES was pleased to host not only its own<br />
members, but also several visitors from the University <strong>and</strong> NOAA.<br />
Organized by the Members‘ Council, this symposium continued the<br />
tradition that began last year of bringing together CIRES members,<br />
Fellows, <strong>and</strong> students to highlight the depth <strong>and</strong> breadth of science <strong>and</strong><br />
to foster scientific exchange in a stimulating setting.<br />
Distinguished Lecture Series<br />
CIRES promotes global perspectives by sponsoring notable speakers whose work crosses disciplinary boundaries.<br />
The Distinguished Lecture Series features outst<strong>and</strong>ing scientists, science policy makers, <strong>and</strong> science journalists who<br />
take imaginative positions on environmental issues <strong>and</strong> can establish enduring connections after their departure.<br />
John M. “Mike” Wallace, Joint Institute for the Study of<br />
the Atmosphere <strong>and</strong> Ocean, University of Washington,<br />
Seattle<br />
―Year-to-year Variability <strong>and</strong> Long-term Trends in the<br />
Circulation over High Latitudes‖<br />
Prasad Gogineni, Center for Remote Sensing of Ice<br />
Sheets, University of Kansas, Lawrence<br />
―Synthetic Aperture Radar Imaging of Ice-bed Interface<br />
<strong>and</strong> Radar Sounding of Fast-Flowing Glaciers‖<br />
Stefan Hastenrath, Department of Atmospheric <strong>and</strong><br />
Oceanic Sciences, University of Wisconsin-Madison<br />
―Variations of East African Climate, Glaciers <strong>and</strong> Lakes<br />
over the Past Two Centuries‖<br />
Am<strong>and</strong>a Lynch, School of Geography <strong>and</strong> Environmental<br />
Science, Monash University, Australia<br />
―A Factorial Analysis of Storm Surge Flooding in Barrow,<br />
Alaska: An Adaptation Study‖<br />
15
CIRES in 2006-2007: Creating a Dynamic Research Environment<br />
Symposia <strong>and</strong> Conferences<br />
Listed below are events sponsored, organized, or hosted by CIRES.<br />
Northeast Front Range Math/Science Partnership: Earth & Space Science (7/06)<br />
Director‘s town meetings (7/06, 8/06, 9/06)<br />
ESRL Dedication (8/06)<br />
Northeast Front Range Math/Science Partnership: Algebra in Middle Level Mathematics Teaching (9/06,<br />
10/06, 11/06)<br />
Public Lecture by Astronaut Harrison ―Jack‖ Schmitt (9/06)<br />
Innovative Research Program poster session (9/06)<br />
Panel Discussion on An Inconvenient Truth: Assessing the Science <strong>and</strong> Policy Implications (9/06)<br />
Water, Drought <strong>and</strong> Wyoming‘s Climate (10/06)<br />
Climate Change <strong>and</strong> Variability in the San Juan Mountains (10/06)<br />
Climate Diagnostics <strong>and</strong> Prediction workshop (10/06).<br />
Climate Change for Water Resource Managers workshop (11/06)<br />
ReSciPE Inquiry workshop at University of Colorado (11/06)<br />
ReSciPE Inquiry workshop at Colorado Science convention (11/06)<br />
Energy Initiative symposium (10/06)<br />
NSIDC 30th Anniversary seminar (10/06)<br />
Sierra Nevada workshop (10/06)<br />
Consortium of Resonance <strong>and</strong> Rayleigh Lidars meeting (11/06)<br />
Visiting <strong>and</strong> Graduate Fellowships poster session (11/06)<br />
The Climate <strong>and</strong> Cryosphere <strong>Scientific</strong> Steering Group meeting (12/06)<br />
North American Carbon Program Investigators meeting (1/07)<br />
Joint Canada/Mexico/USA Carbon Program Planning meeting (1/07)<br />
Climate <strong>and</strong> Tourism Workshop: Identifying links between climate variability <strong>and</strong> change <strong>and</strong> tourism<br />
industries on the Colorado Plateau (01/07)<br />
National Ocean Science Bowl Regional Competition: Mountain Mariner Challenge (2/07)<br />
Climate Change Activities at CU, Climate Change Network brown bag lunch (2/07)<br />
North American Volcanic <strong>and</strong> intrusive rock DATabase (NAVDAT) meeting (3/07)<br />
Ice Fest, Celebrating the Launch of IPY (3/07)<br />
Boulder Labs Diversity Council meeting: Building Tomorrow‘s Workplace in 2007 (3/07)<br />
The Web <strong>and</strong> the West: Comparing Two Frontiers (3/07)<br />
NOAA Coastal Services Project Design <strong>and</strong> Evaluation workshop (3/07)<br />
CIRES‘ Members‘ Council Rendezvous Science symposium (4/07)<br />
National Seasonal Assessment Workshop for Wildfire Potential in the Western States <strong>and</strong> Alaska (04/07)<br />
ReSciPE Inquiry workshop at Challenger Learning Center, Maine (11/06)<br />
Introduction to Inorganic Isotope Ratio Mass Spectrometry (6/07)<br />
Earthworks workshop for Secondary Science Teachers (6/07)<br />
Northeast Front Range Math/Science Partnership: Integrating Earth & Space Science with Physical Science<br />
(6/07)<br />
Presentations by Other Guest Speakers<br />
Frank Laird Fighting Evolution, Controlling Education: Controversy over Intelligent Design (9/06)<br />
Jana Milford Dealing with Uncertainty in Regulatory Applications of Air Quality Models (9/06)<br />
Sarah Krakoff Climate Change, Morality <strong>and</strong> Law (10/06)<br />
Carl Koval CU’s New Energy Initiative (10/06)<br />
Michael Zimmerman Outline of an Integral Ecology (11/06)<br />
Juan Bautista Bengoetxea Science <strong>and</strong> Technology Studies in Spain (11/06)<br />
Lisa Keränen Public <strong>and</strong> Technical Argument in Science-Based Controversies (12/06)<br />
Katinka Waelbers Philosophy of Science, Technology & Society: Master program at the University of<br />
Twente (1/07)<br />
Paul Komor Meeting Colorado's Future Electricity Needs: One Question, Many Answers (1/07)<br />
16
CIRES in 2006-2007: Creating a Dynamic Research Environment<br />
Brad Udall All Institute Seminar - Western Water Management at a Tipping Point: Recent Activities of the<br />
CIRES’ Western Water Assessment (2/07)<br />
Juan Lucena What the Field of Engineering Studies has to Contribute to CSTPR (2/07)<br />
Juan Lucena Engaging Engineers in Policymaking: From Problem Solvers to Problem Definers (2/07)<br />
Martin Hoerling Past Peak Water in the West (2/07)<br />
Björn-Ola Linnér Who Gets What, How <strong>and</strong> When: Historical Responsibility & Emissions Trade in Climate<br />
Policy (2/07)<br />
Jennifer Kuzma Emerging Technologies & the Environment: Case Studies for Science & Technology<br />
Policy (3/07)<br />
Jennifer Kuzma Oversight for Nanotechnology: No Small Matter (3/07)<br />
Mark Squillace The Future of Federal Wetl<strong>and</strong>s Regulation (3/07)<br />
Krister Andersson Decentralized Governance & Environmental Change (4/07)<br />
Wayne Ambler How Should We Introduce Engineering Undergraduates to STS <strong>and</strong> Policy Issues? (4/07)<br />
17
CIRES in 2006-2007: Creating a Dynamic Research Environment<br />
18
<strong>Theme</strong> report: <strong>Advanced</strong> <strong>Modeling</strong> <strong>and</strong> <strong>Observing</strong> <strong>Systems</strong><br />
<strong>Theme</strong> Reports<br />
<strong>Scientific</strong> <strong>Theme</strong>: ADVANCED MODELING AND OBSERVING SYSTEMS<br />
AMOS-01: Instrumentation Design, Prototyping <strong>and</strong> Analysis<br />
CSD01: Instrumentation for Atmospheric Observation <strong>and</strong> Analysis<br />
CET01: Remote Hydrologic Sensing<br />
PSD08: Sensor <strong>and</strong> Technique Development<br />
AMOS-02: Data Management, Projects <strong>and</strong> Infrastructure <strong>Systems</strong><br />
NGDC01: Geospatial Technology for Global Integrated <strong>Observing</strong> <strong>and</strong> Data<br />
Management <strong>Systems</strong><br />
NGDC02: Marine Geophysics Data Stewardship<br />
SEC03: Information Technology <strong>and</strong> Data <strong>Systems</strong><br />
SEC04: Space Environment Data Algorithm <strong>and</strong> Product Development<br />
AMOS-03: Prediction, Model Development <strong>and</strong> Evaluation<br />
CSD02: Chemical Transport Model Research<br />
PSD09: Environmental Monitoring <strong>and</strong> Prediction<br />
GSD01: Regional Numerical Weather Prediction<br />
GSD03: Verification Techniques for the Evaluation of Aviation Weather Forecasts<br />
NGDC03: Space Weather<br />
SEC01: Solar Disturbances in the Geospace Environment<br />
SEC02: <strong>Modeling</strong> the Upper Atmosphere<br />
AMOS-04: <strong>Observing</strong> Facilities, Campaigns <strong>and</strong> Networks<br />
GMD01: Central Ultraviolet Calibration Facility<br />
GMD02: Surface Radiation Network<br />
AMOS-01: Instrumentation Design, Prototyping <strong>and</strong> Analysis<br />
CSD01: Instrumentation for Atmospheric Observation <strong>and</strong> Analysis<br />
GOALS:<br />
Design <strong>and</strong> evaluate new approaches <strong>and</strong> instrumentation to make atmospheric observations of hard-to-measure<br />
species that are important players in the chemistry of the troposphere <strong>and</strong> stratosphere.<br />
MILESTONE CSD01.1:<br />
Report airborne observations of gas-phase ammonia (NH3) that were made aboard the NOAA<br />
WP-3D by a newly chemical ionization mass spectrometry (CIMS) technique during the New<br />
Engl<strong>and</strong> Air Quality Study–Intercontinental Transport <strong>and</strong> Chemical Transformation (NEAQS–<br />
ITCT).<br />
ACCOMPLISHMENTS FOR CSD01.1:<br />
Ammonia (NH3) is the dominant gas-phase base in the troposphere. As a consequence, NH3 abundance influences<br />
aerosol nucleation <strong>and</strong> composition <strong>and</strong> affects regional air quality, atmospheric visibility, <strong>and</strong> acid deposition<br />
patterns. Major sources of NH3 in the troposphere include biomass burning <strong>and</strong> anthropogenic emissions from<br />
livestock waste, large-scale application of fertilizer, <strong>and</strong> automobile emissions. Despite its importance, there are few<br />
observations of NH3 above the planetary boundary layer. Some of the earliest were by filter or denuder techniques<br />
that required sampling times (>15 min) that are not well suited to aircraft traveling at speeds of 100 m s -1 or greater.<br />
NH3 mixing ratios in concentrated plumes from biomass burning sources have been reported at greater than 10 partsper-billion<br />
by volume (ppbv). However, NH3 mixing ratios as low as 0.1 ppbv have been hypothesized to influence<br />
important atmospheric processes, such as new particle formation. To further underst<strong>and</strong> the distribution of NH3<br />
throughout the atmosphere, its role in atmospheric processes such as aerosol formation, <strong>and</strong> the impact of<br />
19
<strong>Theme</strong> report: <strong>Advanced</strong> <strong>Modeling</strong> <strong>and</strong> <strong>Observing</strong> <strong>Systems</strong><br />
anthropogenic <strong>and</strong> agricultural NH3 sources on regional air quality, fast-time resolution, sub-ppbv airborne<br />
observations are needed.<br />
To address this need, a Chemical Ionization Mass Spectrometer (CIMS) instrument for measuring NH3 from an<br />
airborne platform was developed. The newly developed technique utilized a protonated acetone dimer detection<br />
scheme to selectively <strong>and</strong> sensitively measure NH3 aboard the NOAA WP-3D aircraft during the New Engl<strong>and</strong> Air<br />
Quality Study – Intercontinental Transport <strong>and</strong> Chemical Transformation (NEAQS–ITCT) field campaign. The<br />
average sensitivity determined from in-flight st<strong>and</strong>ard addition calibrations ranged from 2.6 to 5 ion counts per<br />
second (Hz)/parts-per-trillion by volume (pptv) for 1 MHz of reagent ion <strong>and</strong> could be adjusted by varying the flow<br />
tube residence time. The average 1-σ variation in sensitivity for a given flight was 20%-25%. A heated/thermostated<br />
PFA Teflon inlet was used for sampling ambient air. The instrument time response was determined in-flight from<br />
the NH3 signal decay after removal of a st<strong>and</strong>ard addition calibration. The 2 e-folding signal decay time for all<br />
calibration curves analyzed ranged from 4 sec to 10 sec <strong>and</strong> on average was 5 sec. This suggested the instrument<br />
time response was on the order of 5 sec. The background signal was determined routinely in-flight by scrubbing<br />
NH3 from the ambient sample <strong>and</strong> ranged from 0.5 to 1.3 ppbv. For a 5-sec measurement, the uncertainty in an<br />
individual background measurement varied from 20 to 60 pptv. The difference in consecutive background<br />
measurements ranged from 50 pptv to 100 pptv. Total uncertainty for the 5-sec data was estimated at no worse than<br />
± (30% + 125 pptv), though for certain individual flights, it was less. The accuracy <strong>and</strong> precision of the airborne<br />
instrument was similar to previous ground instruments. However, the time response of the airborne instrument was<br />
faster <strong>and</strong> it was more sensitive than these instruments, primarily due to improvements in the ion transmission, inlet<br />
construction, <strong>and</strong> cleaner mass spectra due to use of a collisional dissociation chamber.<br />
The 5-sec data obtained during NEAQS–ITCT enabled the observation of NH3 from a variety of sources including<br />
biomass burning plumes, urban areas, <strong>and</strong> an agricultural source. NH3 enhancements of 1 to 5 ppbv were observed<br />
on many flights in biomass burning plumes 8-10 days old with no enhancement observed in aged (~14 days old)<br />
biomass burning plumes. In the biomass burning plumes, NH3 was well correlated with carbon monoxide (CO), a<br />
biomass burning tracer, with slopes ranging from 0.007 to 0.015 ppbv. During the 25 July flight, enhancements in<br />
NH3 mixing ratios were coincident with enhancements in CO, the sum of nitrogen oxide (NO) <strong>and</strong> nitrogen dioxide<br />
(NO2), <strong>and</strong> sulfur dioxide (SO2) mixing ratios downwind of New York City. NH3 mixing ratios ranged from 0.4 to 1<br />
ppbv in the New York City emission plume <strong>and</strong> were
<strong>Theme</strong> report: <strong>Advanced</strong> <strong>Modeling</strong> <strong>and</strong> <strong>Observing</strong> <strong>Systems</strong><br />
statistical analysis of ethene observations between the two years. It was found that ethene was on average 40% lower<br />
in 2006 than in 2000. Even though the meteorology was also very different between the two years, it was concluded<br />
that the difference was more likely due to a reduction in ethene emissions, because (1) other trace gases did not<br />
show a decrease between 2000 <strong>and</strong> 2006, <strong>and</strong> (2) formaldehyde, an atmospheric oxidation product of ethene,<br />
showed a similar 40% decrease.<br />
The other issue that analyses have focused on is a quantification of ethene emission sources. By integrating across<br />
the width of an industrial plume, <strong>and</strong> by taking the wind speed <strong>and</strong> direction into account, the emission flux can be<br />
estimated assuming a homogeneous distribution across the height of the boundary layer. This method of estimating<br />
emissions was compared to results from a solar occultation flux (SOF) measurement operated by Chalmers<br />
University (Gothenburg, Sweden) onboard a mobile laboratory. The SOF measurement determines column ethene<br />
using absorption of solar IR radiation, <strong>and</strong> thus provides a completely independent estimate of the ethene fluxes in<br />
the Houston area. The results from the two methods generally agreed within a factor of 2 without systematic biases.<br />
A comparison of the results with flux estimates represented in an emissions database revealed that the actual fluxes<br />
are 10-40 times higher than those used in the modeling. This is very important information for air-quality managers<br />
in Texas to take into account in their efforts to underst<strong>and</strong> <strong>and</strong> model ozone formation in the area.<br />
The results of this work have been presented at two workshops in Austin, Texas, to colleagues involved in the study,<br />
officials from the Texas Commission on Environmental Quality (TCEQ) <strong>and</strong> other interested parties. A publication<br />
about this work is in preparation for the Journal of Geophysical Research.<br />
MILESTONE CSD01.3:<br />
(i) Characterize quantitatively the response of the cavity ring-down single particle aerosol<br />
instrument, <strong>and</strong> plan use of it on actual air-flows brought into the laboratory. (ii) Deploy the<br />
organic aerosol collector on the NOAA R/V Ronald H. Brown <strong>and</strong> use suitable mass spectrometry<br />
to analyze the samples.<br />
ACCOMPLISHMENTS FOR CSD01.3:<br />
(i) The development of a cavity ring-down instrument to measure the albedos <strong>and</strong> optical sizes of individual aerosol<br />
particles was completed, <strong>and</strong> characterization of the instrument performance was carried out. During the instrument<br />
characterization, it was determined that obtaining the particle extinction, which is necessary for the albedo<br />
measurement, by measuring the depletion in the cavity laser intensity, provides a more robust measurement than the<br />
ring-down method. The depletion method provided less spread in the measured albedo values for a collection of<br />
particles of known sizes <strong>and</strong> optical properties than those derived from the ring-down time measurements. The<br />
depletion method also avoids some technical difficulties associated with operating the instrument in the cavity ringdown<br />
mode. The instrument operating in the depletion mode is able to optically size the diameters of laboratorygenerated<br />
particles to within 50 nm. Currently, the instrument can measure the albedo <strong>and</strong> size of particles down to<br />
diameters of around 300 nm <strong>and</strong> an upper size limit above a micron in diameter. Changes in albedo of greater than<br />
10-15% were observable using partially absorbing dyed laboratory particles. Final modifications are being made to<br />
the instrument to provide a higher vacuum necessary for the introduction of particles from ambient air into the<br />
instrument. Currently, a manuscript is in preparation that describes the instrument <strong>and</strong> its capabilities. Plans are<br />
being made for field measurements in the near future.<br />
(ii) After evaluation of the performance of the prototype aerosol speciation instrument during the fall of 2005, a<br />
field-deployable instrument incorporating several additional improvements was constructed during the winter <strong>and</strong><br />
spring of 2006. The completed instrument was successfully deployed aboard NOAA R/V Ronald H. Brown for the<br />
TexAQS 2006/GoMACCS field campaign from August to mid-September in the western Gulf of Mexico/Houston<br />
Ship Channel region. Proton-transfer-reaction chemical ionization mass spectra of thermally-desorbed aerosol<br />
samples showed significant variations in the composition of the organic fraction of atmospheric aerosol on hourlyto-daily<br />
timescales. Data from the field campaign were reduced during fall 2006-winter 2007. First-look results were<br />
presented at a mass spectrometry conference in January 2007. Laboratory studies to assist with underst<strong>and</strong>ing the<br />
data acquired during the field campaign <strong>and</strong> to characterize further the performance of the instrument were begun<br />
during spring 2007 <strong>and</strong> are continuing. A manuscript describing the instrument <strong>and</strong> its performance is in<br />
preparation.<br />
21
<strong>Theme</strong> report: <strong>Advanced</strong> <strong>Modeling</strong> <strong>and</strong> <strong>Observing</strong> <strong>Systems</strong><br />
Time series of several masses observed by the AOS-PTR-ITMS during its initial deployment aboard R/V Ronald H.<br />
Brown during the summer 2006 TexAQS/GoMACSS campaign.<br />
MILESTONE CSD01.4:<br />
Develop ship-based <strong>and</strong> aircraft-based lidar systems to measure ozone <strong>and</strong> aerosol profiles.<br />
ACCOMPLISHMENTS FOR CSD01.4:<br />
Two lidars were deployed during the 2006 Texas Air Quality Study (TexAQS II) to measure ozone <strong>and</strong> aerosol<br />
profiles. The TOPAZ airborne ozone-profiling lidar was built the previous year <strong>and</strong> saw its first deployment at<br />
TexAQS II. TOPAZ is a compact <strong>and</strong> lightweight airborne ozone lidar based on an innovative, all solid-state,<br />
wavelength-tunable UV laser transmitter. During TexAQS II, TOPAZ flew 22 missions totaling approximately 120<br />
hours aboard a NOAA Twin Otter airplane during which it mapped out the three-dimensional distribution of ozone<br />
<strong>and</strong> aerosols over eastern Texas <strong>and</strong> the Gulf of Mexico. In addition to ozone mixing ratio <strong>and</strong> aerosol backscatter<br />
profiles, TOPAZ also provided highly resolved information on the spatial distribution of mixed layer height. First<br />
22
<strong>Theme</strong> report: <strong>Advanced</strong> <strong>Modeling</strong> <strong>and</strong> <strong>Observing</strong> <strong>Systems</strong><br />
results show that the data gathered with TOPAZ will be crucial to address important science questions regarding the<br />
local buildup <strong>and</strong> regional transport of ozone in eastern Texas.<br />
During TexAQS II, the OPAL lidar measured profiles of ozone <strong>and</strong> aerosol backscatter from aboard the NOAA R/V<br />
Ronald H. Brown. Recent lidar improvements included more accurate photodetectors, a simpler optical receiver, <strong>and</strong><br />
new aerosol data processing methods. In addition to ozone concentration, derived profiles include total uncalibrated<br />
backscatter, calibrated aerosol backscatter <strong>and</strong> aerosol extinction at 355 nm. Other products are cloud heights, <strong>and</strong><br />
aerosol layer heights (e.g. mixed-layer <strong>and</strong> residual layer heights) which are important for underst<strong>and</strong>ing pollution<br />
concentrations. The ozone profiles will be used to help explain the daily evolution of tropospheric ozone, especially<br />
to better define which situations develop into high ozone events. The aerosol data will be used for studies of aerosol<br />
hygroscopic growth factor, f(RH) (relating scattering at high relative humidity to that at low relative humidity) <strong>and</strong><br />
visibility, evaluation of air quality model predictions of aerosol, closure studies on aerosol optical <strong>and</strong> microphysical<br />
properties, <strong>and</strong> case studies of horizontal transport <strong>and</strong> vertical mixing.<br />
MILESTONE CSD01.5:<br />
Develop a ship-based remote sensing lidar to measure wind <strong>and</strong> turbulence profiles.<br />
ACCOMPLISHMENTS FOR CSD01.5:<br />
Underst<strong>and</strong>ing boundary layer dynamics, including mixed-layer heights, mean wind profiles, <strong>and</strong> mixing strength,<br />
are important for estimating pollutant concentration <strong>and</strong> transport in air quality studies. In order to make<br />
measurements of such atmospheric dynamics, NOAA‘s High Resolution Doppler Lidar (HRDL) has been updated in<br />
the following ways: The main laser has been updated to run at a higher output power by integrating new pump<br />
diodes, new optical systems to couple pump light into the laser cavity, <strong>and</strong> an improved thermal control system for<br />
the laser crystal itself. The motion compensation <strong>and</strong> scanning system has also been updated to incorporate<br />
automatically zenith stare files into a 15-minute scan pattern. Such zenith stare data provide new profiles of vertical<br />
velocity <strong>and</strong> vertical velocity variance (i.e. vertical mixing) that are used, along with horizontal mean winds derived<br />
from other scans, to underst<strong>and</strong> pollutant dispersion, mixing, <strong>and</strong> concentration. In addition, scientists have created<br />
new processing algorithms that enabled the wind <strong>and</strong> mixing profiles to be automatically generated <strong>and</strong> posted to<br />
ship-based <strong>and</strong> l<strong>and</strong>-based servers once every 15 minutes, thus allowing researchers near-real-time access to<br />
information about wind <strong>and</strong> mixing conditions for contextual <strong>and</strong> forecasting applications.<br />
Existing <strong>and</strong> forthcoming information derived from this data set include:<br />
• Profiles of horizontal mean wind speed <strong>and</strong> direction<br />
• Profiles of relative aerosol strength <strong>and</strong> aerosol layering<br />
• Vertical winds <strong>and</strong> profiles of vertical mixing/turbulence statistics<br />
• Horizontal (near surface) mixing/turbulence statistics<br />
• Aerosol <strong>and</strong> mixed layer (i.e., boundary layer) heights<br />
• Profiles of wind speed <strong>and</strong> directional shear<br />
• Boundary layer dynamic features: rolls, surface streaks, thunderstorm outflows, etc,<br />
• Ship/oil-platform plume detection.<br />
23
CET01: Remote Hydrologic Sensing<br />
<strong>Theme</strong> report: <strong>Advanced</strong> <strong>Modeling</strong> <strong>and</strong> <strong>Observing</strong> <strong>Systems</strong><br />
GOALS:<br />
Develop microwave remote sensing capabilities to facilitate NOAA measurements of key hydrological variables.<br />
MILESTONE CET01.1:<br />
Develop a new microwave sensing capability to enable NOAA measurements of soil moisture<br />
<strong>and</strong>/or snow water equivalent.<br />
24
<strong>Theme</strong> report: <strong>Advanced</strong> <strong>Modeling</strong> <strong>and</strong> <strong>Observing</strong> <strong>Systems</strong><br />
ACCOMPLISHMENTS FOR CET01.1:<br />
During FY2007, the CET operated the PSR/CXI soil<br />
moisture (SM) imaging radiometer as part of the DoE Cloud<br />
<strong>and</strong> LAnd Surface Interaction Campaign (CLASIC). The<br />
mission took place during June in Oklahoma, <strong>and</strong> resulted<br />
in eight successful mapping sorties during which the PSR<br />
mapped SM within the topmost 5 cm over a region of size<br />
~255 x 190 km with ~1.5 km resolution. Mapping occurred<br />
during the wettest month of June in Oklahoma history, thus<br />
providing unique conditions under which to test C-b<strong>and</strong> SM<br />
mapping capabilities under near-saturation. For the first<br />
time a self-contained algorithm was demonstrated for<br />
retrieval of SM with geo-registered overlap product<br />
delivered consistently within 24 hours of imaging <strong>and</strong><br />
estimated accuracy of ~5-10%, depending on vegetation<br />
overburden. The mission included the first-ever use of<br />
airborne SM mapping technology to assist in real-time flood<br />
risk assessment over deluged areas of central Texas.<br />
MILESTONE CET01.2:<br />
Develop an improved version of the DOTLRT radiative transfer model with radiance assimilation<br />
capabilities.<br />
ACCOMPLISHMENTS FOR CET01.2:<br />
The DOTLRT radiative transfer model was improved in two major capacities<br />
during FY2007: 1) a fast Henyey-Greenstein Mie lookup library was created<br />
to improve execution speed, <strong>and</strong> 2) a fully-polarimetric surface emission<br />
model based on WindSat satellite data <strong>and</strong> the OSU two-scale radiative<br />
transfer model was developed. These models have been delivered to the<br />
NOAA-NASA-DoD Joint Center for Satellite Data Assimilation, <strong>and</strong> are<br />
expected to be used with the JCSDA Community Radiative Transfer Model<br />
(CRTM). In addition, the DOTLRT Jacobian capabilities were incorporated<br />
within a precipitation-locking all-weather radiance assimilation algorithm to<br />
demonstrate for the first time all-weather microwave-radiance assimilation<br />
over precipitation. Results of running the locking algorithm over first frames<br />
of data indicate reasonable convergence of the radiance innovation field. The<br />
locking algorithm is being applied to the simulation of the short-term QPF<br />
performance of a geostationary microwave sounder.<br />
MILESTONE CET01.3:<br />
Demonstrate the potential for geostationary microwave imaging of precipitation using simulation<br />
experiments.<br />
ACCOMPLISHMENTS FOR CET01.3:<br />
Precise system simulations of the GEostationary Microwave (GEM) imager/sounder <strong>and</strong> the GeoSTAR synthetic<br />
thinned-aperture imaging radiometer have been studied within the context of the NOAA Geostationary Microwave<br />
Pathway study. The simulations use extensive 6-km MM5 simulations of Hurricane Bonnie at l<strong>and</strong>fall, <strong>and</strong> include<br />
five-phase precipitation microphysics <strong>and</strong> full scattering-based Jacobian calculations. The data illustrate – more<br />
accurately than any other simulation to date – what will be observed from the future GEM <strong>and</strong> GeoSTAR sensors.<br />
The results of the study have been presented at the World Meteorological Organization‘s IGeoLab series of<br />
workshops.<br />
25
<strong>Theme</strong> report: <strong>Advanced</strong> <strong>Modeling</strong> <strong>and</strong> <strong>Observing</strong> <strong>Systems</strong><br />
PSD08: Sensor <strong>and</strong> Technique Development<br />
GOALS:<br />
Design, develop, enhance <strong>and</strong> evaluate remote <strong>and</strong> in situ sensing systems for use from surface <strong>and</strong> other platforms<br />
of opportunity in order to measure critical atmospheric, surface, <strong>and</strong> oceanic parameters.<br />
MILESTONE PSD08.1:<br />
Continue construction of a roving calibration st<strong>and</strong>ard for ship flux measurements.<br />
ACCOMPLISHMENTS FOR PSD08.1:<br />
Considerable progress was made on developing the portable flux st<strong>and</strong>ard <strong>and</strong> implementing ship <strong>and</strong> buoy intercomparisons<br />
for quality assurance.<br />
Production of the roving flux st<strong>and</strong>ard is nearly complete. Researchers have upgraded one of the existing ESRL flux<br />
systems to create the portable st<strong>and</strong>ard (i.e., rather than build an entire new system from scratch). The upgrade<br />
features: 1) conversion from a network cabled sensors to wireless transmission <strong>and</strong> 2) improved radiative flux <strong>and</strong><br />
navigational measurements.<br />
Dr. Frank Bradley of CSIRO Canberra, Australia visited ESRL for a month in the spring of 2006 to work on the flux<br />
measurement h<strong>and</strong>book. Considerable progress was made <strong>and</strong> a draft was circulated among coauthors. The<br />
h<strong>and</strong>book has now been published as a NOAA Technical Memor<strong>and</strong>um<br />
(ftp://ftp.etl.noaa.gov/user/cfairall/wcrp_wgsf/flux_h<strong>and</strong>book/).<br />
A mostly complete prototype system was assembled <strong>and</strong> exhibited at the INMARTECH Symposium (Woods Hole<br />
Oceanographic Institution) in October 2006. A presentation was also made (―The NOAA Portable Seagoing Air-Sea<br />
Flux St<strong>and</strong>ard,‖ C.W. Fairall, S. Pezoa, L. Bariteau, <strong>and</strong> D.E. Wolfe). A complete seatainer-based system has now<br />
been assembled <strong>and</strong> is undergoing testing in Boulder.<br />
MILESTONE PSD08.2:<br />
Field test fast ozone sensor on Houston A/Q field program for ship-based ozone flux<br />
measurements.<br />
ACCOMPLISHMENTS FOR PSD08.2:<br />
A new ozone sensor was been built at INSTAAR (Detlev Helmig is leading the project). The system was deployed<br />
on the R/V Ronald H. Brown in the TexAQS field program in later summer 2006.<br />
AMOS-02: Data Management, Projects <strong>and</strong> Infrastructure <strong>Systems</strong><br />
NGDC01: Geospatial Technology for Global Integrated <strong>Observing</strong> <strong>and</strong> Data Management<br />
<strong>Systems</strong><br />
GOALS:<br />
Develop methods <strong>and</strong> processes for integrating multiple types of observations (e.g., gridded satellite products, <strong>and</strong><br />
in-situ measurements) using new Geographic Information System (GIS) data management <strong>and</strong> access tools; develop<br />
methods <strong>and</strong> processes for partnering with scientists to facilitate interoperability by producing metadata for<br />
scientific observations that are compliant with national FGDC (Federal Geographic Data Committee) <strong>and</strong><br />
international ISO (International St<strong>and</strong>ards Organization) st<strong>and</strong>ards; <strong>and</strong> create tools that allow the mining of vast<br />
environmental archives for the purpose of knowledge extraction, data quality control <strong>and</strong> trend detection.<br />
MILESTONE NGDC01.1:<br />
Increase access to environmental observations from Internet applications (Internet Mapping,<br />
Google Earth, etc.) using Open Geospatial Consortium st<strong>and</strong>ards <strong>and</strong> spatial databases.<br />
26
<strong>Theme</strong> report: <strong>Advanced</strong> <strong>Modeling</strong> <strong>and</strong> <strong>Observing</strong> <strong>Systems</strong><br />
ACCOMPLISHMENTS FOR NGDC01.1:<br />
NGDC is serving information about NOAA <strong>Observing</strong> <strong>Systems</strong> using the Open Geospatial Consortium Web Map<br />
Service. Between July 2006 <strong>and</strong> June 2007, the number of requests served grew by a factor of ten, to roughly 60,000<br />
requests/month. These data are also being served to Google Earth using static <strong>and</strong> dynamic KML.<br />
MILESTONE NGDC01.2:<br />
Integrate satellite granule metadata into spatial databases <strong>and</strong> Geographic Information <strong>Systems</strong>.<br />
ACCOMPLISHMENTS FOR NGDC01.2:<br />
During the last year, NGDC created tools for calculating <strong>and</strong> ingesting metadata for gridded NOAA Sea Surface<br />
Temperature data at three resolutions (14, 50, <strong>and</strong> 100 km) <strong>and</strong> tools for integrating NOAA satellite observations<br />
with in-situ observations. The second system involves roughly 1,000,000-point SST observations/day that are<br />
ingested into a spatial database <strong>and</strong> served on the web with a number of GIS tools.<br />
NGDC02: Marine Geophysics Data Stewardship<br />
GOALS:<br />
Contribute to a streamlined, more fully automated, accessible, <strong>and</strong> web-based management <strong>and</strong> stewardship process<br />
for Marine Geophysical data in support of seafloor research at CIRES <strong>and</strong> throughout the environmental science<br />
community.<br />
MILESTONE NGDC02.1:<br />
Add a generic set of Federal Geographic Data Committee (FGDC)–compliant metadata files for<br />
each survey in the Multibeam Bathymetric Data Base (MBBDB) at<br />
http://map.ngdc.noaa.gov/website/mgg/multibeam/viewer.htm, thereby improving the<br />
infrastructure for search <strong>and</strong> access of these data.<br />
ACCOMPLISHMENTS FOR NGDC02.1:<br />
FGDC compliant metadata files have been generated for most surveys in the NGDC MultiBeam Bathymetric Data<br />
Base (MBBDB). Users can access these metadata files directly from the search page or, if the data are downloaded,<br />
the metadata file is packaged automatically in the compressed delivery file. The MBBDB System is accessed<br />
through the web page: http://map.ngdc.noaa.gov/website/mgg/multibeam/viewer.htm.<br />
MILESTONE NGDC02.2:<br />
Search, target, <strong>and</strong> acquire multibeam data from the larger, worldwide oceanographic community.<br />
ACCOMPLISHMENTS FOR NGDC02.2:<br />
Researchers retrieved multibeam sonar survey data from various institutions. Data are assessed for quality, archived<br />
for long-term storage, <strong>and</strong> disseminated to the public through NGDC‘s MultiBeam Bathymetric Data Base<br />
(MBBDB).<br />
Lamont Doherty Earth Observatory 26<br />
University of New Hampshire CCOM 7<br />
University of South Florida 5<br />
Woods Hole Oceanographic Institution 3<br />
Scripps Institution of Oceanography 1<br />
U.S. Naval Oceanographic Office 15<br />
NOAA National Marine Fisheries Service 8<br />
NOAA Pacific Marine Environmental Laboratory 3<br />
Germany (Bundesamt fur Seeschiffahrt und Hydrographie 11<br />
Russia (University of Rhode Isl<strong>and</strong> edited) 2<br />
TOTAL 81<br />
Surveys received <strong>and</strong> placed on line between July 1, 2006 <strong>and</strong> June 30, 2007 by contributing institutions.<br />
27
<strong>Theme</strong> report: <strong>Advanced</strong> <strong>Modeling</strong> <strong>and</strong> <strong>Observing</strong> <strong>Systems</strong><br />
MILESTONE NGDC02.3:<br />
Implement an effective on-line, web-based data submission interface for multibeam bathymetry<br />
by which even a casual user will be able to submit data into the Multibeam Bathymetric Data<br />
Base (MBDDB).<br />
ACCOMPLISHMENTS FOR NGDC02.3:<br />
An online data submittal protocol <strong>and</strong> active web-link was developed<br />
(http://www.ngdc.noaa.gov/mgg/bathymetry/multibeam/MB_access.html) for user contributions of multibeam sonar<br />
data to the MBBDB. The system sends automated email notices after the metadata form is completed <strong>and</strong> then again<br />
after the data have been uploaded. This product has been used in test mode for most of the calendar year but went<br />
live on the MBBDB website in June. It has been used for external submission fewer than 10 times. Evaluation of<br />
ease of use, effectiveness, <strong>and</strong> desirability by clientele <strong>and</strong> colleagues will have to follow more extensive usage.<br />
SEC03: Information Technology <strong>and</strong> Data <strong>Systems</strong><br />
GOALS:<br />
Determine the necessary research data systems <strong>and</strong> infrastructure required to implement successfully the empirical<br />
<strong>and</strong> physical scientific models of the space environment such as those envisioned in SEC01 <strong>and</strong> SEC02 with fast <strong>and</strong><br />
efficient access to appropriate data sources.<br />
MILESTONE SEC03.1:<br />
Realign SEC data processing systems for better security <strong>and</strong> reliability. Identify <strong>and</strong> partition off<br />
National Critical <strong>Systems</strong> (NCS) from the rest of the IT infrastructure.<br />
ACCOMPLISHMENTS FOR SEC03.1:<br />
Project suspended indefinitely due to funding <strong>and</strong> priority changes.<br />
MILESTONE SEC03.2:<br />
Complete the phase-I migration of older <strong>and</strong> non-supported computing platforms to newer<br />
platforms. Complete <strong>and</strong> deploy SEC programmatic data subscription service. Complete <strong>and</strong><br />
deploy next generation SEC status monitor <strong>and</strong> develop a project plan for integrating existing<br />
applications to the new status monitor. Complete the next version of the data bridge server <strong>and</strong><br />
clients, in order to provide aggregate <strong>and</strong> atomic domain-name based data-retrieval, <strong>and</strong> autoswitching<br />
between main <strong>and</strong> warehouse data stores.<br />
ACCOMPLISHMENTS FOR SEC03.2:<br />
Phase-I completed, with first version of next generation SEC status monitor. Big Brother software used by the<br />
National Weather Service was used to anchor the new status monitor system, which now monitors all NCS systems<br />
for process health, network availability <strong>and</strong> up time. The Data Subscription Service project <strong>and</strong> next version of data<br />
bridge server <strong>and</strong> client projects were put on hold, <strong>and</strong> formally removed for the Phase-I effort.<br />
MILESTONE SEC03.3:<br />
Develop <strong>and</strong> deploy a secure <strong>and</strong> reliable data ingest, storage, processing <strong>and</strong> dissemination<br />
system for space weather data streams. Revise several existing applications to reduce<br />
complexity <strong>and</strong> increase reliability by integrating them with the new SEC shared services.<br />
ACCOMPLISHMENTS FOR SEC03.3:<br />
Development, testing <strong>and</strong> documentation for operational deployment of the NOAA/Boulder (TMO) Magnetometer<br />
Data Processor were completed. This process replaces an unreliable legacy system, <strong>and</strong> takes better advantage of<br />
new SEC shared services. Additionally, DMS to SWDS data set mapping were completed in an effort to migrate<br />
further from older DMS data storage system. Lastly, software utilities were developed to extract <strong>and</strong> transport daily<br />
GOES files from SWDS, <strong>and</strong> to identify data discrepancies. These utilities help to automate a largely manual <strong>and</strong><br />
error prone set of processes.<br />
28
<strong>Theme</strong> report: <strong>Advanced</strong> <strong>Modeling</strong> <strong>and</strong> <strong>Observing</strong> <strong>Systems</strong><br />
MILESTONE SEC03.4:<br />
Complete development of the GOES-N ground data systems IT infrastructure needed for postlaunch<br />
test. Provide analysis <strong>and</strong> technical support to algorithm development, instrument<br />
checkout <strong>and</strong> data verification.<br />
ACCOMPLISHMENTS FOR SEC03.4:<br />
Implementation of MRS&S clients, Network Data Bridges, Telemetry Archivers, SEM & SXI Preprocessors <strong>and</strong><br />
prototype framework for Level-1 image processing was completed in time for a post-launch test. Several<br />
improvements to the preprocessors were made in response to analysis of early post-launch test products. Finally,<br />
replay capabilities were implemented, allowing scientists to replay telemetry through enhanced processing<br />
algorithms, as they further developed their models.<br />
SEC04: Space Environment Data Algorithm <strong>and</strong> Product Development<br />
GOALS:<br />
Explore new techniques for analyzing <strong>and</strong> modeling GOES space environment data, <strong>and</strong> develop <strong>and</strong> validate new<br />
algorithms <strong>and</strong> products.<br />
MILESTONE SEC04.1:<br />
Assemble proxy data sets for the GOES-R instruments.<br />
ACCOMPLISHMENTS FOR SEC04.1:<br />
Proxy data for some of the GOES-R instruments have been created. The SEISS, MAG <strong>and</strong> XRS data sets are<br />
complete. Since there have been difficulties with the GOES-13 SXI <strong>and</strong> EUVS instruments, those data sets have not<br />
been collected. However, the use of other satellite data sets is being considered. Also, work is being done to make<br />
the GOES-13 data sets suitable for operational use as well as for test data sets for GOES-R.<br />
AMOS-03: Prediction, Model Development <strong>and</strong> Evaluation<br />
CSD02: Chemical Transport Model Research<br />
GOALS:<br />
Undertake research that contributes to the ability to forecast regional air quality <strong>and</strong> improves the underst<strong>and</strong>ing of<br />
the budget of ozone in the upper troposphere.<br />
MILESTONE CSD02.1:<br />
Use the forecast capabilities of current chemical transport models for the planning of the<br />
deployment of the R/V Ronald H. Brown, the WP-3, <strong>and</strong> other aircraft during the 2006 Texas Air<br />
Quality Study /Gulf of Mexico Atmospheric Composition <strong>and</strong> Climate Study experiment.<br />
ACCOMPLISHMENTS FOR CSD02.1:<br />
During the 2006 Texas Air Quality Study/Gulf of Mexico Atmospheric Composition <strong>and</strong> Climate Study experiment<br />
(TexAQS/GoMACCS), the FLEXPART particle dispersion model was run in forecast mode to provide pollutant<br />
tracer forecasts to guide the WP-3D aircraft <strong>and</strong> the R/V Ronald H. Brown into pollution plumes. The model was<br />
updated four times per day <strong>and</strong> utilized the 1×1 degree resolution windfields of NOAA NCEP‘s Global Forecast<br />
System model to yield five-day forecasts of CO, SO2 <strong>and</strong> NOx emissions from all North American anthropogenic<br />
sources. Special Houston-region tracers were also provided at higher resolution. In addition, a biomass-burning<br />
tracer, emitted from fire hotspots <strong>and</strong> sensed in near-real-time by MODIS, was calculated four times per day. The<br />
forecasts were made available to the mission planners in two on-line formats<br />
(http://www.esrl.noaa.gov/csd/metproducts/flexpart/index.html). The first format consisted of static GIF images of<br />
the tracers at various altitudes, with fixed map projections to provide a quick overview of the plume evolution over<br />
the following five days. The second, more useful format allowed the user to access an interactive web page <strong>and</strong><br />
create custom images <strong>and</strong> image loops of the various tracers for any location <strong>and</strong> any altitude. This forecast package<br />
provided accurate, timely, <strong>and</strong> easily accessible pollution-plume forecasts for the full duration of the<br />
29
<strong>Theme</strong> report: <strong>Advanced</strong> <strong>Modeling</strong> <strong>and</strong> <strong>Observing</strong> <strong>Systems</strong><br />
TexAQS/GoMACCS experiment, <strong>and</strong> can be easily modified to provide forecasts for future NOAA/CIRES field<br />
studies.<br />
MILESTONE CSD02.2:<br />
Gather remote-sensing observations during the 2006 Texas field study to investigate the<br />
capability of models to represent important boundary layer parameters.<br />
ACCOMPLISHMENTS FOR CSD02.2:<br />
Optical remote sensors were employed to gather information on ozone, aerosol, winds, turbulence <strong>and</strong> mixing<br />
during a six-week period in August <strong>and</strong> September as part of the Texas study. The TOPAZ airborne ozone lidar<br />
characterized ozone <strong>and</strong> aerosol distributions in the Houston <strong>and</strong> Dallas areas on 20 days during the period; data<br />
were obtained during approximately 70 flight hours. From the lidar measurements, boundary-layer backgroundozone<br />
concentrations, mixing-layer depths over different l<strong>and</strong> surfaces <strong>and</strong> water, <strong>and</strong> ozone flux in plumes<br />
downwind of Houston <strong>and</strong> Dallas were computed. Data from flights along the east Texas border were used to<br />
estimate ozone imported into Texas from Louisiana <strong>and</strong> its effect on pollution levels. Initial analysis indicates no<br />
obvious correlation between mixing-layer depths <strong>and</strong> ozone concentrations. Estimates of flux showed that the ozone<br />
exported from the Dallas-Fort Worth area was about one-third that observed downwind of Houston.<br />
During the same period, ozone <strong>and</strong> Doppler lidars were operated continuously from the R/V Ronald H. Brown in the<br />
Gulf of Mexico, Galveston Bay, <strong>and</strong> the Houston ship channel. The Doppler lidar provided high resolution profiles<br />
of horizontal wind speed <strong>and</strong> direction <strong>and</strong> vertical velocity speed <strong>and</strong> variance. From the vertical wind<br />
measurements, estimates of mixing strength <strong>and</strong> mixing-layer depth were computed <strong>and</strong> compared with in situ<br />
chemical <strong>and</strong> aerosol measurements on the ship as well as with the lidar-measured vertical profiles of ozone. Results<br />
indicate that several events characterized by downward mixing of upper-level aerosol were observed. Additionally,<br />
while in the ship channel, the lidar observed strong nocturnal low-level jet events that were associated with an<br />
observed absence of elevated pollution levels on subsequent days. The composite lidar observational set from the<br />
three instruments provide excellent data for comparison with model computations of ozone formation, transport, <strong>and</strong><br />
mixing processes in the southeastern Texas region.<br />
PSD09: Environmental Monitoring <strong>and</strong> Prediction<br />
GOALS:<br />
Improve numerical model performance through development of new data streams that directly impact forecast<br />
ability <strong>and</strong> through focused observational campaigns supporting geophysical process studies.<br />
MILESTONE PSD09.1:<br />
Develop inter-satellite bias correction <strong>and</strong> apply both diurnal sampling <strong>and</strong> inter-satellite bias<br />
corrections to the High-Resolution Radiation Sounder (HIRS) satellite radiances. Determine the<br />
impact these corrections have on the radiances by comparing with HIRS simulated radiances<br />
from the GFDL climate model.<br />
ACCOMPLISHMENTS FOR PSD09.1:<br />
Corrections to the HIRS/2 satellite observations were developed to eliminate sampling errors due to orbital drift,<br />
diurnal differences between satellites, <strong>and</strong> instrument bias inherent to each satellite. Climate model simulations of<br />
HIRS observations were used to predict <strong>and</strong> correct the local time drift of HIRS observations for all of the satellites.<br />
Diurnal differences between satellite observations were corrected to have all ascending orbits to a 1930 LST<br />
observation, <strong>and</strong> all descending orbits were corrected to a 0730 LST observation time. Inter-satellite biases due to<br />
instrument bias for HIRS brightness temperatures for channels 2 through 12 were corrected to NOAA-10 HIRS<br />
observations. A final set of corrected HIRS clear-sky brightness temperature data has been compiled over a 26-year<br />
period (1979-2004) <strong>and</strong> is now being used to compare trends in clear-sky greenhouse gas trapping in climate model<br />
simulations. Other studies planned for these data include comparing trends between climate model OLR <strong>and</strong> HIRSderived<br />
OLR <strong>and</strong> spatial trends in CO2.<br />
30
GSD01: Numerical Weather Prediction<br />
<strong>Theme</strong> report: <strong>Advanced</strong> <strong>Modeling</strong> <strong>and</strong> <strong>Observing</strong> <strong>Systems</strong><br />
GOAL:<br />
Design <strong>and</strong> evaluate new approaches for improving regional-scale numerical weather forecasts, including forecasts<br />
of severe weather events.<br />
MILESTONE GSD01.1:<br />
Begin one-hour cycling of initial version of the North American Rapid Refresh using GSI <strong>and</strong> the<br />
chosen configuration of the WRF model.<br />
ACCOMPLISHMENTS FOR GSD01.1:<br />
The current Rapid Update Cycle model <strong>and</strong> assimilation system, covering the coterminous United States <strong>and</strong><br />
adjacent areas of Canada, Mexico <strong>and</strong> the Pacific <strong>and</strong> Atlantic Oceans as well as the Gulf of Mexico <strong>and</strong> a portion of<br />
the Caribbean Sea (see figure below), is scheduled to be replaced by the so-called ―Rapid Refresh‖ in 2009. The<br />
purpose of the Rapid Refresh is the same as the RUC, to provide a ―situation awareness‖ framework for forecasters<br />
by providing very frequently updated analyses <strong>and</strong> very short-range numerical model forecasts. The figure also<br />
shows the domain of the Rapid Refresh, which is about 2.6 times larger than the RUC domain <strong>and</strong> covers nearly all<br />
of North America, including mainl<strong>and</strong> Alaska, as well as most of the Caribbean Sea.<br />
31<br />
In addition to the larger domain, the hydrostatic<br />
hybrid-isentropic coordinate RUC model will be<br />
replaced by a version of the WRF model, <strong>and</strong> the<br />
present RUC 3dVAR analysis scheme will be<br />
replaced by the Gridpoint Statistical Interpolation<br />
(GSI) 3dVAR analysis scheme, which is under<br />
continued development by NCEP <strong>and</strong> NASA<br />
Goddard.<br />
Work toward a cycling prototype Rapid Refresh<br />
(RR) was an important focus of activity during the<br />
2006-2007 period, particularly after the completion<br />
of the RR Core Test in August. Due to a severalmonth<br />
delay in availability of ESRL‘s new<br />
supercomputer, <strong>and</strong> the need for ongoing testing of<br />
important upgrades to the Rapid Update Cycle,<br />
researchers had to make some compromises to the<br />
scope of the efforts toward the Rapid Refresh to<br />
accommodate the available computing resources.<br />
This was done initially by instituting twelve-hour<br />
cycling of the WRF-ARW using GSI on the<br />
CONUS RR Core-Test domain, slightly smaller<br />
than the present operational RUC CONUS domain shown in the figure. However, the version of GSI used in this<br />
cycling has been without RUC enhancements to GSI, which are considered desirable for effective hourly cycling,<br />
including special treatment of surface observations to spread surface information vertically when the one-hour<br />
forecast background has an identifiable surface-based mixed layer. In order to begin to get experience running on<br />
the whole North American RR domain with GSI <strong>and</strong> WRF, a run covering this whole domain was set up with 13-km<br />
grid spacing on ESRL‘s older computer, <strong>and</strong> cycling was once per twelve hours. This has been running for several<br />
months now. Although results have been acceptable, they are far inferior to those that could be achieved using onehour<br />
cycling. Once the new computer became available in early 2007, continued problems with its file system,<br />
which were revealed by the GSI code when it attempted to write to multiple nodes in parallel, slowed progress<br />
further while those problems were diagnosed <strong>and</strong> fixed. Although the pieces are now mostly in place for one-hour<br />
cycling over the full RR domain, this cycling had not yet begun as of June 2007.<br />
A further requirement for running a WRF-based Rapid-Refresh one-hour cycle is to have a capability for digital<br />
filter initialization in the WRF model. This is necessary to reduce fast-mode noise in the one-hour WRF forecast<br />
used as background by the GSI 3dVAR analysis. However, the developers of WRF did not explicitly provide for
<strong>Theme</strong> report: <strong>Advanced</strong> <strong>Modeling</strong> <strong>and</strong> <strong>Observing</strong> <strong>Systems</strong><br />
running the model backwards in time, as is required for the DFI, so considerable development effort has been<br />
necessary. Such a capability was, in fact, developed in 2005 for WRF v2.1. Work to extend this capability to WRF<br />
v2.2 has turned out to be decidedly nontrivial, but it is progressing.<br />
MILESTONE GSD01.2:<br />
Incorporate enhancements to Gridpoint Statistical Interpolation (GSI) code to improve use of<br />
surface weather observations (METARs) <strong>and</strong> introduce GSD-developed procedures into GSI to<br />
incorporate three-dimensional, high-frequency National Weather Service WSR-88D radar data in<br />
the initialization of cloud <strong>and</strong> precipitation hydrometeors.<br />
ACCOMPLISHMENTS FOR GSD01.2:<br />
Work on GSI at GSD was begun in 2005. After some very basic code adjustments, work started to concentrate on<br />
features important for RR applications, particularly those required for one-hour cycling <strong>and</strong> assimilation of<br />
hydrometeors. (GSI has heretofore been used only with models cycling every six hours <strong>and</strong> without assimilation of<br />
hydrometeor information.) The two most important of these features are usage of surface observations, including<br />
ceiling height <strong>and</strong> present weather, <strong>and</strong> analysis of hydrometeors.<br />
One of the strengths of the present Rapid Update Cycle (RUC) is the h<strong>and</strong>ling of surface data in the RUC analysis.<br />
The difference between the surface observation of virtual potential temperature, water-vapor mixing ratio <strong>and</strong><br />
horizontal wind components <strong>and</strong> the one-hour background forecast of these quantities is spread vertically through<br />
the mixed-layer (but only if there is such a mixed-layer) in the one-hour background forecast by generating ―pseudoobservations‖<br />
within the mixed-layer, but not above. For the time being, a different approach is taken in the GSI,<br />
using anisotropic background error covariance information in an adaptive way. The premise is to apply the PBL<br />
depth of the background forecast as computed in the present RUC <strong>and</strong> use this to constrain the scale of vertical<br />
correlation in the background error. This approach is combined with a model for anisotropic background error<br />
developed <strong>and</strong> implemented in GSI by NCEP. The present code employs the background virtual potential<br />
temperature when computing the vertical correlation of background error. Present work is directed toward<br />
introduction <strong>and</strong> intense testing of this approach in the real-time one-hour RR cycle soon to begin on the new ESRL<br />
supercomputer (see Milestone GSD01.1).<br />
The existing operational RUC cloud analysis is done outside the variational framework of the RUC 3dVAR. It uses<br />
NESDIS cloud products (cloud top pressure <strong>and</strong> temperature) <strong>and</strong> METARs to decide the location of cloud top <strong>and</strong><br />
clear area <strong>and</strong> then adds a thin layer of cloud under the cloud top <strong>and</strong> clears the column above cloud top. (The whole<br />
column is cleared of hydrometeors if the column is identified as being clear by the RUC cloud analysis.)<br />
Versions of GSI released by NCEP have yet to incorporate any cloud analysis procedures. Therefore, an enhanced<br />
version of the existing RUC cloud-analysis procedure within the GSI software framework was incorporated, but as<br />
with RUC, outside the variational parts of the code. A systematic approach toward introducing the RUC cloud<br />
analysis into GSI has been pursued, including a) building onto the GSI framework to accommodate the cloud<br />
analysis, b) ingesting cloud observations, c) building the cloud analysis driver, <strong>and</strong> d) incorporating RUC cloud<br />
analysis into GSI. All the programming work has been finished including parallelization of the cloud-analysis code.<br />
Preliminary results show successful performance. The code will be further tested in the real time RR cycle.<br />
A new procedure for assimilation of three-dimensional high-frequency National Weather Service WSR-88D radar<br />
data is being tested in real-time RUC cycles at GSD. Briefly summarized, this procedure uses the 1-km Q2 Mosaic<br />
radar-reflectivity product developed at the National Severe Storms Lab of NOAA, plus some additional quality<br />
control, to identify volumes of the atmosphere having radar reflectivity due to hydrometeors. In areas where radar<br />
data are absent, lightning is used to identify volumes likely to possess hydrometeors. The procedure also identifies<br />
areas where the one-hour background forecast has hydrometeors that do not exist in reality. In order to render the<br />
initial mass <strong>and</strong> momentum fields more consistent with these implied hydrometeor fields, the diabatic digital filter<br />
initialization is employed. After the initial adiabatic backward stage of the DFI, there follows the diabatic forward<br />
step. During this forward step, the potential temperature tendencies from the microphysics <strong>and</strong> convection<br />
parameterization schemes are replaced by tendencies specified based on the mixing ratios of the hydrometeors. In<br />
this way an initial divergent component of the wind field is introduced that has some measure of consistency with<br />
the hydrometeor fields <strong>and</strong> allows a much improved forecast of precipitation through the first three to six hours of<br />
the model forecast. Introduction of this procedure into the RR cycling later this year is planned, once a version of<br />
32
<strong>Theme</strong> report: <strong>Advanced</strong> <strong>Modeling</strong> <strong>and</strong> <strong>Observing</strong> <strong>Systems</strong><br />
WRF with a diabatic digital filter initialization is developed. This will thus be implemented, at least initially, outside<br />
the GSI framework.<br />
GSD03: Verification Techniques for the Evaluation of Aviation Weather Forecasts<br />
GOAL:<br />
Design <strong>and</strong> evaluate new verification approaches <strong>and</strong> tools that will provide information about the quality of<br />
aviation forecasts <strong>and</strong> their value to aviation decision makers.<br />
MILESTONE GSD03.1:<br />
Participate in the redesign of the Real-Time Verification System (RTVS) by enhancing the<br />
functionality of the database, web-interface, <strong>and</strong> real-time processing modules of the system to<br />
support verification of aviation parameters, such as icing, turbulence, <strong>and</strong> convective weather.<br />
ACCOMPLISHMENTS FOR GSD03.1:<br />
Upgrades to the turbulence <strong>and</strong> icing verification modules were added to the RTVS operations, <strong>and</strong> researchers<br />
participated in the development of the conceptual design for the reengineered RTVS.<br />
MILESTONE GSD03.2:<br />
Investigate <strong>and</strong> develop new verification techniques for evaluating the accuracy of convective<br />
echo tops, high resolution automated convective probabilistic forecasts, <strong>and</strong> ceiling <strong>and</strong> visibility<br />
forecast lead times.<br />
ACCOMPLISHMENTS FOR GSD03.2:<br />
A Terminal Aerodrome Forecast (TAF) lead-time metric <strong>and</strong> a prototype web interface for access to the TAF leadtime<br />
metric statistics <strong>and</strong> diagnostic analysis capabilities were developed. These capabilities were demonstrated to<br />
NWS HQ staff.<br />
The capability to evaluate convective echo top forecasts was added to the RTVS. Statistics are being used this<br />
season to evaluate forecast accuracy.<br />
An ―audit trail‖ verification capability was developed within RTVS to track the forecast quality of operationally<br />
significant convective weather forecasts.<br />
A user-based verification technique for evaluating convective forecasts was developed. This technique incorporates<br />
strategic decision points, operational flight sectors, <strong>and</strong> high-impact weather events.<br />
MILESTONE GSD03.3:<br />
Summarize results from statistical evaluations of turbulence <strong>and</strong> convective weather forecasts in<br />
written reports.<br />
ACCOMPLISHMENTS FOR GSD03.3:<br />
The statistical generation, analysis of results, <strong>and</strong> writing of the following reports were developed:<br />
Forecast Icing Product (FIP) Calibration study<br />
Graphical Turbulence Guidance version 2 supplemental report<br />
Monthly summary report for the Collaborative Convective Forecast Product.<br />
Analysis of results for the National Ceiling <strong>and</strong> Visibility Analysis product was also completed.<br />
NGDC03: Space Weather<br />
GOAL:<br />
Assess the current state of the space environment from the surface of the sun to the upper atmosphere; use datadriven<br />
physical models to construct a realistic <strong>and</strong> authoritative gridded database of the space environment; <strong>and</strong><br />
place that description into its long-term climatological perspective.<br />
33
<strong>Theme</strong> report: <strong>Advanced</strong> <strong>Modeling</strong> <strong>and</strong> <strong>Observing</strong> <strong>Systems</strong><br />
MILESTONE NGDC03.1:<br />
Develop space weather climatological products using the Space Weather Analysis database.<br />
ACCOMPLISHMENTS FOR NGDC03.1:<br />
CIRES personnel working with scientists from within the NGDC space environment have completed <strong>and</strong> delivered a<br />
fifteen-year, near-Earth, space climatology to the Air <strong>and</strong> Space Natural Environment Program Office at the USAF<br />
Combat Climatology Center (AFCCC) in Ashville, NC. The objective of the Space Weather Analysis (SWA) was to<br />
generate a long-term space weather representation using physically consistent data-driven space weather models.<br />
The SWA project has created a consistent <strong>and</strong> integrated historical record of the near-Earth environment by coupling<br />
observational data from space environment monitoring systems archived at NGDC with data-driven, physically<br />
based numerical models. The resulting product is an enhanced look at the space environment on consistent grids,<br />
time resolution, coordinate systems <strong>and</strong> containing key fields allowing a user to incorporate quickly <strong>and</strong> easily the<br />
impact of near-Earth space climate in environmentally sensitive models.<br />
In order to generate this fifteen-year climatology, several well recognized models of the near-Earth space<br />
environment were computationally linked <strong>and</strong> run self-consistently. The Assimilative Model of Ionospheric<br />
Electrodynamics (AMIE) [Richmond et al., J. Geophys. Res., 1988] was used to calculate ionospheric conductances,<br />
high-latitude electric fields <strong>and</strong> other ionospheric parameters of interest. Electric potential patterns created by AMIE<br />
were then used as drivers in a Simple Inner Magnetosphere Model (SIMM) [T. Garner, Thesis, Rice Univ, 2000] to<br />
describe the dynamic magnetosphere. Coupling <strong>and</strong> feedback between the ionosphere <strong>and</strong> the background<br />
thermosphere were provided by the Global Ionosphere-Thermosphere Model (GITM) [Ridley et al, J. Geophys.<br />
Res., 2005]. These three models, each of which has a well-established legacy in space research, when selfconsistently<br />
coupled provide realistic space weather climatology of interest to the operational <strong>and</strong> research<br />
communities. An example of the SWA output is provided in the figure below.<br />
Prior to the SWA program, there were no long-term climate archives available for the space weather environment.<br />
Military planners use this SWA database to specify long-term climate changes that can potentially impact military<br />
operations. NOAA personnel, for their part, are using this multi-year space weather climatology database for<br />
scientific/research applications. SWA also provides the foundation for future space weather research by providing a<br />
means for scientists to assimilate model output in advanced modeling techniques.<br />
MILESTONE NGDC03.2:<br />
Publish project results via web <strong>and</strong> integrate them with ongoing research projects.<br />
ACCOMPLISHMENTS FOR NGDC03.2:<br />
The SWA database has been made available through the web via the NOAA Space Physics Interactive Data<br />
Resource (SPIDR). The results of the SWA project have been presented at recent international meetings, including<br />
the Fall ‗06 AGU <strong>and</strong> the annual Space Weather Workshop. The model output is now available to the scientific<br />
community for use with ongoing research projects. A typical visual output of the database is a specification of the<br />
34
<strong>Theme</strong> report: <strong>Advanced</strong> <strong>Modeling</strong> <strong>and</strong> <strong>Observing</strong> <strong>Systems</strong><br />
high-latitude electric potential pattern, as shown in the figure at<br />
left. Comparisons to actual spacecraft measurements of electric<br />
fields <strong>and</strong> other parameters can be easily done for specific times<br />
within the data set history. A one-year comparison of the SIMM<br />
model to climatology <strong>and</strong> spacecraft measurement was recently<br />
completed, <strong>and</strong> the results of this comparison are now being<br />
prepared for publication.<br />
The SWA products can be viewed through SPIDR at<br />
http://www.spidr.ngdc.noaa.gov.<br />
MILESTONE NGDC03.3:<br />
Develop the Virtual Radiation Belt Observatory. Convert the real-time ionosonde network to a<br />
single architecture to better support operations.<br />
ACCOMPLISHMENTS FOR NGDC03.3:<br />
Several Virtual Observatories (VOs) have recently been formed to assemble <strong>and</strong> normalize disparate databases <strong>and</strong><br />
to facilitate scientific research by providing st<strong>and</strong>ardized analysis tools. CIRES personnel within NGDC have<br />
contributed to the development of the Virtual Radiation Belt Observatory (ViRBO) as an interactive resource for<br />
researchers to access relevant data sets <strong>and</strong> model output. ViRBO also provides a mechanism for communication<br />
35
<strong>Theme</strong> report: <strong>Advanced</strong> <strong>Modeling</strong> <strong>and</strong> <strong>Observing</strong> <strong>Systems</strong><br />
<strong>and</strong> planning among researchers in the field of radiation belt modeling. Data made available through ViRBO is<br />
archived <strong>and</strong> managed by NGDC. Funding for ViRBO is provided by NASA <strong>and</strong> the tools under development<br />
within this VO are planned for implementation at other NASA virtual observatories.<br />
We have converted the real-time ionosonde network to a single<br />
architecture known as MIRRION, the Mirrored Ionosonde database.<br />
MIRRION supports Space Weather Operations at the Space<br />
Environment Center (SEC) <strong>and</strong> at the Air Force Weather Agency<br />
(AFWA). MIRRION ingests data when it becomes available by the<br />
data provider <strong>and</strong> is quickly processed <strong>and</strong> made available to<br />
modeling operations. One example of an operational model<br />
supported by MIRRION is the Global Atmosphere Ionosphere<br />
Model (GAIM), which is run at the SEC in Boulder.<br />
VIRBO can be viewed through the VIRBO website at<br />
http://virbo.org/<br />
SEC01: Solar Disturbances in the Geospace Environment<br />
GOAL:<br />
Improve the prediction of traveling solar disturbances that impact the geospace environment. Such disturbances,<br />
which are associated with both coronal holes <strong>and</strong> coronal mass ejections (CMEs) from the Sun, can cause<br />
substantial geomagnetic effects leading to the crippling of satellites, disruption of radio communications, <strong>and</strong><br />
damage to electric power grids.<br />
MILESTONE SEC01.1:<br />
Calibrate GOES X-ray Instrument: Use selected solar observations <strong>and</strong> 2005 rocket underflight<br />
data.<br />
ACCOMPLISHMENTS FOR SEC01.1:<br />
The Solar X-ray Imager (SXI) <strong>and</strong> disk-integrated X-ray Sensor (XRS) instruments currently flying are undergoing<br />
a sounding rocket ―underflight‖ calibration with the Avalanche X-ray Spectrometer (AXS), which made solar<br />
observations simultaneously with the GOES instruments. An example SXI image is shown below. The AXS<br />
measurements provide the reference or ―solar truth‖ that will be compared to the response functions of the GOES<br />
instruments. CIRES scientists have developed a forward model that takes the AXS spectrum <strong>and</strong> accounts for each<br />
element of the SXI instrument, including the pre-filter,<br />
mirror, <strong>and</strong> analysis filter. The results from this forward<br />
model have been compared to the observed SXI total<br />
intensity, <strong>and</strong> a similar forward model comparison has<br />
been done for the XRS instrument. The results match<br />
the XRS measurements well but show a discrepancy for<br />
SXI <strong>and</strong> they are currently working to resolve this<br />
discrepancy. Once that is complete, noise,<br />
contaminating signals, <strong>and</strong> secondary effects like<br />
vignetting will be investigated. Along with this effort,<br />
researchers will parameterize instrument models <strong>and</strong><br />
adjust those parameters to obtain the best fit to the<br />
observations. Applying these models will improve<br />
knowledge of SXI <strong>and</strong> XRS instrument response <strong>and</strong><br />
the improved measurements will be beneficial to space<br />
weather forecasting.<br />
36
<strong>Theme</strong> report: <strong>Advanced</strong> <strong>Modeling</strong> <strong>and</strong> <strong>Observing</strong> <strong>Systems</strong><br />
MILESTONE SEC01.2:<br />
Global Solar Wind Predictions: Improve the SEC predictions system based on the Wang-<br />
Sheeley-Arge source-surface model, as coupled into a 3-D MHD propagation model, through<br />
advanced post-processing of input data.<br />
ACCOMPLISHMENTS FOR SEC01.2:<br />
The following accomplishments were achieved: (1) improved line-saturation correction for Mount Wilson<br />
Observatory magnetograms (2) a generic automated version of the Wang-Sheeley-Arge (WSA) model for<br />
distribution (3) a method to create synoptic maps from Mount Wilson Observatory magnetograms, <strong>and</strong> (4)<br />
automated verification program to check output of WSA code when distributed to other systems. The Mount Wilson<br />
<strong>and</strong> Wilcox Solar Observatories are now able to be run with the WSA model, which is now working at the<br />
Community Coordinated <strong>Modeling</strong> Center (CCMC) at NASA/GSFC. The improved WSA model was provided to<br />
the Center for Integrated Space Weather <strong>Modeling</strong> (CISM) at Boston University for validation studies. Finally, the<br />
daily running of coupled WSA-ENLIL model at NOAA/SEC was automated.<br />
Predicted solar wind velocity at Earth.<br />
MILESTONE SEC01.3:<br />
Coronal Mass Ejection (CME) Locator: Develop <strong>and</strong> implement a fully operational version of the<br />
CME Locator based on white-light corona observations from the NASA STEREO mission.<br />
ACCOMPLISHMENTS FOR SEC01.3:<br />
The aim of this project is to develop, test, <strong>and</strong> implement methods <strong>and</strong> forecast tools for the analysis of data from the<br />
NASA/STEREO spacecraft mission, which was launched on Oct 26, 2006. The primary tool is a geometric<br />
localization technique developed by Pizzo <strong>and</strong> Biesecker [2004] for determining in near-real-time the position,<br />
shape, <strong>and</strong> speed of coronal mass ejections (CMEs) using STEREO coronagraph observations. CIRES researchers<br />
have tested the ability of the geometric localization technique to estimate the speed, acceleration, <strong>and</strong> direction of<br />
propagation of simulated CMEs. Thus far, the results are very encouraging.<br />
MILESTONE SEC01.4:<br />
EIT (Extreme ultraviolet Imaging Telescope) waves <strong>and</strong> dimmings: Compare EUV dimming<br />
properties (intensity, solar location, <strong>and</strong> mass) with associated CME properties.<br />
ACCOMPLISHMENTS FOR SEC01.4:<br />
Coronal dimmings are a phenomenon frequently associated with CMEs (coronal mass ejections). Below are shown<br />
two examples of dimming events, the left one in the center of the solar disk <strong>and</strong> the right one on the solar limb.<br />
Dimmings can vary in size, shape <strong>and</strong> intensity, with observations suggesting a relationship between the mass loss<br />
from the dimming region <strong>and</strong> the mass contained within the CME. Researchers are conducting a statistical analysis<br />
of CME-associated dimming regions observed with the EIT (Extreme ultraviolet Imaging Telescope) on board the<br />
SOHO (Solar <strong>and</strong> Heliospheric Observatory) spacecraft. In this analysis, researchers first determine the relative<br />
dimming of each event compared to a pre-event image <strong>and</strong> then determine the area <strong>and</strong> intensity of each dimming.<br />
This has been done for more than 100 events <strong>and</strong> the statistics now exist to determine some general characteristics of<br />
37
<strong>Theme</strong> report: <strong>Advanced</strong> <strong>Modeling</strong> <strong>and</strong> <strong>Observing</strong> <strong>Systems</strong><br />
dimming events. For example, it was discovered that the average duration of a dimming event is 7.4 ± 4.0 hours.<br />
This duration can be divided into a depletion time of two to three hours <strong>and</strong> a recovery time of four to five hours.<br />
These results have been included in a paper that was submitted to the Astrophysical Journal. This analysis is now<br />
being extended to CME-related characteristics. The results from this study continue to provide insight into CME<br />
origins <strong>and</strong> may help improve predictions of CME-related parameters.<br />
SEC02: <strong>Modeling</strong> the Upper Atmosphere<br />
38<br />
Two examples of dimming events, the<br />
left one in the center of the solar disk<br />
<strong>and</strong> the right one on the solar limb.<br />
GOAL:<br />
Underst<strong>and</strong> responses of the upper atmosphere to solar, magnetospheric, <strong>and</strong> lower atmosphere forcing, <strong>and</strong> the<br />
coupling between the neighboring regions. Since many of the space weather effects occur in the ionosphere <strong>and</strong><br />
neutral upper atmosphere, it is important to develop an underst<strong>and</strong>ing of the system to the point where accurate<br />
specification <strong>and</strong> forecasts can be achieved.<br />
MILESTONE SEC02.1:<br />
Include the upper atmosphere physical processes into the Integrated Dynamics through Earth’s<br />
Atmosphere (IDEA) model, <strong>and</strong> establish the structure to integrate the ionosphere-plasmasphereelectrodynamics<br />
(IPE) module.<br />
ACCOMPLISHMENTS FOR SEC02.1:<br />
The coupled general circulation model (GCM) of Integrated Dynamics through Earth‘s Atmosphere (IDEA) consists<br />
of two interacting models (Figure 1): the Whole Atmosphere Model (WAM) <strong>and</strong> the Global Ionosphere-<br />
Plasmasphere (GIP) model. The Whole<br />
Atmosphere Model is a GCM for the neutral<br />
atmosphere built on an existing operational<br />
Global Forecast System (GFS) model used by<br />
the U.S. National Weather Service (NWS) for<br />
medium-range weather prediction.<br />
To create WAM, the spectral dynamical core<br />
of the GFS code has been extended to 150<br />
layers with the top pressure level near a<br />
nominal altitude of about 600 km <strong>and</strong> the layer<br />
thickness approaching a quarter scale height in<br />
the stratosphere <strong>and</strong> above. The experimental<br />
version of the model is typically run at a<br />
relatively moderate spectral resolution T62<br />
(roughly 1.8×1.8 degrees in latitudelongitude),<br />
but the horizontal resolution <strong>and</strong><br />
vertical spacing may be easily changed if<br />
necessary.<br />
Figure 1. A schematic of the coupled general circulation model of<br />
Integrated Dynamics through Earth’s Atmosphere.
<strong>Theme</strong> report: <strong>Advanced</strong> <strong>Modeling</strong> <strong>and</strong> <strong>Observing</strong> <strong>Systems</strong><br />
The vertical extension of the model domain has required the incorporation of additional physical processes <strong>and</strong><br />
substantial changes in the dynamical core <strong>and</strong> in its interface with the model physics. As is well known in upperatmospheric<br />
modeling, temporal <strong>and</strong> spatial variations of specific heat along air parcel trajectories have to be<br />
explicitly accounted for in the energy equation to represent correctly the effects of a highly variable thermospheric<br />
composition. These variations are commonly not accounted for in lower-atmospheric GCMs, <strong>and</strong> instead rely on the<br />
approximation of ―virtual temperature‖ <strong>and</strong> assume that the composition deviations from the uniform ―dry air,‖<br />
primarily caused by the presence of water vapor, are small. A new spectral model formulation has been developed<br />
<strong>and</strong> implemented in the GFS, using specific enthalpy cpT, where cp is specific heat at constant pressure <strong>and</strong> T is<br />
temperature, as a prognostic variable instead of the traditional virtual temperature.<br />
Molecular dissipative processes such as viscosity, heat conduction, <strong>and</strong> diffusion become so fast in the upper<br />
thermosphere that they can no longer be treated within the st<strong>and</strong>ard vertical-column interface. Horizontal molecular<br />
transport of momentum, heat, <strong>and</strong> constituents along pressure surfaces have been incorporated into the model as<br />
well. This physical dissipation eliminates the need for excessive numerical damping commonly used to stabilize<br />
numerical models in vertically extended domains. Additional physical processes incorporated in the extended model<br />
domain include UV <strong>and</strong> EUV radiative heating, infrared radiative cooling with the breakdown of local<br />
thermodynamic equilibrium, <strong>and</strong> non-orographic gravity waves. In the normal fully-coupled configuration ion drag,<br />
Joule <strong>and</strong> particle heating are calculated self-consistently within GIP. In a st<strong>and</strong>-alone WAM, these processes can be<br />
parameterized using an empirical ionosphere model.<br />
Global Ionosphere Plasmasphere (GIP) model <strong>and</strong> electrodynamics. The plasma processes required in IDEA are<br />
provided by the Global Ionosphere<br />
Plasmasphere (GIP) module, which includes<br />
a self-consistent global electrodynamic<br />
solver. GIP was developed by extracting the<br />
plasma processes embedded in the Coupled<br />
Thermosphere Ionosphere Plasmasphere<br />
electrodynamics (CTIPe) model. In earlier<br />
versions of CTIPe, the Earth‘s magnetic<br />
field was assumed to be a tilted dipole. In<br />
reality, however, the low-latitude<br />
geomagnetic field departs from the dipole<br />
equator by more than ten degrees over the<br />
Atlantic Ocean <strong>and</strong> Africa. Furthermore,<br />
ionospheric dynamo electric fields depend<br />
on the strength of the magnetic field, since<br />
the wind-driven currents depend on the<br />
field-line integration of the ionospheric<br />
conductivity <strong>and</strong> neutral wind.<br />
Figure 2. Wavelet amplitude spectrum of zonal wavenumber 2<br />
oscillation in the WAM zonal wind at 20 S <strong>and</strong> 110 km altitude as a<br />
function of period <strong>and</strong> day number in March <strong>and</strong> April.<br />
GIP now explicitly includes the International Geomagnetic Reference Field (IGRF), an accurate representation of<br />
the Earth‘s magnetic field, in order to introduce true longitude dependence. The global ionospheric dynamics <strong>and</strong><br />
energetics are solved in the magnetic APEX coordinate system. GIP receives the neutral atmosphere fields from<br />
WAM, computes the Joule heating, ion-drag, <strong>and</strong> auroral particle heating <strong>and</strong> passes these parameters back to<br />
WAM. The neutral <strong>and</strong> plasma domains are completely self-consistent <strong>and</strong> interactive.<br />
Self-consistent coupling between the WAM <strong>and</strong> GIP is completed by solving the global electrodynamics <strong>and</strong> by<br />
feeding the electric fields back into GIP. The electric fields are computed using a global potential solver in the same<br />
APEX coordinate system. The electrodynamics module receives the dynamics from WAM <strong>and</strong> the field-aligned<br />
conductivities from GIP, computes the electric fields, <strong>and</strong> provides the information back to both modules. The<br />
resultant ionospheric dynamo electric fields reflect the forcing from the lower atmosphere <strong>and</strong> realistic ionospheric<br />
structure through the use of the IGRF.<br />
Early results from WAM provide the first confirmation that the model is capable of realistically reproducing the<br />
dynamics <strong>and</strong> variability in the upper atmosphere, <strong>and</strong> that terrestrial weather features can affect the thermosphere-<br />
39
<strong>Theme</strong> report: <strong>Advanced</strong> <strong>Modeling</strong> <strong>and</strong> <strong>Observing</strong> <strong>Systems</strong><br />
ionosphere system. The characteristic periodicities of planetary normal modes of about two, five, eleven <strong>and</strong> sixteen<br />
days seen in the ionospheric observations are clearly present in the WAM middle <strong>and</strong> upper atmosphere.<br />
MILESTONE SEC02.2:<br />
Exp<strong>and</strong> the input data network for the US-TEC data assimilation scheme to include Canadian<br />
stations.<br />
ACCOMPLISHMENTS FOR SEC02.2:<br />
The Space Environment Center (SEC) <strong>and</strong> CIRES recently transitioned to a new regional data assimilation product<br />
designed to specify the vertical <strong>and</strong> slant total electron content (TEC) over the contiguous United States (CONUS)<br />
in real-time (see Figure 1, right). The model is based on<br />
a Kalman filter <strong>and</strong> ingests ground-based, dual<br />
frequency, GPS receiver measurements from various<br />
networks. The product was developed in collaboration<br />
between the National Geodetic Survey (NGS), the<br />
National Geophysical Data Center (NGDC), <strong>and</strong> the<br />
Global <strong>Systems</strong> Division (GSD) within ESRL.<br />
Earlier versions of the product relied solely on the<br />
stations that were available in real-time from the<br />
network of ground-based, dual-frequency, GPS<br />
receivers operated by the U.S. Coast Guard for the<br />
National Differential GPS Service (NDGPS). The<br />
NDGPS system has twin GPS receivers currently<br />
operating at approximately 80 stations across the<br />
CONUS, which are streamed into SEC via NGDC.<br />
These data are also part of the Continuously Operating<br />
Reference Station (CORS) network, which comprise approximately 1000 stations that are used by NGS for geodetic<br />
application. To improve the accuracy of the U.S.-TEC product, two new real-time networks have been added to the<br />
data stream. The first is the GPS receiver network operated by GSD, for the GPS-MET project, which is designed to<br />
characterize water vapor over the CONUS in real-time. These same GPS stations can also be used for space weather<br />
applications <strong>and</strong> serve to fill areas of sparse data coverage in the NDGPS Coast Guard network. A third GPS<br />
network has also been added to the U.S.-TEC ingest data stream from the International GNSS Service (IGS). The<br />
IGS stations include stations in Canada, which improves the accuracy of the product towards the northern boarders<br />
of the CONUS.<br />
An illustration of the data coverage available within a<br />
given 15-minute interval from the three networks is<br />
shown in Figure 2 (left). The points are color-coded,<br />
indicating the line-of-sight TEC value along each<br />
raypath, between every CORS, GPS-Met, or IGS<br />
station <strong>and</strong> all the GPS satellites in view at the time.<br />
The values are determined by the calibrated phase<br />
differences. The key to the color values is shown in<br />
the color bar in TEC units (1 TEC unit=1016<br />
electrons m -2 ). The plot displays the intersection<br />
points where the set of raypaths intersect a<br />
hypothetical shell located at an altitude of 375 km.<br />
All of the signal path intersection points within a 15minute<br />
interval are shown. Signal paths for stations in<br />
coastal Alaska <strong>and</strong> Central America, as well as the<br />
continental United States, can be seen. This plot<br />
covers a time interval during the peak of the<br />
geomagnetic storm of October 29, 2003. The<br />
anomalously high TEC values due to the storm are<br />
visible over Central American, the southern regions of the U.S., <strong>and</strong> adjacent areas.<br />
40
<strong>Theme</strong> report: <strong>Advanced</strong> <strong>Modeling</strong> <strong>and</strong> <strong>Observing</strong> <strong>Systems</strong><br />
With the inclusion of the additional data sources, the estimates of accuracy of the vertical TEC over the CONUS is<br />
now estimated to be 1.7 TEC units. The product can be used to improve single-frequency GPS positioning, <strong>and</strong><br />
provide information for more rapid integer ambiguity resolution for dual-frequency decimeter- <strong>and</strong> centimeteraccuracy<br />
positioning. Real-time maps can be found at http://www.sec.noaa.gov/ustec.<br />
AMOS-04: <strong>Observing</strong> Facilities, Campaigns <strong>and</strong> Networks<br />
GMD01: Central Ultraviolet Calibration Facility<br />
GOAL:<br />
Provide a central facility for the calibration <strong>and</strong> characterization of solar ultraviolet broadb<strong>and</strong> <strong>and</strong> spectral<br />
measurement systems to improve the long-term stability <strong>and</strong> comparison of measurements across national <strong>and</strong><br />
international networks.<br />
MILESTONE GMD01.1:<br />
Analyze <strong>and</strong> publish a ten-year study of the stability of the CUCF’s reference UVB broadb<strong>and</strong><br />
radiometers <strong>and</strong> 50+ network UVB radiometers. This includes analysis of multi-year spectral<br />
response <strong>and</strong> cosine response measurements.<br />
ACCOMPLISHMENTS FOR GMD01.1:<br />
A more extensive study of the erythema <strong>and</strong> instrumental calibration factors was performed this year. This study<br />
was part of a larger project with colleagues from Colorado State University (J. Hicke <strong>and</strong> J. Slusser) to analyze the<br />
long-term behavior of the broadb<strong>and</strong> radiometers of the USDA UV monitoring network as a function of site <strong>and</strong><br />
season. Last years‘ study of the ―absolute‖ response revealed that, on average, the radiometers have changed by<br />
approximately 1.8% from 1997 to 2005. Note that ―absolute‖ response is a misnomer <strong>and</strong> represents a signal using<br />
NIST traceable lamps where the spectral response of the radiometer is not taken into account. Erythema calibration<br />
factors for the CUCF YES reference triad at Table Mountain Test Facility (TMTF) were calculated from 1999-2005.<br />
There were approximately 100 full- or half-clear days per year. Because of down time or quality issues of either the<br />
U111 spectroradiometer or the broadb<strong>and</strong> reference radiometers, there were approximately 35 calibration days per<br />
year. The erythema calibration factors at a solar zenith angle for 40 <strong>and</strong> 300 DU were plotted for 1999 to 2005, <strong>and</strong><br />
a linear regression was applied. The linear regression showed no statistically significant slope. The erythema<br />
calibration factor at a solar zenith angle of 64 was plotted from 1999 to 2005 <strong>and</strong> showed no statistically significant<br />
slope. A solar zenith angle of 64 was chosen because the direct measurements could be used with no modeled ozone<br />
correction because the erythema calibration factor‘s dependence on total ozone is minimized at this angle.<br />
Uncertainties have not been defined for calibration of broadb<strong>and</strong> radiometers. It was determined that a minimum<br />
uncertainty in solar irradiance from a precision spectroradiometer is approximately ±5% for two st<strong>and</strong>ard deviations<br />
(G. Bernhard et al. [2002]). This number for the U111 spectroradiometer is optimistic, e.g., dirty diffusers over the<br />
years have given 0-5% errors. Transferring the calibration from the U111 to the reference triad adds additional<br />
uncertainty. A minimum uncertainty for the calibration of the triad is estimated to be ±10%. An oral paper was<br />
presented at the SPIE Conference for Remote Sensing of Clouds in the Atmosphere, in Stockholm, Sweden.<br />
MILESTONE GMD01.2:<br />
Publish a paper on a suite of filter radiometers involved in the June 2003 Spectroradiometer<br />
Intercomparison at Table Mountain, Colorado.<br />
ACCOMPLISHMENTS FOR GMD01.2:<br />
The CUCF conducts UV spectroradiometer intercomparison campaigns on an as-needed basis depending on UV<br />
instrumentation improvements <strong>and</strong> new instrumentation designs to validate the changes <strong>and</strong> compare between<br />
existing instrumentation. Ten UV spectroradometers participated in the Fifth UV Spectroradiometer Intercomparison<br />
at the Table Mountain Test Facility (TMTF), 8 km north of Boulder. Five of the participating<br />
instruments were scanning spectroradimeters; one was a spectrograph measuring all wavelengths simultaneously,<br />
<strong>and</strong> four were filter radiometers. The scanning spectroradiometers <strong>and</strong> spectrograph had nominal b<strong>and</strong>passes of 0.1<br />
to 0.8 nm; therefore, to compare the data among these instruments, a routine from rivmSHIC was used to<br />
st<strong>and</strong>ardize the solar irradiance measurements. The rivmSHIC routine de-convolves the spectral solar irradiance<br />
using high-resolution extraterrestrial flux <strong>and</strong> re-convolves the spectral solar irradiance to a common 1-nm<br />
41
<strong>Theme</strong> report: <strong>Advanced</strong> <strong>Modeling</strong> <strong>and</strong> <strong>Observing</strong> <strong>Systems</strong><br />
triangular slit function. This method was compared to previous years that used a simple method of convolving with a<br />
common slit function. In addition, this year the reference spectrum was determined from a routine from Gardiner et<br />
al. [1997]. Although the routine is arduous, it has the advantage of providing an unbiased st<strong>and</strong>ard procedure for<br />
determining the reference spectrum. A draft of the spectroradiometer paper has been prepared. A comparison of the<br />
solar irradiance from the filter radiometers is presented in a second forthcoming paper.<br />
MILESTONE GMD01.3:<br />
Update UV-MFRSR calibration data files from 1997 to 2005 for CUCF horizontal scale<br />
corrections, NIST vertical scale corrections, <strong>and</strong> out-of-b<strong>and</strong> corrections.<br />
ACCOMPLISHMENTS FOR GMD01.3:<br />
Previously, the CUCF determined that the UV-MFRSR channels 3-6 were in poor agreement with the U111<br />
spectroradiometer. These channels changed from Gallium Phosphide (GaP) photodetectors to Silicon (Si) to<br />
accommodate the failure of the GaP photodetectors in the field. Work indicated that the problem was primarily that<br />
the Si photodetectors were allowing out-of-b<strong>and</strong> light from the NIST traceable halogen-tungsten lamps to contribute<br />
to the calibration signal, which resulted in an inaccurate calibration.<br />
Studies showed that the contribution of out-of-b<strong>and</strong> light to the signal depended on several factors. First, it depended<br />
on the channel, with the 317-nm channel typically being the most affected, i.e., average of 22.1%. Secondly, it<br />
depended on the instrument, where each instrument was different but grouped in about four different patterns, i.e.,<br />
for the 317-nm channel the out-of-b<strong>and</strong> light ranged from 37.7% to 6.6%. Lastly, the signal depended on the lamp<br />
that was used <strong>and</strong> likely due to the different color temperatures of the lamps, i.e., approximately 0-5% difference<br />
between lamps at 317-nm.<br />
All 47 UV-MFRSR radiometers were characterized for out-of-b<strong>and</strong> light. The last two radiometers came through the<br />
CUCF in December 2006. There were 193 UV-MFRSR calibration files corrected for out-of-b<strong>and</strong> light since 2001.<br />
The UV-MFRSR calibration files were also corrected for the 1-2% NIST adjustment to the lamp irradiance scale <strong>and</strong><br />
the 4-5% adjustment to the CUCF irradiance scale last year. In November 2006, 300+ corrected calibration files<br />
were sent to the USDA to replace the old files in their system. The USDA UV monitoring programs have updated<br />
the UV solar irradiance from their instruments, using the corrected calibration files. The corrected data are now<br />
available on their website including a web page to describe the corrections to the calibration files.<br />
GMD02: Surface Radiation Network<br />
GOAL:<br />
Collect long-term research-quality up-welling <strong>and</strong> down-welling broadb<strong>and</strong> solar <strong>and</strong> infrared radiation data at<br />
seven U.S. sites. Collect long-term, broadb<strong>and</strong> ultraviolet radiation data to evaluate variations in the erythemal<br />
doses. Collect long-term, spectral filter data to measure column aerosol optical depth <strong>and</strong> cloud optical depth.<br />
Collect cloud cover data to assess the effect of clouds on the surface radiation budget.<br />
MILESTONE GMD02.1:<br />
Analyze 10-year plus aerosol optical depth record of SURFRAD sites <strong>and</strong> publish the results.<br />
ACCOMPLISHMENTS FOR GMD02.1:<br />
Results from a recent decadal study of aerosol optical depth (AOD) over the U.S. reveal a general nationwide<br />
decrease, but also geographic differences. These new data from NOAA‘s SURFRAD surface radiation budget<br />
network show high AOD in summer <strong>and</strong> low AOD in winter. The western stations have the lowest AOD <strong>and</strong> the<br />
eastern stations have the highest. Western stations also show a secondary springtime maximum caused by Asian<br />
dust. The abundance of aerosols in the east <strong>and</strong> their relatively small size is attributed to organic emissions, high<br />
humidity, <strong>and</strong> the predisposition for stagnant air in summer. These characteristics agree with previously published<br />
results, however, national <strong>and</strong> station decadal AOD tendencies show interesting features that may have climate<br />
change implications.<br />
Nationally, 500nm AOD decreased from 1997 through 2006 by about 0.02, which is similar to recent results<br />
reported for the oceans. However, not all U.S. stations share this tendency. Results show that aerosols are decreasing<br />
42
<strong>Theme</strong> report: <strong>Advanced</strong> <strong>Modeling</strong> <strong>and</strong> <strong>Observing</strong> <strong>Systems</strong><br />
in the eastern U.S. However, in the west a decrease is only observed at Desert Rock, NV <strong>and</strong> Fort Peck, MT. A very<br />
slight increase over the past decade occurred in Boulder, CO, which is likely caused by an upsurge in wildfires from<br />
2000 through 2006. When the four years with the most abundant wildfires are removed, decadal tendencies at<br />
Boulder <strong>and</strong> Fort Peck are steady. If climate change is causing drier conditions in the western U.S., then higher than<br />
normal numbers of forest fires are likely to occur, <strong>and</strong> the observed AOD increase should be considered part of the<br />
background. In that case, the additional blockage of sunlight by direct <strong>and</strong> indirect effects of the fire-induced<br />
aerosols would act to offset the warming attributed to increasing greenhouse gases. If the increasing trend in western<br />
wildfires does not continue, then the recent AOD increase in the intermountain western U.S. can be considered<br />
temporary, <strong>and</strong> western AOD should be expected to remain steady, as suggested by the observed tendencies of the<br />
low-fire years. The only way to answer these <strong>and</strong> other questions related to aerosols <strong>and</strong> climate is to continue to<br />
build AOD times series into future decades so that tendencies can be determined with more certainty.<br />
MILESTONE GMD02.2:<br />
Analyze the 10-year plus SURFRAD data record of irradiance for trends in the context of the<br />
current global dimming/brightening issue <strong>and</strong> publish results.<br />
ACCOMPLISHMENTS FOR GMD02.2:<br />
Preparatory to the analysis of the SURFRAD data for long-term changes in irradiance, an analysis of a SURFRADlike<br />
data set from the Oklahoma/Kansas ARM site was performed. Looking at the trends in the annual-averaged data<br />
between 1993 <strong>and</strong> 2003, there were no statistically significant trends in the data. There were upward tendencies in<br />
total horizontal irradiance, direct beam irradiance, <strong>and</strong> even in the diffuse irradiance, however, the statistical<br />
uncertainty was much too large to claim a trend. The seven SURFRAD sites will be examined for the total record<br />
length to determine whether taken together theses sites corroborate what is now just a tendency at one site.<br />
Separation of the data into seasons indicated that summer showed the largest upward tendency with the other<br />
seasons flat. Again, this is not statistically significant.<br />
43
<strong>Theme</strong> report: Climate System Variability<br />
<strong>Scientific</strong> <strong>Theme</strong>: CLIMATE SYSTEM VARIABILITY<br />
CSV-01: Detection of Climate Modes, Trends <strong>and</strong> Variability<br />
GMD03: Climate Trend Analysis<br />
PSD04: Decadal Climate <strong>and</strong> Global Change Research<br />
NGDC04: Paleoclimatology—Underst<strong>and</strong>ing Decadal- to Millennial-Scale Climate<br />
Variability<br />
CSV-02: Mechanism <strong>and</strong> Forcings of Climate Variability<br />
CSD03: Chemistry, Radiative Forcing, <strong>and</strong> Climate<br />
PSD01: <strong>Modeling</strong> of Seasonal to Interannual Variability<br />
PSD02: Underst<strong>and</strong>ing <strong>and</strong> Predicting Subseasonal Variations <strong>and</strong> their<br />
Implications for Longer-Term Climate Variability<br />
GMD04: Climate Forcing<br />
CSV-03: Stratospheric Ozone Depletion<br />
CSD04: Tropospheric <strong>and</strong> Stratospheric Transport <strong>and</strong> Chemical Transformation<br />
GMD05: Ozone Depletion<br />
CSV-04: Climate Dynamics<br />
CSD06: Turbulent Meteorological Motions<br />
PSD03: Empirical <strong>and</strong> Process Studies<br />
PSD06: Climate Dynamics<br />
PSD15: Surface Processes<br />
CSV-05: Climate Research Database Development<br />
NSIDC01: Digitizing Analog Cryospheric Data under the Climate Database<br />
Modernization Program<br />
NSIDC02: Observations for SEARCH–Data Integration for Arctic Reanalysis <strong>and</strong><br />
Change Detection<br />
NSIDC03: World Data Center for Glaciology, Boulder–Current Programs<br />
CSV-06: Regional Climate <strong>Systems</strong><br />
PSD10: Cloud <strong>and</strong> Aerosol Processes<br />
CSV-07: Climate Services<br />
PSD05: Experimental Regional Climate Services<br />
PSD07: Experimental Climate Data <strong>and</strong> Web Services<br />
CSV-01: Detection of Climate Modes, Trends <strong>and</strong> Variability<br />
GMD03: Climate Trend Analysis<br />
GOAL:<br />
Interpret operational data (ozone column, ozone profile, aerosol extinction, broadb<strong>and</strong> spectral radiation, <strong>and</strong> other<br />
environmental parameters) collected by NOAA ground-based <strong>and</strong> NCAR aircraft-based instruments. Assess data for<br />
long-term quality. Evaluate stability <strong>and</strong> inter-annual variability in the ground-based <strong>and</strong> aircraft-based data sets.<br />
Provide scientific community with information relevant to climate research <strong>and</strong> evaluate usefulness of data for<br />
validation of other independent measurements, including satellite observations.<br />
MILESTONE GMD03.1:<br />
Assess newly updated ozone-profile database for trends <strong>and</strong> changes in trends <strong>and</strong> validate it<br />
against ozone products derived from remote <strong>and</strong> in situ measuring systems such as satellites <strong>and</strong><br />
ozone-sounding.<br />
44
<strong>Theme</strong> report: Climate System Variability<br />
ACCOMPLISHMENTS FOR GMD03.1:<br />
This work evaluated the quality of tropospheric ozone information derived from the ground-based Dobson <strong>and</strong><br />
Brewer measurements. A newly developed Umkehr ozone-profile retrieval algorithm allowed separation of the<br />
tropospheric ozone measurement into two or three layers. The Umkehr-retrieved tropospheric ozone data were<br />
validated through comparisons with co-incident ozonesonde measurements of high vertical resolution. The analysis<br />
concentrated on the short-term <strong>and</strong> long-term tropospheric ozone variability detected by co-incident <strong>and</strong> co-located<br />
Dobson <strong>and</strong> Brewer data, along with ozone profiles from ozonesondes available from Boulder, CO, <strong>and</strong> Hilo, HI.<br />
Analyses suggest that the Dobson Umkehr technique is capable of monitoring short-term variability in tropospheric<br />
ozone. It can explain about 50% of the variability measured by ozonesondes. It was found that the one-day coincident<br />
data have higher correlation coefficients than the two-day window for Boulder, but not for Mauna Loa. In<br />
addition, correlation coefficients calculated for co-incident Umkehr <strong>and</strong> ozonesonde data were found to be relatively<br />
large (40-60%) <strong>and</strong> statistically significant in the troposphere, although the highest correlation (70%) was found in<br />
the lower stratosphere. Ozonesonde data smoothed with the corresponding Umkehr Averaging Kernel function<br />
showed larger correlation coefficients (up to 80%) as compared to comparisons using layer-integrated ozonesonde<br />
data. Based on correlation analysis, Dobson Umkehr data can capture tropospheric ozone variability. The Umkehr<br />
method is capable of measuring long-term changes in tropospheric ozone [Petropvalovskikh et al., AGU, 2006].<br />
Correlation between co-incidental sonde <strong>and</strong> Dobson ozone measurements (in excess of a<br />
priori) as function of Umkehr layer (~5 km wide) for (right) MLO station record during 1985-<br />
2005, <strong>and</strong> (left) Boulder station records during 1985-2005 time period. Black lines represent<br />
results for layer-integrated ozonesonde data, red lines show results for Umkehr smoothed<br />
ozonesonde data.<br />
MILESTONE GMD03.2:<br />
Optimize <strong>and</strong> validate algorithm for ozone column retrievals from photo-actinic flux hyper-spectral<br />
measurements on board an aircraft under a variety of atmospheric conditions. Provide data to<br />
OMI/AURA satellite validation campaigns.<br />
ACCOMPLISHMENTS FOR GMD03.2:<br />
This research is in support of Aura satellite validation activities. The solar radiation measurement instrumentation<br />
was developed by the National Center for Atmospheric Research group (R. Shetter) <strong>and</strong> deployed on the NASA<br />
WB-57 <strong>and</strong> DC-8 aircraft platforms in several Aura Validation Experiment (AVE) campaigns. These instruments<br />
are CCD-based Actinic Flux Spectroradiometers (CAFS) to determine the down- <strong>and</strong> up-welling UV <strong>and</strong> visible<br />
actinic flux as a function of wavelength. The Ozone Monitoring Instrument (OMI) total ozone columns <strong>and</strong><br />
Microwave Limb Sounder (MLS) integrated ozone profiles were validated in the tropical region. The CR-AVE<br />
campaign base in Costa Rica took place in January <strong>and</strong> February of 2006. The CAFS observations were taken<br />
aboard the NASA WB-57 flights co-incident with the OMI ozone observation (~10,900 data points). The average<br />
difference between OMI DOAS (Differential Optical Absorption Spectroscopy) <strong>and</strong> CAFS total ozone column<br />
estimates was -5.4 DU with a st<strong>and</strong>ard deviation of 5.2 DU. The average difference between OMI TOMS (Total<br />
Ozone Mapping Spectrometer) <strong>and</strong> CAFS total ozone column estimates was -4.2 DU with a st<strong>and</strong>ard deviation of<br />
4.1. Comparisons of the OMI <strong>and</strong> the CAFS total ozone residuals suggest dependence on the total ozone column in<br />
both versions of the OMI retrieved data. These differences are well within the validation requirements of ±2% for<br />
45
<strong>Theme</strong> report: Climate System Variability<br />
the OMI total ozone column data product. Analysis of CR-AVE comparisons found no significant differences<br />
between the MLS <strong>and</strong> CAFS integrated ozone columns at flight altitudes between 17 <strong>and</strong> 20 km (or above the 100mb<br />
pressure level). The st<strong>and</strong>ard deviation for the matched data was 1.5%. At flight altitudes between 15 <strong>and</strong> 17 km<br />
(or 146- <strong>and</strong> 100-mb atmospheric pressure, respectively) the average bias was less than 1% with less than 1%<br />
st<strong>and</strong>ard deviation. The analysis of the matched data at altitudes below 15 km (or below 146-mb pressure level)<br />
indicated less than 1% bias between the MLS <strong>and</strong> CAFS ozone columns. The analysis of the data over the entire<br />
range of altitude between 13 <strong>and</strong> 19 km shows that the agreement between the two systems is within 3% (two<br />
st<strong>and</strong>ard deviation level). The above results help to assure the quality of the tropospheric ozone column derived as a<br />
difference between the OMI total ozone column <strong>and</strong> the MLS integrated stratospheric ozone column.<br />
PSD04 Decadal Climate <strong>and</strong> Global Change Research<br />
GOAL:<br />
(i) Improve underst<strong>and</strong>ing of long-term climate variations through analysis of observations <strong>and</strong> hierarchies of GCM<br />
experiments. (ii) Seek dynamical explanations of oceanic variability <strong>and</strong> changes through observational analyses<br />
<strong>and</strong> GCM experiments. (iii) Provide attribution for long-term regional climate changes.<br />
MILESTONE PSD04.1:<br />
Diagnose impacts of ENSO-related <strong>and</strong> non-ENSO related tropical SST changes over the last 50<br />
years.<br />
ACCOMPLISHMENTS FOR PSD04.1:<br />
CIRES researchers have applied a pattern-based filtering technique developed by Penl<strong>and</strong> <strong>and</strong> Matrosova [J. Clim.,<br />
2006] to partition the ENSO-related <strong>and</strong> ENSO-unrelated portions of tropical SST anomaly fields on a month-bymonth<br />
basis throughout the 135-yr (1871-2005) historical climate record. They have also assessed the global<br />
impacts of the ENSO-related <strong>and</strong> ENSO-unrelated tropical SST trends over the last 50 years using the<br />
NCAR/CAM3 <strong>and</strong> the NCEP/GFS atmospheric general circulation models, with particular emphasis on the impacts<br />
on precipitation trends over the Americas, western Africa, <strong>and</strong> Europe. Both GCMs indicate substantial precipitation<br />
trend responses in these regions to the tropical SST trends that are generally in excellent mutual agreement <strong>and</strong> with<br />
the observed precipitation trends.<br />
Both the ENSO-related <strong>and</strong> the ENSO-unrelated portions of the tropical SST trends are found to be important in this<br />
regard. Specifically, the ENSO-unrelated SST trends account for most of the precipitation trends in areas bordering<br />
the Atlantic Ocean, whereas the ENSO-related SST trends account for most of the North American precipitation<br />
trends. It is interesting that the observed moistening trend over the eastern U.S. has generally not been captured by<br />
coupled climate model simulations of the 20th century. If its attribution to the ENSO-related SST trends suggested<br />
by this study is correct, then the failure of the coupled models may be partly due to their general tendency to<br />
misrepresent ENSO variability, <strong>and</strong> therefore likely also the ENSO-related tropical SST trends <strong>and</strong> their global<br />
impacts.<br />
MILESTONE PSD04.2:<br />
Assess possibility of abrupt climate change over North America in the next several decades<br />
triggered by continued warming of the Indian Ocean.<br />
ACCOMPLISHMENTS FOR PSD04.2:<br />
The tropical oceans have warmed significantly over the last half-century, especially in the already warm Indian <strong>and</strong><br />
western Pacific basins. An extensive set of atmospheric GCM integrations were performed with a prescribed<br />
continuation of this warming trend. These runs suggest that the continued tropical ocean warming will gradually<br />
modify the atmospheric jet streams to the point where the ability of the jet streams to channel atmospheric<br />
disturbances along the upper tropospheric waveguide will undergo a relatively sudden shift sometime in the next<br />
century. This will cause relatively rapid shifts in the climates of North America <strong>and</strong> Europe.<br />
MILESTONE PSD04.3:<br />
Assess impacts of coupled air-sea interactions, decadal ocean dynamics, l<strong>and</strong>-surface<br />
feedbacks, <strong>and</strong> l<strong>and</strong>-use changes on decadal atmospheric variability.<br />
46
<strong>Theme</strong> report: Climate System Variability<br />
ACCOMPLISHMENTS FOR PSD04.3:<br />
The coupled ocean-atmosphere response to Indian Ocean warmth was studied. It was shown with atmospheric<br />
models that Indian Ocean warmth forces a positive polarity phase of the North Atlantic Oscillation (NAO),<br />
confirming results of previous studies. Coupled model experiments showed that this NAO response forces a local<br />
air-sea feedback over the North Atlantic Ocean, which intensifies the NAO response. This enhancement is realized<br />
through a positive feedback between the NAO atmospheric circulation anomaly <strong>and</strong> a tripolar North Atlantic SST<br />
pattern, consistent with other studies on North Atlantic air-sea interactions. It was concluded that the North Atlantic<br />
<strong>and</strong> European climate response to Indian Ocean warming may be considerably greater than hitherto judged from<br />
analyses of atmospheric model experiments alone.<br />
NGDC04: Paleoclimatology—Underst<strong>and</strong>ing Decadal- to Millennial-Scale Climate Variability<br />
GOAL:<br />
Improve our underst<strong>and</strong>ing of observed long-term climate variations through compilation <strong>and</strong> analysis of data from<br />
the pre-instrumental record <strong>and</strong> provide access to both data <strong>and</strong> information from the paleoclimatic record.<br />
MILESTONE NGDC04.1:<br />
Create a fire-history portal on the FRAMES (Fire Research <strong>and</strong> Management System) website.<br />
ACCOMPLISHMENTS FOR NGDC04.1:<br />
The goal of the Fire Research <strong>and</strong> Management System (FRAMES) program, which is supported by the U.S. Forest<br />
Service <strong>and</strong> the U.S. Geological Survey‘s National Biological Information Infrastructure Program, in cooperation<br />
with the College of Natural Resources at the University of Idaho, is to facilitate the exchange of information <strong>and</strong><br />
transfer of technology among wild-l<strong>and</strong> fire researchers, l<strong>and</strong> managers, <strong>and</strong> other stakeholders. To this end, they are<br />
hosting a web portal that is organized into several functional Subject Areas, <strong>and</strong> CIRES-NOAA personnel have<br />
taken over the role of content managers for the Fire-History Subject Area. Fire-history data are increasingly seen as<br />
critical information for contemporary management of public l<strong>and</strong>s by providing opportunities for underst<strong>and</strong>ing the<br />
range of variability in fire frequency, severity, extent, <strong>and</strong> spatial complexity, as well as the role of fire in<br />
ecosystems <strong>and</strong> the feedbacks that link fire, climate, vegetation, <strong>and</strong> management decisions. Fire-history data<br />
provide managers with models of long-term ecosystem behavior with which to assess degree <strong>and</strong> nature of departure<br />
in current conditions, <strong>and</strong> direction <strong>and</strong> justification for ecological restoration efforts, fuels treatments, <strong>and</strong> other<br />
resource management projects. CIRES-NOAA personnel have created <strong>and</strong> maintained the portlets <strong>and</strong> web pages for<br />
the FRAMES Fire History Subject Area, <strong>and</strong> in particular have made data from the International Multiproxy<br />
Paleofire Database, which is an archive of fire history data derived from natural proxies that is housed at NOAA‘s<br />
Paleoclimatology Branch <strong>and</strong> maintained by CIRES-NOAA personnel, available via text- <strong>and</strong> geographical-based<br />
searches through the portal.<br />
MILESTONE NGDC04.2:<br />
Implement protocols that provide paleoclimate metadata to remote crawlers <strong>and</strong> harvesters,<br />
including the PAGES <strong>and</strong> FRAMES portals.<br />
ACCOMPLISHMENTS FOR NGDC04.2:<br />
In an effort to improve data accessibility <strong>and</strong> ease of data browsing, the Paleoclimatology branch put the metadata<br />
from data sets into a database. Collections of metadata XML were then produced from the database <strong>and</strong> those XML<br />
files were then transformed into HTML web pages using XSLT code. An XSLT conversion was run on the XML<br />
metadata records to produce data index pages for each proxy type with Title, Principal Investigators <strong>and</strong> Location<br />
listed for each data set. The page has column headers that may be sorted for easier browsing. The XSLT also<br />
produced an HTML page for every study in the collection, which are linked from the index listing page. One major<br />
benefit of having individual web pages for each data set is that a web browser search engine text search on a data set<br />
title, PI or core name will now turn up those individual studies from the data collection that previously required<br />
visitors to be on the NOAA Paleoclimatology website to search for those sites. It opens up this data to the whole<br />
world of Google-style searching without users having to know the web address first. The data set description HTML<br />
pages also serve as the data description pages when users <strong>and</strong> partners such as FRAMES (Fire Research And<br />
Management Exchange System) <strong>and</strong> PAGES (Past Global Changes) use the OAI-PMH metadata search tool to find<br />
data sets.<br />
47
<strong>Theme</strong> report: Climate System Variability<br />
MILESTONE NGDC04.3:<br />
Implement harvesting <strong>and</strong> indexing of paleoclimate data to make data sets from remote servers<br />
<strong>and</strong> remote databases available from the NOAA Paleoclimatogy website.<br />
ACCOMPLISHMENTS FOR NGDC04.3:<br />
CIRES scientists implemented the Open Archive Initiative Protocol for Metadata Harvesting (OAI-PMH) in order to<br />
harvest paleoclimate metadata from other sources. They then harvested more than 54,000 metadata files from<br />
Pangaea/World Data Center for Marine Environmental Sciences, a major repository for marine sediment data. These<br />
metadata files are now indexed at the NOAA Paleoclimatology website as a special set, which allows visitors to the<br />
NOAA Paleoclimatology website to search for any combination of Pangaea <strong>and</strong> WDC-Paleoclimatology data by<br />
using the searching capabilities described in Milestone NGDC04.2. This implementation gives users a one-stop shop<br />
for paleoclimate data; rather than visiting multiple websites to search for paleoclimate data, users can visit the<br />
NOAA Paleoclimatology website <strong>and</strong> make one search for all data. Since only metadata are harvested, users are<br />
linked to the original provider‘s website to obtain the current updated copy of the data itself.<br />
CIRES researchers have also contributed to the National Integrated Drought Information System (NIDIS), the U.S.<br />
portal for drought information. By integrating information from many websites <strong>and</strong> agencies, this portal will provide<br />
the public with another one-stop shop for accurate, timely <strong>and</strong> integrated information on drought conditions at the<br />
relevant spatial scale to facilitate proactive decisions aimed at minimizing the economic, social <strong>and</strong> ecosystem losses<br />
associated with drought. CIRES scientists led the selection process for the portal software for this project <strong>and</strong><br />
evaluated different portal software, interviewed user groups <strong>and</strong> conducted surveys, <strong>and</strong> wrote a report to the NIDIS<br />
Program Manager. The recommended software, BEA AquaLogic, has been purchased <strong>and</strong> the portal will be live in<br />
late 2007.<br />
CSV-02: Mechanism <strong>and</strong> Forcings of Climate Variability<br />
CSD03: Chemistry, Radiative Forcing, <strong>and</strong> Climate<br />
GOAL:<br />
(i) Observe <strong>and</strong> model the radiative forcing due to stratospheric ozone changes <strong>and</strong> tropospheric radiatively active<br />
gases. (ii) Carry out upper-troposphere airborne experiments <strong>and</strong> diagnostic analyses that characterize the<br />
dynamical <strong>and</strong> chemical processes that influence the radiative balance in the global atmosphere. (iii) Quantify the<br />
chemical <strong>and</strong> optical properties that determine the lifetimes, abundances, <strong>and</strong> trends of greenhouse gases. (iv) Use<br />
passive cloud observations to develop techniques that can be used to estimate cloud properties.<br />
MILESTONE CSD03.1:<br />
Plan <strong>and</strong> execute the Gulf of Mexico Air Quality <strong>and</strong> Climate Change Study (GoMACCS) field<br />
study.<br />
ACCOMPLISHMENTS FOR CSD03.1:<br />
In 2006, NOAA/ESRL <strong>and</strong> CIRES led a major multi-institutional intensive field program that focused on<br />
investigating important scientific questions that are common to both climate <strong>and</strong> air quality. The NOAA/ESRL <strong>and</strong><br />
CIRES components of the program are the Texas Air Quality Study (TexAQS) <strong>and</strong> the Gulf of Mexico Atmospheric<br />
Composition <strong>and</strong> Climate Study (GoMACCS). This intensive field study provided significant new information that<br />
is required to afford a better underst<strong>and</strong>ing of the sources, <strong>and</strong> atmospheric processes responsible for the formation<br />
<strong>and</strong> distribution, of ozone <strong>and</strong> aerosols in the atmosphere <strong>and</strong> the influence that these species have on the radiative<br />
forcing of climate regionally <strong>and</strong> globally, as well as their impact on human health <strong>and</strong> regional haze. The study was<br />
carried out between July 1 <strong>and</strong> October 15, 2006, throughout Texas <strong>and</strong> the northwestern Gulf of Mexico. Three<br />
NOAA platforms were deployed: a NOAA WP-3 aircraft, a NOAA Twin Otter, <strong>and</strong> the NOAA R/V Ronald H.<br />
Brown. All objectives of this portion of the study were met.<br />
GoMACCS was the NOAA/ESRL <strong>and</strong> CIRES climate change component of this field program, <strong>and</strong> characterized<br />
marine/continental chemical <strong>and</strong> meteorological processes over Texas <strong>and</strong> the Gulf of Mexico in order to improve<br />
the simulation of the radiative forcing of climate change by lower-atmosphere ozone <strong>and</strong> aerosols. In addition to<br />
48
<strong>Theme</strong> report: Climate System Variability<br />
clear-sky radiative effects, GoMACCS investigated the influence of aerosols on cloud properties <strong>and</strong> the role of<br />
clouds in chemical transformation. The measurements addressed the following specific areas of research:<br />
1) Emission of aerosols <strong>and</strong> greenhouse gases from large point sources (electric power generating units –<br />
EGUs);<br />
2) Composition of the aerosol <strong>and</strong> gaseous (aerosol precursor) components in exhaust of commercial marine<br />
vessels;<br />
3) Chemical processing of aerosols after emission from sources;<br />
4) Variation of water uptake by aerosols (f(RH) effect) with chemical processing time;<br />
5) Determination of mass-based emission factors of black carbon <strong>and</strong> sulfur dioxide from commercial<br />
shipping;<br />
6) Influence of African dust transport on the aerosol environment of Texas <strong>and</strong> the Gulf of Mexico.<br />
MILESTONE CSD03.2:<br />
Use global chemistry/dynamics models to examine the effect of future ship traffic in the Arctic<br />
northern passages on Arctic pollution, particularly in regard to the role of black carbon.<br />
ACCOMPLISHMENTS FOR CSD03.2:<br />
Sea ice is expected to recede substantially in the Arctic during the 21st century as a result of projected climate<br />
change. This could lead to considerable changes in global shipping patterns in the decades ahead. The opening of<br />
viable shipping routes through the northern passages will generate new environmental problems in the Arctic. The<br />
emissions of chemical compounds by ship engines are expected to enhance the atmospheric concentration of photooxidants<br />
in this region.<br />
CIRES scientists have used a coupled ocean-atmosphere model <strong>and</strong> a global chemical-transport model of the<br />
atmosphere to quantify the potential changes in the surface ozone level in response to future ship traffic in the<br />
Arctic. They have calculated that, during the summer months, surface ozone concentrations in the Arctic could be<br />
enhanced by a factor two to three in the decades ahead as a consequence of ship operations. Projected ozone<br />
concentrations of 40-60 ppbv from July to September in some areas in the Arctic are comparable to summer time<br />
values currently observed at many locations of the industrialized regions in the Northern Hemisphere.<br />
Particles such as black carbon are also emitted by ship engines. Simulations have been performed that show that<br />
these new emissions of black carbon could lead to significant increases in the amount of black carbon in the Arctic<br />
atmosphere, <strong>and</strong> in the deposition of black carbon on ice, as shown in the figures below. Over the next months,<br />
scientists will continue this study in order to evaluate the possible impact of the increase in the deposition of black<br />
carbon on ice <strong>and</strong> snow on the albedo in the Arctic areas.<br />
49
<strong>Theme</strong> report: Climate System Variability<br />
Surface ozone observed at the station of Barrow (71.2 N; 156.4 W) in Alaska (dots) from May to September 1997.<br />
The background ozone mixing ratios calculated for current chemical emissions <strong>and</strong> for ECMWF meteorological<br />
fields during the same period are shown by the full line. Ozone mixing ratios derived when Arctic ships emissions<br />
are taken into account, are shown by the dashed line.<br />
Distribution of surface black carbon in the Arctic (a) in ppbv when no ships are present in the Arctic, <strong>and</strong> increase<br />
(in ppbv) in black carbon concentration resulting from ships. Surface deposition of black carbon (in μg/m2/day)<br />
when no ships are considered, <strong>and</strong> increase in the surface deposition resulting from ships.<br />
50
<strong>Theme</strong> report: Climate System Variability<br />
MILESTONE CSD03.3:<br />
Underst<strong>and</strong> the processes that maintain the observed fall-off in tropical methane profiles between<br />
12 km <strong>and</strong> the tropopause. Underst<strong>and</strong> how these processes affect the corresponding profiles of<br />
ozone <strong>and</strong> water.<br />
ACCOMPLISHMENTS FOR CSD03.3:<br />
The tropical upper troposphere <strong>and</strong> lower stratosphere is an important region for climate <strong>and</strong> global change. Deep<br />
convection <strong>and</strong> transport associated with intense tropical storms have a significant impact on the chemical<br />
composition of this region. Related to this topic researchers have done an analysis on AIRS <strong>and</strong> MLS satellite water<br />
vapor <strong>and</strong> cloud property data from 2002-06 in all the ocean regions around the world where tropical cyclones occur<br />
[Ray <strong>and</strong> Rosenlof, 2007]. They gathered tropical cyclone positions <strong>and</strong> intensities from the Joint Typhoon Warning<br />
Center <strong>and</strong> the Hurricane Research Center best-track data sets for the different ocean basins. For each year <strong>and</strong><br />
ocean basin region, they compiled average water vapor <strong>and</strong> cloud properties in the upper troposphere during both<br />
intense (category 3 or larger) <strong>and</strong> ―weak‖ (category 2 or lower) tropical cyclones.<br />
The primary results from this analysis are that (1) tropical cyclones of all intensities are effective at hydrating <strong>and</strong><br />
increasing the cloudiness of the upper troposphere <strong>and</strong> (2) tropical cyclones may be an important contributor to the<br />
global tropical water vapor budget of the upper troposphere. AIRS water vapor mixing ratios <strong>and</strong> NCEP wind fields<br />
at the 173 hPa pressure level averaged over all the intense tropical storms in the western Pacific are shown below<br />
(left figure). Some interesting features include the location of the peak region of elevated water vapor to the east of<br />
the eye of the storms <strong>and</strong> the region of elevated water vapor advected to the southwest by the upper level<br />
anticyclonic flow around the storms. Average differences from the monthly mean of AIRS cloud fraction for the<br />
western Pacific region during intense tropical cylones are shown below (right figure). Cloudiness increases near the<br />
cyclone <strong>and</strong> there is a compensating region of lower cloudiness on average to the west of the cyclones. Overall, the<br />
net cloudiness in the entire region around the cyclones increases by a few percent.<br />
PSD01: <strong>Modeling</strong> of Seasonal to Interannual Variability<br />
GOAL:<br />
Underst<strong>and</strong> how much predictability, especially outside the tropics, exists on seasonal-to-interannual timescales<br />
beyond that associated with linear ENSO signals, <strong>and</strong> what additional useful predictive information can be<br />
extracted by making large ensembles of nonlinear General Circulation Model (GCM) integrations.<br />
MILESTONE PSD01.1:<br />
Determine sensitivity to past <strong>and</strong> future SST changes in different parts of the tropical oceans.<br />
ACCOMPLISHMENTS FOR PSD01.1:<br />
A study highlighting the sensitivity of global warming to the pattern of tropical ocean warming was published. The<br />
current generations of climate models are in substantial disagreement as to the projected patterns of sea surface<br />
51
<strong>Theme</strong> report: Climate System Variability<br />
temperatures (SSTs) in the tropics over the next several decades. CIRES scientists showed that the spatial patterns of<br />
tropical ocean temperature trends have a strong influence on global mean temperature <strong>and</strong> precipitation trends <strong>and</strong><br />
on global mean radiative forcing. They identified the SST patterns with the greatest influence on the global mean<br />
climate <strong>and</strong> found very different, <strong>and</strong> often opposing, sensitivities to SST changes in the tropical Indian <strong>and</strong> West<br />
Pacific Oceans. This work stresses the need to reduce climate-model biases in these sensitive regions, as they not<br />
only affect the regional climates of the nearby densely populated continents, but also have a disproportionately large<br />
effect on the global climate.<br />
MILESTONE PSD01.2:<br />
Document <strong>and</strong> diagnose the causes of skewed seasonal precipitation distributions in<br />
observations <strong>and</strong> models.<br />
ACCOMPLISHMENTS FOR PSD01.2:<br />
CIRES scientists have continued to investigate precipitation around the globe in satellite, reanalysis, <strong>and</strong> GCM data<br />
sets. They have found that the 500-mb mean vertical velocity at a given location can be used to explain many of the<br />
features of the shape of the seasonal-mean precipitation distribution at that location. Accounting for vertical-velocity<br />
variability <strong>and</strong> moisture provides a complete theory for the shape <strong>and</strong> movements of precipitation distributions.<br />
MILESTONE PSD01.3:<br />
Continue 20th century re-analysis efforts in collaboration with NCEP, NCAR, NCDC, ECMWF, U.<br />
of East Anglia, Environment Canada, ETH-Zurich, <strong>and</strong> the UK Hadley Centre.<br />
ACCOMPLISHMENTS FOR PSD01.3:<br />
Climate variability <strong>and</strong> global change studies are increasingly focused on underst<strong>and</strong>ing <strong>and</strong> predicting regional<br />
changes of daily weather statistics. Assessing the evidence for such variations over the last hundred years <strong>and</strong><br />
evaluating the quality of models making predictions for the next hundred requires a subdaily (as opposed to monthly<br />
or longer-term average) tropospheric circulation data set. The only data set available for the early 20th century<br />
consists of error-ridden, h<strong>and</strong>-drawn analyses of the mean sea-level pressure field over the Northern Hemisphere.<br />
Modern data assimilation systems have the potential to improve upon these maps, but prior to 1948, few digitized<br />
upper-air sounding observations are available for such a ―reanalysis.‖ CIRES scientists have investigated the<br />
possibility that the quantity of newly recovered surface-pressure observations is sufficient to generate useful reanalyses<br />
of at least the lower-tropospheric circulation back to 1900. Surprisingly, they have found that with an<br />
Ensemble Kalman Filter that blends an ensemble of six-hour numerical weather prediction model forecasts with the<br />
available observations, one can produce high-quality reanalyses of even the upper troposphere using only surface<br />
pressure observations. For the beginning of the 20th century, the errors of such upper-air circulation maps over the<br />
Northern Hemisphere in winter would be comparable to the two- to three-day errors of modern weather forecasts.<br />
Under this project, the Ensemble Filter <strong>and</strong> newly gathered surface-pressure observations are being used to produce<br />
the first-ever reanalysis data set for the period 1892-2007. This will nearly double the record of six-hourly<br />
tropospheric gridded fields from 60 years to 116, spanning a period for which no gridded upper-air analyses are<br />
currently available. These tropospheric circulation fields will also be the first to have objective uncertainty estimates<br />
for every variable. Initial results from the reanalysis fields spanning the period 1918-1949 are very encouraging.<br />
PSD02: Underst<strong>and</strong>ing <strong>and</strong> Predicting Sub-seasonal Variations <strong>and</strong> their Implications for<br />
Longer-Term Climate Variability<br />
GOAL:<br />
Investigate the variability <strong>and</strong> predictability of weekly averages of the atmospheric circulation through modeling<br />
<strong>and</strong> diagnosis of the observed statistics, <strong>and</strong> also through detailed analysis of numerical weather forecast ensembles<br />
for Week Two.<br />
MILESTONE PSD02.1:<br />
Investigate the variability <strong>and</strong> predictability of extra-tropical sub-seasonal variations in all seasons<br />
of the year using a linear empirical-dynamical model that includes both tropical <strong>and</strong> stratospheric<br />
influences. Assess the predictability from deterministic as well as probabilistic perspectives,<br />
particularly in regard to the case-by-case <strong>and</strong> regime-dependent variations of predictability.<br />
52
<strong>Theme</strong> report: Climate System Variability<br />
ACCOMPLISHMENTS FOR PSD02.1:<br />
The relative impacts of tropical diabatic heating <strong>and</strong> stratospheric circulation anomalies on wintertime extra-tropical<br />
tropospheric variability have been investigated in a linear inverse model (LIM) derived from the observed zero-lag<br />
<strong>and</strong> five-day lag covariances of seven-day running-mean departures from the annual cycle. Analysis of interactions<br />
among the LIM‘s variables shows that tropical diabatic heating greatly enhances persistent variability over most of<br />
the Northern Hemisphere, whereas stratospheric effects are largely confined to the polar region. Over the North<br />
Atlantic, both effects are important, although some of the stratospheric influence is ultimately traceable to tropical<br />
forcing. In general, the tropically forced anomalies extend through the depth of the troposphere <strong>and</strong> into the<br />
stratosphere, whereas stratospherically generated anomalies tend to be largest at the surface <strong>and</strong> relatively weak at<br />
mid-tropospheric levels. Overall, tropical influences are generally found to be larger than stratospheric influences on<br />
extra-tropical tropospheric variability, <strong>and</strong> to have a pronounced impact on the persistent, <strong>and</strong> therefore the<br />
potentially predictable, portion of that variability<br />
MILESTONE PSD02.2:<br />
Develop an empirical-dynamical coupled atmosphere-ocean model of tropical subseasonal<br />
variations.<br />
ACCOMPLISHMENTS FOR PSD02.2:<br />
The impacts of air-sea coupling on the predictability of weekly variations of tropical SST <strong>and</strong> atmospheric<br />
circulation <strong>and</strong> diabatic heating have been investigated in a coupled linear inverse model (C-LIM). The C-LIM<br />
accurately reproduces the observed power spectra of both SST <strong>and</strong> the atmospheric variables. It is found that<br />
coupling SST to the atmosphere has a pronounced impact on interannual variability but only a minor effect on<br />
intraseasonal variability, acting to slightly lengthen propagation <strong>and</strong> persistence timescales.<br />
MILESTONE PSD02.3:<br />
Investigate tropical intra-seasonal variability using ocean OGCMs, with emphasis on the impact of<br />
multiple MJO events on the ocean.<br />
ACCOMPLISHMENTS FOR PSD02.3:<br />
Effects of atmospheric intra-seasonal oscillations (ISOs) on the Indian Ocean zonal dipole mode (IOZDM) were<br />
investigated by analyzing available observations <strong>and</strong> a suite of solutions to an ocean general circulation model,<br />
namely, the Hybrid Coordinate Ocean Model (HYCOM). Data <strong>and</strong> model solutions for the period 1991-2000 were<br />
analyzed, a period that includes two strong IOZDM events, during 1994 <strong>and</strong> 1997, <strong>and</strong> a weak one, in 1991. Both<br />
the data analysis <strong>and</strong> model results suggest that atmospheric ISOs played a significant role in causing irregularity of<br />
the two strong IOZDM events <strong>and</strong> the premature termination of the weak one.<br />
GMD04: Climate Forcing<br />
GOAL:<br />
(i) Greenhouse gases: Conduct research to underst<strong>and</strong> better the interactions of the atmosphere with the l<strong>and</strong> <strong>and</strong><br />
ocean. (ii) Aerosols: Characterize the means, variabilities, <strong>and</strong> trends of climate-forcing properties for different<br />
types of aerosols, <strong>and</strong> underst<strong>and</strong> the factors that control these properties. (iii) Radiation: Research into broadb<strong>and</strong><br />
irradiance to improve benchmarks for climatic processes.<br />
MILESTONE GMD04.1:<br />
Merge mesoscale model B-RAMS with global transport model TM5.<br />
ACCOMPLISHMENTS FOR GMD04.1:<br />
Work has begun on merging these two models. Custom boundary conditions have been created with TM5 for use<br />
with B-RAMS. The B-RAMS team is currently implementing these parameters within their model.<br />
MILESTONE GMD04.2:<br />
Begin measurements of Radon-222 at two tower sites in the continental U.S.<br />
53
<strong>Theme</strong> report: Climate System Variability<br />
ACCOMPLISHMENTS FOR GMD04.2:<br />
Two Radon-222 sensors, collecting data at half-hourly resolution, have been installed at the NOAA/GMD tall-tower<br />
at Moody, TX, (site-code, WKT) <strong>and</strong> at the DOE ARM Southern Great Plains site (site-code, SGP).<br />
MILESTONE GMD04.3:<br />
Implement following carbon flux emissions models for use within GMD Ensemble Kalman Filter<br />
Carbon Data Assimilation System: Fire, fossil fuel <strong>and</strong> ocean carbon.<br />
ACCOMPLISHMENTS FOR GMD04.3:<br />
Fire, fossil fuel <strong>and</strong> ocean carbon modules were implemented with the ensemble Kalman filter system (commonly<br />
referred to as CarbonTracker. http://www.esrl.noaa.gov/gmd/ccgg/carbontracker). This website contains detailed<br />
output of national <strong>and</strong> global carbon fluxes, <strong>and</strong> the atmospheric CO2 concentrations consistent with those fluxes, as<br />
produced by the model. There are also general <strong>and</strong> detailed explanations of the modeling system. This<br />
documentation <strong>and</strong> all the model outputs are available for public download.<br />
MILESTONE GMD04.4:<br />
Implement full description of 14 CO2 (radio-carbon) within TM5 global transport model, for<br />
simulation of North American <strong>and</strong> global 14 CO2 measurements.<br />
ACCOMPLISHMENTS FOR GMD04.4:<br />
A full description of 14 CO2 (radiocarbon) has been implemented with the global model TM5. The model has been<br />
tested against 14 CO2 observations in both North America <strong>and</strong> Siberia, <strong>and</strong> has performed very well.<br />
MILESTONE GMD04.5:<br />
Establish two new tall-tower sites in the NOAA/GMD North American Carbon <strong>Observing</strong> System<br />
(Carbon America).<br />
ACCOMPLISHMENTS FOR GMD04.5:<br />
Two new tall-tower sites were established during FY07, one near Boulder, CO, using a 300-m tall NOAA research<br />
tower <strong>and</strong> the other near West Branch, IA using a privately owned >400-m television transmission tower.<br />
Continuous in-situ Carbon Dioxide/Carbon Monoxide mixing ratios <strong>and</strong> regular air samples (analyzed in Boulder<br />
for up to 40 atmospheric trace gas species) are publicly available <strong>and</strong> are being used as part of the CarbonTracker<br />
system mentioned above.<br />
MILESTONE GMD04.6:<br />
Complete development of automated quality control algorithms.<br />
ACCOMPLISHMENTS FOR GMD04.6:<br />
Work is ongoing, but continued funding restrictions are delaying completion of these automated algorithms.<br />
MILESTONE GMD04.7:<br />
Develop <strong>and</strong> field test a temperature/humidity/GPS system to augment current trace gas vertical<br />
profile measurements in the NOAA/GMD Carbon America aircraft network (allowing for<br />
automated measurements of the ambient temperature <strong>and</strong> humidity <strong>and</strong> the position <strong>and</strong> altitude<br />
of each sample in a vertical profile); <strong>and</strong> install systems at five sites.<br />
ACCOMPLISHMENTS FOR GMD04.7:<br />
The current system has been installed <strong>and</strong> is operating at five sites in the NOAA/ESRL/GMD Carbon America<br />
aircraft network. GPS position/height data <strong>and</strong> ambient temperature, pressure, humidity data are part of the auxiliary<br />
data stream for these aircraft-based trace-gas measurements.<br />
MILESTONE GMD04.8:<br />
Field test new automated carbon dioxide analyzer systems aboard the small-aircraft platforms<br />
used in the NOAA/GMD Carbon America aircraft network.<br />
54
<strong>Theme</strong> report: Climate System Variability<br />
ACCOMPLISHMENTS FOR GMD04.8:<br />
This system has been field tested aboard the locally based aircraft used for sampling near Carr, CO, <strong>and</strong> was<br />
successfully operated aboard a Purdue University research aircraft around <strong>and</strong> over Iowa as part of a<br />
NOAA/CIRES/Purdue collaboration during the Mid-Continent Intensive (MCI) project (part of the North American<br />
Carbon Program) during the early summer 2007. Data <strong>and</strong> results from the MCI experiment will be used in a<br />
significant portion of a graduate thesis project at Purdue University <strong>and</strong> is available to the MCI collaboration in<br />
conjunction with all data collected as part of this field campaign.<br />
MILESTONE GMD04.9:<br />
Establish two new overseas sampling sites in the long-term NOAA/GMD Cooperative Global<br />
Atmospheric Sampling Network.<br />
ACCOMPLISHMENTS FOR GMD04.9:<br />
Two new overseas sampling sites were established in Mexico during FY07. The air samples from these sites will be<br />
analyzed <strong>and</strong> the data made available as part of the long-term NOAA/ESRL/GMD Cooperative Global Atmospheric<br />
Sampling Network.<br />
MILESTONE GMD04.10:<br />
Modify an existing spectro-radiometer as well as develop algorithms for the instrument to<br />
measure wavelength-dependent aerosol optical properties throughout the shortwave spectrum.<br />
ACCOMPLISHMENTS FOR GMD04.10:<br />
Modification of an existing spectro-radiometer, as well as development of algorithms for the instrument to measure<br />
wavelength-dependent aerosol optical properties throughout the shortwave spectrum, will be continued.<br />
Algorithm development for the retrieval of high spectral resolution aerosol properties has progressed through<br />
modeling of the sensitivity of the wavelength-dependence of aerosol properties for different aerosol types.<br />
Correlations with commonly observed wavelengths provide the information contained in portions of the spectrum<br />
that are not typically available from routine measurements. This information provides guidance for the deployment<br />
<strong>and</strong> processing of data from spectral instruments in the future. Data obtained from spectro-radiometer shows<br />
features that are not evident in routine measurements at limited wavelengths. A sensitivity analysis using a radiative<br />
transfer model is used to show the variability in aerosol properties that may produce these features. This analysis<br />
shows the utility of spectral measurements in the field on a routine basis. These results will be presented at the<br />
CIRES‘ Innovative Research Program Poster Session <strong>and</strong>, if accepted, at the Fall 2007 AGU Meeting. A manuscript<br />
is in progress.<br />
MILESTONE GMD04.11:<br />
Deploy a counter-flow virtual impactor (CVI) to two locations. The first location is in the United<br />
Kingdom downstream of an urban environment. The second deployment is onboard an aircraft.<br />
ACCOMPLISHMENTS FOR GMD04.11:<br />
A CVI was successfully employed at Holme Moss in the United Kingdom in November 2006. The site was very<br />
polluted as indicated by the amount of absorbing aerosol. Data analysis is on-going, but preliminary results show a<br />
distinct difference in the fractional soot content of interstitial <strong>and</strong> cloud drop residuals, with the interstitial fractional<br />
soot content being about a factor of ten higher than that of cloud drop residuals. Initial results from this project will<br />
be presented at the AAAR conference in Reno, NV, at the end of September 2007.<br />
A CVI was also deployed on the Battelle G-1 in June 2007 to investigate differences in aerosol properties within <strong>and</strong><br />
outside of clouds. Again, data analysis is on-going. Preliminary findings show that the chemistry of the cloud drop<br />
residuals (as indicated by the sulfate-to-organic-aerosol-mass ratio) was quite different from that of the ambient<br />
aerosol. Ambient aerosol particles tended to contain more organics than sulfates, while cloud drop residuals showed<br />
the opposite tendency <strong>and</strong> were dominated by sulfate material. Preliminary results from this project will be<br />
presented at the AGU conference in San Francisco, CA in early December 2007.<br />
55
<strong>Theme</strong> report: Climate System Variability<br />
CSV-03: Stratospheric Ozone Depletion<br />
CSD04: Tropospheric <strong>and</strong> Stratospheric Transport <strong>and</strong> Chemical Transformation<br />
GOAL:<br />
(i) Improve theoretical capabilities to predict the natural <strong>and</strong> human influences on the stratospheric ozone layer. (ii)<br />
Characterize the photochemical reactions relating to the human-induced loss of ozone in the stratosphere. (iii)<br />
Carry out in-situ studies of the photochemical <strong>and</strong> dynamical processes that influence the stratospheric ozone layer.<br />
MILESTONE CSD04.1:<br />
Underst<strong>and</strong> transport processes associated with the sub-tropical jet stream, both by analysis of<br />
airborne <strong>and</strong> dropsonde data <strong>and</strong> by high-resolution modeling.<br />
ACCOMPLISHMENTS FOR CSD04.1:<br />
The transport of air between regions of the atmosphere (troposphere <strong>and</strong> stratosphere) <strong>and</strong> across latitude regions<br />
affects atmospheric composition <strong>and</strong> is thereby important to many processes involved in climate <strong>and</strong> stratospheric<br />
ozone depletion. CIRES research has shown that there is clear evidence from high-altitude aircraft observations<br />
(WB57F) in the tropical upper troposphere <strong>and</strong> lower stratosphere that air exchanges across the subtropical jet<br />
stream, between this region <strong>and</strong> the mid-latitude lower stratosphere, situated poleward [Tuck et al., 2003, 2004;<br />
Richard et al., 2006]. The research confirms that atmospheric abundances are affected significantly by the exchange<br />
processes. For example, observations of methane (a key short-lived climate gas) show depletion from tropospheric<br />
values between 12- <strong>and</strong> 16-km altitude in the tropical upper troposphere. These conclusions have been reinforced by<br />
work directly on the subtropical jet stream, using the NOAA Gulfstream 4 aircraft. The turbulent structure in the<br />
winds <strong>and</strong> tracers shows that the exchange is scale invariant, anisotropic <strong>and</strong> substantial [Ray et al., 2006; Lovejoy<br />
et al., 2007].<br />
GMD05: Ozone Depletion<br />
GOAL:<br />
(i) Stratospheric Ozone Measurements: Measure ozone declines during the past two decades at northern<br />
hemispheric midlatitudes <strong>and</strong> the tropics <strong>and</strong> to characterize dramatic ozone depletions over Antarctica. (ii) Ozone-<br />
Depleting Gases: Conduct research in the troposphere, stratosphere, oceans, polar snowpack, <strong>and</strong> terrestrial<br />
ecosystems in an effort to underst<strong>and</strong> <strong>and</strong> predict the atmospheric behavior of these gases. (iii) Stratospheric<br />
Aerosols: Conduct experiments <strong>and</strong> measurements on aerosols to determine their impacts on solar insolation. (iv)<br />
Stratospheric Water Vapor: Conduct measurements to determine the change in water vapor <strong>and</strong> its coupling with<br />
aerosols.<br />
MILESTONE GMD05.1:<br />
Measure ozone-depleting nitrous oxide (N2O) in the planetary boundary layer (PBL) of the<br />
Amazon basin during a month-long aircraft-based campaign scheduled for October 2006.<br />
Estimate the large-scale natural emissions of N2O from this region of very high primary<br />
productivity.<br />
ACCOMPLISHMENTS FOR GMD05.1:<br />
This milestone became a future objective when the Amazon project was delayed one year due to the extra time<br />
needed to obtain approval from the Brazilian government. The project is now tentatively scheduled to begin in<br />
October 2007.<br />
MILESTONE GMD05.2:<br />
A new index for assessing the changes in the atmospheric burden of ozone-depleting gases will<br />
be introduced. This Ozone Depleting Gas Index will be derived from the atmospheric<br />
measurements of ozone-depleting gases that are regularly conducted at NOAA in collaboration<br />
with CIRES personnel.<br />
56
<strong>Theme</strong> report: Climate System Variability<br />
ACCOMPLISHMENTS FOR GMD05.2:<br />
Measurements of atmospheric concentrations of ozone-depleting gases continued during the July 2006-June 2007<br />
period. Several accomplishments <strong>and</strong> products derived from these measurements:<br />
In late 2006, the Ozone Depleting Gas Index was first introduced <strong>and</strong> posted on the NOAA website. This index<br />
allows a summary of progress being made in the global effort to reduce the atmospheric burden of ozone-depleting<br />
gases. Subsequently, measurement data were updated in early 2007 that extended the index through the end of 2006.<br />
MILESTONE GMD05.3:<br />
Utilize aircraft <strong>and</strong> stratospheric balloon platforms to measure several ODSs (N2O, CFC-11,<br />
CFC-12) in the troposphere <strong>and</strong> stratosphere. These data will be used to validate measurements<br />
by space-borne instrumentation aboard the Aura satellite.<br />
ACCOMPLISHMENTS FOR GMD05.3:<br />
Nitrous oxide (N2O) was measured in situ aboard the Unmanned Aircraft System (UAS) Altair by an automated gas<br />
chromatograph during the October 2006 NASA-USDA Forest Service Fire Mission. Vertical profiles of N2O were<br />
obtained between the middle troposphere <strong>and</strong> lower stratosphere during numerous spiral ascent/descent maneuvers<br />
of the aircraft. These (<strong>and</strong> other) vertical profile data obtained during the mission have been compared to the vertical<br />
profiles retrieved from near-coincident soundings of the Microwave Limb Sounder (MLS) <strong>and</strong> Tropospheric<br />
Emission Spectrometer (TES) aboard the NASA Aura satellite. A stratospheric balloon platform was not available<br />
for CIRES/NOAA instruments during this report period.<br />
CSD06 : Turbulent Meteorological Motions<br />
CSV-04: Climate Dynamics<br />
GOAL:<br />
Underst<strong>and</strong> the mechanisms <strong>and</strong> effects by which turbulence influences atmospheric chemistry, composition,<br />
radiation, <strong>and</strong> transport on all scales, from that of molecular diffusion to that of the globe, some nine orders of<br />
magnitude.<br />
MILESTONE CSD06.1:<br />
Continue efforts to link, via high-resolution observations, the macroscopic theory of scale<br />
invariance with molecular-scale non-equilibrium statistical mechanics; examine the implications<br />
for the definition of atmospheric temperature in the horizontal with aircraft data <strong>and</strong> in the vertical<br />
with dropsonde data.<br />
ACCOMPLISHMENTS FOR CSD06.1:<br />
The work has reached the stage of presentable syntheses, which either have been published this year, are in press or<br />
have been submitted. The case has been established that the molecular dynamics of the population of air molecules<br />
in an anisotropic environment leads to the emergence of vorticity on very short time <strong>and</strong> space scales, picoseconds<br />
<strong>and</strong> nanometers. In turn, this generation of vorticity on very small scales has implications for radiative transfer <strong>and</strong><br />
for atmospheric chemistry; turbulent dynamics, radiation <strong>and</strong> chemistry are coupled at the molecular level, in a way<br />
that is not compatible with the widely used assumption of local thermodynamic equilibrium. Atmospheric<br />
temperature is not proportional to the width of a Maxwell-Boltzmann distribution of molecular speeds – there is an<br />
overpopulation of translationally hot air molecules, largely but not wholly maintained by photo-fragments from<br />
ozone photo-dissociation.<br />
PSD03: Empirical <strong>and</strong> Process Studies<br />
GOAL:<br />
Improve underst<strong>and</strong>ing of basic physical processes that contribute to climate variability across a broad spectrum of<br />
scales, with emphasis on (i) moist atmospheric convection, (ii) radiative transfer in cloudy areas, <strong>and</strong> (iii) air-sea<br />
interaction.<br />
57
<strong>Theme</strong> report: Climate System Variability<br />
MILESTONE PSD03.1:<br />
Continue improving the representation of physical processes <strong>and</strong> the Madden-Julian Oscillation<br />
(MJO) in the NCEP Global Forecasting System (GFS).<br />
ACCOMPLISHMENTS FOR PSD03.1:<br />
To put the MJO errors of the NCEP/GFS in context, a comprehensive study of the fidelity of the MJO in fourteen<br />
coupled general circulation models (GCMs) participating in the Intergovernmental Panel on Climate Change (IPCC)<br />
Fourth Assessment Report (AR4) was conducted. Eight years of daily precipitation from each model‘s 20th-century<br />
climate simulation were analyzed <strong>and</strong> compared with daily satellite-retrieved precipitation. Space-time spectral<br />
analysis was used to obtain the variance <strong>and</strong> phase speed of the dominant convectively coupled equatorial waves.<br />
The results show that all current state-of-the-art GCMs have significant problems in simulating tropical intraseasonal<br />
variability. The total intra-seasonal (2-128 day) variance of precipitation is too weak in most of the models.<br />
About half of the models have signals of convectively coupled equatorial waves. However, their variances are<br />
generally too weak. The MJO variance approaches the observed value in only two of the fourteen models, <strong>and</strong> is less<br />
than half of the observed value in the other twelve models. Moreover, the MJO variance in thirteen of the fourteen<br />
models does not come from a pronounced spectral peak, but rather from part of an over-reddened spectrum, which<br />
in turn is associated with too strong persistence of equatorial precipitation. The two models that arguably do best at<br />
simulating the MJO are the only ones having convective closures/triggers linked to moisture convergence.<br />
MILESTONE PSD03.2:<br />
Diagnose the physical mechanisms behind the tropical biases in current GCMs, such as double-<br />
ITCZ, ENSO, <strong>and</strong> MJO.<br />
ACCOMPLISHMENTS FOR PSD03.2:<br />
A study examining the double-ITCZ problem in the coupled general circulation models (CGCMs) participating in<br />
the IPCC‘s Fourth Assessment Report (AR4) was completed. Twentieth century climate simulations of 22 IPCC<br />
AR4 CGCMs were analyzed, together with the available ―AMIP‖ (i.e., prescribed SST) runs from 12 of them. To<br />
underst<strong>and</strong> the physical mechanisms contributing to the double-ITCZ problem, the main ocean-atmosphere<br />
feedbacks, including the zonal sea surface temperature (SST) gradient−trade wind feedback (or Bjerknes feedback),<br />
the SST−surface latent heat flux (LHF) feedback, <strong>and</strong> the SST−surface shortwave flux (SWF) feedback, were<br />
studied in detail. The results show that most of these CGCMs have a double-ITCZ problem, which is characterized<br />
by excessive off-equatorial <strong>and</strong> insufficient equatorial precipitation over much of the tropics. The excessive offequatorial<br />
precipitation causes overly strong trade winds, excessive LHF <strong>and</strong> insufficient SWF, leading to<br />
significant cold SST bias in much of the tropical oceans. Most of the models also simulate insufficient latitudinal<br />
asymmetry in precipitation <strong>and</strong> SST over the eastern Pacific <strong>and</strong> Atlantic Oceans. The ―AMIP‖ runs also produce<br />
excessive precipitation over much of the tropics, which also lead to overly strong trade winds, excessive LHF <strong>and</strong><br />
insufficient SWF. This suggests that the excessive tropical precipitation is an intrinsic error of the atmospheric<br />
component of the coupled models, <strong>and</strong> that the insufficient equatorial Pacific precipitation in the coupled models is<br />
due to errors in ocean-atmosphere feedbacks. These feedback errors are of three types: (1) excessive Bjerknes<br />
feedback, which is caused by excessive sensitivity of precipitation to SST <strong>and</strong> overly strong time-mean surface<br />
winds; (2) overly positive SST-LHF feedback, which is caused by excessive sensitivity of surface air humidity to<br />
SST; <strong>and</strong> (3) insufficient SST-SWF feedback, which is caused by insufficient sensitivity of cloud amount to<br />
precipitation. Off the equator over the eastern Pacific stratus region, most of the models produce insufficient stratus-<br />
SST feedback associated with insufficient sensitivity of stratus cloud amount to SST, which may contribute to the<br />
insufficient latitudinal asymmetry of SST in their coupled runs. These results suggest that the double-ITCZ problem<br />
in CGCMs may be alleviated by reducing the excessive tropical precipitation <strong>and</strong> the above-feedback-relevant errors<br />
in the atmospheric models.<br />
MILESTONE PSD03.3:<br />
Investigate improved methods of representing subgrid-scale variability in clouds <strong>and</strong> radiative<br />
transfer in weather <strong>and</strong> climate models, conceptually as a series of sub-columns within a GCM's<br />
large-scale column. Explore connections with more traditional single-column parameterizations as<br />
well as "super-parameterizations" being developed by other researchers.<br />
58
<strong>Theme</strong> report: Climate System Variability<br />
ACCOMPLISHMENTS FOR PSD03.3:<br />
A new method for representing subgrid-scale cloud structure in which each model column is decomposed into a set<br />
of sub-columns has been introduced into the Geophysical Fluid Dynamics Laboratory‘s global atmospheric model<br />
AM2. Each sub-column in the decomposition is homogeneous, but the ensemble reproduces the initial profiles of<br />
cloud properties, including cloud fraction, internal variability (if any) in cloud condensate, <strong>and</strong> arbitrary overlap<br />
assumptions that describe vertical correlations. These sub-columns are used in radiation <strong>and</strong> diagnostic calculations<br />
<strong>and</strong> have allowed the introduction of more realistic overlap assumptions.<br />
MILESTONE PSD03.4:<br />
Assess stochastic influences on climate variability <strong>and</strong> predictability, through (a) linear <strong>and</strong><br />
nonlinear inverse modeling, <strong>and</strong> (b) development <strong>and</strong> implementation of stochastic<br />
parameterizations in weather <strong>and</strong> climate models.<br />
ACCOMPLISHMENTS FOR PSD03.4:<br />
A study of the impacts of state-dependent stochastic heat fluxes on daily-to-decadal-scale extra-tropical SST<br />
variability was completed. The classic view of extra-tropical air-sea interaction assumes that the surface heat flux<br />
can be simply parameterized as noise associated with atmospheric variability plus a linear temperature relaxation<br />
rate. This study suggests, however, that rapid fluctuations in the relaxation rate, expected for example from the<br />
gustiness of the surface winds, cannot be ignored. Such fluctuations are in general not independent of the SST<br />
anomalies themselves. Accounting for the SST-dependence can affect both the persistence <strong>and</strong> the likelihood of<br />
high-amplitude SST anomalies. To test this hypothesis, daily observations at several Ocean Weather Stations<br />
(OWSs) were examined. Significant skewness <strong>and</strong> kurtosis of the SST probability distributions were found,<br />
consistent with the SST-dependence of the amplitude of the noisy fluxes. The analysis shows that the SSTdependent<br />
noise increases the persistence, predictability, <strong>and</strong> variance of extra-tropical SST anomalies. The effect is<br />
strongest on annual <strong>and</strong> longer time scales <strong>and</strong> may, therefore, be important for underst<strong>and</strong>ing <strong>and</strong> modeling interannual<br />
<strong>and</strong> inter-decadal SST <strong>and</strong> related climate variations.<br />
PSD06: Climate Dynamics<br />
GOAL:<br />
Conduct research to improve underst<strong>and</strong>ing of (i) tropical Pacific Ocean dynamical processes related to the subseasonal<br />
atmospheric variability, (ii) the dynamics <strong>and</strong> the microphysics of precipitating cloud systems, <strong>and</strong> (iii)<br />
atmospheric circulation, convection, <strong>and</strong> moisture <strong>and</strong> heat budgets associated with the El Niño phenomenon.<br />
MILESTONE PSD06.1:<br />
Retrieve the vertical profile of raindrop size distributions from 50-MHz, 920-MHz, <strong>and</strong> 2835-MHz<br />
profiling radar observations collected during the Tropical Western Pacific–International Cloud<br />
Experiment (TWP-ICE) conducted in Darwin, Australia, in January-February 2006. The profilerretrieved<br />
raindrop size distributions <strong>and</strong> their estimated uncertainties will be used to quantify the<br />
error characteristics of differential reflectivity measurements from simultaneous C-b<strong>and</strong><br />
polarimetric scanning radar observations made over the profiler site.<br />
ACCOMPLISHMENTS FOR PSD06.1:<br />
Wind profiler data collected during the Tropical Western Pacific–International Cloud Experiment (TWP-ICE)<br />
conducted in Darwin, Australia, were used to estimate the vertical air motion <strong>and</strong> the raindrop-size distribution<br />
(DSD) from near the surface to just under the freezing level. The retrieved DSDs were compared with a rainshaft<br />
microphysics model, <strong>and</strong> the inter-comparison verified that the dynamical evolution of the DSD with altitude during<br />
stratiform rain can be quantified by a stochastic advection-coalescence-breakup equation. Also, the profiler-retrieved<br />
DSDs were compared with simultaneous polarimetric C-b<strong>and</strong> scanning-radar observations made over the profiler<br />
site <strong>and</strong> the analysis indicated that the measurement errors from both radars were less than the statistical errors of<br />
estimating the median drop diameter <strong>and</strong> rainrate using polarimetric power-law regressions.<br />
MILESTONE PSD06.2:<br />
Analyze multi-frequency profiler observations <strong>and</strong> multi-frequency polarimetric scanning radar<br />
observations collected during the Front Range Pilot Study in Colorado to determine the error<br />
59
<strong>Theme</strong> report: Climate System Variability<br />
characteristics of Quantitative Precipitation Estimates (QPEs). The use of normalized raindrop<br />
size distributions will be investigated as a means of describing the profiling <strong>and</strong> scanning radar<br />
retrieved raindrop size distributions.<br />
ACCOMPLISHMENTS FOR PSD06.2:<br />
Surface disdrometer, multi-frequency profiler, <strong>and</strong> multi-frequency polarimetric scanning radar observations from<br />
the Front Range Pilot Study were analyzed to quantify the temporal <strong>and</strong> spatial variability of the normalized<br />
raindrop size distribution parameters retrieved by the three types of instruments. These parameters are used in<br />
Quantitative Precipitation Estimates (QPEs) <strong>and</strong> are inputs into numerical weather forecast models. Dr. Anthony<br />
Illingworth from Reading University, United Kingdom, spent three months of his sabbatical at CIRES/ESRL<br />
working on this problem. Two conference presentations were made on this topic <strong>and</strong> a peer-reviewed manuscript<br />
will be submitted in September 2007. Also, analysis of the multi-frequency profiler observations during the North<br />
American Monsoon Experiment (NAME) revealed differences in the vertical structure of reflectivity during<br />
stratiform rain between the ground-based profiler <strong>and</strong> the satellite-based NASA Tropical Rainfall Measuring<br />
Mission (TRMM) precipitation radar indicating a possible bias in the satellite retrieval algorithm.<br />
MILESTONE PSD06.3:<br />
Investigate the effect of coupled vs. decoupled lower-tropospheric flow over the East Pacific Cold<br />
Tongue on equatorially trapped waves over the East Pacific.<br />
ACCOMPLISHMENTS FOR PSD06.3:<br />
Previous work [Hartten <strong>and</strong> Datulayta, 2004] had shown that decoupled lower-tropospheric flow over the Galapagos<br />
occurred with SST24°C. In an attempt to identify periods when<br />
SSTs were inside that 23-24°C range, CIRES scientists examined 1994 to 2003 SST data from six near-equatorial<br />
TAO buoys along 95°W <strong>and</strong> 110°W. Our results showed that SSTs between 23ºC <strong>and</strong> 24ºC were less frequent at the<br />
2°N buoys, during strong El Niño periods, <strong>and</strong> in the middle of cold (July to October) <strong>and</strong> warm (February to May)<br />
seasons.<br />
PSD15: Surface Processes<br />
GOAL:<br />
Develop <strong>and</strong>/or improve physical representations of atmosphere-surface interactions.<br />
MILESTONE PSD15.1:<br />
Examine the role of artificial correlation in data analysis of turbulent Pr<strong>and</strong>tl number.<br />
ACCOMPLISHMENTS FOR PSD15.1:<br />
Measurements of atmospheric turbulence made during the Surface Heat Budget of the Arctic Ocean Experiment<br />
(SHEBA) have been used to examine the behavior of the turbulent Pr<strong>and</strong>tl number, Prt, in the stable atmospheric<br />
boundary layer (SBL) over the Arctic pack ice. It is found that Prt increases with increasing stability if Prt is plotted<br />
versus gradient Richardson number, Ri; but at the same time, Prt decreases with increasing stability if Prt is plotted<br />
versus flux Richardson number, Rf, or versus z/L. This paradoxical behavior derives from the fact that plots of Prt<br />
versus Ri (as well as versus Rf <strong>and</strong> z/L) have built-in correlation (or self-correlation) because of the shared<br />
variables. For independent estimates of how Prt behaves in the SBL, Prt is plotted against the bulk Richardson<br />
number; such plots have no built-in correlation. These plots show that, on the average, Prt decreases with increasing<br />
stability <strong>and</strong> Prt
<strong>Theme</strong> report: Climate System Variability<br />
of the critical factors for explaining the very high levels of nitric oxide [NO] found in past field experiments at the<br />
South Pole. The use of a tethered balloon profiling wind, temperature, NO, <strong>and</strong> ozone provided for a detailed<br />
interpretation of sodar data for the period December 12-30, 2003. For the same period, sonic anemometer 2-m<br />
turbulence measurements, averaged to 0.5 h, linked surface processes to the evolution of the boundary layer in<br />
response to changing radiative balance <strong>and</strong> synoptic weather changes. A mixing-layer detection method was<br />
developed <strong>and</strong> applied to half-hour average sodar amplitude profiles for the period November 23 – December 30,<br />
2003. These data also allowed for testing of simple diagnostic equations for the mixing-layer depth as well as<br />
estimates of vertical diffusion rates under stable conditions, the latter being important for the effective depth of the<br />
mixing layer vis-à-vis the nonlinear NO chemistry postulated from earlier analyses. With the extended sampling<br />
period, two sub-seasonal regimes were examined: (1) a late-December period, with the full suite of supporting<br />
measurements, where the earlier results that shallow mixing layers associated with light winds <strong>and</strong> strong surface<br />
stability can be among the dominant factors leading to high NO levels, were repeated <strong>and</strong> (2) a late-November<br />
period that revealed additional complexities with very high NO concentrations appearing at times in concert with<br />
higher winds, weaker surface stability, <strong>and</strong> deeper mixing layers. The latter results are only consistent with a more<br />
complicated picture of how NO can build to very high levels that involves invoking the previously expressed<br />
dependence of elevated NO levels on nonlinear NOx (NOx = NO+NO2) chemistry, greater fluxes of NOx from the<br />
snowpack than previously observed at the South Pole, <strong>and</strong> the potential for enhanced NOx accumulation effects<br />
involving air parcels draining off the high plateau. The results of ANTCI from 2003 thus argue for more complete<br />
future observations of boundary layer conditions over the high Antarctic Plateau <strong>and</strong> determination of the spatial <strong>and</strong><br />
temporal variability of snow nitrate concentrations over the high plateau <strong>and</strong> their relation to NO recycling <strong>and</strong> the<br />
snow accumulation/ablation/erosion cycle.<br />
MILESTONE PSD15.3:<br />
Install an "HMT Mesonet" to enhance surface observations in the American River Basin to try to<br />
trace the radar <strong>and</strong> free-air meteorology to what actually happens on the ground surface <strong>and</strong> gets<br />
into the streams. This will include more snow measurements <strong>and</strong> surface precipitation<br />
measurements <strong>and</strong> some soil <strong>and</strong> radiation measurements.<br />
ACCOMPLISHMENTS FOR PSD15.3:<br />
The maritime mountain ranges of western North America span a wide range of elevations <strong>and</strong> are extremely<br />
sensitive to flooding from warm, winter storms, primarily because rain falls at higher elevations <strong>and</strong> over a much<br />
greater fraction of a basin‘s contributing area than during a typical storm. Accurate predictions of this rain-snow line<br />
are crucial to hydrologic forecasting. This study examines how remotely sensed atmospheric snow levels measured<br />
upstream of a mountain range (specifically, the brightb<strong>and</strong> measured above radar wind profilers) can be used to<br />
portray accurately the altitude of the surface transition from snow to rain along the mountain‘s windward slopes,<br />
focusing on measurements in the Sierra Nevada, California, from 2001-2005. Snow accumulation varies with<br />
respect to surface temperature, diurnal cycles in solar radiation, <strong>and</strong> fluctuations in the free-tropospheric melting<br />
level. At 1.5°C, 50% of precipitation events fall as rain <strong>and</strong> 50% as snow, <strong>and</strong> on average, 50% of measured<br />
precipitation contributes to increases in SWE. Between 2.5 <strong>and</strong> 3°C, snow is equally likely to melt or accumulate,<br />
with most cases resulting in no change to SWE. Qualitatively, brightb<strong>and</strong> heights (BBHs) detected by 915-MHz<br />
profiling radars up to 300 km away from the American River study basin agree well with surface-melting patterns.<br />
Quantitatively, this agreement can be improved by adjusting the melting elevation based on the spatial location of<br />
the profiler relative to the basin: BBHs decrease with increasing latitude <strong>and</strong> decreasing distance to the windward<br />
slope of the Sierra Nevada. Because of diurnal heating <strong>and</strong> cooling by radiation at the mountain surface, BBHs<br />
should also be adjusted to higher surface elevations near midday <strong>and</strong> lower elevations near midnight.<br />
MILESTONE PSD15.4:<br />
Compare soil moisture measurements with river gage height <strong>and</strong> precipitation events in the<br />
Russian River Basin of Northern California. Investigate how the correlation between precipitation<br />
<strong>and</strong> river flow changes after the soil has reached field capacity.<br />
ACCOMPLISHMENTS FOR PSD15.4:<br />
An analysis of soil moisture <strong>and</strong> river gauge data taken in the Russian River Basin of Northern California has been<br />
completed. One notable case analyzed occurred during December 2005 in the basin. All of the soil moisture stations<br />
located in the basin at Healdsburg, Rio Nido, <strong>and</strong> Cazadero showed that the soil was extremely dry in early<br />
December. Stream flows were at or below seasonal norms. Large-scale synoptic weather systems began bringing<br />
61
<strong>Theme</strong> report: Climate System Variability<br />
significant amounts of precipitation into the region shortly after December 15. These storms began the process of<br />
slowly saturating the soil, <strong>and</strong> flows in the Russian River <strong>and</strong> the Austin Creek tributary began rising slowly. Each<br />
subsequent precipitation event brought the soils up to field capacity, which occurred just before Christmas Day. At<br />
that time, the soil could no longer absorb water, <strong>and</strong> all the precipitation falling into the basin quickly made its way<br />
into the basin‘s streams <strong>and</strong> rivers. A major synoptic-scale cyclone began making its way into the Coastal<br />
Mountains around December 29. On December 31, the Russian River crested near 25 ft at Healdsburg, nearly six ft<br />
above flood stage. Later that day, the River crested at 43 feet at Guerneville, twelve ft over flood stage. Major<br />
portions of the town of Guerneville were flooded <strong>and</strong> California Highway 116 was closed by the event.<br />
CSV-05: Climate Research Database Development<br />
NSIDC01: Digitizing Analog Cryospheric Data under the Climate Database Modernization<br />
Program<br />
GOAL:<br />
Scan <strong>and</strong> make available on-line data from NSIDC’s analogue collections so that it is more easily located, browsed,<br />
<strong>and</strong> obtained by users.<br />
MILESTONE NSIDC01.1:<br />
Complete metadata entry for the several thous<strong>and</strong> scanned images now at NSIDC, <strong>and</strong> post the<br />
images on-line.<br />
ACCOMPLISHMENTS FOR NSIDC01.1:<br />
A total of 401 glacier photographs were added to the Online Glacier Photograph Database. In addition, a new<br />
Climate Database Modernization Project task, Discovery <strong>and</strong> Access of Historical Literature of the IPYs (DAHLI),<br />
digitized 52 books <strong>and</strong> approximately 1300 IGY glacier photographs.<br />
NSIDC02: Observations for SEARCH–Data Integration for Arctic Reanalysis <strong>and</strong> Change<br />
Detection<br />
GOAL:<br />
"Unaami," the changes in the Arctic that are the subject of the Study of Environmental Arctic Change (SEARCH)<br />
program, became apparent to researchers in the context of long-term <strong>and</strong> pan-Arctic observations. This work aims<br />
to assess what data are relevant to SEARCH reanalysis <strong>and</strong> change-detection activities, collect these data from a<br />
wide variety of sources, <strong>and</strong> facilitate the SEARCH research community's access to the data. Another key element<br />
of the effort is to assess the Arctic performance of existing atmospheric reanalyses, with the aim of identifying<br />
shortcomings that will need to be addressed in developing a dedicated Arctic System Reanalysis (ASR). Note that<br />
this work is funded through Task III, rather than Task II.<br />
MILESTONE NSIDC02.1:<br />
Report on the Indicator work in appropriate venues, <strong>and</strong> to provide data management support to<br />
the NOAA SEARCH program. (Due to funding cuts, data development efforts under this project<br />
will be in maintenance-mode in July 2006 - July 2007. It is hoped that funding will resume in<br />
FY2008.)<br />
ACCOMPLISHMENTS FOR NSIDC02.1:<br />
A presentation on the Cryospheric Climate Indicators Website <strong>and</strong> time series was given at the International<br />
Glaciological Society meeting: A joint NSIDC/NCAR data-management proposal for the Arctic <strong>Observing</strong> Network<br />
was funded by NSF. This will provide data management for some NOAA SEARCH activities.<br />
MILESTONE NSIDC02.2:<br />
Finalize ongoing assessments of the Arctic performance of the ERA-40 reanalysis. As<br />
assessments of precipitation <strong>and</strong> surface temperature are nearly complete, efforts will thus focus<br />
on other important aspects of the Arctic climate system, including its large-scale heat budget. In<br />
62
<strong>Theme</strong> report: Climate System Variability<br />
addition, output from the new JRA-25 reanalysis (from the Japan Meteorological Agency) will be<br />
examined.<br />
ACCOMPLISHMENTS FOR NSIDC02.2:<br />
A major paper was published in the Journal of Geophysical Research synthesizing a variety of atmospheric <strong>and</strong><br />
oceanic data to examine the large-scale energy budget of the Arctic. Assessment of the atmospheric budget relies<br />
primarily on the ERA-40 reanalysis. The seasonal cycles of vertically integrated atmospheric energy storage <strong>and</strong> the<br />
convergence of energy transport from ERA-40, as evaluated for the polar cap (defined by the 70°N latitude circle),<br />
in general, compare well with realizations from the NCEP/NCAR reanalysis over the period 1979-2001. However,<br />
inaccuracies in the radiation budget at the top of the atmosphere, as compared with satellite data, <strong>and</strong> the net surface<br />
flux contribute to large energy-budget residuals in ERA-40. The seasonal cycle of atmospheric energy storage is<br />
strongly modulated by the net surface flux, which is also the primary driver of seasonal changes in heat storage<br />
within the Arctic Ocean. Averaged for an Arctic Ocean domain, the July net surface flux from ERA-40 of -100 Wm -<br />
2 (i.e., into the ocean), associated with sea-ice melt <strong>and</strong> oceanic sensible heat gain, exceeds the atmospheric energy<br />
transport convergence of 91 Wm -2 . During winter, oceanic sensible heat loss <strong>and</strong> sea ice growth yield an upward<br />
surface flux of 50-60 Wm -2 , complemented with an atmospheric energy convergence of 80-90 Wm -2 to provide a net<br />
radiation loss to space of 175-180 Wm -2 .<br />
MILESTONE NSIDC02.3:<br />
Complete inter-comparisons among the Arctic performance of different l<strong>and</strong> surface packages,<br />
<strong>and</strong> identify shortcomings that will need to be addressed for the ASR.<br />
ACCOMPLISHMENTS FOR NSIDC02.3:<br />
A paper was published in the Journal of Geophysical Research comparing the performance of five l<strong>and</strong>-surface<br />
models (CHASM, Noah, CLM, VIC, ECMWF) in the simulation of hydrological processes across the terrestrial<br />
Arctic drainage system for the period 1980-2001. The models represent a wide range of model physics, particularly<br />
with respect to high-latitude processes, <strong>and</strong> are forced with surface meteorology derived from the ERA-40<br />
reanalysis. Models offer great potential for enlightenment regarding large-scale hydrology in this poorly observed<br />
region; thus, the objective is to assess the ability of the models to capture various aspects of Pan-Arctic hydrology as<br />
well as identify those features that contain the largest uncertainty. Results reveal up to a 30% difference in annual<br />
partitioning of precipitation between evaporation <strong>and</strong> runoff with major Arctic watersheds such as the Lena.<br />
Capturing the correct base-flow of the large rivers is a consistent problem. The model hydrographs are often out of<br />
phase, peaking too early in comparison to observations. However, allowing for a large uptake in soil moisture as<br />
well as moisture movement during frozen periods alleviates this discrepancy. A negative correlation exists between<br />
models <strong>and</strong> observations for annual runoff time series over the Yenesi basin, apparently due mostly to<br />
inconsistencies in the input data. Compared to station data, all models produce similar errors in snow-water<br />
equivalent; yet they differ widely in their snow regimes in terms of snowfall quantity, estimated snow depths, <strong>and</strong><br />
most importantly, sublimation rates. Additionally, model albedo is consistently higher than observations in the<br />
presence of snow. No single model is the best or worst performing when compared to a range of observations.<br />
NSIDC03: World Data Center for Glaciology, Boulder–Current Programs<br />
GOAL:<br />
Improve underst<strong>and</strong>ing of recent <strong>and</strong> unexpected changes in polar regions, including lower sea-level atmospheric<br />
pressure, increased air temperature over most of the Arctic, lower temperatures over eastern North America <strong>and</strong><br />
Greenl<strong>and</strong>, reduced sea ice cover, thawing permafrost, <strong>and</strong> changes in precipitation patterns.<br />
MILESTONE NSIDC03.1:<br />
Maintain <strong>and</strong> update <strong>and</strong> existing research data sets (e.g., the Online Glacier Photo Collection).<br />
Publish new data sets such as the NIC Ice Chart collection. Improve access to existing data sets,<br />
provide data via new access methods (e.g. Geospatial One Stop) <strong>and</strong> formats (e.g., more data<br />
sets in GeoTIFF <strong>and</strong> GIS formats).<br />
ACCOMPLISHMENTS FOR NSIDC03.1:<br />
In 2006, CIRES scientists built momentum toward the goal of making data sets available in geospatial formats <strong>and</strong><br />
exposing these data to new user communities. Accomplishments in this area included making the Online Glacier<br />
63
<strong>Theme</strong> report: Climate System Variability<br />
Photograph Database, permafrost maps, global ice <strong>and</strong> snow extent, <strong>and</strong> the Sea Ice Index available in Google Earth<br />
KML files, <strong>and</strong> daily snow extent from a NOAA operational product available in GeoTIFF format. Hundreds of<br />
glacier photographs were added to the Online Glacier Photograph Database. The most significant data release was<br />
release of the National Ice Center Arctic Sea Ice Charts <strong>and</strong> Climatologies in Gridded Format data set.<br />
MILESTONE NSIDC03.2:<br />
Make research information available through the NSIDC Information Center, acquire <strong>and</strong> catalog<br />
cryospheric materials in the NSIDC library, <strong>and</strong> maintain NSIDC’s analog data sets.<br />
ACCOMPLISHMENTS FOR NSIDC03.2:<br />
The NSIDC Information Center provided research assistance <strong>and</strong> document delivery to more than 120 users during<br />
FY07. During the same time frame, 361 books, reprints, <strong>and</strong> other media were added to the Center‘s collection as<br />
purchases <strong>and</strong> from donated materials. Users borrowed 218 items from the collection <strong>and</strong> accessed another 268<br />
items in-house. The Climate Database Modernization Project (CDMP) digitization project continued to scan the<br />
historic glacier photograph collection adding hundreds of photographs to the online database. Thirty seven field<br />
expedition notebooks were also digitized <strong>and</strong> will be made available online next fiscal year. One historic film was<br />
preserved, digitized, <strong>and</strong> shown to a local audience in collaboration with the University of Colorado‘s International<br />
Film Series. This film included footage of Boulder area glaciers from 1938 – 1942 <strong>and</strong> drew the IFS‘s largest<br />
audience of the season.<br />
MILESTONE NSIDC03.3:<br />
As resources allow, play a lead role in data management for the SEARCH program (NOAA <strong>and</strong><br />
NSF) <strong>and</strong> for NOAA's IPY activities, <strong>and</strong> accelerate production of climate data records from NPP<br />
<strong>and</strong> NPOESS missions, with a focus on sea ice.<br />
ACCOMPLISHMENTS FOR NSIDC03.3:<br />
As reported above for NSIDC03.1, CIRES scientists worked to make data sets available in geospatial formats <strong>and</strong><br />
exposing data to new user communities. Some Sea Ice Index images are now used in the Arctic Research Mapping<br />
Application (http://www.armap.org/home.aspx) as well.<br />
The NOAA liaison <strong>and</strong> other NSIDC staff served on a Study of Environmental Arctic Change (SEARCH) data<br />
management advisory panel, <strong>and</strong> responded to action items from NOAA headquarters regarding NOAA‘s IPY data<br />
legacy. Work began on a sea ice CDR joint with the Danish Meteorological Institution.<br />
A newly released data set from 216 Russian stations fills gaps in the historical precipitation record needed for<br />
applications including reanalysis validation <strong>and</strong> climate change studies. Documentation includes a section describing<br />
the relationship between this data set <strong>and</strong> other commonly used precipitation data sets. This is an important addition<br />
because the number <strong>and</strong> variety of sometimes overlapping precipitation data sets often make it difficult to use them<br />
for climate studies. The NOAA Arctic Research Program funded this effort as a contribution to the interagency<br />
SEARCH program.<br />
PSD10: Cloud <strong>and</strong> Aerosol Processes<br />
CSV-06: Regional Climate <strong>Systems</strong><br />
GOAL:<br />
Make observations of clouds, aerosols, <strong>and</strong> water vapor over a variety of ice, l<strong>and</strong>, <strong>and</strong> sea surfaces using a multisensor,<br />
multi-platform approach to improve retrieval techniques useful for satellite-validation studies.<br />
MILESTONE PSD10.1:<br />
Participate in VOCALS research cruises in October 2006; deploy cloud radar, radiometer, <strong>and</strong><br />
flux systems to measure key surface marine boundary layer parameters, low cloud<br />
macrophysical, microphysical, <strong>and</strong> radiative properties.<br />
64
<strong>Theme</strong> report: Climate System Variability<br />
ACCOMPLISHMENTS FOR PSD10.1:<br />
The systems were deployed on the NOAA R/V Ronald H. Brown for three weeks in October 2006. All systems<br />
obtained data on the cruise. Data products are available at the PSD ftp site for this project<br />
(ftp://ftp.etl.noaa.gov/et6/archive/STRATUS_2006/RHB).<br />
MILESTONE PSD10.2:<br />
Complete deployment of ground-based cloud, aerosol, radiative, <strong>and</strong> surface meteorological<br />
instruments in Canada for SEARCH Arctic observations with an emphasis on regions with strong<br />
connections to the Arctic oscillation.<br />
ACCOMPLISHMENTS FOR PSD10.2:<br />
A suite of atmospheric observation equipment has been deployed at the SEARCH research site in Eureka, Canada,<br />
which is located in the high Arctic at 80°N. These systems include a cloud radar, a high spectral-resolution lidar, a<br />
spectral infrared interferometer, <strong>and</strong> a microwave radiometer. A high data-recovery rate (>85%) has been<br />
accomplished for each instrument <strong>and</strong> data are available at the PSD ftp site: ftp://ftp.etl.noaa.gov/et6/search. In<br />
addition, preliminary work has started towards an additional deployment of a flux tower system to Eureka in the<br />
year 2007.<br />
MILESTONE PSD10.3:<br />
Participate in AMMA research cruises in June-July 2006; deploy cloud radar, radiometer, <strong>and</strong> flux<br />
systems to measure key surface marine boundary layer parameters, low cloud macrophysical,<br />
microphysical, <strong>and</strong> radiative properties.<br />
ACCOMPLISHMENTS FOR PSD10.3:<br />
The systems were deployed on the NOAA R/V Ronald H. Brown for four weeks in May 2007. All systems obtained<br />
data on the cruise. Data products are available at the ETL ftp site for this project<br />
(ftp://ftp.etl.noaa.gov/et6/archive/AMMA_2007/RHB).<br />
CSV-07: Climate Services<br />
PSD05: Experimental Regional Climate Services<br />
GOAL:<br />
Couple enhanced observations <strong>and</strong> research in regions of strong climate variability <strong>and</strong> societal impact with<br />
analysis of past data <strong>and</strong> improved modeling. Determine factors influencing the occurrence of extreme events.<br />
Improve the diagnosis, modeling, <strong>and</strong> prediction of the regional consequences of climate change <strong>and</strong> variability on<br />
timescales of days to decades on hydrological variables of relevance to society.<br />
MILESTONE PSD05.1:<br />
Monitor daily, seasonal, <strong>and</strong> longer-term precipitation variability over the western U.S. Complete<br />
alternate classification of U.S. climate divisions based on coherent regional precipitation<br />
variability. Downscale NCEP Week Two ensemble forecasts for Colorado water resource<br />
managers.<br />
ACCOMPLISHMENTS FOR PSD05.1:<br />
The first version of alternate climate division analysis has been released.<br />
A regional web page of Week Two forecasts produced for Colorado River management has been<br />
developed. Training documents/Users Guide for Water Managers are in preparation. Work-in-progress<br />
reports were presented at AMS <strong>and</strong> CPASW meetings.<br />
MILESTONE PSD05.2:<br />
Continue developing seasonal forecast guidance tools for the U.S. based on the predictability of<br />
tropical SSTs several seasons in advance, training these tools on the atmospheric responses to<br />
different types of anomalous tropical SSTs in large new sets of seasonal integrations made with<br />
the NCAR, GFDL, <strong>and</strong> NCEP GCMs.<br />
65
<strong>Theme</strong> report: Climate System Variability<br />
ACCOMPLISHMENTS FOR PSD05.2:<br />
An upgraded seasonal forecast tool using the ensemble of AMIP-type simulations of four new AGCMs is being<br />
developed. Preliminary hindcast experiments indicated that, compared to the forecast tool currently being used in<br />
real-time experimental seasonal forecasts, the new forecast tool has the potential of making improved forecasts of<br />
U.S. seasonal precipitation <strong>and</strong> surface temperature.<br />
MILESTONE PSD05.3:<br />
Conduct studies of recent climate change in the hydroclimatology of the western U.S., partly<br />
resulting from changes in tropical teleconnections, with emphasis on changes in stream flow <strong>and</strong><br />
watershed health.<br />
ACCOMPLISHMENTS FOR PSD05.3:<br />
CIRES scientists collaborated with U.S. Bureau of Reclamation <strong>and</strong> U.S. Geological Survey researchers in studying<br />
the potential for use of existing seasonal forecast products <strong>and</strong>/or remote teleconnections for stream-flow<br />
temperature/ecosystem <strong>and</strong> reservoir management in California.<br />
MILESTONE PSD05.4:<br />
Continue programmatic development <strong>and</strong> impact assessments of climate, weather, <strong>and</strong> water<br />
services, especially in conjunction with the newly established National Integrated Drought<br />
Information Service (NIDIS).<br />
ACCOMPLISHMENTS FOR PSD05.4:<br />
There was coordination with, <strong>and</strong> major contributions to, the NIDIS Implementation Plan.<br />
PSD07: Experimental Climate Data <strong>and</strong> Web Services<br />
GOAL:<br />
Improve public access to climate information <strong>and</strong> forecast products to facilitate research, to inform public planning<br />
<strong>and</strong> policy decisions, <strong>and</strong> to assist any interested parties impacted by climate.<br />
MILESTONE PSD07.1:<br />
Continue updating the extensive, publicly accessible climate data holdings on the CDC/PSD<br />
website. Develop <strong>and</strong> install on local platforms netCDF versions of the ECMWF ERA-40 <strong>and</strong><br />
other reanalysis data sets of the global <strong>and</strong> North American atmospheric circulation. Acquire new<br />
precipitation <strong>and</strong> soil moisture data sets.<br />
ACCOMPLISHMENTS FOR PSD07.1:<br />
New data sets:<br />
NOAA Merged Air L<strong>and</strong> <strong>and</strong> SST Anomalies<br />
Updated data sets:<br />
Climatic Research Unit at the University of East Anglia<br />
Temperature anomalies (CRUTEM3, HADCRUT3 <strong>and</strong> HADCRUT3V)<br />
Goddard Institute for Space Studies (GISS) surface temperature analysis<br />
Kaplan SST<br />
NASA Global Precipitation Climatology Project (GPCP)<br />
NCEP Global Ocean Data Assimilation System<br />
NCEP Marine<br />
NCEP-NCAR Reanalysis 1<br />
NCEP-DOE AMIP-II Reanalysis (AKA Reanalysis 2)<br />
NCEP Pacific Ocean Experiment<br />
NOAA Climate Prediction Center (CPC) Merged Analysis of Precipitation (CMAP)<br />
NOAA CPC Soil Moisture<br />
NOAA Extended Reconstructed SST<br />
NOAA Interpolated OLR<br />
66
NOAA Operation Model<br />
NOAA Optimally Interpolated SST<br />
<strong>Theme</strong> report: Climate System Variability<br />
MILESTONE PSD07.2:<br />
Finish ingesting a new data set, NCEP's North American Regional Reanalysis (NARR), which is<br />
much higher in resolution (vertically as well as horizontally) than any of CDC's previous data sets,<br />
in a CF-compliant NetCDF format.<br />
ACCOMPLISHMENTS FOR PSD07.2:<br />
The NARR data set was extended through the end of 2006. It is an ongoing data set for NCEP, so ―finishing‖ it is<br />
not good terminology. Further updates are planned on a space-available basis. The Lambert Conformal Conic<br />
projection has proven to be an additional complication, but the CF metadata st<strong>and</strong>ard has provisions for h<strong>and</strong>ling it.<br />
MILESTONE PSD07.3:<br />
Continue developing <strong>and</strong> maintaining the CIRES/NOAA website dedicated to real-time<br />
predictions of tropical convection variations associated with the MJO <strong>and</strong> their remote impacts.<br />
Display various experimental <strong>and</strong> operational ensemble predictions in a uniform format to enable<br />
inter-comparisons <strong>and</strong> skill evaluation.<br />
ACCOMPLISHMENTS FOR PSD07.3:<br />
The goal of the MJO experimental prediction project is to access <strong>and</strong> compare MJO forecasts, <strong>and</strong> to analyze the<br />
effects of MJO events on tropical <strong>and</strong> mid-latitude weather forecasts. An article describing the project‘s<br />
accomplishments was published in the Bulletin of the American Meteorological Society in April 2006. The project<br />
website (http://www.www.cdc.noaa.gov/MJO/) continues to be maintained <strong>and</strong> developed.<br />
67
<strong>Scientific</strong> <strong>Theme</strong>: Geodynamics<br />
<strong>Scientific</strong> <strong>Theme</strong>: GEODYNAMICS<br />
GEO-01: Geophysical Data <strong>Systems</strong><br />
NGDC05: Instrumentation Design, Prototyping <strong>and</strong> Analysis<br />
GOAL:<br />
Improve integration <strong>and</strong> modeling of geophysical data, further research into core-mantle processes, improve<br />
representation of magnetic fields at or near the Earth's surface, improve models of tsunami-threatened coastal<br />
regions, <strong>and</strong> improve underst<strong>and</strong>ing of past hazardous events <strong>and</strong> potential future impacts.<br />
MILESTONE NGDC05.1:<br />
Produce a global spherical-harmonic degree-720 model of the Earth's crustal magnetic field from<br />
a joint inversion of all available marine magnetic, aeromagnetic, <strong>and</strong> CHAMP satellite magnetic<br />
measurements.<br />
ACCOMPLISHMENTS FOR NGDC05.1:<br />
The study of geomagnetism is one of<br />
the oldest of the geophysical sciences,<br />
tracing back to before the publication of<br />
William Gilbert‘s De Magnete in the<br />
year 1600. A convenient way for<br />
modern scientists to represent the<br />
geomagnetic field is to exp<strong>and</strong> the<br />
scalar magnetic potential into spherical<br />
harmonic functions that can then be<br />
evaluated at any desired location to<br />
provide the magnetic field vector<br />
direction <strong>and</strong> strength. The magnetic<br />
field as measured at or near the surface<br />
of the Earth is a composite of the main<br />
(internal) magnetic field, the crustal<br />
magnetic field, <strong>and</strong> the magnetic field<br />
from external sources. Of these, the<br />
main field comprises approximately<br />
90% of the signal <strong>and</strong> is represented<br />
through global magnetic field models<br />
such as the International Geomagnetic<br />
Reference Field (IGRF) <strong>and</strong> World<br />
Magnetic Model (WMM). The timevarying<br />
external <strong>and</strong> spatially varying<br />
crustal magnetic fields are the primary<br />
sources of uncertainty in navigation<br />
applications of the geomagnetic field.<br />
The NGDC-720 model is a new highresolution<br />
crustal field model that<br />
extends previous main field models<br />
Degree-720 spherical harmonic model of the Earth’s magnetic field,<br />
vertical field (Z) component at geoid height.<br />
from a spherical harmonic degree 16 to 720 corresponding to a waveb<strong>and</strong> improvement of 2500 km to 56 km. The<br />
degree-720 cut-off corresponds to an angular wavelength of 30 arc-minutes, providing a 15-arc-minute model<br />
resolution. The degree-720 magnetic model is the first step in the development of an Enhanced Magnetic Model<br />
needed for improved navigation by ships, aircraft, <strong>and</strong> near-Earth orbiting spacecraft. These higher-resolution<br />
models are also important for natural-resource exploration of natural gas, petroleum, <strong>and</strong> minerals. Finally, the<br />
improved model has application in scientific investigations focused on underst<strong>and</strong>ing the physics of changes in the<br />
terrestrial magnetic field.<br />
68
<strong>Scientific</strong> <strong>Theme</strong>: Geodynamics<br />
This research also directly supported the International Association of Geomagnetism <strong>and</strong> Aeronomy World Digital<br />
Magnetic Anomaly Map Project (IAGA/WDMAM) <strong>and</strong> studies of crustal magnetism contributing to geodynamic<br />
models of the lithosphere, geologic mapping, <strong>and</strong> natural resource exploration. Inferences from crustal magnetic<br />
field maps, such as the WDMAM, interpreted in conjunction with other information, can help delineate geologic<br />
provinces, locate impact structures, dikes, faults, <strong>and</strong> other geologic entities that have a magnetic contrast with their<br />
surroundings. The Magnetic Anomaly Map of the World, based on the NGDC-720 model, will be published in July<br />
2007 by UNESCO <strong>and</strong> the Commission for the Geological Map of the World.<br />
Products include:<br />
The Extended Magnetic Field Model (EMM-06), including software <strong>and</strong> the main field, secular variation,<br />
NGDC-720-V1 crustal field, magnetospheric field, <strong>and</strong> induced field is now available via on-line access<br />
(http://www.ngdc.noaa.gov/seg/EMM/).<br />
C<strong>and</strong>idate model for the World Digital Magnetic Anomaly Map Project<br />
(http://geomag.org/models/wdmam.html).<br />
MILESTONE NGDC05.2:<br />
Produce a climatological model of the equatorial electrojet by analyzing CHAMP, Ørsted, <strong>and</strong><br />
SAC-C satellite magnetic data.<br />
ACCOMPLISHMENTS FOR NGDC05.2:<br />
69<br />
The Earth‘s equatorial ionosphere is a<br />
region of complex electrodynamics<br />
resulting from solar-driven pondermotive<br />
forces <strong>and</strong> ionospheric<br />
conductivity gradients. Underst<strong>and</strong>ing<br />
the physics of these interactions is<br />
important for specifying the<br />
morphology of currents flowing in<br />
the upper atmosphere <strong>and</strong> for<br />
predicting the occurrence of<br />
ionospheric scintillation that can have<br />
a deleterious effect on communications.<br />
Recent satellite missions have<br />
provided measurements of the<br />
geomagnetic field with unprecedented<br />
accuracy <strong>and</strong> resolution,<br />
which are now used to infer the<br />
electrodynamics of the equatorial<br />
ionosphere. Deviations from the main<br />
geomagnetic results are used to<br />
model height-integrated current<br />
densities within the ionosphere from<br />
which local electric fields <strong>and</strong> plasma<br />
motions can be inferred.<br />
CIRES scientists working at NGDC developed the Equatorial ElectroJet Model (EEJM1) climatological model using<br />
high-quality magnetic measurements from recent satellite missions. The EEJM1 is composed of three models of the<br />
equatorial electrojet that were constructed based on six years of satellite magnetic measurements from each of the<br />
CHAMP, Ørsted, <strong>and</strong> SAC-C satellites. The models are based on data that comprise half of a solar cycle (from solar<br />
maximum to solar minimum). The Equatorial Electrojet Model—coefficients <strong>and</strong> driver program—is available<br />
online at http://www.earthref.org <strong>and</strong> at http://models.geomag.us/EEJ.html.<br />
MILESTONE NGDC05.3:<br />
Produce the 2006/2007 CIRES/NGDC scientific geomagnetic field model, accounting for recent<br />
changes of the Earth's magnetic field.
<strong>Scientific</strong> <strong>Theme</strong>: Geodynamics<br />
ACCOMPLISHMENTS FOR NGDC05.3:<br />
The two primary reference models for magnetic navigation <strong>and</strong> pointing are<br />
the World Magnetic Model <strong>and</strong> the International Geomagnetic Reference<br />
Field. The CIRES geomagnetism team is strongly involved in producing <strong>and</strong><br />
supporting both of these models. This requires a detailed monitoring of the<br />
time variations of the geomagnetic field. These time variations are captured<br />
in scientific main field models, which are updated every year.<br />
CIRES scientists working at NGDC produce <strong>and</strong> support a main magnetic<br />
field model called POtsdam Magnetic Model of the Earth (POMME), in<br />
collaboration with the CHAMP satellite team at GeoForschungsZentrum<br />
Potsdam. The time variations of the geomagnetic field, as measured by the<br />
CHAMP satellite from 2000.5 to 2007.5, are represented as a second degree<br />
Taylor series expansion in time around the model epoch 2004.0. The first<br />
time derivative (secular variation) <strong>and</strong> the second time derivative (secular<br />
acceleration) are displayed in the figure to the right. With this Taylor series<br />
expansion, the geomagnetic field can be predicted forward in time for<br />
periods up to a few years. Further details <strong>and</strong> images can be found at<br />
http://geomag.org/models/pomme4.html.<br />
Secular variation (top) <strong>and</strong> secular acceleration (bottom)<br />
of the geomagnetic field as given by POMME-4 model<br />
MILESTONE NGDC05.4:<br />
Produce bathymetric-topographic digital elevation models sufficient for tsunami propagation, run<br />
up <strong>and</strong> inundation prediction for 19 priority regions, defined by the U.S. tsunami community.<br />
ACCOMPLISHMENTS FOR NGDC05.4:<br />
CIRES researchers developed 21 high-resolution digital elevation models (DEMs) for select tsunami-threatened<br />
U.S. coastal regions. These combined bathymetric–topographic DEMs are used to support tsunami forecasting <strong>and</strong><br />
modeling efforts at the NOAA Center for Tsunami Research, Pacific Marine Environmental Laboratory (PMEL).<br />
The DEMs are part of the tsunami forecast system SIFT (Short-term Inundation Forecasting for Tsunamis) currently<br />
being developed by PMEL for the NOAA Tsunami Warning Centers, <strong>and</strong> are used in the MOST (Method of<br />
Splitting Tsunami) model developed by PMEL to simulate tsunami generation, propagation, <strong>and</strong> inundation.<br />
Bathymetric, topographic, <strong>and</strong> shoreline data used in DEM compilation are obtained from various sources, including<br />
NGDC, NOAA‘s National Ocean Service (NOS), the U.S. Geological Survey (USGS), the U.S. Army Corps of<br />
Engineers (USACE), the Federal Emergency Management Agency (FEMA), <strong>and</strong> other federal, state, <strong>and</strong> local<br />
government agencies, academic institutions, <strong>and</strong> private companies. DEMs are referenced to the vertical tidal datum<br />
of Mean High Water (MHW) <strong>and</strong> horizontal datum of World Geodetic System 1984 (WGS84). Geographic cell<br />
sizes for the DEMs range from 1/3 arc-second (~10 meters) to 3 arc-seconds (~90 meters). This project is a priority<br />
for NOAA; it has been presented to Congressional staffers, <strong>and</strong> featured on the NOAA website.<br />
Perspective view of the 1 arc-second Puerto Rico DEM. Elevations range from -6612 meters (purple) to 1330<br />
meters (dark red).<br />
70
<strong>Scientific</strong> <strong>Theme</strong>: Geodynamics<br />
MILESTONE NGDC05.5:<br />
Provide community with web access to bathymetric-topographic grids developed for tsunami<br />
prediction as st<strong>and</strong>ard products, with documentation of procedures, analysis, quality control <strong>and</strong><br />
quality assessment of data.<br />
ACCOMPLISHMENTS FOR NGDC05.5:<br />
CIRES scientists at NGDC developed the ―NGDC Tsunami Inundation Gridding Project‖ website<br />
(http://www.ngdc.noaa.gov/mgg/inundation/) for public access of tsunami inundation DEMs. On this site, visitors<br />
may download completed DEMs, with corresponding metadata <strong>and</strong> documentation. The site also identifies coastal<br />
communities for which bathymetric–topographic DEMs are planned to be built in the future.<br />
CIRES scientists at NGDC also developed an ArcIMS ―DEM Discovery Portal‖ map service<br />
(http://map.ngdc.noaa.gov/website/mgg/dem/viewer.htm) for spatially locating DEMs from NGDC <strong>and</strong> other<br />
sources. The portal provides information on the DEMs (source, cell size, datums, units, etc.), shaded-relief images,<br />
<strong>and</strong> links to websites where they may be downloaded. Currently indexed DEMs, from NOAA <strong>and</strong> USGS, range<br />
from 5 arc-minutes (ETOPO5 Global Relief) to 2 meters (Crater Lake Bathymetry).<br />
Image of the ArcIMS ―DEM Discovery Portal‖ map service<br />
for spatially locating DEMs from NGDC <strong>and</strong> other sources.<br />
71
<strong>Scientific</strong> <strong>Theme</strong>: Geodynamics<br />
MILESTONE NGDC05.6:<br />
Produce a U.S. Tsunami Hazard Assessment which will describe tsunami sources <strong>and</strong> estimate<br />
tsunami frequency based on historical <strong>and</strong> geological tsunami data.<br />
ACCOMPLISHMENTS FOR NGDC05.6:<br />
CIRES researchers at NGDC conducted a tsunami hazard assessment for U.S. states <strong>and</strong> territories, which has been<br />
documented in a draft NOAA report ―U.S. States <strong>and</strong> Territories National Tsunami Hazard Assessment, 2006:<br />
Historical Record <strong>and</strong> Sources for Waves.‖ This document awaits NOAA approval for publication. Tsunamis are<br />
infrequent high impact events that can cause a considerable number of fatalities, inflict major damage, <strong>and</strong> cause<br />
significant economic loss to large sections of the U.S. coastlines. Since the beginning of the 20th century, tsunami<br />
events have caused more than 800 deaths <strong>and</strong> over $200 million in damage to the U.S. coastal states <strong>and</strong> territories.<br />
Approximately 53% of the U.S. population now live in coastal communities <strong>and</strong> are at risk for impacts from a<br />
destructive tsunami. As this trend continues, the risk of more deaths <strong>and</strong> damage will continue to climb.<br />
Map showing total number of tsunami events <strong>and</strong> total number of events causing runup heights<br />
from 0.01 meter to greater than 3.0 meters for U.S. states <strong>and</strong> territories in the Pacific Ocean.<br />
Region Hazard based on Hazard based on Hazard based on<br />
runups<br />
frequency<br />
deaths<br />
Atlantic Coast Very low to low Very low None<br />
Gulf Coast None to very low Non to very low None<br />
Caribbean High High Very high or severe<br />
West Coast High High High<br />
Alaska Very high or severe Very high Very high or severe<br />
Hawaii Very high or severe Very high Very high or severs<br />
Western Pacific Moderate High Low to moderate<br />
Qualitative Tsunami Hazard Assessment based on NGDC databases.<br />
72
<strong>Scientific</strong> <strong>Theme</strong>: Integrating Activities<br />
<strong>Scientific</strong> <strong>Theme</strong>: INTEGRATING ACTIVITIES<br />
IA-01: Science <strong>and</strong> Society<br />
CSD10: <strong>Scientific</strong> Assessments for Decision Makers<br />
Policy01: Science Policy Lecture Series<br />
IA-02: Western Water Assessment<br />
WWA01: <strong>Scientific</strong> Assessments<br />
WWA02: Climate Products<br />
WWA03: Climate <strong>and</strong> Water Affairs<br />
WWA04: Management<br />
IA-03: Resource Development for Educators <strong>and</strong> Decision Makers<br />
Policy02: Outreach to Decision Makers through the Internet<br />
Policy03: Outreach to Decision Makers through Newsletters<br />
IA-01: Science <strong>and</strong> Society<br />
CSD10: <strong>Scientific</strong> Assessments for Decision Makers<br />
GOAL:<br />
Plan, lead, prepare, <strong>and</strong> disseminate assessments for the decision making communities associated with ozone-layer<br />
depletion, greenhouse warming, <strong>and</strong> regional air quality.<br />
MILESTONE CSD10.1<br />
Serve as authors, reviewers, <strong>and</strong> coordinating editor to accomplish the final preparation <strong>and</strong><br />
printing of the World Meteorological Organization/United Nations Environment Programme 2006<br />
scientific state-of-underst<strong>and</strong>ing assessment of the ozone layer for the U.N. Montreal Protocol.<br />
ACCOMPLISHMENTS FOR CSD10.1<br />
The 2006 international state-of-underst<strong>and</strong>ing report on the science of<br />
the ozone layer was completed in December 2006 <strong>and</strong> printed in April<br />
2007, a major milestone in the work of the <strong>Scientific</strong> Assessment Panel<br />
of the U.N. Montreal Protocol on Substances that Deplete the Ozone<br />
Layer. The report (―<strong>Scientific</strong> Assessment of Ozone Depletion: 2006‖)<br />
is the sixth in a series of periodic assessments that are prepared for the<br />
United Nations Montreal Protocol. The report will be distributed to the<br />
more than 190 nations (including the United States) that are parties to<br />
the Montreal Protocol, who use it as the scientific basis for their<br />
discussions regarding protection of the ozone layer.<br />
The 2006 report, approximately 500 pages in length, describes past <strong>and</strong><br />
expected future levels of ozone-depleting substances, past <strong>and</strong> expected<br />
future behavior of the ozone layer in polar regions <strong>and</strong> throughout the<br />
globe, implications for ultraviolet radiation at the Earth‘s surface,<br />
short-lived ozone-depleting substances, <strong>and</strong> interrelationships between<br />
climate <strong>and</strong> ozone depletion.<br />
The 2006 report updates findings of the previous report in 2002 <strong>and</strong> builds upon the foundation of knowledge forged<br />
in earlier reports in 1988, 1991, 1994, <strong>and</strong> 1998. This regular series is the output product of updated knowledge on<br />
this topic. Each of the reports is prepared by hundreds of scientists worldwide who participate as authors,<br />
contributors, <strong>and</strong> reviewers.<br />
73
<strong>Scientific</strong> <strong>Theme</strong>: Integrating Activities<br />
The ozone assessment is an important component of NOAA‘s Climate Goal. Scientists in CIRES, the Chemical<br />
Sciences Division, the Global Monitoring Division, <strong>and</strong> elsewhere in NOAA have played prominent roles in<br />
leading, authoring, <strong>and</strong> reviewing the 2006 ozone assessment. Roles of CIRES scientists in the 2006 report included<br />
participation as coauthors, contributors, reviewers, <strong>and</strong> coordinating editor for the report.<br />
POLICY01: Science Policy Lecture CIRES<br />
GOAL:<br />
Provide useful information that will help improve the relationship between societal needs <strong>and</strong> science <strong>and</strong><br />
technology policies.<br />
MILESTONE POLICY01.1<br />
Edit a book that will include chapters based on each science advisor's talk in the series<br />
supplemented by chapters written by other science policy experts. Continue the planning process<br />
for the second science policy lecture series, which likely will focus on a series of debates on<br />
science policy <strong>and</strong> energy-related topics.<br />
ACCOMPLISHMENTS FOR POLICY01.1<br />
Researchers at the Center for Science <strong>and</strong> Technology Policy Research have completed 10 chapters of the book<br />
based on their Presidential Science Advisor lecture series. The book includes chapters written by all seven of the<br />
participating science advisors – Donald Hornig, Edward David, Frank Press, George Keyworth, John Gibbons, Neal<br />
Lane, <strong>and</strong> John Marburger – as well as four chapters by other science <strong>and</strong> policy scholars. The completed<br />
manuscript is expected to be sent to the prospective publisher by the end of summer 2007 with an anticipated<br />
publication date sometime in 2008. Planning for the second lecture series has been put on hold but it is hoped that<br />
the process will resume in the coming year.<br />
WWA01: <strong>Scientific</strong> Assessments<br />
IA-02: Western Water Assessment<br />
GOAL:<br />
Identify <strong>and</strong> characterize regional vulnerabilities to climate variability <strong>and</strong> change for use by Intermountain waterresource<br />
decision makers.<br />
MILESTONE WWA01.1:<br />
Front Range water needs to 2040. Colorado’s Front Range is one of the most rapidly growing<br />
areas in the West. This on-going model-based study (SPRAT – South Platt Regional Assessment<br />
Tool) will investigate the region’s ability to meet new water needs through proposed projects,<br />
conservation, <strong>and</strong> groundwater. How a varying climate might affect these future needs <strong>and</strong><br />
projects will also be studied.<br />
.<br />
ACCOMPLISHMENTS FOR WWA01.1:<br />
The SPRAT workgroup continued efforts to incorporate climate change into the SPRAT modeling framework.<br />
These efforts included meeting with user groups such as Denver Water to discuss the use of SPRAT to develop a<br />
better underst<strong>and</strong>ing of the potential effects of climate change on their water rights portfolio. In addition to this<br />
work, a team member will be presenting the SPRAT model <strong>and</strong> output at the 2007 South Platte Forum.<br />
MILESTONE WWA01.2:<br />
Front Range large water providers’ vulnerabilities <strong>and</strong> climate products needs. This on-going task<br />
will inform future assessment <strong>and</strong> climate products of the Western Water Assessment through<br />
studying six large water providers in the Front Range of Colorado.<br />
74
<strong>Scientific</strong> <strong>Theme</strong>: Integrating Activities<br />
ACCOMPLISHMENTS FOR WWA01.2:<br />
In the last year, interviews with Denver, Northern Colorado Water Conservancy District (NCWCD), <strong>and</strong><br />
Westminster were held. Interviews with the other three cities are currently being scheduled. Information gathered<br />
during these interviews is being added to a report describing the annual <strong>and</strong> long-term decision processes <strong>and</strong> uses<br />
<strong>and</strong> needs for climate information by these cities. This information will be useful for other WWA researchers who<br />
need background information about these cities. Three articles have been outlined that will be submitted for<br />
publication with conclusions from all six cities. These articles are intended for three audiences: water managers,<br />
climate information providers, <strong>and</strong> the Water Resources Research journal. These articles will examine ways that<br />
Front Range water managers use climate information, ways that they could use information that they do not<br />
currently use, the reasons that some information is more useful than other information, <strong>and</strong> how climate information<br />
can be presented to make it more useful.<br />
MILESTONE WWA01.3:<br />
Current <strong>and</strong> Future Water Dem<strong>and</strong> at a Major Front Range City. This task will investigate the<br />
many forces that impact water dem<strong>and</strong> at a major Denver suburb, Aurora, with infrastructure<br />
requirements over the next ten years in excess of $1B. A literature review on water dem<strong>and</strong> will<br />
be created. How the recent drought, climate variables, demographics, pricing, irrigation<br />
technology, in-home water meters <strong>and</strong> other variables affect dem<strong>and</strong> will also be studied.<br />
.<br />
ACCOMPLISHMENTS FOR WWA01.3:<br />
A website, as well as several papers <strong>and</strong> presentations about water dem<strong>and</strong> in Aurora, CO, were produced.<br />
Web Related: Created new Water Dem<strong>and</strong> <strong>and</strong> Conservation site:<br />
http://wwa.colorado.edu/resources/water_dem<strong>and</strong>_<strong>and</strong>_conservation/.<br />
Publications/White Papers:<br />
Residential Water Dem<strong>and</strong> Management in Aurora: Lessons from the Drought Crisis, Colorado Water.<br />
Factors Influencing Residential Water Dem<strong>and</strong>: A Review of the Literature. White Paper.<br />
Presentations<br />
Managing Residential Water Dem<strong>and</strong>: Lessons from Aurora. Presented as part of the Center for Science<br />
<strong>and</strong> Technology Policy Research (CSTPR) seminar series., March 13, 2007,<br />
Behavioral <strong>and</strong> Econometric Lessons from Urban Water Dem<strong>and</strong> under Extreme Drought: Focus on<br />
Aurora, Colorado. Department of Agricultural <strong>and</strong> Resource Economics & Department of Economics U.S.<br />
Forest Service Rocky Mountain Research Station Spring 2007 Seminar Series. February 16, 2007.<br />
MILESTONE WWA01.4:<br />
Colorado Meteorological Station Data long-term trends. In conjunction with the Colorado State<br />
Climatologist’s office, evaluate all suitable stations in Colorado for long-term precipitation <strong>and</strong><br />
temperature trends.<br />
ACCOMPLISHMENTS FOR WWA01.4:<br />
A preliminary assessment of long-term precipitation <strong>and</strong> temperature trends has been completed. These results have<br />
been presented at several venues, including the Water Availability Task Force <strong>and</strong> the WWA Climate Change<br />
Conference held in Golden, in December of 2006.<br />
MILESTONE WWA01.5:<br />
IPCC AR4 Model Suitability for Colorado. Investigate value of recent AR4 model run data for use<br />
by Denver Water <strong>and</strong> others.<br />
ACCOMPLISHMENTS FOR WWA01.5:<br />
This project was put on hold during FY07, but work is now in progress.<br />
MILESTONE WWA01.6:<br />
Streamflow Variability. In parallel with ongoing NSF effort, we will investigate apparent tendencies<br />
for Western rivers to show increasing variability <strong>and</strong> synchroneity.<br />
75
.<br />
<strong>Scientific</strong> <strong>Theme</strong>: Integrating Activities<br />
ACCOMPLISHMENTS FOR WWA01.6:<br />
This project is on temporarily on hold until the faculty research position is filled.<br />
MILESTONE WWA01.7:<br />
Colorado River Flow Yield Study. Synthesize lessons from paleo streamflow reconstructions,<br />
future streamflow projections from models <strong>and</strong> other sources, <strong>and</strong> native streamflow<br />
reconstructions.<br />
.<br />
ACCOMPLISHMENTS FOR WWA01.7:<br />
Note: Milestones 7, 8, <strong>and</strong> 9 were combined into a single project done for the U.S. Bureau of Reclamation.<br />
WWA hosted a kick-off meeting with the Bureau personnel in November of 2006 in Boulder to form a Climate<br />
Technical Work Group to assist bureau members with assessing the state of the climate change science in its<br />
Colorado River planning studies. This meeting was attended by approximately 25 people from Reclamation‘s Lower<br />
Colorado River office (Boulder City, NV), Upper Colorado River Office (Salt Lake City), National Center for<br />
Atmospheric Research, <strong>and</strong> consultants.<br />
A six-member ―climate technical work group‖ was created after the kickoff meeting. During the spring of 2007, the<br />
group drafted ―Review of Science <strong>and</strong> Methods for Incorporating Climate Change Information into Reclamation‘s<br />
Colorado River Basin Planning Studies.‖ The report was peer-reviewed during the summer. It is slated for release by<br />
Reclamation this fall; it may become an appendix in Reclamation‘s ongoing Environmental Impact Statement for the<br />
―shortage sharing‖ <strong>and</strong> combined operation of Lake Powell <strong>and</strong> Lake Mead. This is the first report of its kind by<br />
Reclamation anywhere in the U.S.<br />
MILESTONE WWA01.8:<br />
Colorado River Drought Analysis. Build upon the 1995 Severe <strong>and</strong> Sustained Drought Study by<br />
updating analysis including lessons learned from the 1999 – 2004 drought.<br />
ACCOMPLISHMENTS FOR WWA01.8:<br />
See text above; milestones WWA01.7, WWA01.8, <strong>and</strong> WWA01.9 were combined into a single project done for<br />
Reclamation.<br />
MILESTONE WWA01.9:<br />
Colorado River Climate Change Analysis. Utilize USBR CRSS Model to investigate vulnerability<br />
of basin to changes in inflows based on IPCC AR4 model runs.<br />
ACCOMPLISHMENTS FOR WWA01.9:<br />
See text above; milestones WWA01.7, WWA01.8, <strong>and</strong> WWA01.9 were combined into a single project done for<br />
Reclamation.<br />
MILESTONE WWA01.10:<br />
Estimating the impacts of complex climatic events: The economic costs of drought in Colorado,<br />
Nebraska <strong>and</strong> New Mexico. In addition to developing impact assessment methodologies, this<br />
study will develop guidelines for impacts reporting at the state <strong>and</strong> local levels. This effort<br />
supplements a SARP funded proposal <strong>and</strong> will be a joint effort with the National Drought<br />
Mitigation Center.<br />
ACCOMPLISHMENTS FOR WWA01.10:<br />
The project PIs have produced an assessment of the following methods.<br />
(1) PIs identified the sectors/subsectors within each state that have been affected by drought within the past 10<br />
years in Nebraska. This forms a prototype for similar reports from Colorado <strong>and</strong> New Mexico, the other<br />
states involved in the project.<br />
76
<strong>Scientific</strong> <strong>Theme</strong>: Integrating Activities<br />
(2) The PIs have begun to develop a protocol for reporting drought impacts.<br />
(3) Project PIs are also working on organizing a drought workshop (with a specific component aimed at<br />
economic impacts assessments of drought) in partnership with the State of Colorado Office of Water<br />
Conservation & Drought Planning.<br />
WWA02: Climate Products<br />
GOAL:<br />
Develop information, products <strong>and</strong> processes to assist water resource decision makers throughout the<br />
Intermountain West.<br />
MILESTONE WWA02.1<br />
Nonparametric streamflow reconstructions. This task will investigate an entirely new way of<br />
reconstructing streamflows using a statistical technique not previously used by<br />
dendrochronologists. Jointly funded by US Bureau of Reclamation, Boulder City, NV Office.<br />
ACCOMPLISHMENTS FOR WWA02.1:<br />
Due to problems with reprogramming funding for this activity, this effort was delayed. Background work by the<br />
consultant, Hydrosphere, was performed. This work will be completed this year.<br />
MILESTONE WWA02.2:<br />
Streamflow Reconstructions for Water Managers in Gunnison Basin for EIS. Using a novel<br />
combination of historic gage data, <strong>and</strong> tree-ring data, create new streamflow reconstructions.<br />
ACCOMPLISHMENTS FOR WWA02.2:<br />
Due to a lawsuit involving the ongoing Environmental Impact Statement, work was temporarily halted. However,<br />
work has now been completed on comparing the current method of using stream flows (ISM) with our proposed<br />
method based on a nonparametric nearest neighbor (―knn‖) algorithm.<br />
A report documenting the advantages of the knn method has been prepared for the U.S. Bureau of Reclamation <strong>and</strong><br />
the water managers in the Gunnison Basin <strong>and</strong> is online here: http://animas.colorado.edu/~nowakkc/EIS.html. Work<br />
will now proceed on the paleoclimatology portion of the project.<br />
MILESTONE WWA02.3:<br />
Monthly Intermountain Climate Summary. Climate information is widely scattered on the web <strong>and</strong><br />
other locations. Water managers <strong>and</strong> other climate sensitive sectors have requested a single<br />
monthly summary of climate information including precipitation, temperature, snow water<br />
equivalent, long-lead temperature <strong>and</strong> precipitation outlooks, reservoir levels <strong>and</strong> streamflow<br />
forecasts.<br />
ACCOMPLISHMENTS FOR WWA02.3:<br />
Released about eight times per year, Intermountain West Climate Summary provides updated climate <strong>and</strong> water<br />
supply information catered to municipal water providers. See:<br />
http://wwa.colorado.edu/products/forecasts_<strong>and</strong>_outlooks/intermountain_west_climate_summary/.<br />
MILESTONE WWA02.4:<br />
Web-based seasonal guidance for Water Managers, Climate Prediction Center. Improve ability of<br />
federal, state, <strong>and</strong> local water managers to plan water operations during drought. Provide input to<br />
CPC seasonal outlooks.<br />
ACCOMPLISHMENTS FOR WWA02.4:<br />
Assistance in the creation of CPC‘s seasonal forecasts has been provided. A key element of this assistance is the<br />
regular creation of ―experimental seasonal guidance,‖ a statistically created forecast specific to the Four-Corners<br />
77
<strong>Scientific</strong> <strong>Theme</strong>: Integrating Activities<br />
region of the U.S. Forecasts are at http://www.cdc.noaa.gov/people/klaus.wolter/SWcasts/index.html. Note: This<br />
information is also presented to the Drought Task Force, <strong>and</strong> that activity is covered under another milestone.<br />
MILESTONE WWA02.5:<br />
National Integrated Drought Information System. As necessary, WWA will provide support<br />
activities for NIDIS implementation efforts.<br />
ACCOMPLISHMENTS FOR WWA02.5:<br />
WWA researchers were instrumental in the shaping of the National Integrated Drought Information System<br />
(NIDIS), including playing a major role in writing the NIDIS overview document organized by the Western<br />
Governors‘ Association. (http://www.westgov.org/wga/publicat/nidis.pdf). This effort with WGA also led to WWA<br />
involvement in the most recent WGA water report on sustainability<br />
(http://www.westgov.org/wga/publicat/Water06.pdf). In 2006-2007, WWA researchers assisted with the creation of<br />
the NOAA NIDIS implementation plan <strong>and</strong> with discussions about NIDIS pilot projects. A presentation was<br />
delivered at the NIDIS Implementation Plan workshop held in September of 2006.<br />
MILESTONE WWA02.6:<br />
Gr<strong>and</strong> Canyon Adaptive Management. Develop forecasts of late-summer storms <strong>and</strong> associated<br />
sediment input into the Gr<strong>and</strong> Canyon to support multi-stakeholder adaptive management<br />
experiments aimed at sustaining ecological, cultural <strong>and</strong> recreational activities. This work is in<br />
collaboration with the Gr<strong>and</strong> Canyon Monitoring <strong>and</strong> Research Center.<br />
ACCOMPLISHMENTS FOR WWA02.6:<br />
This project is continuing to produce experimental climate information on late-summer inputs of sediment into the<br />
Colorado River at Gr<strong>and</strong> Canyon. This input is now the most important source of sediment into the Gr<strong>and</strong> Canyon<br />
for adaptive management of cultural resources <strong>and</strong> endangered species in the Canyon. PIs<br />
have also been involved in meetings <strong>and</strong> presentations with the Adaptive Management Working Group<br />
(representatives from states, tribes, recreation, <strong>and</strong> energy NGOs within the basin) to inform the reassessment of the<br />
Environmental Impacts Statement <strong>and</strong> management plans over the next five years.<br />
MILESTONE WWA02.7:<br />
Dendrohydrological Website. Exp<strong>and</strong> <strong>and</strong> redesign existing website on tree-ring streamflow<br />
reconstructions for Colorado, to encompass reconstructions across the western U.S. Allow water<br />
managers to utilize streamflow sequences vastly in excess of the historical gage record to better<br />
plan for climate variability <strong>and</strong> change. Jointly funded by the NCDC Paleoclimatology Branch.<br />
ACCOMPLISHMENTS FOR WWA02.7:<br />
WWA currently maintains two websites devoted to paleo-reconstructions of stream flow:<br />
http://www.ncdc.noaa.gov/paleo/streamflow/<br />
http://wwa.colorado.edu/resources/paleo/<br />
During the last year, both were updated, but the WWA site received the most work. A key addition to the WWA site<br />
was a series of pages on the Colorado River:<br />
http://wwa.colorado.edu/resources/paleo/lees/<br />
The substantial web material on the dendrohydrological workshops is discussed elsewhere in this report.<br />
MILESTONE WWA02.8:<br />
Lee Ferry Reconstructions website. This site will provide information on the new Woodhouse,<br />
Gray, Meko tree-ring reconstruction of Colorado River streamflow, <strong>and</strong> a comparison with other<br />
reconstructions of the same gage.<br />
ACCOMPLISHMENTS FOR WWA02.8:<br />
See previous milestone.<br />
78
<strong>Scientific</strong> <strong>Theme</strong>: Integrating Activities<br />
MILESTONE WWA02.9:<br />
Colorado River Climate, Management, Law <strong>and</strong> Policy website. Enhance <strong>and</strong> update existing site<br />
on matters of interest to Colorado River water managers. Add discussion of useful existing<br />
climate products <strong>and</strong> new climate product needs by water managers.<br />
ACCOMPLISHMENTS FOR WWA02.9:<br />
This website was updated <strong>and</strong> is located here: http://wwa.colorado.edu/resources/colorado_river/.<br />
MILESTONE WWA02.10:<br />
Colorado River Climate Primer. Summarize climate of the basin in one document.<br />
ACCOMPLISHMENTS FOR WWA02.10:<br />
This document, ―Colorado River Climate Primer,‖ is under production. It was held up because it is a joint effort with<br />
another NOAA project, <strong>and</strong> that study was not funded due to the federal budget problems in FY 07.<br />
WWA03: Climate <strong>and</strong> Water Affairs<br />
GOAL:<br />
Increase decision makers’ level of knowledge about climate science so they can become better consumers <strong>and</strong><br />
dem<strong>and</strong>ers of climate products <strong>and</strong> assessments, <strong>and</strong> help WWA set its research agenda.<br />
MILESTONE WWA03.1:<br />
Dendrohydrological Workshops. Increasing interest by water managers in tree-ring<br />
reconstructions of streamflow has led to dem<strong>and</strong> for a h<strong>and</strong>s-on workshop on how the<br />
reconstructions are generated <strong>and</strong> assessed. Goal is to provide managers with the tools to better<br />
interpret <strong>and</strong> apply the reconstructions to planning.<br />
ACCOMPLISHMENTS FOR WWA03.1:<br />
Workshops in Tucson (November 1, 2006) <strong>and</strong> Durango (May 31, 2007) were organized <strong>and</strong> conducted by WWA.<br />
Full information on these workshops can be obtained at http://wwa.colorado.edu/resources/paleo/workshops.html.<br />
This site includes the PowerPoint files from the presentations.<br />
MILESTONE WWA03.2:<br />
Dendrohydrological Capacity Building. Researchers in Wyoming have expressed interest in<br />
learning technical details about streamflow reconstructions. This workshop will provide these<br />
researchers with capacity to begin streamflow reconstructions<br />
ACCOMPLISHMENTS FOR WWA03.2:<br />
A one-day workshop was conducted to provide background <strong>and</strong> training on dendrochronological techniques to<br />
representatives of the civil engineering department at the University of Wyoming <strong>and</strong> of the Wyoming Water<br />
Development Commission. The training session was an important step toward the establishment of a tree-ring<br />
laboratory <strong>and</strong> active research program in reconstructing stream flows at the University of Wyoming.<br />
MILESTONE WWA03.3:<br />
Climate Change for Water Resource Managers Workshop. In conjunction with local consulting<br />
firm which is working on a NOAA CPO grant to study climate change with a local water provider<br />
(Stratus), sponsor a workshop on climate change for water managers. Invitees will include<br />
Colorado <strong>and</strong> Wyoming managers.<br />
ACCOMPLISHMENTS FOR WWA03.3:<br />
This workshop was delayed because Stratus <strong>and</strong> its subcontractor, Hydrosphere, encountered difficulties in<br />
completing their work products. These work products are a key element of the planned workshop. It will be held in<br />
79
<strong>Scientific</strong> <strong>Theme</strong>: Integrating Activities<br />
fall 2007 in Boulder, likely in October. WWA held a workshop on November 17, 2006 in Golden, Colorado, with<br />
water managers from approximately 20 agencies to discuss climate change impacts on water resources.<br />
MILESTONE WWA03.4:<br />
Forecast Verification Workshop. In order to gauge forecast quality, users must know the accuracy<br />
<strong>and</strong> skill of seasonal forecasts. This workshop will introduce water managers to the basics of<br />
forecast verification statistics. Invitees will include Colorado <strong>and</strong> Wyoming managers.<br />
ACCOMPLISHMENTS FOR WWA03.4:<br />
This workshop has been delayed until the fall or winter of 2007/2008.<br />
MILESTONE WWA03.5:<br />
Climate <strong>and</strong> Tourism Workshop. Tourism <strong>and</strong> recreation in the West are a large part of the<br />
economy <strong>and</strong> are strongly linked to climate. This workshop will result in an applied research <strong>and</strong><br />
services agenda.<br />
ACCOMPLISHMENTS FOR WWA03.5:<br />
This workshop was held January 23-24, 2007 at NCAR in Boulder. Approximately 25 people attended. A workshop<br />
summary has been accepted for publication in BAMS. Information on the workshop is here:<br />
http://wwa.colorado.edu/outreach/climatetourworkshop.html.<br />
MILESTONE WWA03.6:<br />
Water Availability Task Force. Provide technical support for Governor’s drought task force as<br />
needed.<br />
ACCOMPLISHMENTS FOR WWA03.6:<br />
The WWA team regularly attends the Water Availability Task Force meetings, which occur about ten times per<br />
year. The team supplies the task force with ―experimental guidance‖ (located at<br />
http://www.cdc.noaa.gov/people/klaus.wolter/SWcasts/ <strong>and</strong> responds to climate-related information requests from<br />
the task force.<br />
MILESTONE WWA03.7:<br />
Law School Climate Change Workshop. Co-sponsor a large event at the CU Law School on<br />
climate change for attorneys <strong>and</strong> other decision makers.<br />
ACCOMPLISHMENTS FOR WWA03.7:<br />
27th Annual NRLC Summer Conference: Climate Change <strong>and</strong> the Future of the American West: Exploring the<br />
Legal <strong>and</strong> Policy Dimensions. WWA assisted as a co-sponsor for the CU Law School Workshop on climate change<br />
for attorneys <strong>and</strong> other decision makers.<br />
http://www.colorado.edu/law/centers/nrlc/summerconference/2006/index.htm.<br />
MILESTONE WWA03.8:<br />
Speakers for Interested Organizations <strong>and</strong> Public Events. From time to time, WWA is invited to<br />
speak on the interaction of climate <strong>and</strong> water at public events or to various organizations.<br />
ACCOMPLISHMENTS FOR WWA03.8:<br />
Many workshops, meetings <strong>and</strong> presentations were conducted to facilitate information sharing <strong>and</strong> interaction<br />
between scientists <strong>and</strong> local stakeholders about water dem<strong>and</strong>s <strong>and</strong> climate change.<br />
Selected Workshops, Meetings & Presentations<br />
National Association of Clean Water Agencies. Future Water Quality Challenges <strong>and</strong> the Role of Reuse.<br />
Seattle, WA. July 20, 2006.<br />
―WWA Activities‖ poster. NIDIS Planning Meeting. Longmont, CO. September 21-22, 2006.<br />
80
<strong>Scientific</strong> <strong>Theme</strong>: Integrating Activities<br />
Future Water Policy in the Western U.S.: The Colorado River. American Meteorological Society Policy<br />
Briefing. Washington, DC. September 25, 2006.<br />
High Country Citizens‘ Alliance. The Changing Climate of Climate Change. Crested Butte, CO. September<br />
28, 2006.<br />
Aspen ―Canary Project‖ Workshop: WWA team members attended workshop <strong>and</strong> served as a climate<br />
information source for Workshop organizers <strong>and</strong> affiliates. Aspen, CO. October 5, 2006.<br />
Water, Drought <strong>and</strong> Wyoming‘s Climate: WWA co-sponsored an all day workshop hosted by the<br />
University of Wyoming <strong>and</strong> others dedicated to underst<strong>and</strong>ing how climate variability <strong>and</strong> change impacts<br />
Wyoming‘s water resources. URL: http://www.uwyo.edu/enr/WyomingWater.asp. University of Wyoming,<br />
Laramie, WY. October 5, 2006. Workshop Report:<br />
http://www.uwyo.edu/enr/WaterClimateConfFall2006/WaterDroughtWyomingClimateWorkshopFinalRepo<br />
rtNov2006.pdf<br />
Climate Change <strong>and</strong> Variability in the San Juan Mountains. WWA co-sponsored a workshop to facilitate<br />
information sharing <strong>and</strong> interaction between scientists <strong>and</strong> local stakeholders regarding the implications<br />
<strong>and</strong> potential impacts of climate variability <strong>and</strong> change in the San Juan Mountain region. Durango, CO.<br />
October 11-13, 2006. http://www.mountainstudies.org/<br />
South Platte Forum. Presented forecast for the upcoming winter season. Longmont, CO. October 26, 2006.<br />
Climate Diagnostics <strong>and</strong> Prediction Workshop (CDPW). Boulder, CO. October 26, 2006.<br />
Climate Support Collaboration with Bureau of Reclamation: In response to the five-year 1999-2004<br />
drought, Reclamation began an Environmental Impact Statement (EIS) in 2005 to determine how to operate<br />
Lakes Mead <strong>and</strong> Powell in a coordinated fashion, <strong>and</strong> to establish objective criteria for declaring <strong>and</strong><br />
implementing shortages on the Colorado River. WWA sponsored a large kick-off meeting with<br />
approximately 30 individuals. Boulder, CO. November 7, 2006.<br />
Workshop for Resource Managers: Congreso Internacional de los Servicios Ecosistemicos en los<br />
Neotropics. ―Paleohydrologic records of streamflow: Research to applications.‖ Universidad Austral de<br />
Chile, Valdivia, Chile, November 13-17, 2006.<br />
Western States Water Council: ―What‘s a RISA anyway? Irvine, CA. November 15, 2006.<br />
Climate Change for Water Resource Managers Workshop. WWA held a meeting to discuss climate change<br />
impacts on water resources. Invitees included Colorado <strong>and</strong> Wyoming managers, Golden, CO. November<br />
17, 2006.<br />
National Wildlife Federation Tribal L<strong>and</strong>s Conference. Climate Threats to the Colorado River. Yuma, AZ.<br />
December 5, 2006.<br />
Upper Colorado River Commission. Climate Change Predictions <strong>and</strong> Impacts on Colorado River Water<br />
Supplies. Las Vegas, NV. December 13, 2006.<br />
Climate <strong>and</strong> Tourism Workshop: Identifying links between climate variability <strong>and</strong> change <strong>and</strong> tourism<br />
industries on the Colorado Plateau. Boulder, CO, January 23-24, 2007.<br />
National Seasonal Assessment Workshop (NSAW) for Wildfire Potential in the Western States <strong>and</strong> Alaska.<br />
Boulder, CO. April 24, 2007.<br />
Integration of WWA Activities with the ―Climate <strong>and</strong> Management of the Colorado River‖ project, funded<br />
separately by NOAA under the Human Dimensions (SARP or ―Sectors‖) initiative. This project entails a<br />
variety of interactions between WWA personnel <strong>and</strong> Colorado River stakeholder at relevant meetings (e.g.,<br />
the annual meeting of the Colorado River Water Users Association). Collaboration resulted in five<br />
presentations throughout the year.<br />
Front Range Residential Water Dem<strong>and</strong>: Collaboration resulted in three presentations throughout the year.<br />
WWA04: Management<br />
GOAL:<br />
Provide overall guidance to project as well as day-to-day management.<br />
MILESTONE WWA04.1:<br />
General Management Activities. Hold biweekly team meetings. Prepare Annual budget. Interact<br />
with RISA Program managers. Interact with CIRES <strong>and</strong> NOAA administrative staff. Establish<br />
strategic activities.<br />
81
<strong>Scientific</strong> <strong>Theme</strong>: Integrating Activities<br />
ACCOMPLISHMENTS FOR WWA04.1:<br />
General management activities were preformed. The WWA budget <strong>and</strong> statement of work are the products of this<br />
activity, <strong>and</strong> were submitted to NOAA in June 2007.<br />
MILESTONE WWA04.2:<br />
Western Water Assessment Website. Provide a portal into all Western Water activities for<br />
researchers, water providers <strong>and</strong> the public.<br />
ACCOMPLISHMENTS FOR WWA04.2:<br />
The Western Water Assessment website is located at http://wwa.colorado.edu. During the year, a new interface that<br />
features our current activities was added. The interface includes ―Water <strong>and</strong> Climate in the News,‖ ―Upcoming<br />
Events,‖ <strong>and</strong> ―Recent WWA Activities.‖ Significant content during the year was added to the following sections:<br />
http://wwa.colorado.edu/about/homepages/udall/<br />
http://wwa.colorado.edu/resources/colorado_river/<br />
http://wwa.colorado.edu/resources/western_water_law/<br />
http://wwa.colorado.edu/resources/paleo/<br />
A major redesign in 2007-2008 with a more user-centric focus is planned.<br />
MILESTONE WWA04.3:<br />
Inform NOAA about Climate Services Needs. An important part of the WWA mission is to keep<br />
NOAA NWS <strong>and</strong> OAR informed of new <strong>and</strong> evolving user needs, existing product limitations, <strong>and</strong><br />
general lessons from the water management community.<br />
ACCOMPLISHMENTS FOR WWA04.3:<br />
WWA provides input to the NWS on a variety of fronts:<br />
1) Participation in regular teleconferences with CPC to assist with seasonal forecasting;<br />
2) Contribution to the creation of Drought Monitor;<br />
3) Regular interaction with NWS Regional Climate Focal Points <strong>and</strong> attendance at events sponsored by NWS;<br />
4) Collaboration with NWS Colorado River Basin Forecast Center to improve volumetric forecasts <strong>and</strong><br />
communication thereof;<br />
5) Attendance at the NWS Climate Services Division-sponsored annual event, ―Climate Prediction<br />
Applications Science Workshop.‖<br />
IA-03: Resource Development for Educators <strong>and</strong> Decision Makers<br />
Policy02: Outreach to Decision Makers through the Internet<br />
GOAL:<br />
Provide useful information that will help improve the relationship between societal needs <strong>and</strong> science <strong>and</strong><br />
technology policies.<br />
MILESTONE Policy02.1:<br />
Completely revamp the widely read science policy weblog, Prometheus, to make it more userfriendly,<br />
as well as continue to maintain <strong>and</strong> upgrade the Center's website as a whole.<br />
ACCOMPLISHMENTS FOR Policy02.1:<br />
Researchers at the Center for Science <strong>and</strong> Technology Policy continue to add content to their website to keep it<br />
timely <strong>and</strong> informative but have had to delay substantial expansion <strong>and</strong> upgrading for the time being, because they<br />
currently do not have a webmaster. One significant addition this year was a new page describing books authored by<br />
Center personnel.<br />
Policy03: Outreach to Decision Makers through Newsletters<br />
82
<strong>Scientific</strong> <strong>Theme</strong>: Integrating Activities<br />
GOAL:<br />
Provide useful information that will help improve the relationship between societal needs <strong>and</strong> science <strong>and</strong><br />
technology policies.<br />
MILESTONE Policy03.1:<br />
Continue to improve content of newsletter to make it of greater interest to the science <strong>and</strong><br />
technology policy community <strong>and</strong> decision makers. Increase the number of subscribers <strong>and</strong><br />
distribute the newsletter more widely. Add a bimonthly science-policy briefing email that is sent to<br />
hundreds of science policy decision makers in Washington, D.C. <strong>and</strong> elsewhere, highlighting<br />
Center activities. Continue to exp<strong>and</strong> <strong>and</strong> upgrade this effort in the 2006-2007 time period.<br />
ACCOMPLISHMENTS FOR Policy03.1:<br />
Policy Center personnel continue to strive to make the quarterly newsletter of interest to the science <strong>and</strong> technology<br />
policy community by soliciting contributions from experts in the field on highly topical subjects. They have<br />
increased the subscription rate by 8% since last year. The science-policy briefing mailing list has grown from more<br />
than 2,000 to almost 3,500 science-policy decision makers around the world, <strong>and</strong> the center continues to receive<br />
positive feedback about the briefing.<br />
83
<strong>Scientific</strong> <strong>Theme</strong>: Planetary Metabolism<br />
<strong>Scientific</strong> <strong>Theme</strong>: PLANETARY METABOLISM<br />
PM-01: Biosphere-Atmosphere Interactions<br />
CSD07: Biosphere-Atmosphere Exchange<br />
PM-02: Response of Natural <strong>Systems</strong> to Perturbations<br />
NGDC07: Anthropogenic Remote Sensing<br />
CSD07: Biosphere-Atmosphere Exchange<br />
PM-01: Biosphere-Atmosphere Interactions<br />
GOAL:<br />
Gain an improved underst<strong>and</strong>ing of the role that the exchange of gases between the surface <strong>and</strong> the atmosphere<br />
plays in shaping regional climate <strong>and</strong> air quality.<br />
MILESTONE CSD07.1:<br />
Determine the impact of the 2004 forest fires in Alaska <strong>and</strong> western Canada on the atmosphere<br />
over North America.<br />
ACCOMPLISHMENTS FOR CSD07.1:<br />
During aircraft measurements in 2004 over the northeastern United States, large forest fires were burning in Alaska<br />
<strong>and</strong> western Canada, <strong>and</strong> the emissions were regularly observed over eastern Canada <strong>and</strong> the northeastern U.S.<br />
Using measurements of acetonitrile (CH3CN), a unique tracer for forest-fire emissions, CIRES scientists were able<br />
to detect the emissions <strong>and</strong> compare the observations to the output from the Lagrangian transport model Flexpart. In<br />
general, Flexpart reproduced the observations very well, in particular when the emissions were released in the model<br />
not at the surface but at an altitude of several kilometers, indicating the importance of pyro-convection.<br />
The measurement results were used to estimate the contribution of forest-fire emissions to the carbon monoxide<br />
(CO) observed over the northeastern U.S. Using acetonitrile as a tracer for forest-fire emissions <strong>and</strong> chloroform as a<br />
tracer for urban emissions, scientists were able to separate the contribution of these sources to CO. Averaged over<br />
the study period, forest-fire CO contributed 30% <strong>and</strong> urban CO 70% of the enhancements over the continental CO<br />
background: Urban CO dominated in the boundary layer, whereas in the free troposphere the contributions from<br />
urban <strong>and</strong> forest fire CO were about equal. The observations in the boundary layer were consistent with those made<br />
from the R/V Ronald H. Brown in the Gulf of Maine. The source attribution was compared with the output from the<br />
Flexpart model. In general, there was a good qualitative agreement between urban CO in the measurements <strong>and</strong> the<br />
model. However, the model over-predicted the observed urban CO, indicating that emissions inventories for this<br />
trace gas may be too high as observed by others. The agreement between measured <strong>and</strong> modeled forest-fire CO was<br />
also quite good; in this case, the model reproduced the measurements quantitatively, indicating that emissions from<br />
forest fires are accurately represented in the inventories. This study allows us to estimate the total emissions of CO<br />
due to forest fires in Alaska <strong>and</strong> western Canada as 22 Tg during the measurement period in 2004, in quite good<br />
agreement with a previous study that used satellite data for CO <strong>and</strong> an inverse-model estimate of the emission<br />
sources.<br />
PM-02: Response of Natural <strong>Systems</strong> to Perturbations<br />
NGDC07: Anthropogenic Remote Sensing<br />
GOAL:<br />
Provide spatial <strong>and</strong> temporal depictions of human activities based on satellite detection <strong>and</strong> mapping of population<br />
centers, fires, gas flares, <strong>and</strong> heavily lit fishing boats.<br />
MILESTONE NGDC07.1:<br />
Produce the first global ~1 kilometer map of the density of constructed impervious surface areas.<br />
84
<strong>Scientific</strong> <strong>Theme</strong>: Planetary Metabolism<br />
ACCOMPLISHMENTS NGDC07.1:<br />
Although exact numbers are elusive, there is a general consensus that in the past 30 years the world‘s population has<br />
had the highest absolute increase in human history. Additionally, it is agreed that more <strong>and</strong> more of the world<br />
population will live in urbanized areas, leading to increases in impervious surfaces world wide. Increases in<br />
impervious surface area (ISA) have a widespread impact on the environment. The effects range from altering<br />
hydrology <strong>and</strong> temperature to impact on the carbon cycle. To underst<strong>and</strong> these changes, ISA around the globe must<br />
first be mapped. To this end, a global map of ISA has been created <strong>and</strong> made available to the public. Three data sets<br />
were used in the process: Nighttime Lights from the Defense Meteorological Satellite Program (DMSP) Operational<br />
Linescan System (OLS); population counts from L<strong>and</strong>scan (2004); <strong>and</strong> aerial photographs collected along urban to<br />
rural development transects for 13 major cities in the United States. All the data were converted to 1 km-equal area<br />
grids. Gridded point counts were performed on a 1-km aerial photo tile (matching a 1-km grid cell in the other two<br />
data sets) to estimate the percentage of ISA in each tile. Linear regression was then used to develop a model for<br />
estimating percentage of ISA based on the Nighttime Lights <strong>and</strong> population. The global map of ISA can be used for<br />
studies in a variety of fields including hydrological modeling, analyzing terrestrial carbon dynamics, <strong>and</strong> urban<br />
growth modeling.<br />
MILESTONE NGDC07.2:<br />
Develop near-real-time global nighttime lights mosaic processing <strong>and</strong> access system<br />
ACCOMPLISHMENTS NGDC07.2:<br />
CIRES personnel in collaboration with NOAA scientists have implemented a prototype, near real-time visible <strong>and</strong><br />
thermal global mosaic generation <strong>and</strong> online access system using nighttime data from the Operational Linescan<br />
System (OLS) sensor on the Defense Meteorological Satellite Program (DMSP) spacecraft. The real-time mosaic<br />
products are now available to authorized users of the DMSP nighttime lights product for assessment <strong>and</strong> comment<br />
via web mapping service (WMS) <strong>and</strong> Web Coverage Service (WCS). Further testing <strong>and</strong> product refinement are<br />
expected as users become familiar with the product <strong>and</strong> develop Earth-imagery analysis capabilities based on the<br />
availability of these mosaics. Real-time imagery using the DMSP Nighttime Lights has immediate application in<br />
natural-disaster mitigation, homel<strong>and</strong> security applications, <strong>and</strong> military operations.<br />
Near-real time global nighttime lights mosaic.<br />
MILESTONE NGDC07.3:<br />
Develop time series of national gas flaring volume estimates extending from 1992 through 2005.<br />
ACCOMPLISHMENTS NGDC07.3:<br />
CIRES scientists have assisted NOAA in the development of annual estimates of national <strong>and</strong> global gas flaring for<br />
the years 1995 through 2006 using low-light imaging data acquired by the Defense Meteorological Satellite Program<br />
(DMSP) spacecraft. These gas flaring estimates are based on a calibration procedure developed using known<br />
national gas flaring volumes <strong>and</strong> data from individual gas flares. Using the Earth-imagery data from DMSP, NOAA<br />
85
<strong>Scientific</strong> <strong>Theme</strong>: Planetary Metabolism<br />
has shown that the global gas flaring volume has remained largely stable over the past twelve years <strong>and</strong> in the range<br />
of 150 to 170 billion cubic meters (BCM) per year. In 2006, the gas flaring estimate of 168 BCM represented 27%<br />
of the natural gas consumption by the United States with a potential market value of $69 billion. Another factor to<br />
consider is that the global gas flaring adds more than 84 million metric tons of carbon to the atmosphere each year.<br />
Capture <strong>and</strong> effective use of the flared gas is an obvious c<strong>and</strong>idate in efforts to reduce global carbon emissions.<br />
Global gas-flare imagery <strong>and</strong> estimates of flaring by country:<br />
http://www.ngdc.noaa.gov/dmsp/interest/gas_flares.html.<br />
86
<strong>Scientific</strong> <strong>Theme</strong>: Planetary Metabolism<br />
Time series of national gas flaring volume estimates extending from 1992 through 2005.<br />
MILESTONE NGDC07.4:<br />
Develop the first global map of poverty rates derived from satellite data.<br />
ACCOMPLISHMENTS NGDC07.4:<br />
CIRES has assisted NOAA in developing a global poverty map that has been produced at 30-arc second resolution<br />
using a derived poverty index calculated by dividing population count (L<strong>and</strong>Scan 2004) by the brightness of<br />
satellite-observed nighttime lighting for the Defense Meteorological Satellite Program (DMSP) spacecraft. Inputs to<br />
the L<strong>and</strong>Scan product include satellite-derived l<strong>and</strong> cover <strong>and</strong> topography, plus human settlement outlines derived<br />
from high-resolution imagery. The poverty estimates have been calibrated using national-level poverty data from the<br />
World Development Indicators (WDI) 2006 edition. The total estimate of the numbers of individuals living in<br />
poverty is 2.3 billion, slightly under the WDI estimate of 2.6 billion. This significant work demonstrates a new<br />
technique for determining global poverty rates. It is expected that this technique will become increasingly more<br />
accurate as new reference data for calibration of poverty estimates become available <strong>and</strong> as improvements are made<br />
in the satellite observation of human activities related to economic activity <strong>and</strong> technology access.<br />
http://www.ngdc.noaa.gov/dmsp/download_poverty.html.<br />
Develop the first global map of poverty rates derived from satellite data.<br />
87
<strong>Scientific</strong> <strong>Theme</strong>: Regional Processes<br />
<strong>Scientific</strong> <strong>Theme</strong>: REGIONAL PROCESSES<br />
RP-01: Regional Hydrologic Cycles in Weather <strong>and</strong> Climate<br />
PSD11: Water Cycle<br />
RP-02: Surface/Atmosphere Exchange<br />
PSD12: Air-Sea Interaction<br />
RP-03: Regional Air Quality<br />
CSD08: Regional Air Quality<br />
GMD06: Baseline Air Quality<br />
GSD02: Regional Air Quality Prediction<br />
PSD13: Air Quality<br />
RP-04: Intercontinental Transport <strong>and</strong> Chemical Transformation<br />
CSD05: Tropospheric <strong>and</strong> Stratospheric Transport <strong>and</strong> Chemical Transformation<br />
RP-05 Aerosol Chemistry <strong>and</strong> Climate Implications<br />
CSD09: Aerosol Formation, Chemical Composition, <strong>and</strong> Radiative Properties<br />
PSD11: Water Cycle<br />
RP-01: Regional Hydrologic Cycles in Weather <strong>and</strong> Climate<br />
GOAL:<br />
Improve weather <strong>and</strong> climate predictions through an increased knowledge of regional <strong>and</strong> global water cycle<br />
processes.<br />
MILESTONE PSD11.1:<br />
Plan <strong>and</strong> execute the 2007 HMT-West (Hydrometeorology Testbed) field campaign in the<br />
northern California American River basin, located in the Sierra Nevada Mountains west of Lake<br />
Tahoe <strong>and</strong> east of Sacramento. This effort will involve deployment of several instrument systems<br />
utilized in HMT-West 2006 deployment in the American River Basin that will yield critical new<br />
underst<strong>and</strong>ing of orographic influences on airflow <strong>and</strong> precipitation growth over the Sierra<br />
Nevada mountains as well as streamflow response. CIRES investigators will be key participants<br />
<strong>and</strong> contributors to this activity.<br />
ACCOMPLISHMENTS FOR PSD11.1:<br />
The second year of full-scale field operations for HMT in the American River Basin (HMT-West 2007) was<br />
conducted from November 30, 2006 to March 22, 2007. The winter was drier than normal in the area, <strong>and</strong> only<br />
seven intensive operating periods (IOPs) were conducted, compared to fourteen in the previous wetter-than-normal<br />
winter. Not surprisingly, streamflow was also much reduced during HMT-West 2007 compared to HMT-West 2006.<br />
However, two of the seven IOPs were very large storms; one dropped nine inches of rainfall (IOP 5) <strong>and</strong> the other<br />
dropped three feet of snow at Blue Canyon (IOP 7). Concentrated arrays of unattended instruments, including wind<br />
profilers, S-b<strong>and</strong> precipitation profilers, various disdrometers, conventional <strong>and</strong> experimental precipitation <strong>and</strong> snow<br />
gauges, soil moisture sensors, stream level gauges, <strong>and</strong> surface meteorological stations monitored atmospheric <strong>and</strong><br />
hydrologic conditions continuously for the entire four months. These observations were augmented during IOPs by<br />
manned operations of the NSSL SMART-R gap-filling Doppler radar <strong>and</strong> serial radiosonde launches by local<br />
students managed by ESRL PSD. Supplemental rawinsondes were released from Reno on three of the seven IOP‘s.<br />
Unfortunately, staffing limitations at Oakl<strong>and</strong> allowed supplemental rawinsonde releases during part of only one<br />
IOP. Experimental, high-resolution (3 km) numerical weather-prediction models were run daily by ESRL GSD <strong>and</strong><br />
produced probabilistic forecasts of various precipitation amounts in the Basin. Forecasts, crew deployments, <strong>and</strong><br />
storm debriefings were discussed on daily conference calls among the NWS, ESRL, <strong>and</strong> NSSL participants of<br />
HMT-West 2007.<br />
88
<strong>Scientific</strong> <strong>Theme</strong>: Regional Processes<br />
MILESTONE PSD11.2:<br />
Develop <strong>and</strong> test an attenuation-based method to retrieve vertical profiles of rainfall rate from<br />
vertically pointing Ka-b<strong>and</strong> radars.<br />
ACCOMPLISHMENTS FOR PSD11.2:<br />
A method to retrieve vertical profiles of rain rates was developed for application with the ARM vertically pointing<br />
Ka-b<strong>and</strong> radars. Unlike traditional radar approaches, this method is based on reflectivity vertical gradient<br />
measurements <strong>and</strong> utilizes a linear relation between rain rate <strong>and</strong> the attenuation coefficient. Applications of the<br />
method to a number of rain events observed at the ARM instrumented sites indicated its robustness for rain rates<br />
greater than about 4 mm/h.<br />
PSD12: Air-Sea Interaction<br />
RP-02: Surface/Atmosphere Exchange<br />
GOAL:<br />
Perform cutting-edge micrometeorological <strong>and</strong> climatological research over the open ocean aboard research<br />
vessels, sea-based towers, <strong>and</strong> buoys.<br />
MILESTONE PSD12.1:<br />
Process Eastern Pacific Investigations of Climate (EPIC) <strong>and</strong> the North American Monsoon<br />
Experiment (NAME) data sets, provide a detailed analysis of these air-sea interaction data<br />
products, <strong>and</strong> make the final data set publicly available. Deployment on new excursions within the<br />
EPIC STRATUS region is imminent, as is a cruise in African Monsoon Multidisciplinary Analyses<br />
(AMMA) region.<br />
ACCOMPLISHMENTS FOR PSD12.1:<br />
CIRES scientists participated in STRATUS 2006 <strong>and</strong> AMMA 2007 cruises. Data from 25 cruises are now on the<br />
ESRL/PSD archive (ftp://ftp.etl.noaa.gov/et6/archive).<br />
MILESTONE PSD12.2:<br />
Parameterization of sea spray will continue as part of the NOAA hurricane studies.<br />
ACCOMPLISHMENTS FOR PSD12.2:<br />
The sea-spray parameterization work was re-invigorated with a grant from the Joint Hurricane Testbed (JHT). A<br />
new version was developed that uses inputs for kinetic energy lost to wave breaking, friction velocity, wave height,<br />
<strong>and</strong> wave period. This version was tuned to the University of Miami MM5 coupled ocean-atmosphere-wave model<br />
<strong>and</strong> UM has done some preliminary hurricane simulations. CIRES scientists are now collaborating with the<br />
University of Rhode Isl<strong>and</strong> on a similar approach using the GFDL wave model planned for the HWRF. A new<br />
version of the sea-spray parameterization was developed. This model uses inputs for kinetic energy lost to wave<br />
breaking, friction velocity, wave height, <strong>and</strong> wave period.<br />
MILESTONE PSD12.3:<br />
Further quantify the air-sea transfer of gases <strong>and</strong> use a detailed physical analysis of data<br />
obtained from the Post-GasEx surface processes experiments to evaluate <strong>and</strong> improve gastransfer<br />
parameterizations. Participate in the 2006 TexAQS Air Quality Study in Houston <strong>and</strong><br />
deploy a ship-based system for ozone flux measurements.<br />
ACCOMPLISHMENTS FOR PSD12.3:<br />
Work continued with parameterizations for CO2, ozone <strong>and</strong> DMS. Ozone data from the TexAQS <strong>and</strong> STRATUS<br />
2006 cruises will be used to evaluate the ozone parameterization.<br />
MILESTONE PSD12.4:<br />
Develop a robust ship-based system for routine ship-based CO2 flux measurements that will be<br />
integrated into the existing ESRL-PSD ship-based turbulent flux measurement system.<br />
89
<strong>Scientific</strong> <strong>Theme</strong>: Regional Processes<br />
ACCOMPLISHMENTS FOR PSD12.4:<br />
This project involves the repackaging of fast CO2 sensors to permit continuous, unattended deployment on the<br />
NOAA R/V Ronald H. Brown. The goal is to obtain an extensive database of CO2 flux <strong>and</strong> transfer velocity for a<br />
variety of verification <strong>and</strong> parameterization development objectives. The project has been underway for about a<br />
year. A system has been designed, sensors acquired, <strong>and</strong> tested at the pier at Duck, NC. The system was field tested<br />
on a Norwegian ship in the summer of 2006. The data are presently being evaluated. An improved version of the<br />
sensor will be deployed on the GOMECC cruise in July 2007.<br />
MILESTONE PSD12.5:<br />
Create a multi-year global oceanic data set of near-surface temperature <strong>and</strong> humidity using a<br />
multi-sensor satellite retrieval method recently developed at the ESRL Physical Sciences<br />
Division.<br />
ACCOMPLISHMENTS FOR PSD12.5:<br />
A 12-year (1993-2004) global oceanic data set of near-surface humidity has been developed using SSM/I <strong>and</strong><br />
SSM/T-2 satellite sensors, <strong>and</strong> a 7-year (1999-2005) data set of both near-surface humidity <strong>and</strong> temperature has<br />
been developed combining AMSU-A <strong>and</strong> SSM/I satellite sensors. Updated regression coefficients using an<br />
enhanced training data set generally provide less bias than the previous version <strong>and</strong> particularly improve the Qa<br />
retrievals exceeding 16 g/kg. A stability correction was introduced to the humidity retrieval to repair wet biases in<br />
the summertime North Pacific observations that often exceeded 3 g/kg. Multi-year comparison with I-COADS<br />
indicates a smaller bias <strong>and</strong> rms difference when compared with existing single-sensor SSM/I retrieval methods.<br />
Ultimately, improvements in these Ta <strong>and</strong> Qa products will help improve retrievals of latent <strong>and</strong> sensible heat fluxes<br />
derived from air-sea bulk turbulent flux models. Heat fluxes derived using these products <strong>and</strong> the COARE version 3<br />
bulk model are currently being conducted. Products include:<br />
A 12-year near-surface humidity data set of daily mean 1-degree data derived from SSM/I <strong>and</strong> SSM/T-2<br />
observations<br />
A 7-year near-surface humidity <strong>and</strong> temperature data set of daily mean 1-degree data from AMSU-A <strong>and</strong><br />
SSM/I observations.<br />
0.5 degree/3-hourly grid data are currently available for 1999 but will be extended to the same time periods<br />
as the 1 degree/daily averaged data given above.<br />
MILESTONE PSD12.6:<br />
Study <strong>and</strong> parameterization of stable boundary-layers as part of the NOAA/NSF Polar Programs.<br />
ACCOMPLISHMENTS FOR PSD12.6:<br />
Structure of the stable boundary layer (SBL) in the Arctic has been examined based on measurements made during<br />
the Surface Heat Budget of the Arctic Ocean experiment (SHEBA). Turbulent <strong>and</strong> mean meteorological data<br />
collected at five levels on a 20-m tower over the Arctic pack ice during eleven months of measurements cover a<br />
wide range of stability conditions, from the weakly unstable regime to very stable stratification. According to<br />
SHEBA data, stratification <strong>and</strong> the Earth‘s rotation control the SBL over a flat rough surface. Traditional Monin-<br />
Obukhov similarity theory works well in the weakly stable regime. As stability increases, the near-surface<br />
turbulence is affected by the turning effects of the Coriolis force (the turbulent Ekman layer). In this regime, the<br />
surface layer, where the turbulence is continuous, may be very shallow (less than 5 m). Turbulent transfer near the<br />
―critical Richardson number‖ is characterized by small but still significant heat flux <strong>and</strong> negligible stress. The<br />
supercritical stable regime where the bulk Richardson number exceeds a critical value 0.2 is associated with<br />
collapsed turbulence <strong>and</strong> the strong influence of the Earth‘s rotation, even near the surface. The comprehensive data<br />
set collected during SHEBA allows study of the profile stability functions of momentum (nondimensional gradient<br />
of wind-speed), sensible heat (non-dimensional gradient of temperature), <strong>and</strong> derivative quantities such as the<br />
turbulent Pr<strong>and</strong>tl number <strong>and</strong> the gradient Richardson number in detail, including the very stable case.<br />
New parameterizations for the profile stability functions in stable conditions are proposed to describe the SHEBA<br />
data; these cover the entire range of the stability parameter z/L from neutral to very stable conditions, where L is the<br />
Obukhov length <strong>and</strong> z is the measurement height. In the limit of very strong stability, stability functions of<br />
momentum follows the ―1/3‖ dependence in the very stable regime (in log-log coordinates), whereas stability<br />
functions of sensible heat flux initially increases with increasing z/L, reaches a maximum at about z/L=10, <strong>and</strong> then<br />
tends to level off with increasing z/L<br />
90
CSD08: Regional Air Quality<br />
<strong>Scientific</strong> <strong>Theme</strong>: Regional Processes<br />
RP-03: Regional Air Quality<br />
GOAL:<br />
Carry out laboratory measurements, atmospheric observations, <strong>and</strong> diagnostic analyses that characterize the<br />
chemical <strong>and</strong> meteorological processes involved in the formation of pollutant ozone <strong>and</strong> fine particles. Undertake<br />
research that contributes to the enhancement of air quality prediction <strong>and</strong> forecasting capabilities.<br />
MILESTONE CSD08.1:<br />
Plan <strong>and</strong> execute the 2006 Texas Air Quality Study (TexAQS) field study.<br />
ACCOMPLISHMENTS FOR CSD08.1:<br />
In 2006, NOAA/ESRL <strong>and</strong> CIRES led a major multi-institutional intensive field program that focused on<br />
investigating important scientific questions that are common to both climate <strong>and</strong> air quality. The NOAA/ESRL <strong>and</strong><br />
CIRES components of the program are the Texas Air Quality Study (TexAQS) <strong>and</strong> the Gulf of Mexico Atmospheric<br />
Composition <strong>and</strong> Climate Study (GoMACCS). This intensive field study provided significant new information that<br />
is required to afford a better underst<strong>and</strong>ing of the sources <strong>and</strong> atmospheric processes responsible for the formation<br />
<strong>and</strong> distribution of ozone <strong>and</strong> aerosols in the atmosphere <strong>and</strong> the influence that these species have on the radiative<br />
forcing of climate regionally <strong>and</strong> globally, as well as their impact on human health <strong>and</strong> regional haze. The study was<br />
carried out between July 1 <strong>and</strong> October 15, 2006, throughout Texas <strong>and</strong> the northwestern Gulf of Mexico. Three<br />
NOAA/ESRL <strong>and</strong> CIRES‘ platforms were deployed: a NOAA WP-3 aircraft, a NOAA Twin Otter, <strong>and</strong> the<br />
NOAA/ESRL R/V Ronald H. Brown. All objectives of this portion of the study were met.<br />
TexAQS 2006 was the NOAA/ESRL <strong>and</strong> CIRES air quality component of this field experiment. This field<br />
campaign investigated the sources <strong>and</strong> processes that are responsible for photochemical pollution <strong>and</strong> regional haze<br />
during the summertime in Texas. The focus of the study was the transport of ozone <strong>and</strong> ozone precursors within the<br />
state <strong>and</strong> the impact of the long-range transport of ozone or its precursors into the state. In this regard, special<br />
attention was paid to nighttime chemistry <strong>and</strong> transport. The study also investigated how the various urban,<br />
industrial <strong>and</strong> natural sources of aerosols <strong>and</strong> aerosol precursors within the state, <strong>and</strong> the transport of aerosols from<br />
outside the state, contribute to the regional haze that is observed in the state.<br />
The research carried out during the TexAQS/GoMACCS 2006 field campaign was organized around the following<br />
five research areas, each with an associated overarching science question.<br />
Emissions verification <strong>and</strong> assessment – How well do current inventories represent actual emissions for<br />
cities, point sources, ships, <strong>and</strong> vegetation?<br />
Transport <strong>and</strong> mixing – What are the relative amounts of pollution imported to Texas <strong>and</strong> exported from<br />
the continental boundary layer to the marine boundary layer <strong>and</strong> the free troposphere?<br />
Chemical transformation – How do gaseous <strong>and</strong> aerosol emissions evolve chemically <strong>and</strong> physically as<br />
they are transported away from the source regions to the remote atmosphere?<br />
Aerosol properties <strong>and</strong> radiative effects – What are the chemical, physical, <strong>and</strong> optical properties of the<br />
aerosol in this region, <strong>and</strong> how do these properties affect regional haze <strong>and</strong> aerosol direct <strong>and</strong> indirect<br />
radiative forcing of climate?<br />
Forecast models – What is the current skill of air-quality forecast models on local, regional <strong>and</strong> global<br />
scales, <strong>and</strong> what improvements can be made to enhance the accuracy <strong>and</strong> extend the periods of these<br />
forecasts?<br />
Initial policy-relevant findings from this study that were obtained by NOAA/ESRL <strong>and</strong> CIRES scientists have been<br />
incorporated into a Rapid Science Synthesis Report that is posted on the web. Initial scientific findings from the<br />
study were presented at a workshop that was held in Austin from May 29 to June 1, 2007. NOAA/ESRL <strong>and</strong> CIRES<br />
scientists at this workshop presented seventy posters <strong>and</strong> oral presentations. The results of this portion of the study<br />
will also be reported at the Fall Meeting of the AGU in December 2007.<br />
91
<strong>Scientific</strong> <strong>Theme</strong>: Regional Processes<br />
MILESTONE CSD08.2:<br />
Evaluate sulfur dioxide emissions from power plants sampled during the New Engl<strong>and</strong> Air Quality<br />
Study campaign using new ultraviolet spectroscopy methods.<br />
ACCOMPLISHMENTS FOR CSD08.2:<br />
Sulfur dioxide (SO2) emissions are regulated under the National Ambient Air Quality St<strong>and</strong>ards (NAAQS) as<br />
criteria pollutants due to their role in the formation of acid rain. However, SO2 also contributes to other atmospheric<br />
chemistry processes such as the formation of sulfur-containing particles that play a critical role in climate change.<br />
The main emitter of SO2 in the United States is power plants, which account for 67% of the SO2 released into the<br />
atmosphere. Accurate measurements of SO2 from power points are therefore critical in order to underst<strong>and</strong> their<br />
impacts on regional air quality.<br />
Therefore, a near-ultraviolet (UV) spectrometer was deployed during the New Engl<strong>and</strong> Air Quality Study 2004<br />
(NEAQS2K4) aboard the NOAA WP-3D aircraft to measure SO2 emissions from point sources. Using the<br />
differential optical absorption spectroscopy (DOAS) method, SO2 <strong>and</strong> oxygen dimer (O4) differential slant-column<br />
densities are retrieved from the UV spectra. The SO2 differential slant-column densities are used to identify point<br />
source plumes. In a novel approach, the O4 differential slant-column densities are used to calculate an air mass<br />
factor (AMF) or path-length enhancement of photons through the atmosphere. The AMF is used to convert the SO2<br />
differential slant-column densities into SO2 differential vertical-column densities. From the SO2 differential verticalcolumn<br />
densities, SO2 emission fluxes from point sources sampled during NEAQS2K4 are calculated. The measured<br />
SO2 emission fluxes are compared to the reported SO2 emission fluxes from the point sources. The results show<br />
good agreement between the measured <strong>and</strong> the reported point sources of SO2 emission fluxes.<br />
MILESTONE CSD08.3:<br />
Gather data during the 2006 Texas Air Quality study to investigate the role of meteorological<br />
processes in transport <strong>and</strong> mixing of pollutant species in the nighttime stable boundary layer<br />
(SBL).<br />
ACCOMPLISHMENTS FOR CSD08.3:<br />
The NOAA ship-based Doppler lidar was used to investigate the structure of the nighttime boundary layer over the<br />
Gulf of Mexico, corresponding to a marine boundary layer, <strong>and</strong> close to shore near Houston <strong>and</strong> Galveston, where<br />
the environment was more indicative of a terrestrial boundary layer. In the Gulf, CIRES researchers found that<br />
Doppler lidar-derived mixing heights <strong>and</strong> flux-tower surface heat flux measurements showed little to no indication<br />
of a diurnal cycle. Closer to shore, in places like Barbour‘s Cut <strong>and</strong> the Houston Ship Channel, they observed<br />
frequent nocturnal low-level jets that were always followed by low-ozone days (as measured in those locations).<br />
Depending on background levels <strong>and</strong> other atmospheric conditions, nights with low-wind speeds (i.e., without<br />
nocturnal low-level jets) were more likely to be followed by high ozone days. At the Galveston Bay <strong>and</strong> ship<br />
channel locations, strong diurnal cycle characteristics in lidar-derived mixing layer heights were also observed, with<br />
nighttime mixing heights as low as 150 meters during low-level jets, <strong>and</strong> up to 500 meters during nights with lowwind<br />
speed profiles.<br />
MILESTONE CSD08.4:<br />
Contribute to the 2006 TexAQS/GoMACCS Air Quality Study in the Houston, TX, vicinity by<br />
deploying several lidars on an aircraft <strong>and</strong> a research ship.<br />
ACCOMPLISHMENTS FOR CSD08.4:<br />
An airborne ozone lidar <strong>and</strong> two shipborne lidars (a Doppler wind lidar <strong>and</strong> another ozone <strong>and</strong> aerosol profiling<br />
lidar) were successfully deployed during the 2006 Texas Air Quality Study (TexAQS II). These three remotesensing<br />
systems produced extensive, multi-dimensional data sets of wind speed, wind direction, atmospheric<br />
turbulence, ozone concentration, aerosol backscatter <strong>and</strong> extinction, <strong>and</strong> mixed-layer height. Results obtained from<br />
the analysis of these data sets will be key in addressing several important science questions regarding local buildup<br />
<strong>and</strong> regional transport of pollutants in eastern Texas. The analysis of the lidar data sets is ongoing, but several<br />
important findings have already emerged <strong>and</strong> these results have been presented at the TexAQS II Principal Findings<br />
Data Analysis Workshop in Austin, TX, at the end of May 2007.<br />
92
<strong>Scientific</strong> <strong>Theme</strong>: Regional Processes<br />
The airborne lidar measurements were used to provide mesoscale estimates of background ozone under different<br />
synoptic flow regimes. Background ozone levels were significantly higher when air advected into eastern Texas was<br />
continental rather than marine in origin. The highest observed ozone background value was 86 ppb (which is above<br />
the 8-hour NAAQS ozone st<strong>and</strong>ard) <strong>and</strong> occurred after several days of continuous easterly flow conditions. In order<br />
to quantify the export of pollutants from strong localized sources to surrounding rural areas, airborne ozone lidar<br />
data from flight transects downwind of Houston <strong>and</strong> Dallas were used to compute the horizontal flux of ozone<br />
produced by these two metropolitan areas. The ozone flux produced by the Houston metro area over an 8-hour<br />
period is equivalent to a 10-ppb increase in ozone over an approximately 10,000 square-mile area, assuming a 2-kmdeep<br />
boundary layer. The ozone flux for the Dallas metro area was about a factor of 2-3 smaller than that observed<br />
for Houston. Other applications of the airborne lidar data include the investigation of the correlation between<br />
boundary layer depth <strong>and</strong> ozone concentration downwind of source regions, the relationship between wind speed<br />
<strong>and</strong> above-background ozone concentrations, <strong>and</strong> the enhancement of mixing height associated with the urban heat<br />
isl<strong>and</strong> effect. Data from the ship-borne Doppler lidar were utilized to characterize the l<strong>and</strong> sea breeze circulation,<br />
low-level jets, <strong>and</strong> vertical mixing, all important meteorological processes that contribute to pollution buildup or<br />
depletion in the Houston area. In particular, vertical wind velocity data from the Doppler lidar provided information<br />
on the temporal evolution <strong>and</strong> spatial distribution of mixed-layer height over the Gulf of Mexico <strong>and</strong> Galveston Bay.<br />
It was found that near the shore, mixing heights can vary greatly, from ~150 meters in the presence of a nocturnal<br />
low-level jet, to 2 km when offshore flow advects a deep well-mixed boundary layer over the water.<br />
MILESTONE CSD08.5:<br />
Measure the absorption cross sections for formyl (HCO) radicals to high accuracy for use in<br />
future laboratory studies of aldehyde (RCHO) photochemistry.<br />
ACCOMPLISHMENTS FOR CSD08.5:<br />
Absorption cross sections for HCO were determined at 295 K using pulsed laser photolysis combined with cavity<br />
ring-down spectroscopy. Formyl radicals (HCO) were produced from the reaction of atomic chlorine, generated by<br />
photolysis of Cl2 at 335 nm, with formaldehyde. The concentration of HCO was calibrated using two independent<br />
photochemical methods. The peak cross<br />
section of the P(8) line was determined to<br />
be (1.98 ± 0.36) × 10 -18 cm 2 , <strong>and</strong> the<br />
intensity of the entire b<strong>and</strong> was<br />
normalized to this line. The results from<br />
this work will be used in future studies of<br />
the aldehyde UV photolysis.<br />
93<br />
Comparison of reported HCO absorption<br />
cross-section data available in the<br />
literature to that measured in this work.<br />
The solid line is the spectrum of HCO<br />
measured in this work normalized to the<br />
average P(8) cross section of (1.98 ±<br />
0.36) × 10 -18 cm 2 .<br />
MILESTONE CSD08.6:<br />
Measurement of vertical profiles in NO3, N2O5, <strong>and</strong> related compounds within <strong>and</strong> above the<br />
shallow, nocturnal boundary layer.<br />
ACCOMPLISHMENTS FOR CSD08.6:<br />
Vertical profiles of the nocturnal nitrogen oxides, NO3 <strong>and</strong> N2O5, <strong>and</strong> related trace gases, aerosols <strong>and</strong> meteorology,<br />
have been measured within <strong>and</strong> above the shallow nocturnal boundary layer in four recent field campaigns. These<br />
include the 2004 New Engl<strong>and</strong> Air Quality Study (NEAQS 04) <strong>and</strong> the 2006 Texas Air Quality Study (TexAQS<br />
2006), during which these profiles were measured from the NOAA P-3 aircraft, <strong>and</strong> two studies at Erie, CO (30 km<br />
west of Boulder <strong>and</strong> 50 km north of Denver) in 2004 <strong>and</strong> 2007, during which profiles were measured from a<br />
movable carriage on a 300-m tower. There are currently two publications from this work. Results from the Erie 2004
<strong>Scientific</strong> <strong>Theme</strong>: Regional Processes<br />
study appeared in Atmospheric Chemistry <strong>and</strong> Physics in January 2007, <strong>and</strong> results from NEAQS 2004 are currently<br />
in press in the Journal of Geophysical Research. Results from TexAQS 2006 <strong>and</strong> Erie 2007 are anticipated in the<br />
coming year.<br />
The figure below shows an example of a vertical profile from the TexAQS 2006 study. The left graph is NO3 <strong>and</strong><br />
N2O5 along the bottom axis <strong>and</strong> potential temperature along the top axis against altitude on the vertical axis. The<br />
structure in the potential temperature profiles shows the low-level stratification of the nighttime atmosphere, with<br />
distinct regions of stability near 200 <strong>and</strong> 600 m. Associated with each feature is a nitrogen oxide plume. The two<br />
right graphs show the formation rate of NO3, P(NO3), the lifetime of NO3 <strong>and</strong> N2O5, or their concentrations divided<br />
by their formation rate, <strong>and</strong> the partitioning among nitrogen oxides, F(NOx), a measure of the amount of NOx<br />
present as NO3 <strong>and</strong> N2O5. The two<br />
nitrogen oxide plumes are less than<br />
100 m in depth, <strong>and</strong> have distinctly<br />
different chemistry, as measured by<br />
their lifetimes <strong>and</strong> partitioning.<br />
Because this chemistry is an<br />
important factor in determining the<br />
atmospheric residence time of emitted<br />
NOx pollution <strong>and</strong> the nocturnal loss<br />
rates for O3 pollution, <strong>and</strong> because it<br />
varies on small spatial scales at night,<br />
detailed studies of the vertical<br />
distributions of these compounds are<br />
critical to underst<strong>and</strong>ing their role in<br />
chemical transformations of pollutants<br />
<strong>and</strong> regional air quality.<br />
MILESTONE CSD08.7:<br />
Measure the rate coefficient for the reaction of hydroxyl radical with acetaldehyde, CH3C(O)H,<br />
over the range of temperatures common to the troposphere <strong>and</strong> lower stratosphere to better<br />
elucidate the role of oxygenated hydrocarbons in radical (HOx) <strong>and</strong> ozone production.<br />
ACCOMPLISHMENTS FOR CSD08.7:<br />
CIRES researchers measured the rate coefficient for the reaction of hydroxyl radical with acetaldehyde, CH3C(O)H,<br />
over the range of temperatures common to the troposphere <strong>and</strong> lower stratosphere (between 204 <strong>and</strong> 373 K) to better<br />
elucidate the role of oxygenated hydrocarbons in radical (HOx) <strong>and</strong> ozone production. This research provided rate<br />
coefficient data for the accurate determination of the atmospheric loss of acetaldehyde by reaction with the OH<br />
radical. Knowledge of atmospheric lifetimes <strong>and</strong> chemical destruction pathways for acetaldehyde (an oxygenated<br />
hydrocarbon) is important for characterizing climate-chemistry coupling.<br />
The temperature dependence of the rate coefficients for the reaction of OH with CH3CHO was measured using<br />
pulsed laser photolytic production of OH coupled with its detection via laser-induced fluorescence. Acetaldehyde<br />
was purified <strong>and</strong> its concentrations were measured using three methods: FTIR spectroscopy, UV absorption at 184.9<br />
nm <strong>and</strong> gas flow rates. The rate coefficients for the title reaction between 204 <strong>and</strong> 373 K are reported in the<br />
Arrhenius format: (5.32±0.74)×10 -12 exp[(314±37)/T], which gives k1(298 K) = (1.52±0.15)×10 -11 , in units of cm 3<br />
molecule -1 s -1 . The rate coefficients for the reaction of OH(v = 1) with CH3CHO between 204 <strong>and</strong> 296 K were<br />
determined <strong>and</strong> is expressed in the Arrhenius format: (3.5±1.4)×10 -12 exp[(500 ± 90)/T], which gives a value of<br />
(1.9±0.6)×10 -11 cm 3 molecule -1 s -1 at 298 K. The obtained results are compared with previous data. Atmospheric<br />
implications of the data are discussed.<br />
94
k 1(T) (10 -11 cm 3 molecule -1 s -1 )<br />
400 333 286 250 222 200 K<br />
10<br />
7<br />
9<br />
8<br />
7<br />
6<br />
5<br />
4<br />
3<br />
2<br />
1<br />
2.5<br />
3.0<br />
3.5 4.0<br />
1000/T (K -1 )<br />
<strong>Scientific</strong> <strong>Theme</strong>: Regional Processes<br />
4.5<br />
6<br />
5<br />
4<br />
3<br />
2<br />
5.0<br />
Right. Comparison of k1(T) from various previous<br />
studies. The solid line is the unweighted fit of the<br />
data of Sivakumaran <strong>and</strong> Crowley <strong>and</strong> of the<br />
present measurements to an Arrhenius expression.<br />
The dashed lines represent the upper <strong>and</strong> lower<br />
bounds of k1(T) at the 95% confidence level.<br />
GMD06: Baseline Air Quality<br />
1<br />
9<br />
8<br />
7<br />
k 10(T) (10 -11 cm 3 molecule -1 s -1 )<br />
k 1 , 10 -11 cm 3 molecule -1 s -1<br />
Left. Arrhenius plots for k1(T) (circles) <strong>and</strong> k10(T)<br />
(squares) from the present study. The individual k1(T)<br />
<strong>and</strong> k10(T) were obtained from linear least squares<br />
analysis of all <strong>and</strong> D-D0, respectively, vs. [CH3CHO] at<br />
each temperature. Error bars include precision <strong>and</strong><br />
estimated systematic errors at the 95% confidence level.<br />
95<br />
1000 500 400 333 285 250 222 200 K<br />
1<br />
4<br />
3<br />
2<br />
9<br />
8<br />
7<br />
1.0<br />
1.5<br />
This work<br />
Taylor et al. (2006)<br />
Sivakumaran <strong>and</strong> Crowley (2003)<br />
Dobe et al. (1989)<br />
Michael et al. (1985)<br />
Semmes et al. (1985)<br />
Atkinson <strong>and</strong> Pitts (1978)<br />
2.0<br />
2.5 3.0 3.5<br />
1000/T (K -1 )<br />
GOAL:<br />
Study intercontinental transport events to improve our underst<strong>and</strong>ing of their importance in affecting overall air<br />
quality <strong>and</strong> its impacts on public health.<br />
MILESTONE GMD06.1:<br />
Carry out daily ozone profile measurements at Trinidad Head, CA <strong>and</strong> Boulder, CO during the<br />
intensive Measurements of Ozone over North America (MONA) study in August 2006.<br />
ACCOMPLISHMENTS FOR GMD06.1:<br />
During August 2006, near daily ozonesondes were launched from fourteen sites in North America stretching from<br />
Barbados <strong>and</strong> Mexico City in the south to southern Canada in the north <strong>and</strong> from the Pacific to the Atlantic coasts.<br />
The purpose was to determine the role of various sources to the tropospheric ozone budget over North America.<br />
Over 400 ozone <strong>and</strong> meteorological vertical profiles were obtained during the month, including the daily soundings<br />
from Trinidad Head, CA <strong>and</strong> Boulder, CO. A key finding of this intensive campaign was the important contribution<br />
to the upper tropospheric (6-11 km) ozone budget from lightning-produced nitrogen oxides [Cooper et al., 2007].<br />
This enhancement is collocated with the summertime upper tropospheric anticyclone centered over the southeastern<br />
U.S. Convection associated with the North American summer monsoon located at the westernmost edge of the<br />
anticyclone is the primary source of the lightning-produced nitrogen oxides. Ozone in the upper troposphere over the<br />
Southeast U.S. was nearly twice the amount seen in air entering the west coast of the U.S.<br />
4.0<br />
4.5<br />
5.0
<strong>Scientific</strong> <strong>Theme</strong>: Regional Processes<br />
MILESTONE GMD06.2:<br />
As part of the Department of Energy Atmospheric Radiation Measurement Program, deploy a<br />
mobile measurement facility to the Murg Valley in Heselbach, Germany. The instrument package<br />
measures aerosol radiative, hygroscopic <strong>and</strong> cloud-forming properties.<br />
ACCOMPLISHMENTS FOR GMD06.2:<br />
The Aerosol <strong>Observing</strong> System was deployed to the Murg Valley in Germany in March of 2007. All instruments<br />
have operated well, <strong>and</strong> data have been archived in both the NOAA ESRL archive <strong>and</strong> the Department of Energy<br />
Atmospheric Radiation Program archive (http://www.arm.gov). Despite being a rural region, the aerosol of the Black<br />
Forest region in Germany is relatively polluted with a high concentration of absorbing aerosol. In August 2007, a<br />
comparison of the NOAA aerosol scattering coefficient as a function of relative humidity will take place with the<br />
instruments from the Paul Scherrer Institute of Switzerl<strong>and</strong>. The next deployment of this system will be to the Tai<br />
Lake Region south of Shanghai, China.<br />
GSD02: Regional Air Quality Prediction<br />
GOAL:<br />
Design <strong>and</strong> evaluate new approaches for improving air-quality prediction.<br />
MILESTONE GSD02.1:<br />
In collaboration with national <strong>and</strong> international scientists, implement generalized tools such as the<br />
Kinetic PreProcessor (KPP) into the next version of the fully coupled Weather Research <strong>and</strong><br />
Forecasting Chemistry (WRF/Chem) model.<br />
ACCOMPLISHMENTS FOR GSD02.1:<br />
In collaboration with the Max Planck Institute in Mainz, Germany, KPP was included in WRF/Chem in July 2006. It<br />
was improved further in May <strong>and</strong> June of 2007. KPP is now a part of WRFV2.2/Chem, which was officially<br />
released in March of 2007. Tutorial notes where prepared for WRF/Chem. These can be found on the web at<br />
http://ruc.fsl.noaa.gov/wrf/WG11/2007_wrf_wksp.htm.<br />
MILESTONE GSD02.2:<br />
Perform real-time weather/air-quality forecasts with WRF/Chem during the Houston 2006 field<br />
experiment.<br />
ACCOMPLISHMENTS FOR GSD02.2:<br />
WRF/Chem was run in real-time to support the Texas 2006 Air Quality Field experiment. Results were presented in<br />
real-time at the Houston field operations center during August <strong>and</strong> September. Model results will be used to prepare<br />
publications <strong>and</strong> evaluate the model in comparison to other models as well as observations.<br />
PSD13: Air Quality<br />
GOAL:<br />
Gather <strong>and</strong> analyze atmospheric observations to characterize meteorological processes that contribute to highpollution<br />
episodes. Compare these measurements with air-quality forecasting model predictions to assess <strong>and</strong><br />
improve research model performance.<br />
MILESTONE PSD13.1:<br />
CIRES investigators will participate in the second Texas Air Quality Experiment (TexAQS-II) by<br />
leading the deployment of six integrated wind profiling observing systems <strong>and</strong> two flux towers.<br />
The field study will occur in Aug <strong>and</strong> Sep of 2006.<br />
96
<strong>Scientific</strong> <strong>Theme</strong>: Regional Processes<br />
ACCOMPLISHMENTS FOR PSD13.1:<br />
CIRES investigator Allen White led the<br />
design of the enhanced wind profiler<br />
network for the 2006 Texas Air Quality<br />
Study (TexAQS-II). NOAA contributed<br />
eight wind profilers <strong>and</strong> Sonoma<br />
Technology contributed two. The<br />
network was designed specifically to<br />
address air pollution transport in East<br />
Texas as well as interstate pollution<br />
transport. The data from the wind<br />
profilers were incorporated into the<br />
NOAA wind profiler trajectory tool,<br />
which was available in near-real time<br />
for the Texas Air Quality Study<br />
(collaboration with CIRES investigators<br />
Christoph Senff, Irina Djalalova, <strong>and</strong><br />
Dave White). The trajectory tool was<br />
used in mission planning of the various<br />
aircraft during the study. In postexperiment<br />
analysis, the tool will be<br />
used to better underst<strong>and</strong> transport pathways during high pollution episodes. Products include TexAQS-II wind<br />
profiler data archive web browser at http://www.etl.noaa.gov/et7/data/archive/UneditedNonActive/ <strong>and</strong> TexAQS-II<br />
interactive wind profiler trajectory tool at http://www.etl.noaa.gov/programs/2006/texaqs/traj/<br />
MILESTONE PSD13.2:<br />
CIRES investigators will help collect wind profiler, air/sea fluxes, ozone fluxes, <strong>and</strong> rawinsonde<br />
data onboard the NOAA R/V Ronald H. Brown during the TexAQS-II field study.<br />
ACCOMPLISHMENTS FOR PSD13.2:<br />
The systems were deployed on the NOAA R/V Ronald H. Brown for five weeks in July <strong>and</strong> August 2006 as part of<br />
the TexAQS project. All systems obtained data on the cruise. Data products are available at the PSD ftp site for this<br />
project ftp://ftp.etl.noaa.gov/et6/archive/TexAQS_2006/RHB.<br />
MILESTONE PSD13.3:<br />
Use data sets collected during TexAQS-II to develop specific results for the Rapid Science<br />
Synthesis Team. These findings will assist the state of Texas in development of their state<br />
implementation plans.<br />
ACCOMPLISHMENTS FOR PSD13.3:<br />
Several CIRES scientists in PSD <strong>and</strong> CSD contributed to the Rapid Science Synthesis Team Report, which was<br />
delivered to the Texas Commission on Environmental Quality soon after the 2006 Texas Air Quality Study field<br />
campaign ended. The preliminary report is available at http://www.tceq.state.tx.us/assets/public/implementation<br />
/air/am/workshop/2006101213/RSST_Preliminary_Findings_Report_20061031.pdf.<br />
MILESTONE PSD13.4:<br />
Publish analysis of measurements of air-sea fluxes <strong>and</strong> gas transfer in the New Engl<strong>and</strong><br />
experiment on the R/V Ronald H. Brown in August 2004.<br />
ACCOMPLISHMENTS FOR PSD13.4:<br />
Research conducted by CIRES staff on data sets collected onboard the NOAA R/V Ronald H. Brown during the<br />
2004 New Engl<strong>and</strong> Air Quality Study has culminated in several successful research publications in peer-reviewed<br />
journals.<br />
97
<strong>Scientific</strong> <strong>Theme</strong>: Regional Processes<br />
RP-04: Intercontinental Transport <strong>and</strong> Chemical Transformation<br />
CSD05: Tropospheric <strong>and</strong> Stratospheric Transport <strong>and</strong> Chemical Transformation<br />
GOAL:<br />
Carry out modeling studies <strong>and</strong> airborne <strong>and</strong> surface measurements of chemical species in order to elucidate the<br />
processes involved in the intercontinental transport of photochemical pollution.<br />
MILESTONE CSD05.1:<br />
Use measurements from a fully instrumented NOAA P-3 aircraft to accurately <strong>and</strong> precisely<br />
characterize the chemistry of plumes of pollutants from urban areas as they are transported over<br />
the North Atlantic Ocean. Use recently developed fast-response instruments that measure both<br />
emitted trace gases (NO, CO, <strong>and</strong> others) <strong>and</strong> secondary products (HNO3, O3, <strong>and</strong> others)<br />
formed from chemical reactions that occurred in that atmosphere.<br />
ACCOMPLISHMENTS FOR CSD05.1:<br />
Measurements obtained from the NOAA P-3 aircraft in the summer of 2004 during the International Consortium for<br />
Atmospheric Research on Transport <strong>and</strong> Transformation (ICARTT) study have been used to examine the transport<br />
of pollutants from the United States over the Atlantic Ocean. A large number of studies have been performed,<br />
examples are highlighted below. The measurements have been used to test the ability of global chemical transport<br />
models to represent the sources, chemistry, <strong>and</strong> export of pollutants from North America to the free troposphere.<br />
The research shows a large U.S. anthropogenic contribution to global tropospheric ozone, which is an important<br />
greenhouse gas. The measurements have also been compared with those obtained by international collaborators<br />
across the Atlantic Ocean with the goal of improving the underst<strong>and</strong>ing of the mechanisms of pollutant transport<br />
from North America to Europe. Transport of air masses below 3-km altitude in the lower free troposphere was found<br />
to enhance ozone <strong>and</strong> is responsible for most pollution events observed at a remote site located in the Azores.<br />
Additionally, aircraft measurements obtained from Europe have been compared with those obtained from the P-3 to<br />
demonstrate a successful Lagrangian experiment by sampling air masses multiple times during transit across the<br />
North Atlantic Ocean. Lastly, the chemistry <strong>and</strong> transport of pollution plumes that occur during the first couple of<br />
days of transport were studied extensively by sampling plumes multiple times up to 1000 km downwind from east<br />
coast urban areas. These studies showed that stable stratification over the ocean often confines pollution to layers<br />
between 160 m <strong>and</strong> 1.5 km altitude, where the air did not interact with the surface. Consequently, the nitric acid<br />
abundance was considerably higher than previously observed over the continent, since the plumes were decoupled<br />
from the surface where nitric acid is rapidly removed. This is important because high levels of nitric acid that<br />
survive in the atmosphere for days will slowly photolyze to produce NOx, which allows for continuing ozone<br />
production.<br />
RP-05: Aerosol Chemistry <strong>and</strong> Climate Implications<br />
CSD09: Aerosol Formation, Chemical Composition, <strong>and</strong> Radiative Properties<br />
GOAL:<br />
Carry out airborne <strong>and</strong> ground-based experiments that characterize the chemical composition of radiatively<br />
important aerosols in the upper troposphere <strong>and</strong> at the Earth's surface.<br />
MILESTONE CSD09.1:<br />
Use field data from the NOAA R/V Ronald H. Brown in combination with laboratory experiments<br />
to assess the effect of the molecular speciation of organic aerosols in their effectiveness as cloud<br />
condensation nuclei.<br />
ACCOMPLISHMENTS FOR CSD09.1:<br />
Data on the composition of the organic fraction of atmospheric aerosol were acquired aboard NOAA R/V Ronald H.<br />
Brown during the TexAQS/GoMACCS field campaign in August <strong>and</strong> September 2006. The mass spectra showed<br />
significant variations in the composition of the organic fraction of atmospheric aerosol on hourly to daily timescales.<br />
Data reduction was performed during fall 2006 to winter 2007, <strong>and</strong> instrument characterization experiments are<br />
98
<strong>Scientific</strong> <strong>Theme</strong>: Regional Processes<br />
ongoing. Laboratory experiments are planned to examine the composition of secondary organic aerosol <strong>and</strong> its<br />
relation to aerosol hygroscopicity.<br />
MILESTONE CSD09.2:<br />
Plan for <strong>and</strong> participate in the Gulf of Mexico Atmospheric Composition <strong>and</strong> Climate Study in<br />
August/September 2006, specifically investigating the role of urban aerosol in cloud microphysics<br />
<strong>and</strong> cloud evolution in Houston.<br />
ACCOMPLISHMENTS FOR CSD09.2:<br />
During the summer of 2006, an airborne study of aerosol-cloud interactions was undertaken through a partnership<br />
between NOAA, the California Institute of Technology, the Center for Interdisciplinary Remotely-Piloted Aircraft<br />
Studies (CIRPAS), <strong>and</strong> various university collaborators. The primary objectives of this study were to:<br />
1. Study the regional-scale aerosol chemical, optical, <strong>and</strong> radiative properties in Texas/Gulf of Mexico;<br />
2. Acquire an extensive data set on aerosol, cloud <strong>and</strong> radiation interactions to evaluate models that predict<br />
cloud drop number concentration, cloud evolution, <strong>and</strong> cloud radiative properties;<br />
3. Provide sub-orbital support <strong>and</strong> validation for satellite remote sensing of aerosol <strong>and</strong> aerosol-cloud<br />
interactions.<br />
The CIRPAS Twin Otter, the primary platform for this study, was instrumented with a suite of aerosol samplers,<br />
cloud probes, <strong>and</strong> radiation measurements. It performed 22 flights between August 21 <strong>and</strong> September 15. Fourteen<br />
of these focused on aerosol-cloud-radiation interactions. All 22 flights yielded valuable measurements of aerosol<br />
composition <strong>and</strong> optical properties from a range of Houston-area sources (urban aerosol, petrochemical plants,<br />
power plants, etc.) as well as aerosol transported to the region (Saharan dust <strong>and</strong> forest fires).<br />
To date (with much of the analysis still in progress) a number of interesting results are emerging:<br />
1. CIRES/CSD boundary layer model appears to capture successfully the main statistical properties of the<br />
cloud macroscale (cloud fraction <strong>and</strong> cloud size) <strong>and</strong> microphysical fields (liquid water <strong>and</strong> drop<br />
concentration).<br />
2. Observed aerosol effects on cloud microphysics show that in the polluted air in Houston, a relatively small<br />
fraction of the aerosol accumulation mode is activated. This is in contrast to cleaner air where activated<br />
fractions are higher. The model simulations capture this low activated fraction reasonably well.<br />
3. Clouds are significant sources of organic aerosol (oxalate).<br />
MILESTONE CSD09.3:<br />
Study the relative humidity dependence of aerosol light extinction for surrogate atmospheric<br />
aerosol using cavity ring-down aerosol extinction spectroscopy.<br />
ACCOMPLISHMENTS FOR CSD09.3:<br />
This laboratory research helps determine improved parameterization for the relative humidity dependence of aerosol<br />
light extinction for atmospheric aerosol <strong>and</strong> accuracy of radiative forcing calculations. The relative humidity<br />
dependence of aerosol light extinction (fσ(ep)(80%RH, Dry)) at 532 nm for non-absorbing surrogate atmospheric<br />
aerosols was measured to determine the influence of particle size, composition (inorganic vs. organic), <strong>and</strong> mixing<br />
state (internal vs. external) on aerosol light scattering. Results for mixtures of NaCl <strong>and</strong> (NH4)2SO4 with a few<br />
dicarboxylic acids are included. For atmospheric conditions, the variability in the RH dependence of aerosol light<br />
scattering (fσ(sp)(RH, Dry)) is most sensitive to aerosol composition <strong>and</strong> size. The influence of the mixing state on<br />
fσ(sp)(RH, Dry) is small. These laboratory results imply that fσ(sp)(RH, Dry) can be reasonably estimated from the<br />
aerosol size distribution <strong>and</strong> composition (inorganic/organic) using the mass-weighted average of fσ(sp)(RH, Dry) for<br />
the individual components.<br />
This study also used laboratory-generated particles to examine the connection between aerosol light extinction,<br />
chemical composition, <strong>and</strong> hygroscopicity for particles composed of internal mixtures of ammonium sulfate <strong>and</strong><br />
water-soluble organic compounds. The extinction coefficient (σep) at 532 nm was measured for size-selected<br />
particles at
<strong>Scientific</strong> <strong>Theme</strong>: Regional Processes<br />
sugars, dicarboxylic acids <strong>and</strong> complex mixtures of water-soluble organic compounds. Finally, fRHext(80% RH,<br />
dry) was found to vary linearly with the organic/inorganic content, allowing for simple incorporation of organic<br />
properties into atmospheric models. Investigators derived a generalization of fRHext(80% RH, dry) = 2.90 –<br />
0.015(wt% organic species) for a particle size distribution with a dry mean optical diameter of 0.35 μm. This<br />
parameterization for ammonium sulfate/water-soluble organic aerosol is applicable to the fine particle mode fraction<br />
of atmospheric aerosol. Information necessary to incorporate the variation in the size distribution is also included.<br />
This suggests that neglecting the water uptake by the organic fraction of atmospheric particles could lead to<br />
significant underestimation of the cooling at the Earth‘s surface due to light scattering by aerosol.<br />
Right. Measured fRHext(80% RH, dry) for<br />
ammonium sulfate mixed with adipic acid<br />
(solid squares), DL-malic acid (crosses),<br />
glucose (open triangles), levoglucosan (open<br />
circles) <strong>and</strong> mannitol (open square). The top<br />
dashed line is the best fit to the sugar data (all<br />
open symbols) <strong>and</strong> the middle dashed line is<br />
the best fit to the dicarboxylic acid data. The<br />
solid black line models the case where water<br />
uptake is dictated only by ammonium sulfate<br />
(labeled ―Linear Fit w/ fRH(org) = 1‖).<br />
100<br />
Left. Variation of fσ(ep)(80% RH, Dry) with dry<br />
effective optical diameter for λ = 532 nm.<br />
Shown are 100% NaCl (solid circle), 50 wt%<br />
NaCl <strong>and</strong> 50 wt% organic mixture A (open<br />
circle), 100% (NH4)2SO4 (solid square), 50<br />
wt% (NH4)2SO4 <strong>and</strong> 50 wt% organic mixture B<br />
(open square), 100% organic mixture A (+),<br />
<strong>and</strong> 100% organic mixture B (×).<br />
MILESTONE CSD09.4:<br />
Measure particle nucleation <strong>and</strong> particle growth rates in laboratory experiments following the gasphase<br />
oxidation of biogenic monoterpene compounds by O3 <strong>and</strong> the OH radical.<br />
ACCOMPLISHMENTS FOR CSD09.4:<br />
Measurements of particle nucleation following the gas-phase oxidation of α pinene <strong>and</strong> β pinene were measured.<br />
Particle nucleation following the ozonolysis <strong>and</strong> O3 plus OH initiated monoterpene oxidation was measured in a 70<br />
L Teflon bag reactor over the temperature range 278 K to 320 K. Particle concentration temporal profiles were<br />
measured for a range of initial monoterpene <strong>and</strong> ozone concentrations using ultra-fine condensation particle
<strong>Scientific</strong> <strong>Theme</strong>: Regional Processes<br />
counters. Profiles were interpreted using a coupled gas-phase chemistry <strong>and</strong> kinetic multi-component nucleation<br />
model to determine the molar yield of the nucleating species in the ozonolysis experiments to be 1×10 -5 <strong>and</strong> 0.009,<br />
for α pinene <strong>and</strong> β pinene, respectively. OH initiated oxidation was found to increase the nucleator yield for α<br />
pinene, by approximately a factor of three, but not for β pinene. The molar yield of condensable reaction products<br />
(vapor pressure < 20 ppt at 296 K) was determined to be 0.06 for both α pinene <strong>and</strong> β pinene <strong>and</strong> was independent<br />
of the oxidation source. Particle growth, which is determined by the condensable reaction products, was nearly<br />
temperature independent. Atmospheric box model calculations of nucleation <strong>and</strong> particle growth for α <strong>and</strong> β pinene<br />
oxidation under typical tropospheric conditions are presented <strong>and</strong> show (1) nucleation can be significant under<br />
favorable conditions, (2) nucleation is dominated by OH-initiated oxidation, <strong>and</strong> (3) the partitioning of the<br />
condensable monoterpene oxidation products makes a significant contribution to the growth of atmospheric aerosol<br />
<strong>and</strong> is capable of explaining the observed particle growth rates commonly observed in remote forests.<br />
101
<strong>Scientific</strong> <strong>Theme</strong>: Regional Processes<br />
102
Global Snow Cover Mapping<br />
Richard Armstrong<br />
Funding: NASA Earth Science<br />
Complementary Research: Faculty Fellows Research<br />
Complementary Research<br />
Faculty Fellows Research<br />
Objective <strong>and</strong> Background<br />
Generate a climate data record for Northern Hemisphere snow cover <strong>and</strong> analyze statistical<br />
significance of long-term trends. Optimize the combination of passive microwave <strong>and</strong><br />
visible satellite remote sensing data.<br />
The extent <strong>and</strong> variability of seasonal snow cover are important parameters in climate <strong>and</strong><br />
hydrologic systems due to effects on energy <strong>and</strong> moisture budgets. Northern Hemisphere snow cover extent,<br />
comprising about 98% of global seasonal snow cover, is the largest single spatial component of the cryosphere, with<br />
a mean maximum extent of 47 million square kilometers (nearly 50% of the l<strong>and</strong> surface area). Since 1966, much<br />
important information on Northern Hemisphere snow extent has been provided by the NOAA weekly snow charts,<br />
derived from visible-b<strong>and</strong> polar orbiting <strong>and</strong> geo-stationary satellite imagery. Since 1978, satellite passive<br />
microwave sensors (SMMR <strong>and</strong> SSM/I) have provided an independent source for snow monitoring. Trend analysis<br />
on the passive microwave record is complicated by the change in sensors from SMMR to the SSM/I in 1987 <strong>and</strong> by<br />
the short overlap period.<br />
Northern Hemisphere<br />
snow-covered area departures<br />
from monthly means<br />
derived from visible <strong>and</strong><br />
passive microwave satellite<br />
data for the period<br />
1966-2006. The visible<br />
data show a statistically<br />
significant decrease in<br />
snow cover of -1.3% per<br />
decade while the microwave<br />
indicate a decrease<br />
of -0.7% per decade<br />
although not significant at<br />
the 90% level.<br />
Accomplishment<br />
To derive a temporally consistent map of snow cover from the two microwave sensors, we evaluate brightness<br />
temperatures at fixed Earth targets with a range of physical characteristics. Individual targets were chosen for<br />
temporal <strong>and</strong> spatial stability <strong>and</strong> together include a range of brightness temperatures representing the cold through<br />
warm end of the emission range. Cold targets include oceans <strong>and</strong> ice sheets, while warm targets include tropical<br />
forests <strong>and</strong> mid-latitude deserts. The SMMR <strong>and</strong> SSM/I brightness temperatures are adjusted using the regression<br />
coefficients derived from the comparison of the two data sets. The adjusted data are then applied to the microwave<br />
snow retrieval algorithms, <strong>and</strong> a time series of monthly st<strong>and</strong>ardized anomalies for the Northern Hemisphere for the<br />
period 1978 to 2006 is generated. Respective trend lines are calculated along with autocorrelation, trend estimates<br />
<strong>and</strong> the number of years of data required to detect a real trend of a calculated magnitude. Both positive <strong>and</strong> negative<br />
statistically significant trends are detected, depending on region <strong>and</strong> time of year. Regional trend analysis of both<br />
visible <strong>and</strong> microwave snow cover data have been compared with gridded temperature anomalies from the NASA<br />
GISS Surface Temperature Analysis data. The western United States is one of the largest regions of the Northern<br />
Hemisphere showing a statistically significant decrease in snow cover during the past three decades. In addition, we<br />
have developed an optimal approach to snow cover mapping, which involves the synergy of both microwave <strong>and</strong><br />
visible sensor data. CIRES collaborators on this project include Mary Jo Brodzik, Matthew Savoie <strong>and</strong> Betsy<br />
Weatherhead.<br />
103
Complementary Research: Faculty Fellows Research<br />
The Dynamics of the Residual Layer Determined from High-Resolution<br />
In Situ Observations during CASES-99<br />
Ben Balsley<br />
We are currently examining a number of new results derived from high-resolution in situ<br />
studies of the residual layer (RL) obtained during the CASES lower atmospheric campaign<br />
in eastern Kansas in October, 1999. These studies typically used data gathered by the<br />
CIRES-developed Tethered Lifting System, which consists of a state-of-the-art kite or an<br />
aerodynamic balloon that has high-resolution instruments suspended well below from the<br />
tether.<br />
The RL lies between the stable boundary layer (the lowest region of the nighttime atmosphere that is tightly coupled<br />
to the Earth‘s surface) <strong>and</strong> the steep temperature gradient that defines the bottom of the free atmosphere. Although<br />
the RL is a poorly studied region owing to its inaccessibility, it is important for studying the turbulent transport into<br />
the free atmosphere of pollutants generated at ground levels.<br />
Our results show that the RL is not—as has been generally portrayed in the literature—a passive, quiescent remnant<br />
of the previous afternoon‘s convective boundary layer. Rather it is a complex, rapidly changing, <strong>and</strong> dynamic arena<br />
harboring regions of intense turbulent variations with extremely sharp gradients. Our current studies show that RL<br />
turbulence: (1) is always present, (2) can exceed stable boundary turbulence levels by an order of magnitude, (3) can<br />
range in intensity over more than three orders of magnitude, (4) is generated locally on scales of a few tens of meters<br />
or less by velocity shears, <strong>and</strong> (5) can be entrained into the underlying stable boundary layer, particularly when the<br />
RL turbulence is intense <strong>and</strong> the stratification between the RL <strong>and</strong> stable boundary layer is relatively weak.<br />
The figure at right shows a set of eight ascents<br />
<strong>and</strong> descents, plus a curve of the median value<br />
of all eight flights, which portrays the<br />
percentage of RL heights having critical<br />
Richardson number values (Ri ≤ 0.25) as a<br />
function of the analyzed vertical-scale size.<br />
Both axes are plotted using logarithmic scales<br />
in order to show details over a wide range of<br />
scale sizes <strong>and</strong> percentages. The fundamental<br />
conclusion that can be drawn from this result<br />
is that, while there are reasonable variations in<br />
the flight-to-flight results as shown by the<br />
various curves, the RL is clearly dynamically<br />
unstable only on scales smaller than a few tens<br />
of meters. The significance of this result is that<br />
the current computer models employed to<br />
examine turbulence generation <strong>and</strong> the<br />
concomitant dynamics in the stable boundary<br />
layer do not have sufficient resolution to<br />
examine such small-scale instabilities.<br />
The causal mechanisms for the generation of these small-scale instabilities is currently under study. A list of likely<br />
mechanisms could reasonably include turbulence generation by atmospheric gravity waves, frontal passages, <strong>and</strong> a<br />
variety of local orographic features.<br />
104
Complementary Research: Faculty Fellows Research<br />
Twentieth Century Sea Ice in the Eurasian Arctic from Russian Data Sources<br />
Roger G. Barry<br />
Funding: NASA: Cryospheric Sciences<br />
The primary objective of this work is to fill gaps in the Arctic sea ice data record by<br />
extending the record back <strong>and</strong> forward in time. A secondary objective is to provide summary<br />
statistics, <strong>and</strong> to assess the evidence for climate change in the Russian Arctic over the period<br />
1930s-2005. The 1930-40s saw significant high latitude warming <strong>and</strong> therefore it is<br />
important to document accompanying changes in ice conditions for comparison with those<br />
of summers since 1990.<br />
Two significant sources of historical sea ice charting data in digital form are the WMO Global Digital Sea Ice Data<br />
Bank <strong>and</strong> the Environmental Working Group Sea Ice Atlas. The sea ice atlas includes Arctic-wide U.S. National Ice<br />
Center seven-day sea ice charts, 1972-1994, <strong>and</strong> Russian Arctic ten-day sea ice charts, 1950-1992.<br />
Sea ice charts for 1933–49 based on aerial reconnaissance, <strong>and</strong> recent data for 1993-2005, have been digitized at the<br />
Arctic <strong>and</strong> Antarctic Research Institute (AARI), St. Petersburg, Russia, <strong>and</strong> can be viewed using an interactive<br />
browser at http://www.aari.nw.ru/gdsidb/sea_ice/real_sigrid/view.html<br />
We have acquired digitized historical ice charts of the Eurasian Arctic from the AARI for the periods 1933-1992 <strong>and</strong><br />
1997-2006. We also have ice index data for the periods 1924-1933 <strong>and</strong> 1993-1996, creating an observational ice<br />
record that spans over 80 years. From ice chart data, we have located the ice edge where possible in every chart <strong>and</strong><br />
calculated seasonal ice<br />
extent anomalies for the<br />
marginal seas of the eastern<br />
Arctic. These results (Figure,<br />
left) indicate that although<br />
there was also a retreat in<br />
autumn (annual minimum)<br />
sea ice extent in the early<br />
part of the 20 th century, there<br />
was no apparent retreat in<br />
springtime (annual maximum).<br />
In recent years<br />
however, there has been a<br />
year-round retreat of eastern<br />
Arctic sea ice extent.<br />
105<br />
We are currently examining<br />
historical meteorological<br />
station data <strong>and</strong> atmospheric<br />
indices (such as the AO) to<br />
seek correlations between<br />
Arctic climate <strong>and</strong> the<br />
observed variability in sea<br />
ice. We are also comparing<br />
the AARI ice chart dataset<br />
with other digital sea ice<br />
data with the aim of<br />
producing an optimized<br />
dataset of Arctic sea ice.
Complementary Research: Faculty Fellows Research<br />
Predicted Changes in Forcing of Net Precipitation in the Polar Regions<br />
during the 21st Century<br />
John Cassano<br />
Funding: National Science Foundation Office of Polar Programs<br />
One avenue of current research in the Cassano Polar Climate <strong>and</strong> Meteorology group at the<br />
University of Colorado is the attribution of the forcing for projected changes in polar net<br />
precipitation over the next century. Net precipitation is a key climate parameter as it<br />
determines atmospheric mass input to ice sheets <strong>and</strong> glaciers, which then affects global sea<br />
level. In the Arctic, net precipitation over the large Arctic watersheds alters the input of<br />
freshwater to the Arctic Ocean via discharge from these rivers. Changes in freshwater input<br />
to the Arctic Ocean can then change sea ice processes <strong>and</strong> alter regional to global oceanic circulations.<br />
This research has utilized output from 15 global climate system models (GCSMs) that were run in support of the<br />
Intergovernmental Panel on Climate Change Fourth Assessment Report. The ability of each model to accurately<br />
simulate the synoptic climatology of the Arctic <strong>and</strong> Antarctic was evaluated using a method based on selforganizing<br />
maps. Based on this analysis we found that only four (Arctic) or five (Antarctic) of the 15 GCSMs were<br />
able to accurately simulate the synoptic climatology of the polar regions at the end of the 20 th century.<br />
Arctic annual net precipitation change components [total<br />
change (net), thermodynamic change (thermodyn), dynamic<br />
change (dyn), <strong>and</strong> dynamic change acting on thermodynamic<br />
change (both)] (mm/yr) from the 4-model ensemble for 2046-<br />
2055 vs 1991-2000. Note that the color scale differs in each<br />
panel.<br />
106<br />
This reduced set of GCSMs was further<br />
analyzed to evaluate changes in net<br />
precipitation from the end of the 20 th century<br />
to the end of the 21 st century. In both polar<br />
regions, the subset of GCSMs indicates an<br />
increase of approximately 20% in net<br />
precipitation over the next century. The<br />
largest rate of change of net precipitation is<br />
predicted to occur during the first half of the<br />
21 st century, with smaller increases occurring<br />
during the second half of the century. The<br />
changes in net precipitation are not uniform<br />
across the polar regions, <strong>and</strong> show significant<br />
spatial variability (see figure, left).<br />
The final portion of this project estimated the<br />
relative contribution of changes in circulation<br />
(via changes in the synoptic climatology) <strong>and</strong><br />
thermodynamics to the projected changes in<br />
net precipitation. While the synoptic<br />
climatology of both regions is projected to<br />
become increasingly dominated by cyclonic<br />
weather patterns, the largest contribution to<br />
the projected changes in net precipitation was<br />
through thermodynamic processes. Over the<br />
Antarctic ice sheet over 90% of the projected<br />
change in net precipitation during the 21 st<br />
century was found to be due to thermodynamic<br />
processes, while in the Arctic nearly<br />
80% of the change in net precipitation was<br />
associated with changes in thermodynamics<br />
(Figure, left).
L<strong>and</strong> Surface Hydrology <strong>and</strong> Global Climate<br />
Tom Chase<br />
Complementary Research: Faculty Fellows Research<br />
In recent climate sensitivity experiments with the Community Climate System Model<br />
(CCSM 3.0) we found that the Community L<strong>and</strong> Model (CLM 3.0) simulates mean global<br />
evapo-transpiration with low contributions from transpiration (15%), <strong>and</strong> high<br />
contributions from soil <strong>and</strong> canopy evaporation (47% <strong>and</strong> 38%). This evapo-transpiration<br />
partitioning is inconsistent with the average of other l<strong>and</strong>-surface models used in GCMs.<br />
To underst<strong>and</strong> the high soil <strong>and</strong> canopy evaporation, <strong>and</strong> the low transpiration observed in<br />
the CLM 3.0, we compared select individual components of the l<strong>and</strong>-surface<br />
parameterizations of the Simple Biosphere Model (SiB 2.0) against the equivalent<br />
parameterizations used in CLM 3.0. We also compared alternative parameterizations from literature that simulated<br />
the same processes that control transpiration, canopy <strong>and</strong> soil evaporation, <strong>and</strong> soil hydrology in both models. The<br />
behavior of the CLM 3.0, SiB 2.0 <strong>and</strong> alternative parameterizations were assessed with each other through idealized<br />
off-line simulations performed over a range of soil moisture, radiation <strong>and</strong> atmospheric conditions. We used the<br />
findings of these investigations to develop new parameterizations for CLM 3.0 that would reproduce the functional<br />
dynamics of l<strong>and</strong>-surface processes found in SiB 2.0 <strong>and</strong> other alternative l<strong>and</strong> surface parameterizations. We<br />
performed global climate sensitivity experiments with the new l<strong>and</strong>-surface parameterizations to assess how the new<br />
SiB 2.0-consistent CLM l<strong>and</strong> surface parameterizations impact the surface energy balance, hydrology <strong>and</strong><br />
atmospheric fluxes in CLM 3.0, <strong>and</strong> the larger scale climate modeled in CCSM 3.0. The new parameterizations<br />
enable CLM to simulate evapo-transpiration partitioning consistently with the multi-model average of other l<strong>and</strong><br />
surface models used in GCMs as evaluated by Dirmeyer et al. [2005]. The changes in surface fluxes also resulted in<br />
a number of improvements in the simulation of precipitation <strong>and</strong> near surface air temperature in CCSM 3.0,<br />
although substantial biases remain. The improvements in evapo-transpiration partition however, do provide a<br />
substantially more robust framework for performing l<strong>and</strong> cover change experiments in CLM <strong>and</strong> CCSM than the<br />
existing CLM 3.0 parameterizations. Temperature maps of climate anomalies associated with the changed l<strong>and</strong><br />
surface hydrology are shown below. A major result is that correcting the l<strong>and</strong> surface hydrology resulted in an<br />
annually, globally averaged change in near-surface temperature of 0.55 degrees, or approximately the observed<br />
change in surface temperature over the last century. This is an indication that climate change cannot be adequately<br />
simulated without a reasonable hydrologic cycle ― something which remains elusive.<br />
Changes in near surface temperature due to changes in l<strong>and</strong>-surface hydrology.<br />
Left panel: Dec., Jan., Feb. average. Right panel: Jun., Jul., Aug. average.<br />
Note that errors in l<strong>and</strong> surface hydrology were responsible for<br />
larger climate changes than observed in recent years.<br />
107
Complementary Research: Faculty Fellows Research<br />
Lidar Remote Sensing <strong>and</strong> Laser Spectroscopy for Atmospheric Sciences<br />
Xinzhao Chu<br />
Funding: NSF Aeronomy, MRI, <strong>and</strong> CEDAR Programs<br />
To advance our underst<strong>and</strong>ing <strong>and</strong> knowledge of global atmosphere composition,<br />
temperature, <strong>and</strong> dynamics, as well as climate change issues, it is essential to develop new<br />
generation lidar remote sensing instruments so that we can acquire crucial atmosphere data<br />
globally to improve atmospheric models <strong>and</strong> theories. The major efforts of the Chu Research<br />
Group in the last 12 months were spent on the revolution of lidar technology, <strong>and</strong> two<br />
milestones were reached.<br />
First, a Major Research Instrumentation (MRI) proposal led by Dr. Xinzhao Chu for developing a mobile Feresonance/Rayleigh/Mie<br />
Doppler lidar received all excellent reviews <strong>and</strong> was funded by the National Science<br />
Foundation MRI program in August 2007. This MRI lidar integrates the state-of-the-art technologies of lasers, novel<br />
laser spectroscopy, advanced electro-optics, <strong>and</strong> sensors into a single system to produce a powerful <strong>and</strong> robust tool<br />
with unmatched measurement capability throughout the middle <strong>and</strong> upper atmosphere. The chirp-free <strong>and</strong> ditherfree<br />
frequency locking <strong>and</strong> saturation-free Fe layer resonance result in a bias-free estimate of winds <strong>and</strong><br />
temperatures, which is revolutionary for resonance Doppler lidar.<br />
Second, a Consortium of Resonance <strong>and</strong> Rayleigh Lidars (CRRL) was funded by the National Science Foundation<br />
in August 2006, <strong>and</strong> Dr. Xinzhao Chu began to establish a national lidar Consortium Technology Center at CIRES,<br />
aiming to consolidate lidar expertise <strong>and</strong> advance the middle- <strong>and</strong> upper-atmosphere lidar technology to meet new<br />
science challenges. During the 2006-2007 winter break, Dr. Chu <strong>and</strong> her team conducted research on novel Dopplerfree<br />
spectroscopy <strong>and</strong> created new ideas of achieving accurate pulsed-laser frequency calibration for lidar, which<br />
significantly contributed to the MRI proposal. The MRI lidar will be developed for the science community <strong>and</strong><br />
become part of the CRRL.<br />
In addition, Dr. Xinzhao Chu received the Faculty Early Career Development (CAREER) award from the National<br />
Science Foundation in April 2007 <strong>and</strong> is leading her team to study global middle-atmosphere thermal <strong>and</strong> dynamic<br />
structures using lidar, satellite data, <strong>and</strong> atmospheric models.<br />
The Chu Research Group recruited one research scientist (Dr. Wentao Huang), three Ph.D. students, one master‘s<br />
student, <strong>and</strong> one undergraduate student in the last 16 months. Though the team is still very young, they continue to<br />
make good progress. They established a lidar <strong>and</strong> laser laboratory at CIRES, <strong>and</strong> established a lidar observatory (T-<br />
2) at NOAA‘s Table Mountain facility in collaboration with Dr. Mike Hardesty (CIRES-NOAA/ESRL) <strong>and</strong> his<br />
team. Dr. Chu brought a lidar container from Rothera, Antarctica to CU, <strong>and</strong> it is now residing beside T-2 <strong>and</strong> will<br />
host the MRI lidar transmitter for future mobile deployment.<br />
The LabView-software-based servo loop <strong>and</strong> real-time<br />
signal inquiry/processing that the team is developing, if<br />
successful, will significantly improve CRRL lidar frequency<br />
accuracy <strong>and</strong> stability. Traditionally, lidar system<br />
parameters were not recorded routinely, which put the<br />
measurement accuracy into question. The new computerbased<br />
system will enable automatic control, measurement,<br />
<strong>and</strong> recording of lidar parameters to improve accuracy <strong>and</strong><br />
stability.<br />
With the lidar data collected from Antarctic <strong>and</strong> equatorial<br />
regions, the Chu Research Group did scientific<br />
investigations on stratospheric gravity waves, polar<br />
stratospheric clouds, polar mesospheric clouds, <strong>and</strong> middle<br />
atmosphere temperatures. The interesting results obtained<br />
from these studies further motivated the team to develop the<br />
best lidar instruments, make global observations to collect<br />
more data, <strong>and</strong> conduct further investigations on global<br />
atmosphere composition, thermal structure, <strong>and</strong> dynamics.<br />
108<br />
CU mobile lidar container (front) <strong>and</strong> lidar<br />
observatory (back) at NOAA Table Mountain.<br />
The container will host the MRI lidar<br />
transmitter.
Complementary Research: Faculty Fellows Research<br />
Analysis of the Poor Catalytic Performance of Pentachlorophenol Hydroxylase<br />
Shelley D. Copley<br />
Funding: DOD Army Research Office<br />
Pentachlorophenol (PCP) is a highly toxic pesticide that was first introduced into the<br />
environment in 1936. Biodegradation of PCP is challenging because it uncouples oxidative<br />
phosphorylation <strong>and</strong> alters membrane fluidity. Despite its toxicity <strong>and</strong> recent introduction<br />
into the environment, PCP can be completely degraded by Sphingobium chlorophenolicum,<br />
several strains of which have been isolated from PCP-contaminated soil. Although the<br />
ability of S. chlorophenolicum to mineralize PCP is remarkable, the inefficiency of the<br />
metabolic pathway has limited the potential for its use in bioremediation.<br />
S. chlorophenolicum appears to have assembled a<br />
new pathway for degradation of PCP by recruiting<br />
previously existing enzymes from at least two other<br />
metabolic pathways (Figure 1, right). None of these<br />
enzymes functions very well. TCHQ dehalogenase<br />
(PcpC), the enzyme that removes two chlorines from<br />
the aromatic ring, is particularly critical, as<br />
dioxygenases that cleave hydroquinones are unable to<br />
cleave substrates with multiple electron-withdrawing<br />
chlorine substituents.<br />
TCHQ dehalogenase is subject to severe inhibition by<br />
its aromatic substrates (TCHQ <strong>and</strong> TriCHQ) (Figure<br />
2, below). This is very unusual; typically, the rate of<br />
an enzymatic reaction increases with substrate<br />
concentration until the enzyme is saturated. We<br />
investigated the mechanism of this substrate<br />
inhibition. The enzyme actually dehalogenates the<br />
substrate at a respectable rate–about 25 s -1 . However,<br />
the dehalogenation reaction leaves the enzyme in an<br />
altered form, with a glutathione covalently attached<br />
to a cysteine at the active site. This glutathione must<br />
be removed by reaction with a second molecule of<br />
glutathione to regenerate the free enzyme. When the<br />
Cl<br />
Cl<br />
aromatic substrate binds prematurely to the active site, this reaction cannot take place <strong>and</strong> the enzyme is trapped in a<br />
non-reactive state. Higher concentrations of substrate lead to more <strong>and</strong> more sequestration of the enzyme in the<br />
inactive state. These results help us to underst<strong>and</strong> both why the current enzyme is a poor catalyst, <strong>and</strong> the aspects of<br />
enzyme performance that need to be manipulated to evolve a better enzyme.<br />
V ( M/s)<br />
0.8<br />
0.7<br />
0.6<br />
0.5<br />
0.4<br />
0.3<br />
0.2<br />
0.1<br />
0<br />
0 20 40 60 80 100<br />
[TriCHQ] ( M)<br />
109<br />
OH<br />
Cl<br />
PCP<br />
Cl<br />
Cl<br />
PcpB<br />
NADPH,<br />
O 2<br />
Cl<br />
Cl<br />
PcpD<br />
Cl<br />
O<br />
OH<br />
Cl<br />
Cl<br />
O<br />
TCBQ<br />
NADPH<br />
Cl Cl<br />
OH<br />
TCHQ<br />
PcpC OH PcpC<br />
Cl Cl<br />
2 GSH<br />
Cl Cl<br />
2 GSH<br />
Cl H<br />
OH<br />
TriCHQ<br />
H<br />
PcpA<br />
OH<br />
OH<br />
DCHQ<br />
O 2<br />
Cl<br />
OH<br />
Cl Cl<br />
H H O<br />
O OH O<br />
OH<br />
Cl O Cl<br />
or<br />
H H<br />
OH<br />
Figure 1. Pathway for degradation of PCP in S.<br />
chlorophenolicum ATCC 39723. PcpB, PCP hydroxylase;<br />
PcpD, TCBQ reductase; PcpC, TCHQ dehalogenase;<br />
PcpA, DCHQ dioxygenase (PcpA); GSH, glutathione.<br />
Figure 2. Inhibition of TCHQ dehalogenase by its<br />
substrate.<br />
H
Complementary Research: Faculty Fellows Research<br />
Temporal Variability in Airborne Microbial Populations<br />
Noah Fierer<br />
Funding: A.W. Mellon Foundation, NSF<br />
Bacteria <strong>and</strong> fungi are ubiquitous in the atmosphere <strong>and</strong> represent a large proportion of total<br />
airborne particulates. Atmospheric transport is a key mode of microbial dispersal <strong>and</strong> the<br />
transmission of airborne plant <strong>and</strong> animal pathogens can have significant impacts on<br />
ecosystems, human health, <strong>and</strong> agricultural productivity. Despite their importance, there<br />
have been very few studies describing the full extent of bacterial <strong>and</strong> fungal diversity in the<br />
atmosphere. We used a cultivation-independent molecular approach to identify the bacteria<br />
<strong>and</strong> fungi present in air samples collected from a single site in Boulder, Colorado. We<br />
documented shifts in the types of bacteria <strong>and</strong> fungi found in air from the site over an eight-day period to assess the<br />
temporal variability associated with the diversity of airborne microbes <strong>and</strong> the climatic factors driving this<br />
variability.<br />
We found that the air samples were dominated by potentially allergenic fungi <strong>and</strong> a diverse array of bacteria,<br />
including specific types of bacteria that are commonly found in air samples collected from across the globe.<br />
Bacterial:fungal ratios varied by two orders of magnitude over the sampling period, <strong>and</strong> we observed large shifts in<br />
the diversity of bacteria present in the air samples collected on different dates. We observed more phylogenetic<br />
similarity between bacteria collected from geographically distant sites than between bacteria collected from the<br />
same site on different days. These results suggest that outdoor air may harbor similar types of bacteria regardless of<br />
location, <strong>and</strong> that the short-term temporal variability in airborne bacterial assemblages can be very large. We are<br />
currently exp<strong>and</strong>ing on this work to further underst<strong>and</strong> how airborne microorganisms vary across space <strong>and</strong> time so<br />
we can better predict disease outbreaks (including allergenic asthma) triggered by airborne bacteria <strong>and</strong> fungi.<br />
Figure 1. Air sampling equipment on site in northeastern<br />
Colorado.<br />
110<br />
Figure 2. The taxonomic composition of the<br />
biological aerosols sampled from Boulder, CO on<br />
five dates.
Complementary Research: Faculty Fellows Research<br />
Tectonics of Foundering Lithosphere, Sierra Nevada, California<br />
Craig H. Jones<br />
Funding: EarthScope Program <strong>and</strong> Continental Dynamics Program<br />
In contrast with ocean tectonics, continental tectonics are diffuse <strong>and</strong> occur in places <strong>and</strong><br />
with styles not easily anticipated from plate kinematics. One potential cause is the<br />
antibuoyant mantle lithosphere under continents <strong>and</strong> the potential that it could detach <strong>and</strong><br />
sink into the mantle. The Sierra Nevada of California might overlie lithosphere that<br />
foundered in the past 10 million years; Dr. Jones <strong>and</strong> colleagues at two other universities<br />
are conducting a new seismological experiment to underst<strong>and</strong> the dynamics of this process.<br />
CIRES student Heidi Reeg <strong>and</strong> CIRES alum<br />
Hersh Gilbert complete installing the last<br />
SNEP seismometer, January 2007<br />
theory. Recognizing that the Sierra overlies freshly removed<br />
lithosphere provides the chance to underst<strong>and</strong> this process from<br />
observations. Previously, Dr. Jones <strong>and</strong> his colleagues<br />
(including CIRES Fellow G. Lang Farmer) had proposed that<br />
the foundering of sub-Sierran lithosphere had led to<br />
widespread uplift of the Sierra <strong>and</strong> western Great Basin,<br />
extensional faulting in the western Great Basin, contraction<br />
across the California Coast Ranges, <strong>and</strong> a shift in Pacific-North<br />
America plate motion from the western towards the eastern<br />
side of the Sierra (figure at right, bottom panel). Work by Jones<br />
<strong>and</strong> CIRES Fellow Peter Molnar had shown that the descent of<br />
this lithosphere was consistent with Rayleigh-Taylor<br />
instabilities <strong>and</strong> laboratory experiments on rock rheology<br />
provided that high-stress limits on power law rheologies were<br />
honored, indicating that such high-stress limits on rock strength<br />
are probably real. The constraint of the new experiment on the<br />
base of the descending body is critical in providing bounds on<br />
descent of this kind of material. Furthermore, the unusual<br />
geometry of the descending body, not predicted by experiments<br />
to date, poses new challenges for underst<strong>and</strong>ing this process<br />
<strong>and</strong> suggests unforeseen factors at play.<br />
Accomplishments<br />
The present Earthscope grant represents the very first deployment<br />
of the FlexArray facility being constructed by IRIS PASSCAL as<br />
part of the U.S. Array component of the NSF ~$200M MRE<br />
(Major Research Equipment) EarthScope program. In our second<br />
year, we moved most of our network of over fifty field stations to<br />
cover the northern Sierra Nevada. Four CU students, as well as<br />
hosted IRIS interns from Georgia Tech <strong>and</strong> Princeton, have gained<br />
considerable field experience. Some early results were summarized<br />
in a May 2007 issue of Eos. The associated <strong>and</strong> newly awarded<br />
Continental Dynamics grant supports four CU faculty (including<br />
three CIRES Fellows) <strong>and</strong> financed a workshop of both projects‘<br />
PIs <strong>and</strong> some outside scientists in the Sierra in the fall of 2006.<br />
Significance<br />
The removal of mantle lithosphere has long been proposed as a<br />
means of driving enigmatic deformation in continents, but<br />
hypotheses for the impacts of such an event were largely based on<br />
111<br />
Competing explanations in the Sierra: localized<br />
lithospheric foundering with minimal<br />
implications (center) <strong>and</strong> widespread foundering<br />
with widespread consequences (bottom).
Nitrogen Fixation in Lakes<br />
William M. Lewis, Jr.<br />
Complementary Research: Faculty Fellows Research<br />
All lakes contain phytoplankton, a diverse community of unicellular algae that are able to live<br />
suspended in the water column because of their very low sinking rates. Phytoplankton are not<br />
visible individually because they grow as unicells or small colonies with a median size of<br />
approximately 100 μm. In lakes that receive small amounts of plant nutrients – phosphorous<br />
(P) <strong>and</strong> nitrogen (N) – phytoplankton are collectively invisible. Where plant nutrients are<br />
abundant, phytoplankton pigments bring visible color to the water. At high concentrations of P<br />
<strong>and</strong> N, phytoplankton become so abundant that they cause a very strong green color <strong>and</strong> reduce<br />
transparency in a lake. Strong growth (―blooms‖) of algae are responsible for many undesirable<br />
changes in lakes, including anoxia in deep water, formation of scums, production of toxic substances or taste <strong>and</strong> odor,<br />
<strong>and</strong> interference with filtration processes used by water-treatment plants.<br />
Lakes containing high concentrations of anthropogenic P often show depletion of inorganic N because the human<br />
sources have a much higher ratio of P:N than natural sources. Under these conditions, N-fixing algae often become<br />
dominant. While other algae are held back by a lack of inorganic N, the N fixers convert N2 (which is biologically<br />
inert) to NH 4+ , which allows their continued growth. N-fixing algae are potent scum formers <strong>and</strong> sources of toxins.<br />
Blue-green algae are in fact cyanobacteria, which separates them from the other algae in phytoplankton, which are<br />
eukaryotic (non-microbial). The N fixers have growing filaments containing one or more specialized cells (heterocysts)<br />
that are specialized for N fixation. Within the heterocyst, photosystem II does not function, <strong>and</strong> no oxygen is released.<br />
Therefore, the anoxic conditions necessary for N fixation are available inside the heterocyst.<br />
Aphanizomenon, showing the N-fixation cell<br />
(heterocyst, center).<br />
for most of the cells in the water column, <strong>and</strong> its ability to store reductant<br />
during brief exposure to light near the surface for later N fixation at night<br />
or when the cell is located beyond the reach of downwelling irradiance.<br />
Bradburn‘s research suggests that forced mixing might be quite effective<br />
in controlling Aphanizomenon. The effect of forced mixing would be to<br />
cause Aphanizomenon to exhaust its stored reductant at a pace faster than<br />
the reductant could be restored by exposure to strong light.<br />
Mark has a position with NOAA‘s Cooperative Institute for Limnology<br />
<strong>and</strong> Ecosystem Research program (CILER) that we hope will be the first<br />
step toward his participation in NOAA‘s very active <strong>and</strong> important<br />
program on nuisance algal species, which plague not only freshwater<br />
lakes but also estuaries throughout the world.<br />
One particularly potent N fixer in Colorado <strong>and</strong> throughout the<br />
west is Aphanizomenon, which forms blooms in many local lakes,<br />
such as Cherry Creek Reservoir, <strong>and</strong> national lakes, such as Upper<br />
Klamath Lake, Oregon. It has not been clear why Aphanizomenon<br />
is more successful than some other genera of N fixers. Research<br />
led by Mark Bradburn, CIRES graduate student, has provided<br />
recent insight into the success of Aphanizomenon. Using an<br />
acetylene reduction method to measure N fixation rates, Bradburn<br />
conducted experiments leading to the construction of lightresponse<br />
curves for Aphanizomenon <strong>and</strong>, uniquely to his work,<br />
experiments with neon dark fixation. Mark showed that<br />
Aphanizomenon is extraordinarily efficient at using weak sources<br />
of light in fixing N, <strong>and</strong> that it has a remarkable capability to<br />
conduct fixation in the absence of light. The secret to<br />
Aphanizomenon’s success is its ability to fix N in water that is<br />
thickly crowded with algal cells, thus providing only weak light<br />
112<br />
Nitrogen Fixation (nmol N 10 -6 heterocysts hr -1 )<br />
90<br />
80<br />
70<br />
60<br />
50<br />
40<br />
30<br />
20<br />
10<br />
0<br />
Pelican Pond<br />
31-Aug<br />
0 200 400 600 800 1000 1200<br />
Light (umol m -2 s -1 )
Complementary Research: Faculty Fellows Research<br />
Emergence of the Maritime Continent <strong>and</strong> the Demise of Permanent El Niño?<br />
Peter Molnar<br />
Description<br />
Peter Molnar devoted a part of his research effort in 2006 to underst<strong>and</strong>ing how the<br />
development of Indonesia might have transformed the climate from a permanent El Niño<br />
state before 3-4 Ma to its present state dominated by ENSO (El Niño-Southern Oscillation).<br />
Katherine Dayem, a graduate student at the University of Colorado; David Noone, CIRES<br />
Fellow; <strong>and</strong> Molnar examined the distribution of rainfall over Indonesia <strong>and</strong> over the Warm<br />
Pool of the western Pacific using the TRMM satellite. The motivation was that isl<strong>and</strong>s in the<br />
Indonesian region emerged during the past 3-4 million years.<br />
Accomplishments<br />
Dayem et al. [2007] found that rain falls heavily on the isl<strong>and</strong>s (Figure 1). The strength of the Walker circulation<br />
correlates with rainfall over the isl<strong>and</strong>s of Indonesia, but not with rainfall over the western Warm Pool, <strong>and</strong><br />
negatively with rainfall over the whole Warm Pool (Figure 2)<br />
Significance<br />
This suggests that the permanent Pre-Ice-Age El Niño state may owe its existence to the emergence of the isl<strong>and</strong>s in<br />
the Maritime Continent.<br />
Figure 1 (right). Average TRMM precipitation<br />
rate (mm/day) for December 1997 to November<br />
2005. Contours of elevation at 0, 1000, <strong>and</strong> 2000<br />
m are shown in thick white lines. The area of the<br />
warm pool is shown by the solid red box, <strong>and</strong> the<br />
area of the western warm pool is west of the<br />
dashed red line.<br />
113<br />
Figure 2 (left). Linear regression coefficients between<br />
precipitation of over Maritime Continent <strong>and</strong> zonal wind<br />
shear (m/s)/(mm/day) (a measure of strength of the<br />
Walker Circulation). Regression coefficients are shown<br />
with colors. Contours of t (from outer contour to inner<br />
contour) represent 90%, 95%, <strong>and</strong> 99% confidence.<br />
Black (white) contours indicate positive (negative)<br />
correlations.
Complementary Research: Faculty Fellows Research<br />
Carbon Sequestration in a Front Range Forest<br />
Russell K. Monson<br />
Funding: DOE, NSF<br />
For the past nine years, we have been monitoring the exchange of carbon dioxide from the<br />
top of a 27-meter tower at the Niwot Ridge AmeriFlux site near the C-1 NOAA site. Our<br />
aims are to underst<strong>and</strong> the principal controls over, <strong>and</strong> magnitude of, the exchange of CO2<br />
from the trees <strong>and</strong> soils of the ecosystem, <strong>and</strong> their response to interannual climate variation.<br />
Our site is one of over 200 worldwide that functions in an integrated network known as<br />
Fluxnet. The purpose of Fluxnet is to provide fundamental insight <strong>and</strong> data to modelers<br />
using regional <strong>and</strong> global carbon budgets, particularly in response to future climate change.<br />
We have particularly focused on the question of how this mountain forest ecosystem<br />
responds to an acceleration of the onset of spring. In this forest, the transition from winter to spring has occurred 2-3<br />
weeks earlier, on average, over the past five decades, compared to earlier decades. This acceleration is a systematic<br />
component of climate change in the Colorado Front Range, <strong>and</strong> is expected to continue in the face of future<br />
warming trends.<br />
Niwot Ridge AmeriFlux Site. Rocky Mountains, Colorado, USA,<br />
Subalpine forest. Lodgepole pine, subalpine fir, Engelmann spruce.<br />
3050 m elevation.<br />
114<br />
We have used a combination of direct<br />
observations using our tower flux systems<br />
<strong>and</strong> data assimilation into an ecosystem<br />
process model known as the Simple<br />
Photosynthesis <strong>and</strong> Evapotranspiration<br />
(SIPNET) model to evaluate component<br />
processes of the observed CO2 fluxes. The<br />
results reveal a striking sensitivity of the<br />
local carbon cycle to snow depth <strong>and</strong> the<br />
timing of spring snowmelt. Unlike many<br />
temperate- <strong>and</strong> northern-latitude forests that<br />
appear to respond to earlier spring warming<br />
through increased annual CO2 uptake, the<br />
Niwot Ridge forest responds to earlier<br />
spring warming through decreased annual<br />
CO2 uptake. This is due to a high sensitivity<br />
of the photosynthesis processes of this<br />
forest to reduced soil water supply in the<br />
face of earlier snowmelt <strong>and</strong> lower spring<br />
snow depth, <strong>and</strong> to the acceleration of high<br />
rates of soil respiration as the snow pack<br />
recedes earlier in the summer. Thus, in the<br />
face of earlier spring warming, the forest<br />
takes less CO2 out of the atmosphere<br />
through photosynthesis, <strong>and</strong> adds more CO2<br />
to the atmosphere through respiration.<br />
These results have led to a better<br />
underst<strong>and</strong>ing of an important feedback<br />
between climate warming <strong>and</strong> the forest<br />
carbon cycle in mountain forests of the<br />
western U.S.
Complementary Research: Faculty Fellows Research<br />
Satellite Observations of Present-Day Sea-Level Change<br />
R. Steven Nerem<br />
Observations of long-term sea-level change can provide important corroboration of<br />
climate variations predicted by models <strong>and</strong> can help us prepare for the socioeconomic<br />
impacts of sea-level change. The TOPEX/Poseidon <strong>and</strong> Jason satellites have observed a<br />
mean rate of sea-level rise of 3.5 mm/year since 1993 (figure below, left). Current efforts<br />
focus on determining the causes of this change <strong>and</strong> relating the satellite record of sea-level<br />
change to the longer-term record from tide gauges.<br />
50<br />
40<br />
30<br />
20<br />
10<br />
0<br />
-10<br />
1994 1996 1998 2000 2002 2004 2006<br />
Accomplishments<br />
Much has been learned over the past year<br />
regarding the contributions to the observed<br />
record of sea-level change from satellites. Of the observed 3.5<br />
mm/year global averaged sea-level rise, approximately a third is now<br />
thought to be due to the warming of the oceans (thermal expansion), a<br />
third due to the melting of ice in mountain glaciers (~1 mm/year), <strong>and</strong><br />
the rest due to other exchanges of freshwater with the continents<br />
including ice melt from Greenl<strong>and</strong> <strong>and</strong> Antarctica. The total rise is<br />
significantly greater than has been observed over the last 75 years<br />
from tide gauges (~1.8 mm/year).<br />
Recently, a new technique has been developed that allows the direct measurement of the continental water<br />
contributions from space. The GRACE satellite mission has precisely measured temporal variations in the Earth‘s<br />
gravitational field since 2002. As the melting of ice in mountain glaciers <strong>and</strong> ice sheets, in addition to other runoff, adds<br />
water mass to the oceans, GRACE has demonstrated the ability to directly measure this change in mass. GRACE can<br />
also determine the relative contributions of different areas on the continents. At seasonal frequencies, GRACE ocean<br />
mass estimates have been shown to compare quite well with estimates from satellite altimetry corrected for thermal<br />
expansion using shipboard measurements (figure below, right). The seasonal variations in ocean water mass are due to<br />
the seasonal exchange of water with the continents, <strong>and</strong> thus GRACE<br />
measurements are expected to make their greatest impact on studies of<br />
the global water cycle. However, eventually GRACE should help<br />
unravel the differences we have seen between the altimetry <strong>and</strong> the<br />
ocean temperature measurements, as in theory these are due to changes<br />
in global ocean mass.<br />
Significance<br />
Satellite altimeter <strong>and</strong> gravity measurements had a significant role in<br />
the formulation of the last IPCC climate assessment. Satellite altimetry<br />
has conclusively shown that sea-level rise has been higher over the<br />
last 15 years as compared to the last century, however this could still<br />
represent decadal variability in the Earth system, <strong>and</strong> any further<br />
conclusions will have to await a longer time-series of measurements.<br />
The record from the GRACE mission, while too short to detect climate<br />
signals, has demonstrated the ability to measure changes in the mass<br />
of the oceans <strong>and</strong> the mass of the polar ice sheets. Thus, as this time<br />
series becomes longer, it is expected that satellite gravity missions will<br />
play an equally important role to satellite altimetry in diagnosing the<br />
magnitude of sea-level change <strong>and</strong> its causes.<br />
Global mean sea-level variability <strong>and</strong> its components. Total sea level (upper panel), the steric component of sea<br />
level (middle panel), <strong>and</strong> ocean mass variability (bottom panel). Black lines show the observed estimates from the<br />
satellite altimeter, Argo floats, <strong>and</strong> GRACE, respectively. Gray lines show the inferred estimates, computed by<br />
adding or subtracting the other two observation estimates as given by equation (1). Error bars represent r<strong>and</strong>om<br />
errors on the observed estimates. [Willis, Chambers, <strong>and</strong> Nerem, 2007].<br />
115
Complementary Research: Faculty Fellows Research<br />
Assessing Continental Hydrology with Water Isotope Measurements from Space<br />
David Noone<br />
In collaboration with the NASA Jet Propulsion Laboratory<br />
Observations of the HDO to H2O isotope ratio (expressed as δD) from the Tropospheric<br />
Emission Spectrometer on board NASA‘s Aura spacecraft is a valuable new resource for<br />
investigating the atmospheric hydrologic cycle. The isotopic composition of water vapor<br />
gives insight to the processes active in some regions because different processes have<br />
different isotopic signatures. For instance, lighter isotopes preferentially evaporate <strong>and</strong><br />
heavier isotopes preferentially condense, which allows the observations to be used to<br />
determine the recycling efficiency (the relationship between evaporation <strong>and</strong> precipitation). Further, the isotopic<br />
composition of evaporation over the ocean reflects the thermal properties during evaporation, while that of<br />
evapotranspiration reflects the isotopic composition of previous precipitation. This contrast allows the observations<br />
to be used to partition the source of tropospheric water into that originating from the ocean <strong>and</strong> that from continents.<br />
Accomplishments<br />
We have established which processes control the atmospheric water vapor over three tropical continental regions:<br />
the Amazon, Southeast Asian monsoon region <strong>and</strong> northern Australia. Over the Amazon, the transport pathways for<br />
water with high <strong>and</strong> low isotope values are found with five-day back trajectories (figure below, top). During the wet<br />
season, there are two characteristically different regimes: 1) moisture originates over the Atlantic, <strong>and</strong> moves inl<strong>and</strong><br />
with continual condensation, <strong>and</strong> 2) moisture originates off the Venezuelan coast or over the continent itself <strong>and</strong><br />
undergoes strong convective precipitation before arriving over the Amazon. Only the first of these is widely<br />
acknowledged in the literature. During the Amazon dry<br />
season it is again the second of these regimes, which<br />
dominates, <strong>and</strong> again shows the value of isotopes in<br />
allowing assessment of not only the conditions that<br />
control the precipitation but also those that control the<br />
evapotranspiration of the region (figure right, bottom).<br />
Although often considered climatologically similar, the<br />
wet season monsoon over Southeast Asia is found to<br />
have different combinations of moisture sources.<br />
Specifically, the isotopes suggest a stronger influence<br />
of advection from nearby oceanic regions, <strong>and</strong> that the<br />
high elevation Tibetan plateau supplies dry air via<br />
subsidence. The role of subsidence is also found to be a<br />
pronounced source of dry air over northern Australia<br />
during the dry season, while in that region this is<br />
balanced by strong local convection, which supplies<br />
water from the boundary layer. While many previous<br />
studies have focused on the importance of precipitation<br />
in hydrological analysis, an important outcome of this<br />
work is that it is also important to consider the fate of<br />
dry air <strong>and</strong> the local evaporation regime to establish a<br />
complete view of the hydrologic balance.<br />
Figure shows the difference in conditions with most (blue) <strong>and</strong> least (red) depleted isotopic composition. (Top)<br />
Location of air parcels five days before they arrive in a box defining the Amazon region. The most depleted isotope<br />
observations (blue) are associated with strong local condensation, while least depleted vapor (red) has more direct<br />
history from the oceanic source. (Bottom) Frequency distribution of δD isotope values for the wet (blue) <strong>and</strong> dry<br />
(red) season over the Amazon. Solid lines show the values over the Amazon box, <strong>and</strong> dashed lines show the<br />
distribution in the source region. In the wet season condensation shifts the distribution toward more depleted values,<br />
while in the dry season local evapotranspiration injects new water vapor with a less depleted δD value of around -<br />
140 per mil.<br />
116
Complementary Research: Faculty Fellows Research<br />
Workshop on Climate Change <strong>and</strong> Disaster Losses: Underst<strong>and</strong>ing <strong>and</strong> Attributing<br />
Trends <strong>and</strong> Projections, Summary Report<br />
R. A. Pielke, Jr.<br />
Funding: NSF<br />
In May 2006, Roger Pielke, Jr. <strong>and</strong> Peter Höppe of the Geo Risks Research Department of<br />
Munich organized a workshop on the assessment of factors leading to increasing loss trends<br />
due to natural disasters. The workshop was timely, especially given the apparent lack of<br />
consensus on the role of climate change in disaster loss trends. The workshop brought<br />
together a diverse group of international experts in the fields of climatology <strong>and</strong> disaster<br />
research. The workshop was sponsored by Munich Re, U.S. National Science Foundation,<br />
Tyndall Center for Climate Change Research, <strong>and</strong> the GKSS Research Center.<br />
The general questions answered at this workshop were:<br />
What factors account for increasing costs of weather-related disasters in recent decades?<br />
What are the implications of these underst<strong>and</strong>ings, for both research <strong>and</strong> policy?<br />
A short brochure, which includes the 20 consensus <strong>and</strong> unanimous statements of the workshop participants, is<br />
available at<br />
http://sciencepolicy.colorado.edu/sparc/research/projects/extreme_events/munich_workshop/ccdl_workshop_brochure.pdf<br />
The full workshop report is available at:<br />
http://sciencepolicy.colorado.edu/sparc/research/projects/extreme_events/munich_workshop/workshop_report.html.<br />
The growing global toll of disasters, according to data collected by Munich Re Group.<br />
Source: Munich Re Group (2005).<br />
117
Complementary Research: Faculty Fellows Research<br />
Underst<strong>and</strong>ing the Spatio-Temporal Variability of the North American Monsoon: Implications<br />
to Water Resources Management in the Southwestern U.S.<br />
Balaji Rajagopalan<br />
Funding: National Oceanic <strong>and</strong> Atmospheric Administration<br />
A significant part of the streamflow in the southwestern U.S. occurs during summer due to<br />
North American Summer Monsoon (NASM) precipitation (up to 50% of annual<br />
precipitation occurs during summer). Although the NASM is not a strong phenomenon,<br />
unlike its Indian <strong>and</strong> Asian counterpart, its impact on water resources management <strong>and</strong><br />
planning activities is unquestionable. Therefore, underst<strong>and</strong>ing the spatio-temporal<br />
variability of summer precipitation <strong>and</strong> the associated hydrologic cycle is crucial for<br />
developing effective water management strategies. To this end, this interdisciplinary research effort will broadly<br />
involve: (a) Diagnosis: underst<strong>and</strong>ing the spatio-temporal <strong>and</strong> interannual variability of the summer precipitation,<br />
temperature <strong>and</strong> streamflows (b) Prediction: developing improved methods for ensemble hydrologic prediction that<br />
incorporates the climate variability information, <strong>and</strong> (c) Water Management: incorporate all of this in a Decision<br />
Support System (DSS) for water management with application to the Pecos River Basin.<br />
Accomplishments<br />
Streamflow Analysis - We investigated the spatial-temporal variability of the North American monsoon (NAM)<br />
rainfall in the previous years. These results were published in the special North American Monsoon issue of the<br />
Journal of Climate [Grantz et al., 2007] <strong>and</strong> received media coverage. This research was followed up with a similar<br />
analysis of streamflows in New Mexico <strong>and</strong> Arizona during winter, spring <strong>and</strong> summer. Streamflow stations were<br />
grouped into north (snowmelt dominated), central (early snowmelt <strong>and</strong> rain dominated), or south (summer rainfall<br />
dominated) regions based on streamflow climatology <strong>and</strong> peak flow month. The winter/spring streamflow exhibited<br />
a significant increasing trend, likely driven by enhanced ENSO activity in recent decades. Both the magnitude <strong>and</strong><br />
timing of early summer streamflows showed a significant relationship with antecedent winter/spring precipitation in<br />
the NAM region, with increased precipitation favoring a weaker <strong>and</strong> later streamflow cycle, <strong>and</strong> vice-versa. Because<br />
summer streamflows in the northern region are significantly impacted by the antecedent spring runoff, a simple<br />
approach was applied to remove this influence. The hypothesis proposed in the precipitation chapter was tested <strong>and</strong><br />
validated with streamflow variability. Results for the southern region monsoon streamflow supported the hypothesis<br />
more than the northern region streamflow. The results for the northern regions streamflow are mainly due to the<br />
effect of spring snowmelt extending into the summer months in the northern region. While NAM precipitation has<br />
been widely analyzed, only one known study has been conducted on the NAM streamflow. This research is unique<br />
in that it analyzed streamflow using observational data (rather than models) <strong>and</strong> it focused on the more variable<br />
region of New Mexico <strong>and</strong> Arizona (rather than Mexico). In addition, the technique of grouping stations based on<br />
peak flow month provided important insight to the relative importance of monsoon runoff in each region. This<br />
grouping technique could be useful in other streamflow studies (monsoon or<br />
otherwise) in the region. That the streamflow results corroborate those of the<br />
precipitation analysis strengthens the conclusions of both analyses.<br />
Seasonal Streamflow Forecast: A modeling framework to provide ensemble<br />
forecasts of streamflows during the irrigation season on the Pecos River Basin,<br />
using large-scale l<strong>and</strong>-ocean-atmosphere variables, was developed. Because<br />
water management in the region operates under the dry monsoon assumption,<br />
the framework‘s high forecast skill, particularly for wet years, has important<br />
implications for capitalizing on this ―extra‖ water.<br />
Water Management Application: Irrigation season streamflow forecasts on the<br />
Pecos River were coupled with the Pecos River Basin water operations model to<br />
demonstrate that using large-scale <strong>and</strong> local-scale climate information to predict<br />
the NAM can have significant positive impacts on water management.<br />
Pecos River Basin. Water is stored in the upper two reservoirs <strong>and</strong> released to<br />
meet the Irrigation dem<strong>and</strong> in Carlsbad by the lower two reservoirs.<br />
118
The Arctic's Shrinking Sea Ice Cover<br />
Complementary Research: Faculty Fellows Research<br />
Mark C. Serreze<br />
with Julienne C. Stroeve, Walt Meier, Theodore Scambos, Andrew P.<br />
Barrett<br />
Funding: NASA <strong>and</strong> NSF<br />
Of the many environmental changes observed in the Arctic, the most visually striking is the<br />
rapid shrinking of its floating sea ice cover. Based on satellite data through 2006,<br />
September sea ice extent (the region of the Arctic Ocean with a fractional sea ice cover of<br />
at least 15%) has declined at a rate of over 9% per decade. As of the end of August 2007,<br />
sea ice extent had already set a new all-time low in the satellite record, with at least another two weeks of summer<br />
melt to go. Strong evidence for a role of increased atmospheric greenhouse gases (the greenhouse effect) comes<br />
from global climate models participating in the Intergovernmental Panel on Climate Change Fourth Assessment<br />
Report (IPCC-AR4). Essentially all of these models depict sea ice loss over the period of available records. The<br />
modeled trends, however, are smaller than those that are actually observed.<br />
Time series of Arctic sea ice extent from the IPCC-AR4<br />
models (1900-2100) <strong>and</strong> observations (1953-2006). The<br />
solid back line is the average from 13 different models.<br />
Shading encloses the ±1 st<strong>and</strong>ard deviation of the different<br />
simulations. The observed time series is represented by the<br />
thick red line.<br />
119<br />
Why is the sea ice cover shrinking more rapidly<br />
compared to model projections? When will we see<br />
an ice-free Arctic Ocean in summer? Answering<br />
these questions has been a central focus of our<br />
research group over the past year. There is little<br />
doubt that natural processes have served to ―boost‖<br />
the observed downward trend. Changes in the<br />
circulation of the atmosphere have helped to flush<br />
some of the Arctic‘s store of thicker sea ice into the<br />
North Atlantic. This has left the Arctic with thinner<br />
ice that can be more easily melted out in summer.<br />
There have been changes in the transport of ocean<br />
heat. For example, there is evidence that<br />
increasingly warm pulses of water have entered the<br />
Arctic Ocean from the Atlantic. Changes in cloud<br />
cover also appear to have played a role. However,<br />
after considering these issues, the emerging<br />
conclusion is that as a group, the IPCC-AR4<br />
models are too conservative regarding their<br />
response to the greenhouse effect. Completely<br />
losing the summer ice cover by the year 2030 now<br />
seems like a realistic scenario.<br />
What will be the impacts of sea ice loss? Some models suggest that we may see effects on atmospheric circulation<br />
<strong>and</strong> precipitation extending into middle latitudes. That the ice loss is already having impacts on the Arctic itself is<br />
clear. Climate models tell us that the rise in surface air temperature over the Arctic Ocean will be larger than in<br />
lower latitudes. This so-called Arctic amplification is directly tied to loss of the sea-ice cover, as with less ice, there<br />
will be strong transfers of heat from the ocean to the atmosphere during the cold season [Serreze et al., 2007a].<br />
Observations show that Arctic amplification has arrived, most apparent in the autumn, <strong>and</strong> ahead of schedule. It<br />
seems that the Arctic is on the fast track of change.
Complementary Research: Faculty Fellows Research<br />
Rio Gr<strong>and</strong>e Rift GPS Tectonics Project Underway<br />
Anne Sheehan<br />
Funding: NSF (project initiated with 2001 CIRES IRP seed grant)<br />
Twenty-two high precision GPS monuments, with two more in progress, have been installed<br />
<strong>and</strong> instrumented throughout Colorado <strong>and</strong> New Mexico as part of an NSF-funded project to<br />
measure the crustal deformation of the Rio Gr<strong>and</strong>e Rift.<br />
Accomplishments<br />
The purpose of this NSF-sponsored study is to precisely measure the ground movement <strong>and</strong><br />
earthquake potential of the Rio Gr<strong>and</strong>e Rift in Colorado <strong>and</strong> New Mexico. Using state-of-the-art Global Positioning<br />
System instruments at 24 sites in Colorado <strong>and</strong> New Mexico, we will track the rift‘s movement in millimeters during<br />
most of the next five years. This study will provide modern satellite geodetic estimates of the active tectonics of<br />
Colorado <strong>and</strong> New Mexico. The Rio Gr<strong>and</strong>e Rift formed between 35 <strong>and</strong> 29 million years ago when the crust began<br />
to spread apart, triggering volcanism in the region. The Rio Gr<strong>and</strong>e Rift extends hundreds of miles from Colorado‘s<br />
central Rocky Mountains to Mexico, <strong>and</strong> geologists have estimated it spreads apart up to five millimeters each year.<br />
However, the margin of error in these estimates can be nearly as much as the estimates themselves. A better<br />
underst<strong>and</strong>ing of the variable character of the rift could help us underst<strong>and</strong> how <strong>and</strong> why tectonic plates undergo<br />
stretching, as well as the earthquake <strong>and</strong> volcanic hazards within rift zones. The project is part of NSF‘s EarthScope<br />
initiative, a NSF MRE project. Earthscope is funded by NSF <strong>and</strong> conducted in partnership with the U.S. Geological<br />
Survey <strong>and</strong> NASA to study North American geologic evolution, earthquakes <strong>and</strong> volcanic activity.<br />
Education <strong>and</strong> Outreach<br />
Anne Sheehan teamed with the CU Science Explorers program to develop a hazards curriculum. This curriculum<br />
was taught to nearly 1800 middle school aged children at 17 different locations throughout the state of Colorado.<br />
Over 350 Colorado middle school teachers were trained on the hazards curriculum, <strong>and</strong> they were given materials to<br />
take back to their classrooms to reach even more students.<br />
Mark McCaffrey from the CIRES‘ Education <strong>and</strong> Outreach program developed a one-page FAQ h<strong>and</strong>out on the Rio<br />
Gr<strong>and</strong>e Rift experiment. This FAQ was adopted by the Earthscope national office <strong>and</strong> is being widely distributed<br />
throughout the country. This FAQ has also been distributed at all of the CU Science Explorers workshops, to large<br />
geology classes at the University of Colorado, <strong>and</strong> to the public.<br />
CU graduate student Monica Guerra at Putney GPS station near<br />
Silverton, Colorado, May 2007. Putney station is run with<br />
assistance from the Center for Snow <strong>and</strong> Avalanche Studies.<br />
120
Complementary Research: Faculty Fellows Research<br />
CIRES Aerosol Studies Have Led to Important Applications to Problems in World Health<br />
Robert E. Sievers<br />
(with Steve Cape, Chad Braun, Jessica Burger, David McAdams, Jessica<br />
Best, Akiko Komura <strong>and</strong> Nicolette Wolters)<br />
Funding: Aktiv-Dry L.L.C.<br />
Studies of atmospheric aerosols by the Sievers group led to new methods of synthesizing<br />
aerosol microparticles. This methodology for processing was patented in 1996 <strong>and</strong> has been<br />
applied subsequently by several pharmaceutical companies <strong>and</strong> vaccine scientists. The<br />
process consists of stabilizing microparticles of vaccines <strong>and</strong> pharmaceuticals then drying<br />
<strong>and</strong> micronizing them.<br />
Accomplishments<br />
Aerosol scientists, physicians, immunologists, formulation experts, engineers, device designers, <strong>and</strong> others are<br />
working together to make a stable, inhalable vaccine to reduce deaths from measles (now ca. 1,000 per day).<br />
Because of its expertise in aerosol science, CIRES has been invited to play a leadership role in an international<br />
collaboration to develop an inhalable powder of live attenuated measles vaccine to be manufactured by the Serum<br />
Institute of India (SII). Development through Phase I human trials is being funded by a grant from Aktiv-Dry LLC<br />
as part of the Gr<strong>and</strong> Challenges in Global Health initiative. The inhalable vaccine is being developed specifically for<br />
the developing world, with due consideration given to thermal stability, cost, ease of needle-free administration, <strong>and</strong><br />
shipping volume <strong>and</strong> weight. Methods: Vaccine was supplied by SII (Pune, India). C<strong>and</strong>idate live <strong>and</strong> placebo<br />
formulations were dried from aqueous suspension to inhalable powder using the CIRES-patented process Carbon<br />
Dioxide Assisted Nebulization with a Bubble Dryer ® (CAN-BD). Powder characterization included live-vaccine<br />
virus activity, moisture content, powder particle aerodynamic diameter after dispersal. An inexpensive active drypowder<br />
inhaler is also under development; two patent applications have been filed by CIRES scientists, Bob Sievers,<br />
Steve Cape <strong>and</strong> Jessica Best. Results: Formulation with myo-inositol, gelatin, <strong>and</strong> L-arginine as the major<br />
constituents <strong>and</strong> CAN-BD drying yielded amorphous powders with 75%±16% retained activity (95% confidence<br />
interval), thermal stability that passed the WHO 7-day 37°C test, low moisture content of only 0.7 to 1.2%, <strong>and</strong> a<br />
mass-median aerodynamic diameter of 3 µm. Conclusions: The SII measles vaccine can be processed at 50°C into<br />
an inhalable dry powder with the<br />
CAN-BD process, with activity<br />
retention through processing<br />
similar to present commercial<br />
lyophilization, <strong>and</strong> short-term<br />
stability, meeting WHO<br />
requirements. If proven safe <strong>and</strong><br />
effective, <strong>and</strong> introduced<br />
successfully into developing<br />
countries, WHO expects the<br />
dem<strong>and</strong> for this inhaled aerosol<br />
vaccine to be 300,000,000 doses<br />
per year, <strong>and</strong> save many<br />
thous<strong>and</strong>s of lives.<br />
121<br />
Photo of new Dry Powder<br />
Inhaler (DPI) to deliver aerosols<br />
of vaccines to 1 to 5-year-old<br />
children.
Complementary Research: Faculty Fellows Research<br />
Greenl<strong>and</strong> Ice Sheet Moulins – The Link to Increased Ice Velocity<br />
Konrad Steffen<br />
With Russell Huff, Alberto Behar 1 , <strong>and</strong> graduate students<br />
Funding: NASA Cryospheric Sciences<br />
1 Collaboration: NASA Jet Propulsion Laboratory, Pasadena, CA<br />
Purpose <strong>and</strong> Objectives<br />
Underst<strong>and</strong>ing the flow of water through the body of a glacier or ice sheet is important because<br />
the spatial distribution of water <strong>and</strong> the rate of infiltration to the glacier bottom is one control<br />
on water storage <strong>and</strong> pressure, glacier sliding <strong>and</strong> surging. According to the prevailing<br />
hypothesis, this water flow takes place in a network of tubular conduits.<br />
The prevailing view of englacial water flow through tubular conduits is supported by observations of caves on the<br />
margins of glaciers <strong>and</strong> explorations into moulins (a vertical shaft in a glacier). Whether such features are unique to<br />
the margin <strong>and</strong> to moulins is unclear. We carried out two field expeditions along the margin of the Greenl<strong>and</strong> ice<br />
sheet in summer 2006 <strong>and</strong> 2007 to measure the volume of<br />
moulins using a rotating laser scanner <strong>and</strong> video equipment.<br />
Further, we lowered an instrument package into the ice sheet<br />
along a 500-m long string measuring environmental<br />
parameters with HD video recording.<br />
Moulin on the Greenl<strong>and</strong> ice sheet along the<br />
western slope of the Greenl<strong>and</strong> ice sheet. There are<br />
45 moulin in an 10 km x 10 km are in the lower<br />
ablation region of the ice sheet, <strong>and</strong> they each<br />
drain approximately 4.5 10 6 m 3 water during one<br />
melt season.<br />
Accomplishment<br />
The surface velocity of the Greenl<strong>and</strong> ice sheet varies<br />
significantly on both seasonal <strong>and</strong> shorter time-scales.<br />
Seasonal variations reflect the penetration of supraglacial<br />
water to the glacier bed through significant thicknesses of<br />
cold ice. There, velocity fluctuations were recorded with our<br />
GPS network (eight permanent Trimble stations) which has<br />
been operational in this region since 1995. Shorter-term<br />
events are associated with periods of rapidly increasing water<br />
inputs to the subglacial drainage system. Early-season shortterm<br />
events immediately follow the establishment of a<br />
drainage connection between glacier surface <strong>and</strong> glacier bed,<br />
<strong>and</strong> coincide with the onset of subglacial outflow at the<br />
terminus. A mid-season short-term event occurred as surface<br />
melting resumed following cold weather, <strong>and</strong> may have been<br />
facilitated by partial closure of subglacial channels during<br />
this cold period. There is a close association between the<br />
timing <strong>and</strong> spatial distribution of horizontal <strong>and</strong> vertical<br />
velocity anomalies, the temporal pattern of surface water<br />
input to the glacier, <strong>and</strong> the formation, seasonal evolution,<br />
<strong>and</strong> distribution of subglacial drainage pathways. These<br />
factors presumably control the occurrence of high-waterpressure<br />
events <strong>and</strong> water storage at the glacier bed. The<br />
observed coupling between surface water inputs <strong>and</strong> glacier<br />
velocity may allow predominantly cold polythermal glaciers<br />
to respond rapidly to climate-induced changes in surface<br />
melting.<br />
122
Laboratory Studies of Clouds <strong>and</strong> Aerosols<br />
Margaret A Tolbert<br />
Funding:<br />
Figure 2. Schematic of cavity ring<br />
down set up (top), with observed<br />
signals from an empty cell compared<br />
to a cell containing aerosols (middle),<br />
<strong>and</strong> the CRD equation to determine<br />
extinction (bottom).<br />
Complementary Research: Faculty Fellows Research<br />
Cirrus clouds, composed of water ice, cover up to 30% of the Earth‘s surface at any time<br />
<strong>and</strong> subvisible cirrus are almost always present in parts of the tropics. Depending on<br />
meteorological conditions, the appearance of cirrus clouds ranges from wide sheets 100 to<br />
1000 km in length from the outflow of cumulonimbus anvils, to wispy filaments from jet<br />
stream-induced wind shear, to a subvisible cloud layer near the tropical tropopause. A<br />
photograph of cirrus clouds is shown in Figure 1. Cirrus <strong>and</strong> subvisible cirrus clouds play an important role in the<br />
climate system as well as in controlling the amount of water getting into the stratosphere. The clouds are usually<br />
optically thin in the visible, allowing most, but not all, sunlight to reach the Earth‘s surface. In contrast, the outgoing<br />
infrared radiation is efficiently absorbed by cirrus ice particles. While the net effect of cirrus clouds on climate is<br />
usually a warming at the surface, the microphysical properties of the clouds dictate the overall climatic impact. The<br />
microphysical properties in turn depend on the nucleation mechanism of ice in the<br />
atmosphere. Laboratory studies in the Tolbert research group are examining<br />
heterogeneous ice nucleation on a wide range of possible atmospheric aerosols<br />
including organics, minerals, sulfates <strong>and</strong> combinations of these species.<br />
In addition to clouds, research in the Tolbert group is focused on atmospheric<br />
aerosols. Atmospheric particles are a complex mixture of inorganic <strong>and</strong> organic<br />
compounds. Upon exposure to increasing relative humidity (RH), the particles can<br />
grow through water uptake. This hygroscopic growth affects the optical properties<br />
of the particles. This in turns influences how the aerosols contribute to visibility<br />
0.1% CH4/N2 mixture is shown in Figure 3. Here it can be seen that large<br />
organic molecules are produced in the particles that form via photolysis.<br />
In addition to relevance for Titan, it has been suggested that a similar<br />
haze layer may have formed on the early Earth. Ongoing research in the<br />
Tolbert group is probing the chemistry, properties <strong>and</strong> implications for<br />
such a haze on Earth at a time when life was just emerging.<br />
degradation <strong>and</strong> climate change. The Tolbert group, in collaboration with<br />
NOAA, is using cavity ring down (CRD) spectroscopy to determine the<br />
dependence of optical changes due to hygroscopic growth as a function of<br />
chemical composition of the particles. Figure 2 shows a schematic<br />
diagram of the CRD system that is currently in use. The system measures<br />
aerosol extinction, , of particles based on the decay times, , of laser<br />
light within the cavity in the presence <strong>and</strong> absence of particles.<br />
Experiments are probing the aerosol extinction for a wide range of<br />
chemical compositions, focusing on the effects of organics <strong>and</strong> mixed<br />
organic/inorganic particles.<br />
The Tolbert research group is also examining aerosols on Saturn‘s moon,<br />
Titan. One of Titan‘s most captivating features is the thick organic haze<br />
layer surrounding the moon, believed to be formed from photochemistry<br />
high in the CH4/N2 atmosphere. We are performing laboratory studies<br />
using a deuterium lamp to initiate particle production in simulated Titan<br />
atmospheres from UV photolysis. Using a novel analysis technique, the<br />
Aerosol Mass Spectrometer, we study the chemical composition, size,<br />
<strong>and</strong> shape of the particles<br />
produced as a function of<br />
initial trace gas composition.<br />
An example of the aerosol<br />
mass spectrometer data we<br />
obtain from photolysis of a<br />
123<br />
Figure 1. Cirrus clouds over<br />
Boulder, photo by Mark Zondlo.<br />
Figure 3. Aerosol mass spectrum for<br />
particles formed in 0.1% CH4 in N..
Complementary Research: Faculty Fellows Research<br />
<strong>Modeling</strong> the Geomorphology <strong>and</strong> Archaeology of River Valleys<br />
Greg Tucker<br />
Funding: UK English Heritage, Netherl<strong>and</strong>s NWO, ARO, NSF<br />
Throughout human history, river valleys have provided access to water, transport, <strong>and</strong><br />
fertile fields. As a result, river valleys often contain valuable archaeological records, as well<br />
as records of past environments. However, interpreting the alluvial ―tape recorder‖ can be<br />
quite challenging. The dynamic nature of river systems <strong>and</strong> their sensitivity to climatic<br />
change often combine to produce complex, three-dimensional patterns in the stratigraphy<br />
beneath valley systems. To interpret these patterns correctly requires a quantitative<br />
underst<strong>and</strong>ing of the geomorphic processes that shape riverine environments. To address<br />
this challenge, our research team – led by postdoctoral associate Quintijn Clevis (now at Royal Dutch Shell)<br />
together with colleagues in the U.S. <strong>and</strong> Britain – set out to create a process-based, quasi-three-dimensional model<br />
that simulates the dynamic evolution of a river <strong>and</strong> its deposits. We have used this model to develop insight into how<br />
Holocene climate variations are scribed in alluvial river deposits, <strong>and</strong> how knowledge of geomorphic history can aid<br />
in mapping <strong>and</strong> recovering archaeological remains.<br />
Accomplishments<br />
A variety of processes contribute to shaping a me<strong>and</strong>ering river valley <strong>and</strong> its deposits. Episodic floods can deposit<br />
fine sediment across a floodplain. Under the right conditions, these deposits can grow quite thick, burying the<br />
remains of campsites, settlements, <strong>and</strong> other archaeological materials. On the other h<strong>and</strong>, as the channel me<strong>and</strong>ers<br />
back <strong>and</strong> forth across its valley, bank erosion can recycle substantial volumes of sediment, <strong>and</strong> in so doing destroy<br />
or disrupt buried archaeology. Meanwhile, the growth of point bars adds new sediment to the floodplain. In addition<br />
to the constant deposition <strong>and</strong> recycling of sediment as a river sweeps horizontally across a valley, the channel may<br />
also experience episodes of rapid aggradation or incision due to climatic, tectonic, or anthropogenic forcing. In order<br />
to capture the essence of these processes in a simulation model, the CHILD l<strong>and</strong>scape evolution model was<br />
augmented with several novel capabilities: a dynamic re-meshing<br />
system that tracks the passage of a me<strong>and</strong>ering channel as it<br />
winds its way across a floodplain, a stratigraphy module to<br />
compute <strong>and</strong> store deposits <strong>and</strong> their properties, <strong>and</strong> a very<br />
simple archaeological model that allows one to experiment with<br />
different hypotheses about human settlement behavior in a<br />
floodplain environment. Using this modeling system, one can<br />
explore alternative scenarios for floodplain evolution <strong>and</strong><br />
archaeological site formation on 10,000-year time scales. For<br />
example, the figure below shows cross-sections <strong>and</strong> a cut-away<br />
view of floodplain deposits formed under a sequence of climatedriven<br />
cut-fill cycles, based on reconstructed Holocene elevation<br />
trends for Pomme de Terre River in Missouri. One of the findings<br />
to come out of this work is that both the visibility <strong>and</strong> degree of<br />
preservation of valley archaeology depend strongly <strong>and</strong><br />
systematically on Holocene geomorphic history. Terraces<br />
generated during periods of alternating incision <strong>and</strong> stability<br />
provide good archaeological visibility but limited preservation,<br />
particularly in narrow valleys. Conversely, steady aggradation<br />
leads to excellent visibility but poor preservation. An intriguing<br />
application of this model lies in testing alternative sampling<br />
schemes for geochronology <strong>and</strong> archaeological recovery.<br />
(Above) Cut-away view showing a simulated floodplain surface (channel in blue, floodplain in green) with buried<br />
archaeological sites (red-blue colors, with red indicating high artifact density) <strong>and</strong> channel deposits (orange).<br />
(Middle)Transverse valley cross sections colored according to sediment age (blue=oldest, red=youngest). (Bottom)<br />
Valley cross-sections colored according to the percentage of channel s<strong>and</strong> (left) <strong>and</strong> the density of archaeological<br />
remains (right).<br />
124
Complementary Research: Faculty Fellows Research<br />
Photoprocessing of Organic Acids in the Earth's Atmosphere<br />
Veronica Vaida<br />
Funding: NSF<br />
The Vaida group studies sunlight initiated chemistry of significance to climate. In the Earth‘s<br />
atmosphere, rapid oxidation of biogenic <strong>and</strong> anthropogenic emissions produces organic<br />
(acids, alcohols) <strong>and</strong> inorganic (HNO3, H2SO4) hydrophilic compounds which are key<br />
ingredients in aerosol formation <strong>and</strong> subsequent cloud nucleation which significantly<br />
influence climate. Solar photons perform effective photo-reduction of atmospheric targets.<br />
The Vaida group studies sunlight-initiated chemical reactions proceeding in the ground<br />
electronic state by excitation of a vibrational overtone state by visible red light in aqueous<br />
environments. This chemistry affects aerosol processing <strong>and</strong> nucleation.<br />
Aerosols are globally distributed suspensions of small particles in air <strong>and</strong> known to influence climate through<br />
reflection of solar radiation <strong>and</strong> nucleating clouds. Organics partition to the water-air interface <strong>and</strong> have a profound<br />
effect on climate <strong>and</strong> chemistry in the atmosphere. Organics emitted from sources such as biomass burning create a<br />
coating on the sea surface <strong>and</strong> on aerosols.<br />
Accomplishments<br />
The stability, partitioning, oxidative processing, <strong>and</strong> permeability of these organic films have been investigated in<br />
the Vaida lab. The results of these studies are used to explain recent field results, which show that the surfaces of<br />
collected aerosols are dominated by long-chain fatty acids.<br />
125
Time-Variable Gravity from GRACE<br />
Complementary Research: Faculty Fellows Research<br />
John Wahr, Isabella Velicogna, Sean Swenson, <strong>and</strong> Bryan Killett<br />
Funding: NASA, JPL, NSF<br />
NASA, in partnership with the German Space Agency DLR, launched the twin GRACE<br />
(Gravity Recovery <strong>and</strong> Climate Experiment) satellites in March 2002. This ~10-year<br />
GRACE mission is mapping the Earth‘s gravity field to spectacular accuracy every month.<br />
Time-variations in gravity can be found by removing the temporal mean field from these<br />
monthly maps. Since it is mass that causes gravity, this time-variability can be used to<br />
estimate month-to-month changes in the Earth‘s mass distribution. GRACE can recover<br />
signals at scales of about 300 km <strong>and</strong> larger.<br />
Accomplishments<br />
We have been using these data to look at a number of geophysical signals, particularly those that involve the storage<br />
of water (including snow <strong>and</strong> ice) on continents <strong>and</strong> in the polar ice sheets.<br />
For example, because of its large effective footprint <strong>and</strong> its<br />
sensitivity to mass, GRACE offers the best available method for<br />
measuring the total mass balance of the polar ice sheets. The<br />
figure at left shows monthly GRACE results for the mass<br />
variability of Greenl<strong>and</strong> <strong>and</strong> the West Antarctic Ice Sheet,<br />
between April 2002 <strong>and</strong> December 2006. The best fitting trends,<br />
shown as the dashed lines, are -233±40 km 3 /yr of ice for<br />
Greenl<strong>and</strong> <strong>and</strong> -99±20 km 3 /yr of ice for West Antarctica. The<br />
Greenl<strong>and</strong> mass loss appears to have accelerated sharply starting<br />
in spring, 2004.<br />
For other l<strong>and</strong> areas, the GRACE mass results provide the sum of<br />
water on the surface, in the soil, <strong>and</strong> beneath the soil layers, <strong>and</strong><br />
so can be used to assess l<strong>and</strong> surface water storage models. Before GRACE, there was no practical way of<br />
measuring total water storage at regional- to global-scales. The figure below shows monthly water storage variations<br />
for the Mississippi <strong>and</strong> Colorado River basins, <strong>and</strong> compares the results with output from the GLDAS/Noah l<strong>and</strong><br />
surface model [Rodell et al., 2004]. The error bars on the GRACE results represent 68.3% confidence limits. Note<br />
that the errors are larger for the Colorado, reflecting the fact that the Colorado basin is smaller than the Mississippi<br />
basin. The agreement between GRACE <strong>and</strong> GLDAS/Noah is excellent for the Mississippi, showing that the<br />
GLDAS/Noah model does a superb job of predicting water storage variations there. For the Colorado, the seasonal<br />
phases are in good agreement, but the model tends to under-predict the amplitudes.<br />
126
Complementary Research: Faculty Fellows Research<br />
Ecological Resilience: Disturbance Interactions <strong>and</strong> Regeneration in a Subalpine Forest<br />
Carol Wessman with Kendra Morliengo-Bredlau<br />
Funding: CU, EEB, CIRES, John Marr Memorial Ecology Fund<br />
Non-equilibrium ecology suggests that the structure, composition, <strong>and</strong> dynamics of<br />
ecosystems are contingent on disturbance <strong>and</strong> management legacies. However, field<br />
observations do not yet provide compelling evidence for relationships described by some of<br />
the core concepts in non-equilibrium theory, such as the historical contingency of<br />
successional pathways.<br />
This study focuses on mechanisms known to be important drivers of forest regeneration at<br />
l<strong>and</strong>scape (e.g., recent disturbance history, fire severity, disturbance pattern) <strong>and</strong> local (e.g.,<br />
biotic competition, microenvironment) scales. Our study site in Colorado‘s Routt National Forest recently experienced<br />
a series of catastrophic disturbances: a large blowdown in 1997, salvage-logging in 1999-2000, <strong>and</strong> a large fire in 2002<br />
(figure below). We are examining subalpine forest regeneration, using a combination of field observations, remote<br />
sensing, <strong>and</strong> geospatial analysis to determine whether compound disturbances increase l<strong>and</strong>scape heterogeneity by<br />
creating conditions that vary widely in their ability to support <strong>and</strong> maintain conifer regeneration.<br />
Accomplishments<br />
While the initial effects of the 2002 fire tended to ―erase‖ the<br />
impact of previous disturbances on soil properties <strong>and</strong><br />
nitrogen cycling, vegetation surveys four years after the fire<br />
suggest that pre-fire disturbances have a pronounced<br />
influence on understory establishment <strong>and</strong> conifer<br />
regeneration rates. Areas with multiple disturbances show<br />
significantly wider extremes between minimum <strong>and</strong><br />
maximum diurnal surface soil temperatures throughout the<br />
growing season. Continued research will follow regeneration<br />
trends <strong>and</strong> soil biogeochemistry to further establish if postfire<br />
ecosystem dynamics are qualitatively or quantitatively<br />
different because of pre-fire disturbance histories.<br />
Burned (Mean ± SE)<br />
Veg Cover (%) 2006 52.2 ± 3.3<br />
a<br />
Intact Blowdown Salvage<br />
Logged<br />
20.5 ± 2.3 c 39.5 ± 2.8 b<br />
Veg Cover (%) 2003 3.6 ± 0.75 a 0.0 ± 0.0 b 0.0 ± 0.0 b<br />
Seedling density 2006<br />
(trees / 10 m 2 )<br />
Seedling density 2003<br />
(trees / 10 m 2 )<br />
Unburned (Mean ± SE)<br />
0.85 ±<br />
0.46 a<br />
56.9 ±<br />
37.65 a<br />
0.03 ± 0.03 b<br />
0.0 ± 0.00 b<br />
0.03 ± 0.01 b<br />
127<br />
0.0 ± 0.00 b<br />
Vegetation Cover (%) 46 ± 3.6 b 70 ± 6.1 a 22 ± 4.3 c<br />
Seedling density<br />
(trees/ 10 m 2 )<br />
7.9 ± 3.6 c<br />
3.7 ± 1.5 c<br />
2.9 ± 1.6 c<br />
(Above) Surface soil temperature (4 cm<br />
depth) vs. Lost Dog Snotel data indicates<br />
that multiply disturbed areas may retain<br />
snow longer in the spring, but experience<br />
larger temperature swings once snow<br />
free.<br />
(Left) Four years following the Hinman<br />
fire, vegetation cover varied significantly<br />
among areas with different disturbance<br />
histories. Seedling establishment was<br />
significantly lower in multiply-disturbed<br />
areas. In comparison, prior to the burn<br />
(data from 2001), vegetation cover in<br />
blowdown areas was significantly higher<br />
than in salvage-logged areas, but was not<br />
significantly greater than the cover in<br />
control areas.
Complementary Research: Faculty Fellows Research<br />
128
Complementary Research: Education <strong>and</strong> Outreach<br />
Education <strong>and</strong> Outreach Program<br />
Description<br />
The CIRES‘ Education <strong>and</strong> Outreach group extends the expertise of CIRES to serve the needs of our education<br />
partners. Our work emphasizes scientific inquiry, links with current research, <strong>and</strong> underst<strong>and</strong>ing of foundational<br />
concepts in geoscience.<br />
Selected Accomplishments<br />
The Extreme Ultraviolet Variability Experiment (EVE) <strong>and</strong> the Math, Engineering <strong>and</strong> Science Achievement<br />
(MESA) Program: ―What do I need to do to be a scientist like you?‖ This question was asked of CIRES-NOAA<br />
scientist Dr. Eduardo Araujo-Pradere during an innovative new course for Spanish-speaking high school students<br />
developed for MESA by CIRES‘ EO. The MESA program prepares students to pursue undergraduate degrees in<br />
science <strong>and</strong> other math-based disciplines, with a focus on students from groups under-represented in those fields.<br />
Teacher Maria Murillo of Skyline H.S. introduced concepts in space weather, solar<br />
science, physics, mathematics, <strong>and</strong> computer technology. As part of their course-work,<br />
students built equipment to monitor disturbances in the ionosphere due to solar events,<br />
shared their data through the Stanford SOLAR project, participated in field trips <strong>and</strong><br />
gave final presentations in English. The course will continue to be offered as an elective<br />
course at Skyline H.S. <strong>and</strong> is now being piloted in an after-school context. The course<br />
was funded through NASA as part of the LASP EVE satellite instrument project,<br />
scheduled to launch on the Solar Dynamics Observatory (SDO) mission in 2008.<br />
An EVE-MESA student with the antenna used<br />
to monitor sudden ionospheric disturbances.<br />
Earthworks: Earth System Science for Secondary Science Teachers: The tenth annual CIRES Earthworks workshop<br />
for secondary science teachers served twenty-six educators from fifteen states. Earthworks 2007 participants<br />
designed <strong>and</strong> conducted field-based studies in limnology, hydrology, ecology, soil<br />
science, geology <strong>and</strong> solar science. In 2007, Ms. Barney Peterson, a long-time<br />
participant of the Earthworks workshop, was named the Washington State winner of<br />
the Presidential Award for Excellence in Mathematics <strong>and</strong> Science Teaching. This<br />
award is the nation‘s highest honor given to educators in the fields of mathematics <strong>and</strong><br />
science. Ms. Peterson writes, ―Prior to my participation in Earthworks, my focus for<br />
student investigations was pretty much life science. Exposure to earth system science<br />
through Earthworks has encouraged <strong>and</strong> enabled me to develop a more rounded<br />
program. Students spend more time inquiring into the health of local wetl<strong>and</strong>s from<br />
the bottom up <strong>and</strong> the top down (bedrock to topsoil <strong>and</strong> clouds to puddles)…By<br />
looking into the whole system, students (<strong>and</strong> parents, <strong>and</strong> teacher) get a better<br />
underst<strong>and</strong>ing of how it all works together.‖ For more information about the<br />
Earthworks workshop series, see http://cires.colorado.edu/education/k12/earthworks<br />
The Earthworks 2007 hydrology team demonstrates their study protocols.<br />
Northeast Front Range Math <strong>and</strong> Science Partnership: Teachers from five local school districts attended an institute<br />
on Earth <strong>and</strong> space science led by outreach scientist S<strong>and</strong>ra Laursen. The 21 teachers engaged in inquiry-based<br />
activities, lab work, field trips, <strong>and</strong> discussions during the intensive two-week session. During four summer <strong>and</strong> fall<br />
follow-up sessions, teachers completed additional field <strong>and</strong> class work <strong>and</strong><br />
conducted ―lesson study‖ projects on their own classroom practice <strong>and</strong> student<br />
learning. The institute is offered by a Math/Science Partnership funded by the<br />
Colorado Department of Education. Project results have been disseminated at the<br />
Colorado Science Convention <strong>and</strong> included in a national study of 25 exemplary<br />
teacher professional development programs by the Council of Chief State School<br />
Science Officers.<br />
Teacher Dave Title (Niwot HS) generates surface currents in a shoebox-sized<br />
ocean model.<br />
129
Complementary Research: Education <strong>and</strong> Outreach<br />
National Ocean Sciences Bowl (NOSB): The 2007 NOSB ―Mountain Mariner‖ regional competition was a great<br />
success. Team B from Poudre High School won the competition but the team was unable to attend the National<br />
finals. Therefore, runner-up Smoky Hill High School represented the Mountain Mariners in the National<br />
competition <strong>and</strong> placed fifth. The CIRES-based regional competition has historically been the most l<strong>and</strong>-locked <strong>and</strong><br />
one of the largest of the twenty-five regional competition sites. We draw students <strong>and</strong> families to the CU campus<br />
from all over Colorado <strong>and</strong> from the surrounding states. Scientists <strong>and</strong> staff from CIRES <strong>and</strong> NOAA volunteer to<br />
make the event enjoyable <strong>and</strong> challenging for some of the most accomplished students in the region. For more on<br />
the Mountain Mariner NOSB competition, see http://cires.colorado.edu/education/k12/nosb/about.html.<br />
Resources for Scientists in Partnerships with Education (ReSciPE): ReSciPE is an NSF-funded project designed to<br />
assist scientists who are engaged with K-12 education. The project includes professional development workshops for<br />
scientists about how to work effectively within K-12 education, makes digital resources available, provides<br />
consultation help <strong>and</strong> includes a research study to identify how best to support scientists in these endeavors. While<br />
workshops continued to be offered, including a CIRES‘ workshop attended by CIRES, NOAA, <strong>and</strong> NSIDC<br />
scientists among others, this year‘s efforts focused on completing the evaluation <strong>and</strong> research study. First findings<br />
from this study were presented in two talks at AGU in December 2006 <strong>and</strong> are being prepared for publication in the<br />
Journal of Geoscience Education. To learn more see<br />
http://cires.colorado.edu/education/k12/rescipe/<br />
Ice Fest: Celebrating the Launch of the International Polar Year: In May 2007, CIRES hosted a series of events<br />
called Ice Fest to celebrate the launch of the International Polar Year. Ice Fest included a wide variety of activities<br />
on the themes of ice <strong>and</strong> snow, polar research <strong>and</strong> climate studies, including science <strong>and</strong> art talks, films,<br />
presentations <strong>and</strong> family activities. Highlights included presentations by National Geographic photographer James<br />
Balog <strong>and</strong> Antarctic photographer Rosemarie Keough of their spectacular images of polar regions, a keynote talk by<br />
Astronaut Don Pettit comparing <strong>and</strong> contrasting experiences on the International Space Station <strong>and</strong> in Antarctica,<br />
<strong>and</strong> a talk by Boulder filmmaker Michael Brown. Other events included a live video conference with the NOAA<br />
Barrow Station, numerous presentations by world renowned polar experts, a presentation on the climate crisis by 14year-old<br />
climate activist Alex Budd, <strong>and</strong> a panel discussion by climate <strong>and</strong> energy experts. For a more complete<br />
description, see http://cires.colorado.edu/events/icefest/.<br />
Welcome to IceFest by CU Chancellor Bud Peterson <strong>and</strong> David Skaggs.<br />
Impact<br />
The work we do extends the expertise of the institute into the community to meet real needs. We help scientists<br />
increase their professional contributions through the development of science-literate citizens <strong>and</strong> students. Through<br />
these contributions, scientists reap the benefits of increased skills, enjoyment, <strong>and</strong> satisfaction in their profession.<br />
For more information on these or other Outreach activities, see http://cires.colorado.edu/~k12.<br />
130
Center for the Study of Earth from Space<br />
Complementary Research: CIRES <strong>Scientific</strong> Centers<br />
CIRES’ <strong>Scientific</strong> Centers<br />
CSES was founded in 1985 to provide a focus for the development <strong>and</strong> application of modern remote sensing<br />
techniques used in the research of all aspects of earth sciences at the University of Colorado. Although<br />
measurements from space are emphasized, aircraft <strong>and</strong> field measurements are integral to any remote sensing<br />
project.<br />
Within CSES, the aim is to work on all scales of problems extending from technique development in small test sites<br />
to underst<strong>and</strong>ing pattern <strong>and</strong> process on a regional <strong>and</strong> global scale. Data from the available electromagnetic<br />
spectrum, extending from the UV to the microwave region, are used. CSES facilities were developed with generous<br />
support from the W.M. Keck Foundation <strong>and</strong> matching funds from the University. The laboratories are dedicated to<br />
both research <strong>and</strong> teaching. CSES has four faculty associates <strong>and</strong> they support about 12 graduate students from<br />
Geography, Geology, Atmospheric <strong>and</strong> Ocean Sciences, Environmental Biology, <strong>and</strong> Engineering<br />
Remote Sensing Research<br />
The primary areas of study at CSES include Arctic climatology, ecology, geology, hyperspectral imaging,<br />
hydrology, paleoclimate, <strong>and</strong> remote sensing. A long-term goal of CSES research is to investigate problems in<br />
global geoscience, in particular questions of global change, through use of satellite observations. At present, the<br />
emphasis is on underst<strong>and</strong>ing the l<strong>and</strong> <strong>and</strong> l<strong>and</strong>-atmosphere interactions <strong>and</strong> the cryosphere. Some of the topics<br />
include biochemical cycles involving vegetation, soils, hydrology <strong>and</strong> water budgets, <strong>and</strong> human-induced change.<br />
Predictive models are being developed that incorporate inputs derived from satellite remote sensing data, <strong>and</strong> make<br />
it feasible to address global-scale questions.<br />
Greenl<strong>and</strong> melt extent derived from passive microwave satellite date for 2005,<br />
which was the largest melt year for the ice sheet during the 1979 – 2005 time period.<br />
The minimum melt extent is shown in pink color (1991).<br />
131
Complementary Research: CIRES <strong>Scientific</strong> Centers<br />
Accomplishments<br />
Ecology<br />
Work during the past year on carbon sequestration in Southwestern rangel<strong>and</strong>s demonstrates that dryl<strong>and</strong> regions are<br />
changing mosaics of woody plant classes whose trends through time are logistically difficult to track with traditional<br />
ground-based techniques. Fieldwork linked to remote sensing imagery offers the capability to monitor <strong>and</strong> track<br />
changes in aboveground carbon pools over large dryl<strong>and</strong> regions <strong>and</strong> at frequent intervals.<br />
Polar Climate<br />
Evidence of a temperature regulation mechanism at high latitudes related to sea-surface temperatures was found,<br />
which might explain the lower rate of observed Arctic warming than predicted by climate models. Researchers also<br />
found a strong feedback from biosphere albedo in a simple model of the Earth‘s climate system. Finally, observed<br />
trends in reanalysis products were compared with previous claims of tropospheric warming causing some of the rise<br />
in tropopause height in the same data <strong>and</strong> showed that no warming existed in the data.<br />
Climate <strong>Modeling</strong><br />
Researchers published a simple, nonlinear climate model study called a Dynamical Area Fraction Model (DAFM),<br />
which laid the basic theoretical framework for developing simple nonlinear coupled-dynamic models. Two<br />
subsequent experiments with this revised model suggested the domination of negative feedback from the hydrologic<br />
cycle on the climate regulation: the active hydrological cycle greatly reduced the global climate temperature, despite<br />
powerful positive hydrological feedbacks like the ice-albedo <strong>and</strong> hydrological greenhouse feedbacks. These results<br />
contrast with anthropogenic explanations of climate change that rely heavily on assumptions of positive feedbacks<br />
from the hydrological cycle.<br />
Education <strong>and</strong> Student Opportunities<br />
Remote sensing is not a discipline in itself, but rather a major, evolving tool applicable to studies of the Earth<br />
involving the atmosphere, biosphere, hydrosphere, cryosphere, <strong>and</strong> the solid earth. CSES acts as a focus for<br />
research, campus-wide, in the use of remote sensing for global geosciences studies. So far, master‘s <strong>and</strong> Ph.D.<br />
c<strong>and</strong>idates from the departments of Anthropology, Geography, Geological Sciences, Electrical Engineering,<br />
Ecology <strong>and</strong> Evolutionary Biology <strong>and</strong> the Interdepartmental Geophysics Program have carried out thesis research<br />
in CSES.<br />
CSES Facilities<br />
The CSES facilities include approximately 8000 square feet of lab <strong>and</strong> office space, which was completely<br />
refurbished in 1994 with support from the W. M. Keck Foundation of Los Angeles, CA. CSES occupies the second<br />
floor, South <strong>and</strong> West wings of the Ekeley Science building in the heart of the University campus. CSES also<br />
contains a 24-seat classroom for teaching, including 10 Windows workstations.<br />
Future of CSES<br />
Professor Alex<strong>and</strong>er F.H. Goetz, director of CSES retired in 2006. CIRES completed a faculty search for a new<br />
director. Negotiations for the new director are almost complete, <strong>and</strong> it is envisioned that this faculty line <strong>and</strong> the<br />
director of CSES position will be filled in summer 2008.<br />
132
Complementary Research: CIRES <strong>Scientific</strong> Centers<br />
Center for Science <strong>and</strong> Technology Policy Research<br />
Description<br />
Since 2001, the Center for Science <strong>and</strong> Technology Policy Research has contributed to both the CIRES goal of<br />
―promoting science in service to society‖ <strong>and</strong> to the University‘s vision of establishing research <strong>and</strong> outreach across<br />
traditional academic boundaries. The vision of the Center is to serve as a resource for science <strong>and</strong> technology<br />
decision makers <strong>and</strong> those providing the education of future decision makers. Its mission is to improve how science<br />
<strong>and</strong> technology policies address societal needs, including research, education <strong>and</strong> service. The Center fulfills these<br />
objectives through activities within the following four ―Strategic Intents‖:<br />
Help guide the University in educating the next generation of science <strong>and</strong> technology policy decision<br />
makers.<br />
Help make the nation‘s science portfolios more responsive to societal needs. Example areas include climate<br />
<strong>and</strong> global change, disasters, nanotechnology, biotechnology, <strong>and</strong> renewable/sustainable energy.<br />
Provide various means for people with differing perspectives to discuss research <strong>and</strong> practice related to<br />
science in its broader societal context.<br />
Build a sustainable, diverse <strong>and</strong> productive institution at the University.<br />
Accomplishments FY 07<br />
The Graduate Certificate in Science <strong>and</strong> Technology Policy, a rigorous<br />
educational program to prepare students pursuing graduate degrees for careers at<br />
the interface of science, technology, <strong>and</strong> decision making, is completing its third<br />
year. Fifteen students are currently enrolled in the certificate program. They<br />
come from a variety of University departments <strong>and</strong> institutes including<br />
Atmospheric <strong>and</strong> Oceanic Science, Computer Science, Geography, Journalism,<br />
Environmental Studies, CIRES, JILA (a joint institute of the University <strong>and</strong> the<br />
National Institute of St<strong>and</strong>ards <strong>and</strong> Technology), <strong>and</strong> Engineering (Aerospace,<br />
Civil, Chemical, <strong>and</strong> Mechanical). Fourteen graduate students have already<br />
completed the program.<br />
The Center‘s five-year NSF-sponsored project, Science Policy Assessment <strong>and</strong><br />
Research on Climate (SPARC), recently published reports from the following<br />
four SPARC workshops:<br />
2006 Workshop on Climate Change <strong>and</strong> Disaster Losses:<br />
Underst<strong>and</strong>ing <strong>and</strong> Attributing Trends <strong>and</strong> Projections<br />
2006 Workshop on Multiple Stressors on Central Arizona Water<br />
Resources<br />
2005 Workshop on Climate Science Policy: Lessons from the RISAs<br />
2005 Decision Support <strong>and</strong> Carbon Cycle Science: Practical Strategies to Reconciling the Supply of <strong>and</strong><br />
Dem<strong>and</strong> for Carbon Cycle Science<br />
The workshop reports are available online at<br />
http://sciencepolicy.colorado.edu/admin/announcement_info.html?header=sparc&footer=sparc&event_id=1223.<br />
This year, SPARC researchers made 33 presentations, published 14 articles, <strong>and</strong> submitted an additional 10 articles.<br />
CIRES Visiting Fellow Lisa Dilling (with NCAR‘s Susi Moser) has a<br />
new edited volume from Cambridge University Press titled ―Creating a<br />
Climate For Change: Communicating Climate Change <strong>and</strong> Facilitating<br />
Social Change.‖<br />
Roger Pielke, Jr. has a new book out from Cambridge University Press<br />
titled ―The Honest Broker: Making Sense of Science in Policy <strong>and</strong><br />
Politics.‖<br />
Roger Pielke, Jr. was awarded the Eduard Brückner Prize for<br />
outst<strong>and</strong>ing achievement in interdisciplinary climate science. Center<br />
graduate student Shali Mohleji was one of seven students awarded the<br />
133
Complementary Research: CIRES <strong>Scientific</strong> Centers<br />
highly competitive CIRES Graduate Research Fellowship for the 2007-08 academic year.<br />
Products<br />
Center staff <strong>and</strong> students produced 22 peer-reviewed <strong>and</strong> non-peer-reviewed publications, <strong>and</strong> gave 41 presentations<br />
at academic conferences <strong>and</strong> other events. The Center also hosted 21 talks by affiliates <strong>and</strong> visitors. Other Center<br />
outreach efforts include a quarterly newsletter, a briefing that is sent to over 2,000 decision makers in Washington,<br />
DC <strong>and</strong> elsewhere, an extensive website, <strong>and</strong> a well-regarded science policy weblog that is ranked in the top .02% of<br />
all weblogs by Technorati, a well-recognized authority on weblogs.<br />
Impacts<br />
In January 2006, Center Director Roger Pielke, Jr., testified before the U.S. House of Representatives Government<br />
Reform Committee about ―Political Interference in the Work of Government Climate Change Scientists.‖ In May<br />
2006, he testified before the U.S. House of Representatives Committee on Science <strong>and</strong> Technology about the<br />
findings of the fourth assessment report of the IPCC, Working Group III. Center staff were quoted or referred to<br />
numerous times by media including Nature, Science, Christian Science Monitor, Le Monde, Chronicle of Higher<br />
Education, National Review, Philadelphia Inquirer, Associated Press, New York Times, LA Times, San Francisco<br />
Chronicle, <strong>Scientific</strong> American, Boston Globe, <strong>and</strong> numerous local <strong>and</strong> regional publications.<br />
During the summer of 2006, a Center graduate student interned for the second year with the Office of Management<br />
<strong>and</strong> Budget <strong>and</strong> another interned for the U.S. State Department in London. Center alumni are working as staff<br />
members for the U.S. House of Representatives Committee on Science in Washington, DC, for reinsurance<br />
companies, <strong>and</strong> as postdoctoral researchers.<br />
134
National Snow <strong>and</strong> Ice Data Center<br />
Complementary Research: CIRES <strong>Scientific</strong> Centers<br />
Description<br />
The National Snow <strong>and</strong> Ice Data Center (NSIDC) supports research into our world‘s frozen realms: the snow, ice,<br />
glacier, frozen ground, <strong>and</strong> climate interactions that make up Earth‘s cryosphere. <strong>Scientific</strong> data, whether taken in<br />
the field or relayed from satellites orbiting Earth, form the foundation for the scientific research that informs the<br />
world about our planet <strong>and</strong> our climate systems.<br />
NSIDC manages <strong>and</strong> distributes scientific data, creates tools for data access, supports data users, performs scientific<br />
research, <strong>and</strong> educates the public about the cryosphere. NSIDC has led the field of cryospheric data management<br />
since 1976.<br />
Accomplishments<br />
In 2006, we added 35 new data sets to our online data offerings. We also continued to manage <strong>and</strong> disseminate the<br />
more than 500 data sets we offer through the NSIDC web pages, responding to requests from more than 46,000<br />
users <strong>and</strong> providing them with 5 million data files containing 6.4 TB of data. In addition, we continued to develop<br />
our participation <strong>and</strong> interests in International Polar Year data management through the IPY Data <strong>and</strong> Information<br />
Service.<br />
Our researchers <strong>and</strong> service personnel delivered dozens of presentations to audiences around the world, <strong>and</strong> our<br />
scientists spread word of our research through CNN, National Public Radio, the New York Times, British<br />
Broadcasting Corporation, <strong>and</strong> dozens of other major media outlets. Our scientists also helped inform decision<br />
makers through appearances at Congressional briefings in Washington, DC.<br />
Research at NSIDC includes activities related to the cryosphere:<br />
Ice sheets <strong>and</strong> glaciers: Glacier <strong>and</strong> ice sheet mass balance is an important <strong>and</strong> potentially variable contributor<br />
to sea-level rise. NSIDC scientists developed a new map of Antarctica <strong>and</strong> have been documenting the rates of<br />
movements of glaciers in critical parts of the Antarctic <strong>and</strong> Greenl<strong>and</strong> ice sheets.<br />
Sea ice: Sea ice is important both as an input to global climate models, <strong>and</strong> as an indicator of climate change.<br />
The Sea Ice Index, developed by NSIDC to meet a need for tracking changes in the ice as they occur, has<br />
indicated declines in Arctic sea ice extent <strong>and</strong> area during recent years.<br />
Permafrost <strong>and</strong> frozen ground: Changes in the extent of permafrost <strong>and</strong> frozen ground are an indicator of<br />
climate change <strong>and</strong> have an impact on native communities, terrestrial ecology, <strong>and</strong> the infrastructure of northern<br />
l<strong>and</strong>s. The carbon tied up in permafrost <strong>and</strong> frozen ground could affect the global carbon balance. Scientists at<br />
NSIDC are integrating in situ data with numerical models to<br />
refine predictions of frozen ground extent.<br />
Snow cover <strong>and</strong> snow hydrology: Changes in the freshwater<br />
contribution to the northern seas are affecting the dynamics of<br />
ocean circulation. NSIDC‘s scientists are working with a<br />
variety of widely distributed data, in conjunction with<br />
synthesis <strong>and</strong> modeling approaches, to underst<strong>and</strong> Arctic<br />
hydrology issues.<br />
Climate change in the cryosphere: Scientists working with<br />
near real-time monitoring of snow, sea ice, <strong>and</strong> vegetation<br />
under the Study of Environmental Arctic Change program are<br />
making progress toward documenting that change by using<br />
approaches such as the Sea Ice Index noted above.<br />
The Arctic winter sea ice extent fell to a record low in March 2006,<br />
indicated by the solid off-white color. The pink line indicates the<br />
1979-2000 mean sea ice extent in winter.<br />
135
Complementary Research: CIRES <strong>Scientific</strong> Centers<br />
Impacts of changes on Arctic peoples: The impacts of changes on Arctic<br />
peoples are being recognized <strong>and</strong> incorporated into research projects. An<br />
NSIDC scientist has been living in a community in northeast Canada,<br />
documenting the observations of <strong>and</strong> impacts on the local people.<br />
The research activities <strong>and</strong> publications of NSIDC scientists are presented<br />
in the NSIDC Annual Report (http://nsidc.org/pubs/annual).<br />
Impacts<br />
Researchers using NSIDC data products are assessing <strong>and</strong> monitoring<br />
changes in the cryosphere that may have profound effects on society.<br />
In particular, NSIDC scientists continue to help explain the importance of<br />
studying sea ice, snow, permafrost, glaciers, ice shelves, <strong>and</strong> other frozen<br />
aspects of our world, both through lectures, interviews with journalists,<br />
educational presentations, <strong>and</strong> helping provide online content.<br />
Of note in 2006 was the impact of a new website, the Arctic Sea Ice News<br />
2006 blog. NSIDC scientists <strong>and</strong> staff developed the blog to provide<br />
journalists <strong>and</strong> the public with up-to-the-moment updates on Arctic sea ice through the melt season. The site<br />
received between 18,000 <strong>and</strong> 20,000 hits in a single day after ABC News Online linked to the site from an article<br />
featuring NSIDC scientist Mark Serreze <strong>and</strong> his work on the sea ice minimum. By comparison, the most popular<br />
content on the NSIDC website typically receives approximately 700 hits per day.<br />
Products<br />
NOAA at NSIDC <strong>and</strong> the World Data Center (WDC) for Glaciology, Boulder<br />
The NOAA project at NSIDC operates in cooperation with the NOAA National Geophysical Data Center <strong>and</strong><br />
Arctic Research Office to extend the NOAA National Data Center catalog of cryospheric data <strong>and</strong> information<br />
products, with an emphasis on in situ data, data rescue, <strong>and</strong> data sets from operational communities.<br />
The Distributed Active Archive Center (DAAC)<br />
The NSIDC DAAC provides access to NASA‘s Earth <strong>Observing</strong> System satellite data, ancillary in situ<br />
measurements, baseline data, model results, <strong>and</strong> algorithms relating to cryospheric <strong>and</strong> polar processes. The<br />
DAAC is an integral part of the multiagency-funded efforts at NSIDC to provide snow <strong>and</strong> ice data, information<br />
management services, <strong>and</strong> user support.<br />
The Arctic System Science (ARCSS) Data Coordination Center (ADCC)<br />
NSF has funded the ADCC at NSIDC to house data from Office of Polar Programs (OPP) Arctic System funded<br />
investigators, <strong>and</strong> to provide tools for investigators both submitting <strong>and</strong> looking for data.<br />
Antarctic Glaciological Data Center (AGDC)<br />
The NSF OPP funds AGDC to archive <strong>and</strong> distribute glaciological <strong>and</strong> cryospheric-system data obtained by the<br />
U.S. Antarctic Program. AGDC facilitates data exchange <strong>and</strong> preservation of both new <strong>and</strong> historic data sets.<br />
U.S. Antarctic Data Coordination Center (USADCC)<br />
NSF OPP funds USADCC to improve access to U.S. funded Antarctic scientific data by creating descriptions of<br />
these data <strong>and</strong> entering them into the Antarctic Master Directory, a node of the Global Change Master<br />
Directory. The Antarctic Master Directory is a web-based, searchable directory of thous<strong>and</strong>s of data<br />
descriptions submitted by scientists from over twenty countries.<br />
The Frozen Ground Data Center (FGDC)<br />
The FGDC is a collaborative effort between the World Data Center for Glaciology, Boulder <strong>and</strong> the<br />
International Arctic Research Center. FGDC works internationally to collect <strong>and</strong> distribute data gathered over<br />
many decades that are critical for environmental change detection <strong>and</strong> impact assessment.<br />
Global L<strong>and</strong> Ice Measurements from Space (GLIMS)<br />
GLIMS, a cooperative project with the U.S. Geological Survey, is designed to monitor the world‘s glaciers<br />
primarily using data from the ASTER instrument aboard the Terra spacecraft launched in 1999. More than<br />
56,000 glaciers are now entered in the GLIMS database.<br />
136<br />
Alaska’s Malaspina Glacier is so<br />
expansive it can only be seen in its<br />
entirety from space. The glacier<br />
outline from the GLIMS database is<br />
indicated in red <strong>and</strong> displayed in<br />
Google Earth.
Center for Limnology<br />
Complementary Research: CIRES <strong>Scientific</strong> Centers<br />
Accomplishments<br />
During 2006, the Center for Limnology continued its long-term commitment to the study of nitrogen<br />
biogeochemistry. Graduate student Mark Bradburn produced final results on an extensive study of nitrogen fixation<br />
in Aphanizomenon, a nuisance alga in the western U.S. His novel findings, which include a strong response to weak<br />
light for nitrogen fixation in Aphanizomenon as well as a striking ability to store reductant for use in the dark, show<br />
why Aphanizomenon is often dominant over other fixers <strong>and</strong> suggests how Aphanizomenon might be controlled.<br />
Research on nitrogen limitation in Colorado reservoirs<br />
led the Center to publish a new approach to a serious<br />
<strong>and</strong> persistent problem in the management of lake<br />
eutrophication (nutrient enrichment). Cherry Creek<br />
Reservoir was used as a case study. The Colorado<br />
legislature has allowed the Cherry Creek Basin<br />
Authority to charge entrance fees to the Cherry Creek<br />
Park to be used in controlling phosphorus for<br />
suppression of algal growth, which is sufficient at times<br />
to cause fish mortality <strong>and</strong> unpleasant scums. The<br />
Authority has invested millions of dollars in<br />
phosphorus control, but without any notable effect on<br />
algal populations. This sequence is common throughout<br />
the. It is based on a misunderst<strong>and</strong>ing of the science<br />
related to ecological stoichiometry of algae. In lakes<br />
that are polluted with nutrients, algae grow to very high<br />
Gr<strong>and</strong> Lake, Colorado.<br />
abundances, at which point inorganic nitrogen often is<br />
exhausted by algal dem<strong>and</strong>, whereas inorganic phosphorus<br />
persists. Under these conditions, the nitrogen-fixing cyanobacteria take over the algal populations because of<br />
their ability to convert N2 to ammonium; other kinds of algae cannot make this conversion. Lake managers are<br />
urged to control phosphorus in order to suppress algal growth, but do not realize that suppression of algal growth by<br />
control of phosphorus limitation cannot begin until sufficient phosphorus is removed from the system to induce<br />
phosphorus rather than nitrogen limitation. While the manager expects incremental progress, no progress is possible<br />
until photosynthesis limitation is induced. Managers <strong>and</strong> entities providing funding often are frustrated by this<br />
misunderst<strong>and</strong>ing. The Limnology Center has presented a new methodology, based on ecological stoichiometry that<br />
will allow managers to project the amount of phosphorus that must be removed before any beneficial results are<br />
expected. Managers must then determine in advance, before spending very large amounts of money, whether this<br />
amount of phosphorus can be removed or not.<br />
Also during 2006, graduate student James Anthony completed the<br />
data collection phases of his work on the release of phosphorus <strong>and</strong><br />
nitrogen from lake sediments. Sediments contain large stores of<br />
nitrogen <strong>and</strong> phosphorus, but the availability of this nitrogen <strong>and</strong><br />
phosphorus to algae during the growing season has not been<br />
quantified. Anthony created a turbulence generator (―turbulator‖) that<br />
is capable of controlling boundary-layer conditions for the sedimentwater<br />
interface over experimental cores on a replicate basis.<br />
Extensive work with this system has given some new insight into the<br />
regulation of exchange at the boundary layer. The most surprising<br />
result is that boundary-layer turbulence has no great effect on<br />
exchange within the range that can be expected for lake sediments<br />
beyond the breakwater. Also surprising <strong>and</strong> unexpected was a drastic<br />
increase in phosphorus <strong>and</strong> nitrogen release from sediments beyond a<br />
critical temperature that is near the maximum annual temperature.<br />
This finding makes an unexpected but potentially significant<br />
137<br />
Turbulator: A device for control of<br />
boundary-layer turbulence in cores.<br />
connection to climate change, in that an increase in mean lake temperature of as little as 2°C could quadruple the<br />
nutrient efflux from lake sediments, thus producing a change in the nutrient regime.
Complementary Research: CIRES <strong>Scientific</strong> Centers<br />
The Limnology Center during 2006 also was heavily involved in preparing portions of a new Encyclopedia of Inl<strong>and</strong><br />
Waters, which is intended to be a l<strong>and</strong>mark reference reflecting the combined expertise of international specialists<br />
on lakes, streams, <strong>and</strong> wetl<strong>and</strong>s. The Encyclopedia is due for release in 2008. Also during 2006, the Center for<br />
Limnology served as the administrative center for International Society for Limnology.<br />
During 2006, the Limnology Center continued its long-term biogeochemical investigations of the South Platte River,<br />
especially focusing on nitrogen <strong>and</strong> oxygen metabolism. A new twist for 2006 was the discovery of substantial<br />
amounts of nitrogen ebullition, not reported previously in rivers (probably because ebullition is generally assumed to<br />
be methane). Rates <strong>and</strong> mechanisms of ebullition were studied during 2006 <strong>and</strong> are being published during 2007.<br />
The discovery of ebullition will necessitate changes in the mass-balance analysis of nitrogen in rivers.<br />
138<br />
Evidence of a thermal response for<br />
nutrient release from lake sediments.
Climate Diagnostics Center<br />
Complementary Research: CIRES <strong>Scientific</strong> Centers<br />
Description<br />
The Climate Diagnostics Center (CDC) provides a research focus in CIRES for efforts to advance underst<strong>and</strong>ing <strong>and</strong><br />
predictions of the climate system <strong>and</strong> its component processes. CDC activities involve a coordinated program of<br />
observational, diagnostic <strong>and</strong> modeling studies aimed at significantly advancing underst<strong>and</strong>ing <strong>and</strong> predictions of<br />
climate variability. Research disciplines include, but are not limited to, atmospheric sciences, oceanography, remote<br />
sensing, numerical computational methods, computer sciences, data management, <strong>and</strong> complex systems analysis.<br />
The development of more skillful <strong>and</strong> useful climate predictions requires an integration of these disciplines so that<br />
advances in the underst<strong>and</strong>ing of processes governing climate variability can be applied to improve models <strong>and</strong><br />
methods used for climate predictions.<br />
Accomplishments<br />
In the 2006 calendar year, 36 peer-review publications were produced covering a broad range of climate-related<br />
topics. <strong>Scientific</strong> input was provided into numerous national <strong>and</strong> international programs including:<br />
1) Provided leadership in the international Global Climate <strong>Observing</strong> System Surface Pressure Working Group to<br />
promote the development of long-term high-quality analyses of atmospheric surface pressure.<br />
2) Started production of a 100-year global climate reanalysis based on ensemble data assimilation techniques that<br />
can produce high-quality products even with the sparse pre-radiosonde era observations. These efforts will<br />
extend our ability to quantify climate variability, provide uncertainty estimates for climate detection, <strong>and</strong> aid<br />
attribution efforts to inform policy decisions.<br />
3) Supported NOAA <strong>and</strong> RISAs in experimental climate services through research to improve the delivery of the<br />
regional climate data, products <strong>and</strong> services needed to enhance public <strong>and</strong> private sector decision making <strong>and</strong><br />
reduce climate-related risks.<br />
4) Implemented a seasonal forecast guidance tool for surface temperature <strong>and</strong> precipitation over North America,<br />
which is a blend of dynamical <strong>and</strong> empirical methods, derived from the dynamical climate simulation data from<br />
an ensemble of four atmospheric general circulation models forced by known, monthly sea surface temperature<br />
fluctuations between 1950-1999.<br />
5) Contributed to <strong>and</strong> serving on numerous WMO, national, AMS <strong>and</strong> AGU climate research panels <strong>and</strong> journal<br />
editorial boards, as well NASA, NSF, <strong>and</strong> DOE advisory <strong>and</strong> review panels.<br />
6) Developed new <strong>and</strong> improved existing climate prediction capabilities through enhanced underst<strong>and</strong>ing of<br />
dynamical processes <strong>and</strong> predictability of the principal interacting components of the climate system on time<br />
scales of weeks to millennia, using a combination of observational <strong>and</strong> modeling approaches.<br />
7) Led an international effort to improve monitoring of ENSO conditions through the development of a nextgeneration<br />
Multivariate ENSO Index.<br />
8) Developed empirical projections of future Colorado River flows from IPCC AR4 climate models for use in risk<br />
management assessments<br />
Impacts<br />
Water managers in the seven Colorado River Basin states cannot adequately plan for a future of increased climate<br />
variability <strong>and</strong> change unless they can anticipate how future climate will affect streamflows in the Colorado River.<br />
Statistical techniques were used to transform IPCC AR4 climate model projections into Colorado River flows at<br />
Lees Ferry 9 (Figure 1). Results indicate a significant risk for dramatic reductions in flows in the coming decades.<br />
139
Complementary Research: CIRES <strong>Scientific</strong> Centers<br />
Figure 1. The 1895-2050 Lees Ferry annual streamflow (left) derived from the AR4 simulations of PDSI (right)<br />
using a downscaling formula that relates observed Lees Ferry flow to observed PDSI during the 20th Century. The<br />
dark red curve denotes the 42-run average, <strong>and</strong> the cloud describes the 10%- 90% range of individual simulations.<br />
Products<br />
A unique capability was developed to produce high-quality daily reanalyses for the troposphere from surface<br />
pressure observations alone using a data assimilation system based on the ―Ensemble Filter‖ (Figure 2). The<br />
combination of recently improved surface observational records together with this data assimilation method provides<br />
an exciting new opportunity to extend the reanalyses back in time, perhaps providing for the first time a reanalysis<br />
data set of a century or longer.<br />
Figure 2. The 500 hPa height analysis of 27 December 1947 06GMT from the Ensemble Filter data assimilation<br />
system using only surface pressure observations (left) <strong>and</strong> from the experimental NCEP T254 analysis using all<br />
available surface <strong>and</strong> upper air observations (right). An Air Weather Service map drawn in near-real time is also<br />
shown (middle). Colored arrows illustrate the same features in all three maps.<br />
140
Complementary Research: Innovative Research Program<br />
Innovative Research Program<br />
Possibility of Abrupt Climate Change in the Next Few Decades<br />
Investigator: Prashant D. Sardeshmukh (CIRES/NOAA ESRL)<br />
Objective. We propose to perform several 100-year integrations of two global atmospheric general circulation<br />
models (GCMs) with prescribed ocean sea surface temperatures (SSTs) in the tropics <strong>and</strong> with coupling to a simple<br />
mixed-layer ocean model elsewhere. The prescribed tropical SST fields will incorporate a hypothesized continuation<br />
of the warming trend observed over the past 50 years, including the continued warming of the tropical Indian,<br />
western Pacific, <strong>and</strong> Atlantic oceans. For reasons explained below, we suspect that the global climate system is close<br />
to a ―tipping point‖ with regard to the continued warming of especially the Indian Ocean. We believe that our GCM<br />
experiments, conducted with two different GCMs to generate confidence in the results, will provide a clear<br />
assessment of the likelihood of this tipping point being crossed in the next several decades, with potentially dramatic<br />
consequences for the climates of North America, Asia, <strong>and</strong> the Arctic.<br />
Background. There is growing evidence that much of the global <strong>and</strong> regional climate changes over the next century<br />
associated with anthropogenic forcing will be mediated, or at least be strongly influenced, by tropical SST changes.<br />
The tropical oceans have already warmed substantially over the last 50 years (see figure below). Recently we<br />
demonstrated that this warming is outside the range of natural ENSO SST variability at almost all tropical locations.<br />
The warming of the Indian, western Pacific, <strong>and</strong> south Atlantic Oceans is especially significant in this regard. At<br />
present, it is not clear to what degree this warming is associated with anthropogenic forcing or with natural decadal<br />
<strong>and</strong> longer term variations of the climate system. The answer to this question has a large bearing on how this<br />
warming pattern will evolve over the next several decades <strong>and</strong> what its worldwide impacts will be. Most climate<br />
models involved in the IPCC Fourth Assessment of projected climate changes misrepresent important aspects of<br />
tropical climate dynamics, including ENSO, the long-term oceanic subsurface controls on ENSO, <strong>and</strong> the oceanic<br />
―dipole‖ dynamics of the Indian <strong>and</strong> Atlantic Oceans. These deficiencies greatly limit our confidence in their ability<br />
to predict the future evolution of the warming pattern. This is unfortunate because there is growing evidence that<br />
regional climate changes around the globe will be highly sensitive to the precise pattern of the tropical SST<br />
warming. This sensitivity arises mainly from the generally opposite global circulation responses to deep atmospheric<br />
convective heat sources over the west Pacific <strong>and</strong> Indian Oceans.<br />
Observed warming of the Tropical Sea Surface Temperatures 1951-2000.<br />
Importance. The opposite sensitivity of many aspects of the global climate to strong tropical Indian <strong>and</strong> west Pacific<br />
SST warming (strong enough that it leads to enhanced deep atmospheric convection in both basins) raises the<br />
possibility of a climatic ―tipping point.‖ The Indian Ocean warming has thus far not been strong enough to enhance<br />
the deep convection there, but if it continues, then at some point it will certainly trigger atmospheric deep<br />
convection <strong>and</strong> rapidly force an opposite global response to that already being forced by the west Pacific warming<br />
(which, among other effects, has been implicated in the extended four-year 1998-2002 drought over the<br />
Southwestern United States). This rapid change will be felt most dramatically in the Pacific-North American (PNA)<br />
sector, but also in the high Arctic latitudes. We believe this to be a serious possibility, <strong>and</strong> would like to assess it<br />
quantitatively in a realistic modeling environment.<br />
141
Complementary Research: Innovative Research Program<br />
Innovative. Given our current poor underst<strong>and</strong>ing of the precise causes of the warming trend shown in Figure 1, <strong>and</strong><br />
also the inadequacies of current fully coupled atmosphere-ocean climate models in predicting its future evolution,<br />
we will take a completely different approach to assess the likelihood <strong>and</strong> impact of ―awakening the sleeping Indian<br />
Ocean giant‖: We will force state-of-the-art global atmospheric GCMs with prescribed evolving sea surface<br />
temperatures, simply assuming that the pattern of the tropical SST warming observed over the past several decades<br />
will also continue for the next several decades. This assumption might seem unrealistic to some, but may in fact not<br />
be so, considering that the amplification of the warming in Figure 1 has been quite coherent over the past 50 years<br />
(not shown). There is also no better alternative at present.<br />
Interdisciplinary. The possibility of a ―tipping-point‖ being crossed by the triggering of enhanced atmospheric deep<br />
convection over the Indian Ocean has enormous implications not only for the climates of the nearby densely<br />
populated Asian continent but also through planetary Rossby wave dispersion, the climates of remote North<br />
America, the Arctic <strong>and</strong> even parts of Europe. Through its associated surface temperature <strong>and</strong> precipitation changes,<br />
it will influence drought <strong>and</strong> energy <strong>and</strong> water resources management in these areas, the future evolution of the<br />
Asian ―brown cloud‖ through more efficient precipitation scavenging, <strong>and</strong> perhaps even the melting of the<br />
Greenl<strong>and</strong> ice sheet.<br />
Research Plan. We will run two different state-of-the-art atmospheric GCMs, the NCAR/CAM3 <strong>and</strong> the<br />
NCEP/GFS model, with prescribed SSTs in the tropics <strong>and</strong> with coupling to a simple slab mixed-layer ocean model<br />
elsewhere. The prescribed tropical SST fields will be climatology plus the trend pattern of Figure 1, whose<br />
amplitude will be increased linearly at its past 50-yr rate over the next 100 years. We will also make control 100-yr<br />
runs with the tropical SST fields fixed at climatology. Both of the GCMs to be run are already available to us inhouse<br />
<strong>and</strong> we have extensive experience with their use. Computing needs will be met using the ESRL high<br />
performance computing <strong>and</strong> storage at the ESRL/GSD high performance computing facility.<br />
Expected Outcome <strong>and</strong> Impact. Our focus in the warming trend runs will be on the point in time at which the Indian<br />
Ocean warming triggers significantly enhanced local deep atmospheric convection <strong>and</strong> affects the global climate.<br />
We will document the differences between the simulated global climates before <strong>and</strong> after this triggering, <strong>and</strong> assess<br />
their implications for climate change mitigation <strong>and</strong> adaptation strategies around the globe.<br />
142
Complementary Research: Innovative Research Program<br />
Highly Resolved Wavelength Dependencies of Aerosol Optical Properties in the Shortwave<br />
Spectrum<br />
Investigators: Allison McComiskey (CIRES/NOAA ESRL), Thomas H. Painter (CIRES/NSIDC),<br />
Paul Ricchiazzi (ICESS/UCSB)<br />
Objective. The objective is to measure the wavelength dependence of aerosol optical properties at high spectral<br />
resolution across the solar spectrum. Quantification of these properties is necessary for modeling the impact of<br />
aerosols on climate. However, direct, high-spectral resolution measurements of these properties have never been<br />
made. These measurements require instrumentation that can determine the angular distribution of sky radiance at<br />
high angular resolution (1 Hz will facilitate a quantum step forward in the field of aerosol characterization.<br />
Innovative <strong>and</strong> Interdisciplinary. The use of this instrument is novel for atmospheric characterization <strong>and</strong> the novel<br />
configuration proposed here, to scan the atmosphere, is an outgrowth of our published experience using the ASD-FR<br />
to analyze the sky radiance data at a high-latitude site. Most instruments developed for observation of downwelling<br />
atmospheric radiation are limited in either their spectral or angular resolution. This will be the first such instrument<br />
designed for combined, very high spectral <strong>and</strong> angular resolution, which provides the leverage to simultaneously<br />
retrieve the pertinent aerosol properties at high accuracy throughout the shortwave spectrum. This project also<br />
143
Complementary Research: Innovative Research Program<br />
brings together researchers from different disciplines. The ASG was originally designed as a downlooking<br />
instrument for observations of surface reflectance properties. With the use of methods from the atmospheric<br />
sciences, the instrument can be applied to a very different <strong>and</strong> important problem in aerosol <strong>and</strong> climate science.<br />
Research Plan. Radiometric retrievals of atmospheric aerosol properties require observations under cloudless<br />
conditions. In most cases, aerosol characteristics remain constant throughout a given day, though rapid changes are<br />
also possible when dictated by variations in meteorology <strong>and</strong> source strength. In order to incorporate as much of this<br />
variability as possible in our measurements, deployments will be made on clear sky days as often as possible<br />
throughout the year. Full sky-radiance scan will consist of measurements obtained at approximately 100 scattering<br />
angles, either in the principal plane, or at constant zenith viewing angle. This large number of sky-radiance samples<br />
will allow for the identification <strong>and</strong> removal of views contaminated by sub-visual cirrus clouds <strong>and</strong> to correct for<br />
angular pointing errors.<br />
The robot will be programmed to produce up to 10 sky-radiance scans per hour, which is about an order of<br />
magnitude greater than the typical sample rate from AERONET. The availability of several scans per hour will help<br />
differentiate the effects of natural aerosol variation from noise introduced by scene conditions (e.g., sub-visual<br />
cirrus). St<strong>and</strong>ard data products available from the AERONET Cimel sunphotometers are produced from<br />
measurements with less angular resolution (Figure 1b). These observations will provide detailed information on<br />
aerosol properties at spectral <strong>and</strong> temporal scales that are not available with current instruments.<br />
The retrieval of aerosol properties is sensitive to situational variables, such as aerosol amount, the surface albedo,<br />
atmospheric pressure, <strong>and</strong> the presence of sub-visual cirrus cloud. In order to constrain these variables, we will make<br />
measurement near the Boulder Baseline Surface Radiation Network (BSRN) site. Continuous measurements at the<br />
site include solar downwelling global, direct, <strong>and</strong> diffuse radiation at the surface at the top of a 300-m tower as well<br />
as solar upwelling global radiation at the top of the tower at 1- to 3-minute resolution. Good estimates of aerosol<br />
optical depth will greatly reduce the need for precise absolute calibration of the ASD-FR. The BSRN direct <strong>and</strong><br />
diffuse radiation observations will also be used to test closure by comparing modeled <strong>and</strong> observed radiation with<br />
the aerosol properties retrieved from the ASG.<br />
Expected Outcome <strong>and</strong> Impact. These measurements will represent an unprecedented data set of spectrally resolved<br />
aerosol properties <strong>and</strong> a proven concept for dramatically more accurate <strong>and</strong> comprehensive measurements of these<br />
properties. This novel data set will include wavelength dependence of the asymmetry parameter <strong>and</strong> single<br />
scattering albedo across the entire shortwave spectrum for a variety of aerosol types. <strong>Modeling</strong> studies that attempt<br />
to calculate the radiative impacts of aerosol on climate have had to use a ―best guess‖ at the dependence. This<br />
information in itself will have a significant impact on the uncertainties associated with modeling the impact of<br />
aerosols on climate. Finally, we will be able to assess the requirements for developing a robust <strong>and</strong> autonomous<br />
instrument using the ASD <strong>and</strong> goniometer configuration for continuous operation in the field.<br />
Figure 1 (a, left) The Automated Spectro-Goniometer (ASG) deployed for measurements of directional reflectance<br />
of snow. (b, right) Cimel almucantar (diamonds) <strong>and</strong> principal plane (squares) observations of radiance at 676 nm<br />
obtained at the ARM program Southern Great Plain facility on 29 May 2003. These data were used as part of a<br />
study to test for closure between in-situ <strong>and</strong> remotely sensed aerosol retrievals [Ricchiazzi et al., 2006].<br />
144
Complementary Research: Innovative Research Program<br />
Is the Ground Drying up in South Platte?<br />
Investigators: Balaji Rajagopalan (CIRES, University of Colorado) <strong>and</strong> Harihar Rajaram<br />
(Department of Civil, Environmental <strong>and</strong> Architectural Engineering, University of Colorado)<br />
Background <strong>and</strong> Objective. The South Platte Basin is home to a population of about 3 million. Despite substantial<br />
urban <strong>and</strong> suburban growth, there are more than a million acres of irrigated l<strong>and</strong> in the basin. Water management in<br />
the South Platte Basin is complicated by the complex interactions between surface <strong>and</strong> groundwater, <strong>and</strong> the steep<br />
gradients in hydroclimatology between the mountainous regions, the Denver metropolitan area <strong>and</strong> Eastern<br />
Colorado. The sustained groundwater flow of about 515 acre ft/year (Figure 1) into the South Platte River helps to<br />
maintain in-stream flows for sustaining riparian ecosystems <strong>and</strong> water quality. However, continuous declines of<br />
groundwater levels in portions of the basin (Figure 2) have led to considerable difficulties in maintaining in-stream<br />
flows, requiring flow augmentation from reservoirs. During the severe drought that impacted the region in 2002,<br />
water managers faced substantial difficulties in providing water to agricultural users (from groundwater sources)<br />
while maintaining in-stream flows. This led to the recognition of a new objective in groundwater management – i.e.<br />
maintaining groundwater levels not just from a resource st<strong>and</strong>point, but also in the context of sustaining the riparian<br />
ecosystem. While this region is no stranger to dry periods, the recent dry spell coupled with increasing population,<br />
economic growth <strong>and</strong> l<strong>and</strong>-use change is placing significant stress on the groundwater resources. Despite the<br />
important role of groundwater in the basin, there are virtually no efforts to underst<strong>and</strong> long-term behavior of the<br />
groundwater system within the context of climate variations.<br />
Year-to-year variability of hydroclimate in the Western U.S. has been linked to large-scale climate features in the<br />
Pacific Ocean, in particular El Niño Southern Oscillation (ENSO) <strong>and</strong> Pacific Decadal Oscillation (PDO). Hoerling<br />
<strong>and</strong> Kumar [2003] use climate model simulations to present tantalizing evidence that the recent long dry spell could<br />
be a result of cooler than normal tropical Eastern Pacific <strong>and</strong> warmer than normal tropical Western Pacific (a La<br />
Niña pattern) <strong>and</strong> Indian Oceans. This long break from the El Niño-active period of 1980s <strong>and</strong> 1990s could be a<br />
strong factor for the dry spell. Which then raises the questions: Why now? Is climate change responsible in any<br />
way? Adding to these woes are recent indications [Regonda et al., 2005] that the annual cycle in precipitation is<br />
shifting early in the Western U.S., perhaps caused by global climate change. In particular, the spring warmth is<br />
tending to occur early with decreased winter snowpack. This implies reduced inflow into the rivers, as a majority of<br />
them is driven by snowmelt <strong>and</strong> groundwater recharge. Given the high stakes, the key questions are:<br />
1. What does the future hold, especially under global change <strong>and</strong> interannual variability?<br />
2. With climate fluctuations <strong>and</strong> change <strong>and</strong> l<strong>and</strong>-use changes, will S. Platte groundwater dry up?<br />
3. Even if declines in groundwater levels are not as drastic as implied by 2., will they decline to where the<br />
groundwater inflows that sustain in-stream flows are severely reduced?<br />
Insights into these research questions will have significant impacts on current water resources management <strong>and</strong> on<br />
the future socio-economic development of the Western U.S.<br />
Research Plan. Although there are several decision support systems such as the CDSS (Colorado Decision Support<br />
System) <strong>and</strong> SPMAP (South Platte Mapping <strong>and</strong> Analysis Program) that aid the State Engineer‘s office <strong>and</strong> Water<br />
Resources Agencies in managing the basin, few efforts have been made to incorporate long-term climate change<br />
scenarios into these systems. Our objective in this project is to evaluate the response of groundwater levels in the<br />
basin to long-term climate change. We plan to do the following:<br />
1. Compile<br />
i. the space <strong>and</strong> time data of groundwater levels from the basin. This will be obtained from the State<br />
water resources office.<br />
ii. long records of precipitation (P) <strong>and</strong> temperature (T) from the basin from http://www.ncdc.noaa.gov/<br />
iii. climate change scenarios for the basin from the recent IPCC (Inter-governmental Panel on Climate<br />
Change) projections from several climate models runs by different modeling groups around the<br />
world <strong>and</strong> available at (http://ipcc-ddc.cru.uea.ac.uk/asres/sres_climate/sres_home_climate.html)<br />
2. Develop <strong>and</strong> test a stochastic P <strong>and</strong> T generator for the basin.<br />
3. Test <strong>and</strong> refine a well-established groundwater flow model for the basin (e.g. from the State Engineer‘s<br />
office) to ensure that the representation of surface-groundwater interaction <strong>and</strong> coupling of groundwater to<br />
recharge are adequate for capturing future scenarios (e.g. where hydraulic disconnection between the<br />
aquifer <strong>and</strong> stream may occur).<br />
145
Complementary Research: Innovative Research Program<br />
4. Couple the hydroclimate scenarios with the refined basin-scale groundwater flow model to generate longterm<br />
predictions of groundwater response <strong>and</strong> its impacts on sustainable water resource availability <strong>and</strong> instream<br />
flows in the South Platte.<br />
5. Extend the overall modeling framework of 2, 3, <strong>and</strong> 4 to generate groundwater response scenarios to the<br />
combined influence of projected climate change <strong>and</strong> l<strong>and</strong> use changes. This will lead to improved<br />
underst<strong>and</strong>ing of effective strategies for optimal l<strong>and</strong> use planning under changing climate.<br />
Interdisciplinary. The proposed research, which focuses on groundwater <strong>and</strong> its interaction with surface water, will<br />
provide an excellent complement to surface water studies of the Western U.S. hydroclimatology under the Western<br />
Water Assessment (WWA) research program of CIRES/CDC/NOAA. We expect results from this effort to lead into<br />
a larger comprehensive proposal to funding agencies such as NSF, or DOE.<br />
Innovative. The proposal aims to underst<strong>and</strong> the robustness of groundwater levels in the South Platte basin under<br />
climate change, climate variability <strong>and</strong> l<strong>and</strong> use change scenarios. This will be achieved by coupling a hydroclimate<br />
generator to a basin-scale groundwater model. Furthermore, physical mechanisms governing the spatio-temporal<br />
variability of groundwater levels will be teased out from this framework. These two aspects of the proposal are<br />
unique <strong>and</strong> have never been attempted before. Another unique aspect of this work derives from the application of<br />
basin-scale three-dimensional groundwater flow models over decadal time scales – tremendous advances in<br />
computational technology over the last 2-3 years have made it feasible to run these models involving ~106-7<br />
computational nodes, over long durations on high-end desktop workstations. We will use a state-of-the-art 64-bit<br />
AMD workstation equipped with 16GB of RAM for this purpose.<br />
Figure 2 (right). Water table declines in the<br />
South Platte Alluvial Aquifer during 1945-<br />
1985. Source for Figures 1 <strong>and</strong> 2:<br />
Groundwater Atlas of the United States.<br />
146<br />
Figure 1 (left). Water Balance of the South Platte<br />
Alluvial Aquifer showing the groundwater contribution<br />
to streamflow
Complementary Research: Innovative Research Program<br />
VOC Production by Soil Microorganisms: Linking Microbial Ecology <strong>and</strong> Atmospheric<br />
Chemistry<br />
Investigators: Noah Fierer (CIRES, University of Colorado), Russ Monson (CIRES, University of<br />
Colorado)<br />
Objectives. The goal of this study is to characterize the types<br />
<strong>and</strong> quantities of volatile organic carbon compounds (VOCs)<br />
produced by soil microorganisms. We will determine if<br />
microbial VOC (mVOC) production is a potentially important<br />
source of atmospheric VOCs <strong>and</strong> if VOC analysis holds<br />
promise as a tool for the rapid assessment of soil microbial<br />
community composition.<br />
Background <strong>and</strong> Importance. The flux of VOCs from<br />
terrestrial sources to the atmosphere has an important impact on<br />
atmospheric chemistry at local, regional, <strong>and</strong> global scales<br />
[Monson <strong>and</strong> Holl<strong>and</strong>, 2001]. For this reason, many studies<br />
have focused on the production of VOCs by plants, assuming<br />
that plants are the largest terrestrial source of biogenic VOCs. Surprisingly, only a h<strong>and</strong>ful of studies have looked at<br />
the production of VOCs by soil microbes, despite a number of lines of evidence suggesting that, like plants,<br />
microbes may also be an important terrestrial source. We know that bacterial <strong>and</strong> fungal isolates grown in the<br />
laboratory can produce large quantities of VOCs <strong>and</strong> a diverse array of individual compounds, including alcohols,<br />
aldehydes, amines, methylated halogens, terpenoids, <strong>and</strong> volatile fatty acids. We also know that soil microbes are<br />
the dominant decomposers in terrestrial systems, converting organic C substrates to volatile forms of carbon. While<br />
CO2 is assumed to be the major product of microbial decomposition in aerobic soils, appreciable amounts of VOCs<br />
may also be released from soil during decomposition. Even if mVOC production is a small fraction of microbial<br />
CO2 production, mVOC production may represent a major pathway by which carbon is moved from terrestrial to<br />
atmospheric pools. At this point, the paucity of relevant data means that we can only speculate on the magnitude of<br />
mVOC production from soil.<br />
In addition to the likely biogeochemical importance of soil mVOC production, we expect that VOC analyses will<br />
provide a unique method for the assessment of microbial community structure. Although factors other than<br />
microbial community composition are likely to influence the VOC ―fingerprint‖ of a given soil, we expect a strong<br />
correlation between microbial community composition <strong>and</strong> VOC production. We know that the production of<br />
certain VOCs is associated with specific microbial groups in soil <strong>and</strong> we know that mVOC production can mediate<br />
microbial interactions in soil with some mVOCs acting as ―infochemicals‖ capable of stimulating or inhibiting the<br />
growth of specific microbial populations. Since the composition of soil microbial communities has an important<br />
influence on ecosystem dynamics, a rapid technique for assessing broad differences in microbial communities would<br />
be very valuable. Soil VOC analysis holds promise as an alternative to the expensive <strong>and</strong> time consuming methods<br />
currently used to assess microbial community structure.<br />
VOC production by soil microbes is likely to have an important influence on terrestrial carbon dynamics,<br />
atmospheric chemistry, <strong>and</strong> soil ecology.<br />
Innovative. We are proposing that mVOC production may be more important than previously recognized. As the<br />
first study to comprehensively examine mVOC production in soil, this work may open up a new field of scientific<br />
inquiry. Furthermore, if we can show that VOC analysis provides insight into soil microbial community structure,<br />
this work may lead to the development of new methodological approaches to study complex microbial communities.<br />
Interdisciplinary. The proposed project is a collaboration between a microbial ecologist (Fierer) <strong>and</strong> an ecosystem<br />
ecologist (Monson), using analytical techniques developed by atmospheric chemists. We expect that our findings<br />
will be of interest to researchers in a wide range of disciplines, including atmospheric chemistry, ecosystem ecology,<br />
microbiology, <strong>and</strong> soil science.<br />
147
Complementary Research: Innovative Research Program<br />
Research Plan. We will collect organic <strong>and</strong> mineral soils from a range of sites across the United States. We will<br />
focus on sites within the NSF-funded Long-Term Ecological Research network so that follow-up studies will be<br />
possible <strong>and</strong> NSF funds can accessed. The goal is to collect a diverse array of soil types (30-50 soils) so we can<br />
examine correlations between mVOC production <strong>and</strong> soil/site characteristics. After an equilibration period, root-free<br />
soils will be incubated in gas-tight containers for 24-48 h with headspace samples analyzed for VOCs using protontransfer-reaction<br />
mass spectrometry (PTR-MS). Headspace samples will also be analyzed for CO2 concentrations<br />
with an infrared gas analyzer so we can compare net CO2 <strong>and</strong> net VOC production rates. We will collect relevant<br />
site information <strong>and</strong> measure basic soil physico-chemical characteristics for each soil. In addition, we will use the<br />
quantitative PCR approach described in Fierer et al. [2005] to quantify the abundances of bacterial <strong>and</strong> fungal<br />
groups in each soil sample. By analyzing a relatively large number of samples, we can determine if VOC<br />
―fingerprints‖ (the types <strong>and</strong> quantities of VOCs released) are unique to each soil type <strong>and</strong> we can assess<br />
relationships between specific soil characteristics <strong>and</strong> mVOC production. We will use multivariate statistical<br />
methods (non-metric multi-dimensional scaling <strong>and</strong> ANOSIM procedures, [Fierer <strong>and</strong> Jackson, 2006]) to look for<br />
correlations between VOC fingerprints <strong>and</strong> soil/site characteristics.<br />
Once the cross-site study has established linkages between microbial VOC production <strong>and</strong> soil/site characteristics<br />
we will test our hypothesis that VOC production is strongly correlated with microbial community composition. By<br />
simply screening the collected soils, we cannot distinguish the effects of microbial community composition from<br />
other factors (soil organic carbon characteristics, texture, <strong>and</strong> nutrient status) that may also influence mVOC<br />
production. To determine the strength of the relationship between community composition <strong>and</strong> mVOC fingerprints,<br />
we will experimentally manipulate the microbial communities in five soils that have distinct VOC fingerprints by<br />
autoclaving each soil <strong>and</strong> re-introducing microbes with five different soil inocula, one from each of the five soil<br />
types. After an equilibration period, VOC production will be measured using the techniques described above. If<br />
VOC fingerprints correspond to microbial community composition, we should observe a strong effect of inoculum<br />
on VOC fingerprints from a given soil type. If VOC production is unrelated to microbial community composition,<br />
but is instead driven by intrinsic abiotic soil properties, we will see no apparent inoculum effect. The linkages<br />
between microbial community composition <strong>and</strong> VOC fingerprints will be further examined by adding known<br />
organic substrates (e.g. cellulose, proteins, sugars) to each of the five soils <strong>and</strong> measuring VOC production over<br />
time. If substrate characteristics are less important than community composition in controlling mVOC production,<br />
soils receiving the same substrate should yield distinct VOC fingerprints.<br />
Expected outcome <strong>and</strong> impact. This work is just the first step towards underst<strong>and</strong>ing microbial VOC production <strong>and</strong><br />
its consequences. This work will allow us to parameterize the relative importance of soil VOC production <strong>and</strong> assess<br />
how VOC production varies across a wide range of soil types. We expect that the proposed work will yield valuable<br />
data sets than can be leveraged to obtain extramural funding in the future. If we find that microbial VOC production<br />
is an important source of VOCs, more detailed experiments <strong>and</strong> field studies will follow. If we find that VOC<br />
analysis can be used to infer microbial community composition, this work may to lead to the development of new<br />
methods for rapidly assessing soil biological characteristics.<br />
148
Complementary Research: Innovative Research Program<br />
Sunlight Initiated Chemistry by Low Energy Vibrational Overtone Excitation of Oxidized<br />
Organics in the Atmosphere<br />
Investigators: V. Vaida (CIRES, University of Colorado), R. Skodje (Department of Chemistry<br />
<strong>and</strong> Biochemistry, University of Colorado)<br />
Objectives. In a collaboration between experiment (Prof. V. Vaida) <strong>and</strong> theory (Prof. R. Skodje), we propose to<br />
investigate a new paradigm for sunlight-initiated chemical reactions occurring by low energy by excitation of<br />
vibrational overtones in the ground electronic state. The target for this study is oxidized atmospheric organics (acids,<br />
alcohols). An important objective of this work is to investigate the role of water in catalyzing environmental<br />
photoreactions. The contribution of such chemistry to photochemical processing of atmospheric aerosols, Arctic ice<br />
<strong>and</strong> other environmental media will be investigated with expertise available in CIRES.<br />
Background <strong>and</strong> Importance. The incoming beam of<br />
photons from the Sun approximates the emission of a black<br />
body at about 5800K with a maximum flux in the red. The<br />
vast majority of photochemical reactions known in the<br />
atmosphere involve a molecule‘s excited electronic states at<br />
sufficiently high energy to rupture covalent bonds. This<br />
process requires UV wavelengths >400nm. Some of us have<br />
shown that photochemical reactions can occur in the ground<br />
electronic state by absorption of radiation by vibrational<br />
overtone transitions. The cross sections for such transitions<br />
near chemical thresholds are very low, yet in the Earth‘s<br />
atmosphere, excitation is effected near the solar<br />
wavelengths maxima. Visible light, obviously abundant in the solar spectrum, is sufficiently energetic to excite high<br />
overtone states of chromophores such as the hydroxyl-group (OH). If the overtone transition is sufficiently intense,<br />
<strong>and</strong> if the vibrational energy is effectively transferred to the reaction coordinate, vibrational overtone absorption<br />
may provide an important new mechanism for atmospheric chemistry. Previous studies by Vaida <strong>and</strong> coworkers<br />
suggest that vibrational overtone absorption likely plays a role in a number of atmospheric reactions.<br />
This work is important in establishing the fundamental foundations for a new paradigm for processing organics in<br />
the atmosphere by sunlight. Environmental circumstances where such chemistry could be important are<br />
photochemical processing of atmospheric aerosols on ice, especially Arctic ice, where observations suggest<br />
additional mechanisms are needed to explain sunrise-promoted emissions from snowpacks.<br />
149<br />
Innovative.<br />
A new paradigm is proposed for<br />
photochemistry in the atmosphere by solar<br />
pumping of vibrational overtone transitions of<br />
the ground electronic state. For organic acids<br />
<strong>and</strong> alcohols under investigation, the excitedstate<br />
photochemistry normally considered is<br />
irrelevant since the electronic states absorb in<br />
the UV at wavelengths filtered by stratospheric<br />
ozone.<br />
An interesting possibility is the lowering of the<br />
transition states for reaction by water. If this<br />
investigation determines the viability of such<br />
water-catalyzed reactions, water becomes an<br />
important environmental catalyst for<br />
processing of oxidized organics not previously<br />
considered.
Complementary Research: Innovative Research Program<br />
Interdisciplinary. This study requires a synergistic approach based in chemical theory, laboratory experiments <strong>and</strong><br />
atmospheric science. We described in the initial stage the collaboration between theory <strong>and</strong> experiment. Once the<br />
results are available, expertise with atmospheric aerosols, field observations regarding sunrise emissions from Arctic<br />
ice <strong>and</strong> atmospheric modeling are necessary <strong>and</strong> available in CIRES.<br />
Research Plan. This study chooses for illustration the molecule methane-diol, CH2(OH)2 <strong>and</strong> its hydrated form<br />
CH2(OH)2·H2O.<br />
CH2(OH)2 + hv → CH2O + H2O (A)<br />
CH2(OH)2·H2O + hv → CH2O + 2H2O (B)<br />
The dehydration reaction will be used as prototype reactions to study the vibrational overtone absorption<br />
mechanism. We already computed the reaction paths for A <strong>and</strong> B. A very interesting result was obtained. While the<br />
barrier to reaction was approximately 45 kcal/mol for reaction A, the reaction of the van der Waals complex (B)<br />
takes place with a barrier of only approximately 29 kcal/mol suggesting the possibility of catalysis of reaction (A)<br />
by water. The main focus of the theoretical research is the dynamics <strong>and</strong> kinetics of the vibrational overtone<br />
absorption-induced chemical reactions using the method of direct dynamics.<br />
The experimental work will involve two related studies:<br />
A spectroscopic study of the vibrational spectrum of this molecule never before obtained. A Fourier-<br />
Transform spectrometer available in the Vaida group will be used to obtain the mid IR spectrum. A newly<br />
developed cavity-ring-down spectrometer will allow the investigation of high OH vibrational overtones,<br />
which are at the barrier for reaction.<br />
Light initiated reactions of the organic acids <strong>and</strong> alcohols will be investigated to obtain the fundamental<br />
data base needed as input to chemical atmospheric models.<br />
Expected Outcome <strong>and</strong> Impact. The goal of this inquiry is to acquire a valid theoretical description confirmed by<br />
experiment of how water-catalyzed photochemical reactions occur. The outcome will be to introduce in atmospheric<br />
models new classes of photo-processing reactions relevant to atmospheric aerosols, ices <strong>and</strong> other water-air<br />
environmental interfaces.<br />
150
Complementary Research: Innovative Research Program<br />
Can Phytoplankton Change SST <strong>and</strong> Upper-Ocean Circulation?<br />
Investigators: Toshiaki Shinoda (CIRES, University of Colorado), Weiqing Han (Department of<br />
Atmospheric <strong>and</strong> Oceanic Sciences, University of Colorado)<br />
Background <strong>and</strong> Importance. It is well known that the turbidity of upper ocean water is primarily determined by<br />
phytoplankton distribution. Hence, the phytoplankton pigment concentration in the upper ocean significantly affects<br />
the mixed-layer absorption <strong>and</strong> penetration of solar radiation. Given that solar radiation is the largest component of<br />
surface heat fluxes that determine the sea surface <strong>and</strong> upper-ocean temperature in tropical oceans, variation of<br />
phytoplankton distribution can directly influence sea surface temperature (SST) <strong>and</strong> upper-ocean thermal structure.<br />
As a result, upper-ocean circulation can also be altered due to its sensitivity to the thermal structure. In most stateof-the-art<br />
ocean general circulation models (OGCM), however, turbidity of water is parameterized by a constant<br />
water type, <strong>and</strong> therefore spatial <strong>and</strong> temporal variations of phytoplankton are neglected.<br />
The proposed research aims to underst<strong>and</strong> the role played by phytoplankton in causing variabilities of SST <strong>and</strong><br />
upper-ocean circulation in the tropical Pacific <strong>and</strong> Indian Oceans. The approach for this project is to perform OGCM<br />
experiments by including <strong>and</strong> excluding phytoplankton concentration, which can be inferred from chlorophyll-a<br />
(chl-a) concentration of satellite-derived ocean color data. The penetrative component of solar radiation (Qpenet)<br />
will be calculated from the ocean color data using a solar transmission parameterization based on chlorophyll<br />
concentration. To help test the sensitivity of penetrative radiation to vertical resolution, a 1-D mixed-layer model<br />
will also be used. Completion of the proposed research is expected to improve the simulation of SST <strong>and</strong> upper-<br />
ocean circulation by advancing the parameterization of penetrative radiation in OGCMs, <strong>and</strong> ultimately improve<br />
climate model simulations <strong>and</strong> predictions.<br />
Innovative. While the satellite-derived ocean color data have been widely used to examine the upper-ocean<br />
biological processes, their effects on SST <strong>and</strong> upper ocean circulation are not emphasized. The proposed research is<br />
unique <strong>and</strong> innovative in that it will qualify <strong>and</strong> quantify the impact of spatial <strong>and</strong> temporal variations of<br />
phytoplankton pigment concentration on upper ocean physical processes, <strong>and</strong> thus will build a foundation for<br />
underst<strong>and</strong>ing the physical-biological interactions <strong>and</strong> their impact on climate variability.<br />
Objectives. Specific objectives of the proposed research are:<br />
To determine the extent to which variability of SSTs <strong>and</strong> currents in ocean models are improved by the new<br />
penetrative solar radiation calculation from the satellite-derived ocean color data.<br />
To quantify the impact of space <strong>and</strong> time variations of penetrative solar radiation on upper-ocean<br />
variabilities ranging from diurnal to seasonal time scales.<br />
Research Plan. A parameterization of solar transmission based on the upper-ocean chl-a concentration along with<br />
remotely sensed ocean color data will be used to calculate Qpenet in ocean model experiments. Net irradiance<br />
profiles are expressed as a sum of two exponential terms. We will use Moderate-Resolution Spectroradiameter<br />
(MODIS) products that include the chl-a concentration data from recent satellite measurements (Aqua <strong>and</strong> Terra).<br />
Solar radiation at the surface will be obtained from the new satellite-based Earth‘s radiation budget (ERB) 3-hourly<br />
data.<br />
The OGCM is the HYbrid-Coordinate Ocean Model (HYCOM). The fine-resolution global HYCOM will be<br />
operational for the Navy <strong>and</strong> the regional HYCOM (U.S. east <strong>and</strong> west coast) will be operational at NCEP with both<br />
scheduled for operational deployment around 2006-2007. The OGCM will be first integrated for the six-year period<br />
from February 2000 to 2005 after the high quality ocean color data are obtained. The model will be then forced with<br />
same-surface fluxes but with penetrative solar radiation calculated based on a constant water type in space <strong>and</strong> time.<br />
The difference between the two experiments estimates the impact of the use of satellite-derived ocean color data on<br />
upper-ocean variability. The model SST from these experiments will be compared with a variety of SST data (e.g.,<br />
TRMM Microwave Imager SST) to determine to what extent the simulation of upper-ocean variability is improved<br />
by the use of satellite-derived ocean color data. We will further conduct a number of model experiments in order to<br />
isolate the effect of Qpenet variations on different time scales using low-pass filtered chl-a. 1-D mixed-layer model<br />
experiments will also be conducted in order to determine how the vertical resolution of the model affects the impact<br />
of Qpenet. 1-D model results with OGCM experiments also isolate the impact on only vertical processes. A<br />
151
Complementary Research: Innovative Research Program<br />
particular emphasis in 1-D model experiments is given to the diurnal cycle of SST. The spatial variation of the<br />
amplitude of the diurnal cycle in each experiment will be described.<br />
Expected Outcome <strong>and</strong> Impact. Completion of the proposed research will lead to better solar transmission<br />
parameterization in ocean models <strong>and</strong> identify its impact on the upper-ocean variability. Thus, it will help climate<br />
model development <strong>and</strong> improvement. In addition, the proposed study is considered a ―jump start‖ for further model<br />
diagnoses of climate variability. A variety of climate variability in the tropical Indian <strong>and</strong> Pacific Oceans can be<br />
diagnosed from the ocean model output. For instance, the Indian Ocean dipole variability in recent years can be<br />
investigated. In addition, a coupled ecosystem model, which can examine physical/biological feedback processes,<br />
could be developed in future projects as extension of the proposed research.<br />
152<br />
Phytoplankton bloom in the South<br />
Atlantic (February 15, 2006) seen from<br />
space. NASA image courtesy Jeff<br />
Schmaltz, MODIS L<strong>and</strong> Rapid Response<br />
Team at NASA GSFC.
Complementary Research: CIRES Fellowships<br />
CIRES Visiting Fellows<br />
CIRES annually budgets approximately $500,000 to conduct a competitive visiting fellowship program that<br />
promotes collaborative research at the forefront of evolving scientific paradigms. One-year fellowships are made to<br />
Ph.D. scholars <strong>and</strong> university faculty planning sabbatical leave. Post-doctoral fellowships are supported for two<br />
years – the first year by CIRES <strong>and</strong> the second year by the sponsoring research group. Selections are based in part<br />
on the likelihood of stimulating academic interactions <strong>and</strong> the degree to which both parties will benefit from the<br />
exchange of new ideas. To further this goal, priority is given to c<strong>and</strong>idates with research experience at institutions<br />
outside the Boulder scientific community. A Research <strong>and</strong> Education Fellowship is specifically funded for work in<br />
the area of education <strong>and</strong> outreach. The program is open to scientists from all countries, <strong>and</strong> appointments can begin<br />
at any time during the year. Visiting Fellows at CIRES last year are listed below. Further information can be found<br />
at http://cires.colorado.edu/visfell/vf.html. Approximately six fellowships are offered to scientists with research<br />
interests in the areas of:<br />
Physics, chemistry, <strong>and</strong> dynamics of the Earth system (atmosphere, biosphere, hydrosphere, lithosphere)<br />
Global <strong>and</strong> regional environmental change<br />
Climate system monitoring, diagnostics, <strong>and</strong> modeling<br />
Remote sensing <strong>and</strong> in-situ measurement techniques for the Earth system<br />
Interdisciplinary research themes<br />
Following are the visiting fellows supported during the period covered by this report. Details of their research <strong>and</strong><br />
the many resulting publications <strong>and</strong> presentations can be found in the appendices.<br />
Post-Doctoral <strong>and</strong> Sabbatical Fellows<br />
NAME AFFILIATION MENTOR PROJECT TITLE<br />
Roya<br />
Bahreini<br />
CSD F. Fehsenfeld Chemical composition of aerosols<br />
Thian Yew<br />
Gan<br />
Shari<br />
Gearheard<br />
Geography &<br />
Civil<br />
Engineering<br />
NSIDC<br />
Neil Glasser NSIDC<br />
R. Barry<br />
B. Rajagopalan<br />
R. Barry<br />
153<br />
Seasonal teleconnection between North<br />
American monsoon <strong>and</strong> SMMR-SSM/I<br />
EASE-GRID Snow Water Equivalent<br />
Data, <strong>and</strong> possible detection of climate<br />
change impact on North America‘s<br />
snowpack<br />
Bridging perspectives of change:<br />
Linking Inuit <strong>and</strong> scientific approaches<br />
to underst<strong>and</strong>ing Arctic environmental<br />
change<br />
R. Barry The structure <strong>and</strong> stability of Antarctic<br />
Peninsula ice shelves
Steven<br />
Leavitt<br />
Sarah<br />
Tessendorf<br />
Kevin<br />
Vranes<br />
Cameron<br />
Wobus<br />
Complementary Research: CIRES Fellowships<br />
Geography T. Chase Tree rings <strong>and</strong> carbon isotope<br />
composition: Indicators of southwestern<br />
U.S. drought <strong>and</strong> changing water-useefficiency<br />
CSD G. Feingold Aerosol impacts on cloud microphysics<br />
in simulated deep convective clouds<br />
Policy Center R. Pielke Examining decision making under<br />
uncertainty for climate change <strong>and</strong><br />
severe storms, water resource<br />
management <strong>and</strong> earthquake mitigation<br />
Geology G. Tucker<br />
P. Molnar<br />
154<br />
A study of the links between climate <strong>and</strong><br />
surface processes, focusing on erosion<br />
processes in river systems draining the<br />
eastern Colorado Front Range<br />
Research <strong>and</strong> Education Fellow<br />
NAME AFFILIATION MENTOR PROJECT TITLE<br />
Ryan Outreach S. Buhr Documentary film making: celebrating<br />
Vachon<br />
polar science, environments, climates<br />
<strong>and</strong> societies in conjunction with the<br />
International Polar Year, <strong>and</strong><br />
underst<strong>and</strong>ing processes controlling<br />
patterns of stable isotopes of<br />
precipitation
Complementary Research: CIRES Fellowships<br />
CIRES Graduate Research Fellows<br />
CIRES has long supported a competitive Graduate Research Fellowship program to (1) attract outst<strong>and</strong>ing students<br />
at the outset of their graduate careers, <strong>and</strong> (2) enable current students to place a greater emphasis on completing <strong>and</strong><br />
publishing their research results. Support ranges from a summer stipend to tuition, stipend <strong>and</strong> partial health<br />
insurance for one year (12 months). Fellowships are restricted to Ph.D. students advised by a CIRES Fellow or any<br />
prospective or current graduate student who might be advised by a CIRES Fellow. Evaluations by a committee of<br />
CIRES Fellows are based on the c<strong>and</strong>idate‘s University application, accomplishments, <strong>and</strong> the likelihood of their<br />
contribution to environmental science. Independence, passion for science, <strong>and</strong> the ability to communicate are also<br />
considered. This year, CIRES awarded fellowships to seven students, five of whom were new recruits, to explore<br />
topics ranging from climate change <strong>and</strong> the mass balance of the Greenl<strong>and</strong> ice sheet to natural carbon storage in<br />
ecosystems <strong>and</strong> the role of organic haze in the early Earth‘s atmosphere.<br />
Br<strong>and</strong>on Michael Connelly<br />
From: Macalester College, B.A., Chemistry <strong>and</strong> History<br />
Department: Chemistry <strong>and</strong> Biochemistry<br />
Faculty Sponsor: Margaret Tolbert<br />
Research Area: Uptake of organics by thin sulfuric acid/ammonium sulfate films: The kinetics of<br />
acid-catalyzed secondary organic formation<br />
Scott Gregory<br />
From: Florida Atlantic University, B.S., Ocean Engineering; M.S., Ocean Engineering specializing<br />
in acoustics<br />
Department: Atmospheric <strong>and</strong> Oceanic Sciences (ATOC)<br />
Faculty Sponsor: David Noone<br />
Research Area: Tropical/high-latitude climate linkages with El Niño Southern Oscillation (ENSO)<br />
signals in Antarctic ice cores<br />
Eileen McKim<br />
From: University of Colorado at Boulder, B.A., Distributed Studies Earth <strong>Systems</strong> Science; M.A.,<br />
Geography/Climatology<br />
Department: Geography<br />
Faculty Sponsor: Roger Barry<br />
Research Area: Analyses of hydrological processes <strong>and</strong> interactions with the climate system-with<br />
goals of providing scientific assessment of global change in climate <strong>and</strong> the environment<br />
Lin Liu<br />
Wuhan University, Hubei, P.R. China, B.S., Geophysics<br />
Department: Physics<br />
Faculty Sponsor: John Wahr<br />
Research Areas: The use of Interferometric Synthetic Aperture Radar (InSAR) <strong>and</strong> its applications<br />
in geophysics <strong>and</strong> geology; Space Geodesy; <strong>and</strong> Physics of the Earth’s core<br />
Mark Seefeldt<br />
Florida State University/ University of Wisconsin at Madison, B.S., Meteorology/ M.S.,<br />
Atmospheric Science<br />
Department: Atmospheric <strong>and</strong> Oceanic Sciences (ATOC)<br />
Faculty Sponsor: John Cassano<br />
Research Area: An analysis of the Ross Ice Shelf air stream based on observational <strong>and</strong> numerical<br />
modeling studies<br />
155
Complementary Research: CIRES Fellowships<br />
156
CIRES’ Leadership<br />
Konrad Steffen: Director<br />
William M. Lewis, Jr.: Associate Director<br />
Jon Rush: Associate Director for Administration<br />
Suzanne van Drunick: Assistant Director for Science<br />
Appendices: Governance <strong>and</strong> Management<br />
Appendices<br />
Governance <strong>and</strong> Management<br />
Divisions:<br />
Cryospheric <strong>and</strong> Polar Processes: Roger Barry, Associate Director<br />
Environmental Biology: Carol Wessman, Associate Director<br />
Environmental Chemistry: Fred Fehsenfeld, Associate Director<br />
Environmental Observations, <strong>Modeling</strong> <strong>and</strong> Forecasting: Michael Hardesty, Associate Director<br />
Solid Earth Sciences: John Wahr, Acting Associate Director (Associate Director Roger Bilham is on sabbatical)<br />
Weather <strong>and</strong> Climate Dynamics: R<strong>and</strong>all Dole, Associate Director<br />
Fellows Committees<br />
Council of Fellows<br />
CIRES‘ Council of Fellows constitutes the ―Board of Directors‖ <strong>and</strong> chief governing body of CIRES. It is<br />
comprised of individuals with an outst<strong>and</strong>ing record of achievement <strong>and</strong> ability in diverse areas of environmental<br />
sciences. They are primarily university faculty, senior research scientists or government scientists who form the core<br />
leadership of the institute. Their responsibilities are to (1) provide leadership at all levels in environmental science,<br />
(2) maintain an active scientific research/education program, (3) support the CIRES infrastructure through indirect<br />
cost recovery <strong>and</strong> in-kind contributions, (4) participate in CIRES management, <strong>and</strong> (5) contribute interdisciplinary<br />
expertise <strong>and</strong> participate in collaborative work. As a group, they personify the concept of collaboration that is the<br />
founding principle of the NOAA Cooperative Institutes Program. Ex-officio individuals include representatives of<br />
the Members‘ Council <strong>and</strong> CIRES administration. Fellows meetings are held monthly during the academic year.<br />
The Council of Fellows met eight times during FY06-07: August 31, 2006; September 14, 2006; October 19, 2006;<br />
November 16, 2006; January 25th, 2007; February 22, 2007; March 22, 2007; <strong>and</strong> April 19, 2007.<br />
Richard Armstrong (Senior Research Scientists, National Snow <strong>and</strong> Ice Data Center)<br />
Susan K. Avery (Vice Chancellor for Research <strong>and</strong> Dean of the Graduate School; Professor, Electrical <strong>and</strong><br />
Computer Engineering)<br />
Ben B. Balsley (Research Professor, Electrical <strong>and</strong> Computer Engineering)<br />
Roger G. Barry* (Director, NSIDC; Professor of Geography)<br />
Roger Bilham (Professor of Geological Sciences)<br />
John Cassano* (Assistant Professor of Atmospheric <strong>and</strong> Oceanic Sciences)<br />
Thomas N. Chase* (Assistant Professor of Geography)<br />
Xinzhao Chu* (Assistant Professor of Aerospace Engineering)<br />
Shelley D. Copley* (Professor of Molecular, Cellular <strong>and</strong> Developmental Biology)<br />
R<strong>and</strong>all M. Dole (Director, Climate Diagnostics Center)<br />
David Fahey (Research Physicist, Chemical Sciences Division)<br />
Christopher W. Fairall (Supervisory Physicist, Physical Science Division)<br />
G. Lang Farmer (Professor of Geological Sciences)<br />
Fred C. Fehsenfeld (Senior Scientist, Chemical Sciences Division)<br />
Graham Feingold (Scientist, Physical Science Division)<br />
Noah Fierer* (Assistant Professor, Ecology <strong>and</strong> Evolutionary Biology Department)<br />
Timothy J. Fuller-Rowell (Senior Research Scientist, CIRES/Space Environment Center)<br />
Vijay K. Gupta* (Professor of Civil, Environmental <strong>and</strong> Architectural Engineering)<br />
R. Michael Hardesty (Chief, Atmospheric Lidar Division, Chemical Science Division)<br />
157
Appendices: Governance <strong>and</strong> Management<br />
José-Luis Jiménez* (Assistant Professor of Chemistry <strong>and</strong> Biochemistry)<br />
Craig Jones (Associate Professor of Geological Sciences)<br />
William M. Lewis, Jr.* (Director, Center for Limnology; Professor of Ecology <strong>and</strong> Evolutionary Biology)<br />
Peter H. Molnar* (Professor of Geological Sciences)<br />
Russell K. Monson (Professor of Ecology <strong>and</strong> Evolutionary Biology)<br />
William D. Neff (Director, NOAA/ESRL Physical Science Division)<br />
Steven Nerem (Professor of Aerospace Engineering)<br />
David Noone* (Assistant Professor of Atmospheric <strong>and</strong> Oceanic Sciences)<br />
Roger Pielke, Jr.* (Director, Center for Science <strong>and</strong> Technology Policy Research; Professor of Environmental<br />
Studies Program)<br />
Balaji Rajagopalan (Assistant Professor of Civil, Environmental <strong>and</strong> Architectural Engineering)<br />
Prashant Sardeshmukh (Senior Research Scientist, Assistant Director of Climate Diagnostics Center)<br />
Mark Serreze (Research Professor of Geography, Senior Research Scientist, National Snow <strong>and</strong> Ice Data Center)<br />
Anne F. Sheehan* (Professor of Geological Sciences)<br />
Robert E. Sievers* (Professor of Chemistry <strong>and</strong> Biochemistry)<br />
Susan Solomon (Senior Scientist, Chemical Sciences Division)<br />
Konrad Steffen* (Professor of Geography, Director of CIRES)<br />
Margaret A. Tolbert* (Professor of Chemistry <strong>and</strong> Biochemistry)<br />
Greg Tucker* (Assistant Professor of Geological Sciences)<br />
Veronica Vaida (Professor of Chemistry <strong>and</strong> Biochemistry)<br />
John M. Wahr (Professor of Physics)<br />
Carol A. Wessman* (Professor of Ecology <strong>and</strong> Evolutionary Biology)<br />
* = rostered in CIRES/Graduate School<br />
Emeritus Fellows<br />
John Birks – Professor of Chemistry <strong>and</strong> Biochemistry<br />
Alex Goetz – Professor of Geological Sciences<br />
Carl Kisslinger – Professor of Geological Sciences<br />
George Reid – Senior Scientist, NOAA CRD<br />
Hartmut Spetzler – Professor of Geological Sciences<br />
Doug Robertson – NOAA/NOS/NGS<br />
158<br />
CIRES Affiliates<br />
Henry Diaz – NOAA Climate Diagnostics Center<br />
Ray Fall – Professor of Chemistry <strong>and</strong> Biochemistry<br />
Ray E. Habermann – National Geophysical Data Center<br />
Pieter Tans – NOAA/ESRL Global Monitoring Division<br />
Executive Committee<br />
The Executive Committee assists <strong>and</strong> advises the Director in matters regarding day-to-day management of the<br />
institute <strong>and</strong> makes important decisions <strong>and</strong> policies affecting CIRES. Members of the Executive Committee include<br />
the Associate Directors of the six administrative units for CIRES, two Fellows elected at-large for a two-year term,<br />
renewable for one term, <strong>and</strong> two voting members that are the Members‘ Council representatives. The Assistant<br />
Director for Science, the Associate Director for Administration <strong>and</strong> the Senior Finance Officer are ex officio<br />
members of the committee.<br />
Career Track Committee<br />
This committee is charged with consideration of all nominations for promotion within the CIRES career tracks of<br />
Research Scientist, Associate Scientist <strong>and</strong> Administrative Associate. Nominations are made once yearly, <strong>and</strong> the<br />
committee's recommendations are forwarded to the director for consideration <strong>and</strong> action. A special committee,<br />
organized in early 2005, reviewed <strong>and</strong> revised the career track descriptions, <strong>and</strong> clarified the promotion process.<br />
Computing Advisory Committee<br />
The purpose of the CIRES‘ Computing Advisory Committee (CAC) is to provide expert counsel <strong>and</strong><br />
recommendations on technical issues, user support, resource allocations <strong>and</strong> the establishment of computing policies.<br />
That advice is available to anyone in CIRES; however, the primary CAC advisees are the Director <strong>and</strong> Council of<br />
Fellows <strong>and</strong> the CIRES‘ Computing Facility (CCF) Manager. CIRES staff or the CCF manager submits questions,<br />
issues, <strong>and</strong> recommendations through CAC members, or via a Web suggestion page to the CAC chairperson for<br />
committee consideration. CAC also serves as the last resort mediator of disputes between users <strong>and</strong> the CCF. The<br />
CAC membership includes people with the diverse expertise that is required to underst<strong>and</strong> <strong>and</strong> contribute to the<br />
CIRES computing decision-making process, as well as people representing the user groups that are supported by the
Appendices: Governance <strong>and</strong> Management<br />
CIRES‘ Computing Facility. The Director of CIRES appoints the Chair of the committee as well as one other Fellow.<br />
Additional members are nominated <strong>and</strong> selected by the CAC. All members serve a three-year term.<br />
Distinguished Lectureship Series<br />
This lecture series was created to bring outst<strong>and</strong>ing scientists <strong>and</strong> innovative thinkers who have given serious<br />
consideration to environmental <strong>and</strong> Earth system science issues. Coordinators are given the task of putting together<br />
this program <strong>and</strong> hosting the scientists‘ visit.<br />
External Awards Committee<br />
This group identifies <strong>and</strong> prepares nominations of CIRES employees for awards offered by the university,<br />
professional societies, Federal agencies, national academies, <strong>and</strong> other organizations.<br />
Fellows Appointment/Reappointment Committee<br />
All CIRES Fellows are subject to periodic review. First-term Fellows are reviewed after two years, <strong>and</strong> continuingterm<br />
Fellows generally every five years thereafter. This committee considers the package of reappointment<br />
submitted by the Fellow, which includes a cover letter outlining reasons for continuing as a Fellow <strong>and</strong> a curriculum<br />
vita. The committee prepares its recommendations, which are submitted to the full Council of Fellows for<br />
consideration <strong>and</strong> final vote. This committee is also charged with considering the identification <strong>and</strong> nomination<br />
packages of possible new Fellows within the community of scientists at the University of Colorado <strong>and</strong> NOAA.<br />
Nominations for new Fellows are considered once yearly.<br />
Graduate Research Fellowship Committee<br />
Approximately five graduate research fellowships are awarded to CIRES-affiliated graduate students each year<br />
through a CIRES competition. This group serves as the review <strong>and</strong> selection committee for these fellowships.<br />
Innovative Research Program Committee<br />
This program is designed to stimulate a creative research environment within CIRES <strong>and</strong> encourage synergy<br />
between disciplines <strong>and</strong> research colleagues. The intent is to provide an uncomplicated mechanism for supporting<br />
small research efforts that can quickly provide concept viability. The number of awards each year depends upon the<br />
funds available <strong>and</strong> funds requested, but averages about six.<br />
New Fellows Committee<br />
This committee is charged with considering the identification <strong>and</strong> nomination packages of possible new Fellows<br />
within the community of scientists at the University of Colorado <strong>and</strong> NOAA. Nominations for new Fellows are<br />
considered once yearly.<br />
Space Committee<br />
A continuing problem for CIRES is the limited office <strong>and</strong> laboratory space for employees. This committee provides<br />
advice on the best use <strong>and</strong> distribution of existing space, provides ideas on improvement of space through<br />
renovation, <strong>and</strong> develops options for planning future space.<br />
Visiting Fellows Committee<br />
This committee is responsible for the review of all applications for CIRES Visiting Fellowships. In the process of<br />
this review, the committee makes the decision regarding those best qualified for a fellowship in any given year, <strong>and</strong><br />
submits that slate to the Fellows Council for final discussion <strong>and</strong> selection.<br />
Bridge Funding <strong>and</strong> Sabbatical Leave Committee<br />
This committee is charged with developing guidelines, procedures <strong>and</strong> selection criteria for a program through<br />
which CIRES Research Scientists may apply for bridge funding for support between funded projects, <strong>and</strong> sabbatical<br />
leave to promote interactions with other research groups, to advance their professional development <strong>and</strong> build new<br />
collaborations.<br />
Special Committees<br />
Additional special committees are appointed as needed by the Director. These include Faculty Search committees,<br />
the CU Program Review Committee, <strong>and</strong> others. They are created as a need arises, exist to accomplish a specific<br />
task, <strong>and</strong> are then disb<strong>and</strong>ed.<br />
159
Appendices: Governance <strong>and</strong> Management<br />
Members’ Council<br />
The CIRES‘ Members' Council (CMC) was created in 1997 to act as an information <strong>and</strong> policy conduit between<br />
CIRES‘ leadership <strong>and</strong> the Institute members (Associate Scientists, Research Scientists, <strong>and</strong> Administrative<br />
Associates). To accomplish this in the most effective manner, the CIRES membership was divided geographically<br />
into six groups of approximately equal size. Each group is represented by two people, preferably from two different<br />
classifications in the CIRES Career Track. From this Council of twelve, two representatives to the CIRES Fellows‘<br />
Council <strong>and</strong> Executive Committee are elected (one PRA representative <strong>and</strong> one RA representative). The two<br />
representatives to the Fellows‘ Council/Executive Committee serve as the liaison between the Fellows<br />
Council/Executive Committee <strong>and</strong> the Members‘ Council. The Members‘ Council, which meets monthly, then<br />
serves as a direct line of communication to the Member population at large. During the period of this report, CMC<br />
organized the second all-institute Rendezvous science day, administered the ongoing Outst<strong>and</strong>ing Performance<br />
Awards, <strong>and</strong> took over the Adopt-A-Highway program. Additionally, CMC made a significant change in the format<br />
of the monthly meetings when, following the suggestion of a CIRES member, they became open meetings. CMC<br />
now encourages members to attend monthly meetings, communication has improved, <strong>and</strong> important issues have<br />
been discussed. Since meetings are held sequentially at our three main locations, this has allowed all interested<br />
members of the far-flung locations to attend more easily at least every third meeting. Subsequently, CMC has also<br />
invited special visitors, like representatives from CU benefits, to attend meetings <strong>and</strong> respond to questions <strong>and</strong><br />
concerns about issues important to CIRES members. These issues have then been presented to the Executive<br />
Committee <strong>and</strong> Fellows Council by the CMC representatives. This has encouraged continuing communication<br />
throughout the institute on a constant basis, not just at yearly meetings.<br />
160
Appendices: Student Diversity Programs<br />
Student Diversity Programs<br />
Significant Opportunities in Atmospheric Research <strong>and</strong> Science Program (SOARS)<br />
SOARS is a model learning community <strong>and</strong> mentoring program for promoting racial <strong>and</strong> gender equity in the<br />
atmospheric <strong>and</strong> related sciences. Created by <strong>and</strong> administered through the National Center for Atmospheric<br />
Research, CIRES has formed a partnership with NCAR to participate in this highly regarded program while<br />
providing NCAR with a wider range of disciplines in which to place students. It is a multi-summer, four-year<br />
undergraduate <strong>and</strong> graduate program for students majoring in an atmospheric science or a related field such as<br />
biology, chemistry, computer science, earth science, engineering, environmental science, mathematics, meteorology,<br />
oceanography, physics, or social science. Program information can be found at http://www.ucar.edu/soars/.<br />
Name Affiliation Research Mentor Project Title<br />
Karen Diaz<br />
CIRES Holger Vomel Background Measurements in Ozonsondes: re<br />
current estimates correct?<br />
Douglas Gavin CIRES<br />
NOAA/ESRL/<br />
PSD<br />
Miriam Garcia<br />
CIRES/<br />
Geological<br />
Sciences<br />
Leslie Hartten<br />
Roger Bilham<br />
CIRES/<br />
NSIDC<br />
Francine Coloma<br />
Nancy I. Rivera Rivera CIRES Lesley Smith<br />
Undergraduate Research Opportunities Program (UROP)<br />
The Undergraduate Research Opportunities Program (UROP) was designed to create research partnerships between<br />
faculty <strong>and</strong> undergraduate students. Research in this context is interpreted as any scholarly or creative activity<br />
ranging from traditional scientific experimentation to the creation of new artistic works. UROP awards stipends<br />
<strong>and</strong>/or expense allowances to students who undertake an investigative or creative project in collaboration with a<br />
faculty member. Although projects are normally designed around some aspect of the faculty sponsor‘s research, they<br />
may also develop from original ideas of the student, which are endorsed by a faculty sponsor. Whether the context is<br />
scholarly or artistic, UROP projects call for significant input on the part of the faculty sponsor. Program information<br />
can be found at http://www.colorado.edu/Research/UROP/.<br />
161<br />
Characteristics of SSTs between 23°C <strong>and</strong> 24°C<br />
West of the Galapagos Isl<strong>and</strong>s<br />
<strong>Modeling</strong> Vertical Deformation Associated with the<br />
1931 Mach Earthquake, Pakistan<br />
Meteorological Conditions of Extreme Dust events<br />
in the Chihuahuan Desert region of the United States<br />
<strong>and</strong> Mexico<br />
Name Affiliation Research Mentor Project Title<br />
D<strong>and</strong>avati, Nikhil CIRES Fierer, Noah Comparison of Microbial Enzyme Activities Across a<br />
L<strong>and</strong>-Use Gradient<br />
Seminara, Nicki CIRES Docherty, Ken Analysis of Organic Aerosol Elemental Composition<br />
using a Time of Flight Aerosol Mass Spectromet<br />
Fairchild, Sara CIRES Tucker, Greg River Adjustment to Climate Change: Case study from<br />
the Colorado Front Range
CIRES Personnel breakdown 2006-2007<br />
Category<br />
Appendices: Publications<br />
Personnel Demographics<br />
Total<br />
CIRES<br />
Personnel<br />
162<br />
CIRES Personnel Supported by NOAA<br />
Funding<br />
TOTAL B.S. M.S. Ph.D.<br />
Research Scientist 182 97 97<br />
Visiting Scientist 18 9 9<br />
Postdoctoral Fellow 14 4 4<br />
Associate Scientist 208 114 50 61 3<br />
Administrative 32 21 17 2 2<br />
TOTAL greater than 50% NOAA support 245 67 63 115<br />
Undergraduate Students 44 17<br />
Graduate Students 80 23 21 2<br />
Received less than 50 NOAA support 43 8 2 33<br />
TOTAL 578<br />
Count by OAR Division<br />
CSD 73<br />
PSD 62<br />
GSD 20<br />
GMD 46<br />
TOTAL OAR 201<br />
NESDIS/NGDC 33<br />
NWS/SEC 27<br />
TOTAL NOAA 261<br />
Obtained NOAA employment within the last year 3
Appendices: Publications<br />
Publications from Calendar Year 2006<br />
CIRES scientists <strong>and</strong> faculty published 889 peer-reviewed <strong>and</strong> 177 non-peer-reviewed papers during the preceding<br />
calendar year 1 . The table below tabulates publications by affiliation of first author <strong>and</strong> their peer-review status. The<br />
publication count is only one measure of CIRES‘ impact. Additional information on how CIRES research is<br />
extending the boundaries of scientific knowledge is summarized in the Executive Summary, <strong>and</strong> is also provided in<br />
detail throughout this report .<br />
* Included in peer-reviewed publications<br />
CIRES Lead Author<br />
2001 2002 2003 2004 2005 2006 2007 2008<br />
Peer-<br />
Reviewed<br />
164 112 177 165 188 388<br />
Non-Peer-<br />
Reviewed<br />
* * 100 100 161 80<br />
NOAA Lead Author<br />
2001 2002 2003 2004 2005 2006 2007 2008<br />
Peer-<br />
Reviewed<br />
43 60 31 56 20 121<br />
Non-Peer-<br />
Reviewed<br />
* * 10 43 10 7<br />
Other Lead Author<br />
2001 2002 2003 2004 2005 2006 2007 2008<br />
Peer-<br />
Reviewed<br />
127 110 183 134 145 380<br />
Non-Peer-<br />
Reviewed<br />
* * 24 55 38 90<br />
Refereed Publications Published during Calendar Year 2006<br />
Akmaev R.A., 2006. Does the moon also have a tidal effect on Earth‘s atmosphere? <strong>Scientific</strong> American, 295: no.5,<br />
p.108.<br />
Akmaev, R.A., V.I. Fomichev, X Zhu, 2006. Impact of middle-atmospheric composition changes on greenhouse<br />
cooling in the upper atmosphere. J. Atmos. Sol.-Terr. Phys., 68 (17): p.1879.<br />
Aldener, M., S.S. Brown, H. Stark, E.J. Williams, B.M. Lerner, W.C. Kuster, P.D. Goldan, P.K. Quinn, T.S. Bates,<br />
F.C. Fehsenfeld, A.R. Ravishankara., 2006. Reactivity <strong>and</strong> loss mechanisms of NO3 <strong>and</strong> N2O5 in a polluted<br />
marine environment: Results from in situ measurements during New Engl<strong>and</strong> Air Quality Study 2002. J.<br />
Geophys. Res.-Atmos., 111 (D23): Art. No. D23S73.<br />
Alex<strong>and</strong>er, M., J. Yin, G. Branstator, A. Capotondi, C. Cassou, R. Cullather, Y.O. Kwon, J. Norris, J. Scott, I.<br />
Wainer, 2006. Extratropical atmosphere-ocean variability in CCSM3. J. Clim., 19 (11): p.2496.<br />
Alpert, P., D. Niyogi, R.A. Pielke Sr., J.L. Eastman, Y.K. Xue, S. Raman, 2006. Evidence for carbon dioxide <strong>and</strong><br />
moisture interactions from the leaf cell up to global scales: Perspective on human-caused climate change.<br />
Glob. Planet. Change, 54: http://dx.doi.org/10.1016/j.gloplacha.<br />
Alpert, P., D. Niyogi, R.A. Pielke, J.L. Eastman, Y.K. Xue, S. Raman, 2006. Evidence for carbon dioxide <strong>and</strong><br />
moisture interactions from the leaf cell up to global scales: Perspective on human-caused climate change.<br />
Glob. Planet. Change, 54 (2-Jan): p.202.<br />
Anastasio, C., B.M. Matthew, 2006. A chemical probe technique for the determination of reactive halogen species in<br />
aqueous solution: Part 2 – Chloride solutions <strong>and</strong> mixed bromide/chloride solutions. Atmos. Chem. Phys., 6:<br />
p.2439.<br />
Andersen, S.B., E.C. Weatherhead, A. Stevermer, J. Austin, C. Bruhl, E.L. Fleming, J. de Gr<strong>and</strong>pre, V. Grewe, I.<br />
Isaksen, G. Pitari, R.W. Portmann, B. Rognerud, J.E. Rosenfield, S. Smyshlyaev, T. Nagashima, G.J.M.<br />
1 The large increase in the number of publications in 2006 compared with previous years is in part due to the procedure of downloading the<br />
journal information from ISI. It was assumed that all ISI downloaded journals were peer-reviewed. Otherwise, the field was defined by the<br />
author.<br />
163
Appendices: Publications<br />
Velders, D.K. Weisenstein, J. Xia, 2006. Comparison of recent modeled <strong>and</strong> observed trends in total column<br />
ozone. J. Geophys. Res.-Atmos., 111 (D2): Art. No. D02303.<br />
Anderson, D., A. Anghel, E. Araujo, V. Eccles, C. Valladares, C. Lin, 2006. Theoretically modeling the lowlatitude,<br />
ionospheric response to large geomagnetic storms. Radio Sci., 41 (5): Art. No. RS5S04.<br />
Anderson, D., A. Anghel, J.L. Chau, K. Yumoto, 2006. Global, low-latitude, vertical ExB drift velocities inferred<br />
from daytime magnetometer observations. Space Wea., 4 (8): Art. No. S08003.<br />
Anderson, R.S., P. Molnar, M.A. Kessler, 2006. Features of glacial valley profiles simply explained. J. Geophys.<br />
Res.-Earth Surf., 111 (F1): Art. No. F01004.<br />
Andreas, E.L., K.J. Claffey, R.E. Jordan, C.W. Fairall, P.S. Guest, P.O.G. Persson, A.A. Grachev, 2006. Evaluations<br />
of the von Karman constant in the atmospheric surface layer. J. Fluid Mech., 559: p.117.<br />
Andrews, E, P.J. Sheridan, M. Fiebig, A. McComiskey, J.A. Ogren, P. Arnott, D. Covert, R. Elleman, R. Gasparini,<br />
D. Collins, H. Jonsson, B. Schmid, J. Wang, 2006. Comparison of methods for deriving aerosol asymmetry<br />
parameter. J. Geophys. Res.-Atmos., 111 (D5): Art. No. D05S04.<br />
Angevine, W.M., J. Hare, C.W. Fairall, D.E. Wolfe, R.J. Hill, A. Brewer, A.B. White, 2006. Structure <strong>and</strong> formation<br />
of the highly stable boundary layer over the Gulf of Maine. J. Geophys. Res. - Atmos, 111: doi:<br />
10.1029/2006JD007465.<br />
Angevine, W.M., M. Tjernstrom, M. Zagar, 2006. <strong>Modeling</strong> of the coastal boundary layer <strong>and</strong> pollutant transport in<br />
New Engl<strong>and</strong>. J. Appl. Meteorol. Climatol., 45 (1): p.137.<br />
Araujo-Pradere, E.A., T.J. Fuller-Rowell, P.S.J. Spencer, C.F. Minter, 2006. Differential validation of the USTEC<br />
model. Radio Sci.: doi: 10.1029/2006RS003459.<br />
Araujo-Pradere, E.A., T.J. Fuller-Rowell, P.S.J. Spencer, 2006. Consistent features of TEC changes during<br />
ionospheric storms. J. Atmos. Sol.-Terr. Phys., 68 (16): p.1834.<br />
Aschw<strong>and</strong>e, M.J., L.F. Burlaga, M.L. Kaiser, C.K. Ng, D.V. Reames, M.J. Reiner, T.I. Gombosi, N. Lugaz, W.<br />
Manchester, I.I. Roussev, T.H. Zurbuchen, C.J. Farugia, A.B. Galvin, M.A. Lee, J.A. Linker, Z. Mikic, P.<br />
Riley, D. Alex<strong>and</strong>er, A.W. S<strong>and</strong>man, J.W. Cook, R.A. Howard, D. Odstrcil, V.J. Pizzo, J. Kota, P.C. Liewer,<br />
J.G. Luhmann, B. Inhester, R.W. Schwenn, S.K. Solanki, V.M. Vasyliunas, T. Wiegelmann, L. Blush, P.<br />
Bochsler, I.H. Cairns, P.A. Robinson, V. Bothmer, K. Keckemety, A. Llebaria, M. Maksimovic, M. Scholer,<br />
R.F. Wimmer-Schweingruber, 2006. Theoretical modeling for the STEREO mission. Space Sci. Rev.: doi:<br />
10.1007/s11214-006-9027-8.<br />
Baer, F., H.J. Wang, J.J. Tribbia, A. Fournier, 2006. Climate modeling with spectral elements. Mon. Wea. Rev., 134<br />
(12): p.3610.<br />
Bales, R.C., N.P. Molotch, T.H. Painter, M.D. Dettinger, R. Rice, J. Dozier, 2006. Mountain hydrology of the<br />
western United States. Water Resour. Res., 42 (8): Art. No. W08432.<br />
Balsley, B.B., R.G. Frehlich, M.L. Jensen, Y. Meillier, 2006. High-resolution in situ profiling through the stable<br />
boundary layer: Examination of the SBL top in terms of minimum shear, maximum stratification, <strong>and</strong><br />
turbulence decrease. J. Atmos. Sci., 63 (4): p.1291.<br />
Banta, R., L. Mahrt, D. Vickers, J. Sun, B.B. Balsley, Y.L. Pichugina, E. Williams, 2006. Structure of the lightwind,<br />
very stable boundary layer on nights with weak low-level jets. J. Atmos. Sci., 64: p.1-23.<br />
Banta, R.M., Y.L. Pichugina, W.A. Brewer, 2006. Turbulent velocity-variance profiles in the stable boundary layer<br />
generated by a nocturnal low-level jet. J. Atmos. Sci., 63 (11): p.2700.<br />
Bao, J.W., S.A. Michelson, P.J.; Neiman, F.M. Ralph, J.M. Wilczak, 2006. Interpretation of enhanced integrated<br />
water vapor b<strong>and</strong>s associated with extratropical cyclones: Their formation <strong>and</strong> connection to tropical<br />
moisture. Mon. Wea. Rev., 134 (4): p.1063.<br />
Barry, R.G., 2006. The status of research on glaciers <strong>and</strong> global glacier recession: A review. Prog. Phys. Geogr., 30<br />
(3): p.285.<br />
Barsugli, J.J., S.I. Shin, P.D. Sardeshmukh, 2006. Sensitivity of global warming to the pattern of tropical ocean<br />
warming. Clim. Dyn., 27 (5): p.483.<br />
Bates, T.S., T.L. Anderson, T. Baynard, T. Bond, O. Boucher, G. Carmichael, A. Clarke, C. Erlick, H. Guo, L.<br />
Horowitz, S. Howell, S. Kulkarni, H. Maring, A. McComiskey, A. Middlebrook, K. Noone, C.D. O'Dowd, J.<br />
Ogren, J. Penner, P.K. Quinn, A.R. Ravishankara, D.L. Savoie, S.E. Schwartz, Y. Shinozuka, Y. Tang, R.J.<br />
Weber, Y. Wu, 2006. Aerosol direct radiative effects over the northwest Atlantic, northwest Pacific, <strong>and</strong><br />
North Indian Oceans: Estimates based on in-situ chemical <strong>and</strong> optical measurements <strong>and</strong> chemical transport<br />
modeling. Atmos. Chem. Phys., 6: p.1657.<br />
Baynard, T., R.M. Garl<strong>and</strong>, A.R. Ravishankara, M.A. Tolbert, E.R. Lovejoy, 2006. Key factors influencing the<br />
relative humidity dependence of aerosol light scattering. Geophys. Res. Lett., 33 (6): Art. No. L06813.<br />
164
Appendices: Publications<br />
Beaver, M.R., M.J. Elrod, R.M. Garl<strong>and</strong>, M.A. Tolbert, 2006. Ice nucleation in sulfuric acid/organic aerosols:<br />
implications for cirrus cloud formation. Atmos. Chem. Phys., 6: p.3231.<br />
Becker, T.W., S. Chevrot, V. Schulte-Pelkum, D.K. Blackman, 2006. Statistical properties of seismic anisotropy<br />
predicted by upper mantle geodynamic models. J. Geophys. Res.-Solid Earth, 111 (B8): doi:<br />
10.1029/2005JB004095. Art. No. B08309.<br />
Becker, T.W., V. Schulte-Pelkum, D.K. Blackman, J.B. Kellogg, R.J. O'Connell, 2006. Mantle flow under the<br />
western United States from shear wave splitting. Earth Planet. Sci. Lett., 247 (4-Mar): p.235.<br />
Beirle, S., N. Spichtinger, A. Stohl, K.L. Cummins, T. Turner, D. Boccippio, O.R. Cooper, M. Wenig, M.<br />
Grzegorski, U. Platt, T. Wagner, 2006. Estimating the NOx produced by lightning from GOME <strong>and</strong> NLDN<br />
data: a case study in the Gulf of Mexico. Atmos. Chem. Phys., 6: p.1075.<br />
Bendick, R., S. McClusky, R. Bilham, L. Asfaw, S. Klemperer, 2006. Distributed Nubia-Somalia relative motion<br />
<strong>and</strong> dike intrusion in the Main Ethiopian Rift. Geophys. J. Int., 165 (1): p.303.<br />
Benjamin, D., J. Wahr, R.D. Ray, G.D. Egbert, S.D. Desai, 2006. Constraints on mantle anelasticity from geodetic<br />
observations, <strong>and</strong> implications for the J(2) anomaly. Geophys. J. Int., 165 (1): p.3-16.<br />
Bianco L., B. Tomassetti, E. Coppola, A. Fracassi, M. Verdecchia, G. Visconti, 2006. Thermally driven circulation<br />
in a region of complex topography: Comparison of wind-profiling radar measurements <strong>and</strong> MM5 numerical<br />
predictions. Annales Geophysicae, 24: p.1537.<br />
Bilham, R, 2006. Geophysics - Dangerous tectonics, fragile buildings, <strong>and</strong> tough decisions. Science, 311 (5769):<br />
p.1873.<br />
Bilham, R., 2006. Harry Fielding Reid medal citation for Nicholas Ambrasey. Seismol. Res. Lett., 77 (4): p.487.<br />
Bilham, R., 2006. Citation Harry Fielding Reid Medal to N.N. Ambraseys, Seism. Res. Lett., 77(5): p.599.<br />
Bilham, R., 2006. Harry Fielding Reid medal citation for Nicholas Ambraseys. Seismol. Res. Lett., 77 (5): p.606.<br />
Bilham, R., 2006. Comment on ―Interpreting the style of faulting <strong>and</strong> paleoseismicity associated with the 1897<br />
Shillong, northeast India, earthquake‖ by C.P. Rajendran et al. Tectonics, 25 (2): Art. No. TC2001.<br />
Bindlish, R., T.J. Jackson, A.J. Gasiewski, M. Klein, E.G. Njoku, 2006. Soil moisture mapping <strong>and</strong> AMSR-E<br />
validation using the PSR in SMEX02. Remote Sens. Environ., 103 (2): p.127.<br />
Blomquist, B.W., C.W. Fairall, B.J. Huebert, D.J. Kieber, G.R. Westby, 2006. DMS sea-air transfer velocity: Direct<br />
measurements by eddy covariance <strong>and</strong> parameterization based on the NOAA/COARE gas transfer model.<br />
Geophys. Res. Lett., 33 (7): Art. No. L07601.<br />
Boulter, J.E., D.J. Cziczo, A.M. Middlebrook, D.S. Thomson, D.M. Murphy, 2006. Design <strong>and</strong> performance of a<br />
pumped counterflow virtual impactor. Aerosol Sci. Technol., 40 (11): p.969.<br />
Bousquet, P., P. Ciais, J.B. Miller, E.J. Dlugokencky, D.A. Hauglustaine, C. Prigent, G.R. Van der Werf, P. Peylin,<br />
E.G. Brunke, C. Carouge, R.L. Langenfelds, J. Lathiere, F. Papa, M. Ramonet, M. Schmidt, L.P. Steele, S.C.<br />
Tyler, J. White, 2006. Contribution of anthropogenic <strong>and</strong> natural sources to atmospheric methane variability.<br />
Nature, 443 (7110): p.439.<br />
Box, J.E., D.H. Bromwich, B.A. Veenhuis, L.S. Bai, J.C. Stroeve, J.C. Rogers, K. Steffen, T. Haran, S.H. Wang,<br />
2006. Greenl<strong>and</strong> ice sheet surface mass balance variability (1988-2004) from calibrated polar MM5 output. J.<br />
Clim., 19 (12): p.2783.<br />
Bradley, R.S., M. Vuille, H.F. Diaz, W. Vergara, 2006. Threats to water supplies in the tropical Andes. Science, 312<br />
(5781): p.1755.<br />
Brasseur, G.P., M. Schultz, C. Granier, M. Saunois, T. Diehl, M. Botzet, E. Roeckner, S. Walters, 2006. Impact of<br />
climate change on the future chemical composition of the global troposphere. J. Clim., 19 (16): p.3932.<br />
Brioude, J., J.P. Cammas, O.R. Cooper, 2006. Stratosphere-troposphere exchange in a summertime extratropical<br />
low: Analysis. Atmos. Chem. Phys., 6: p.2337.<br />
Brown, J., I. Simmonds, D. Noone, 2006. <strong>Modeling</strong> δO -18 in tropical precipitation <strong>and</strong> the surface ocean for presentday<br />
climate. J. Geophys. Res.-Atmos., 111 (D5): Art. No. D05105.<br />
Brown, S.S., J.A. Neuman, T.B. Ryerson, M. Trainer, W.P. Dube, J.S. Holloway, C. Warneke, J.A. de Gouw, S.G.<br />
Donnelly, E. Atlas, B. Matthew, A.M. Middlebrook, R. Peltier, R.J. Weber, A. Stohl, J.F. Meagher, F.C.<br />
Fehsenfeld, A.R. Ravishankara, 2006. Nocturnal odd-oxygen budget <strong>and</strong> its implications for ozone loss in the<br />
lower troposphere. Geophys. Res. Lett., 33 (8): Art. No. L08801.<br />
Brown, S.S., T.B. Ryerson, A.G. Wollny, C.A. Brock, R. Peltier, A.P. Sullivan, R.J. Weber, W.P. Dube, M. Trainer,<br />
J.F. Meagher, F.C. Fehsenfeld, A.R. Ravishankara, 2006. Variability in nocturnal nitrogen oxide processing<br />
<strong>and</strong> its role in regional air quality. Science, 311 (5757): p.67.<br />
Bruinsma, S., J.M. Forbes, R.S. Nerem, X.L. Zhang, 2006. Thermosphere density response to the 20-21 November<br />
2003 solar <strong>and</strong> geomagnetic storms from CHAMP <strong>and</strong> GRACE accelerometer data. J. Geophys. Res-Space<br />
Phys., 111 (A6): Art. No. A06303.<br />
165
Appendices: Publications<br />
Capotondi, A., A.Wittenberg, S. Masina, 2006. Spatial <strong>and</strong> temporal structure of Tropical Pacific interannual<br />
variability in 20th century coupled simulations. Ocean Model., 15: p.274.<br />
Cappa, C.D., J.D. Smith, B.M. Messer, R.C. Cohen, R.J. Saykally, 2006. The electronic structure of the hydrated<br />
proton: a comparative X-ray absorption study of aqueous HCl <strong>and</strong> NaCl solutions. J. Phys. Chem. B, 110:<br />
p.1166.<br />
Cappa, C.D., J.D. Smith, B.M. Messer, R.C. Cohen, R.J. Saykally, 2006. Effects of cations on the hydrogen bond<br />
network of liquid water: New results from X-ray absorption spectroscopy of liquid microjets. J. Phys. Chem.<br />
B, 110: p.5301.<br />
Carrera, P., J.H. Churnside, G. Boyra, V. Marques, C. Scalabrin, A. Uriarte, 2006. Comparison of airborne lidar<br />
with echosounders: a case study in the coastal Atlantic waters of southern Europe. ICES J. Mar. Sci., 63 (9):<br />
p.1736.<br />
Cassano, E.N., A.H. Lynch, J.J. Cassano, M.R. Koslow, 2006. Classification of synoptic patterns in the western<br />
Arctic associated with extreme events at Barrow, Alaska, USA. Clim. Res., 30 (2): p.83.<br />
Cassano, J.J., P. Uotila, A. Lynch, 2006. Changes in synoptic weather patterns in the polar regions in the twentieth<br />
<strong>and</strong> twenty-first centuries, Part 1: Arctic. Int. J. Climatol., 26 (8): p.1027.<br />
Catania, G.A., H. Conway, C.F. Raymond, T.A. Scambos, 2006. Evidence for floatation or near floatation in the<br />
mouth of Kamb Ice Stream, West Antarctica, prior to stagnation. J. Geophys. Res.-Earth Surf., 111 (F1): Art.<br />
No. F01005.<br />
Catania, G.A., T.A. Scambos, H. Conway, C.F. Raymond, 2006. Sequential stagnation of Kamb Ice Stream, West<br />
Antarctica. Geophys. Res. Lett., 33 (14): Art. No. 14502.<br />
Cavalieri, D.J., T. Markus, D.K. Hall, A. Gasiewski, M. Klein, A. Ivanoff, 2006. Assessment of EOS Aqua AMSR-<br />
E Arctic sea ice concentrations using L<strong>and</strong>sat 7 <strong>and</strong> airborne microwave imagery. IEEE Trans. Geosci. Rem.<br />
Sens., 44: p.3057.<br />
Champagnac, J.D., B. Delacou, P. Tricart, C. Sue, M. Burkhard, C. Allanic, 2006. Regional brittle extension in<br />
Quaternary sediments of Lanslebourg (Haute-Maurienne valley, Western Alps). Bull. Soc. Geol. Fr., 177 (4):<br />
p.215.<br />
Champagnac, J.D., C. Sue, B. Delacou, P. Tricart, C. Allanic, M. Burkhard, 2006. Miocene lateral extrusion in the<br />
inner western Alps revealed by dynamic fault analysis. Tectonics, 25 (3): Art. No. TC3014.<br />
Ch<strong>and</strong>, T.R.K., K.V. Badarinath, V.K. Prasad, M.S.R. Murthy, C.D. Elvidge, B.T. Tuttle, 2006. Monitoring forest<br />
fires over the Indian region using Defense Meteorological Satellite Program-Operational Linescan System<br />
nighttime satellite data. Remote Sens. Environ., 103 (2): p.165.<br />
Charnotskii, M.I., I.M. Fuks, K.A. Naugol'nykh, A.V. Smirnov, D. Di Iorio, I.B. Esipov, 2006. An experimental test<br />
of the dual-frequency method for monitoring transverse currents. Acoust. Phys., 52 (2): p.222.<br />
Chase, T.N., K. Wolter, R.A. Pielke Sr., I. Rasool, 2006. Was the 2003 European summer heat wave unusual in a<br />
global context? Geophys. Res. Lett., 33: doi: 10.1029/2006GL027470.<br />
Chen, B.Z., J.M. Chen, P.P. Tans, L. Huang, 2006. Simulating dynamics of δC -13 of CO2 in the planetary boundary<br />
layer over a boreal forest region: covariation between surface fluxes <strong>and</strong> atmospheric mixing. Tellus Ser. B,<br />
58 (5): p.537.<br />
Chhak, K.C., A.M. Moore, R.F. Milliff, G. Branstator, W.R. Holl<strong>and</strong>, M. Fisher, 2006. Stochastic forcing of the<br />
North Atlantic wind-driven ocean circulation. Part I: A diagnostic analysis of the ocean response to stochastic<br />
forcing. J. Phys. Oceanogr., 36 (3): p.300.<br />
Chhak, K.C., A.M. Moore, R.F. Milliff, G. Branstator, W.R. Holl<strong>and</strong>, M. Fisher, 2006. Stochastic forcing of the<br />
North Atlantic wind-driven ocean circulation. Part II: An analysis of the dynamical ocean response using<br />
generalized stability theory. J. Phys. Oceanogr., 36 (3): p.316.<br />
Chshyolkova, T., A.H. Manson, C.E. Meek, S.K. Avery, D. Thorsen, J.W. MacDougall, W. Hocking, Y. Murayama,<br />
K. Igarashi, 2006. Planetary wave coupling processes in the middle atmosphere (30-90 km): A study<br />
involving MetO <strong>and</strong> MFR data. J. Atmos. Sol.-Terr. Phys., 68 (5-Mar): p.353.<br />
Chu, X.Z., P.J. Espy, G.J. Nott, J.C. Diettrich, C.S. Gardner, 2006. Polar mesospheric clouds observed by an iron<br />
Boltzmann lidar at Rothera (67.5°S, 68.0°W), Antarctica from 2002 to 2005: Properties <strong>and</strong> implications. J.<br />
Geophys. Res.-Atmos., 111 (D20): Art. No. D20213.<br />
Chudinova, S.M., O.W. Frauenfeld, R.G. Barry, T.J. Zhang, V.A. Sorokovikov, 2006. Relationship between air <strong>and</strong><br />
soil temperature trends <strong>and</strong> periodicities in the permafrost regions of Russia. J. Geophys. Res.-Earth Surf.,<br />
111 (F2): Art. No. F02008.<br />
Churnside, J.H., J.J. Wilson, 2006. Power spectrum <strong>and</strong> fractal dimension of laser backscattering from the ocean. J.<br />
Opt. Soc. Am. A-Opt. Image Sci. Vis., 23 (11): p.2829.<br />
166
Appendices: Publications<br />
Cimini, D., T.J. Hewison, L. Martin, 2006. Comparison of brightness temperatures observed from ground-based<br />
microwave radiometers during TUC. Meteorol. Z., 15 (1): p.19.<br />
Cimini, D., T.J. Hewison, L. Martin, J. Guldner, C. Gaffard, F.S. Marzano, 2006. Temperature <strong>and</strong> humidity profile<br />
retrievals from ground-based microwave radiometers during TUC. Meteorol. Z., 15 (1): p.45.<br />
Clark, M., A.G. Slater, A.P. Barrett, L.E. Hay, G.J. McCabe, B. Rajagopalan, G. Leavesley, 2006. Assimilation of<br />
snow covered area information into hydrologic <strong>and</strong> l<strong>and</strong>-surface models. Adv. Water Resources, 29: p.1209.<br />
Clark, M.P., A.G. Slater, 2006. Probabilistic quantitative precipitation estimation in complex terrain. J.<br />
Hydrometeorol., 7 (1): 33: p.3-22.<br />
Clark, M.P., J.A. Vrugt, 2006. Unraveling uncertainties in hydrologic model calibration: Addressing the problem of<br />
compensatory parameters. Geophys. Res. Lett., 33 (6): Art. No. L06406.<br />
Clevis, Q., G.E.Tucker, S.T. Lancaster, A. Desitter, N. Gasparini, G. Lock, 2006. A simple algorithm for the<br />
mapping of TIN data onto a static grid: Applied to the stratigraphic simulation of river me<strong>and</strong>er deposits.<br />
Computers <strong>and</strong> Geosciences, 32: p.749.<br />
Clevis, Q., G.E. Tucker, G. Lock, S.T. Lancaster, N. Gasparini, A. Desitter, R.L. Brass, 2006. Geoarchaeological<br />
simulation of me<strong>and</strong>ering river deposits <strong>and</strong> settlement distributions: A three-dimensional approach.<br />
Geoarchaeology, 21 (8): p.843.<br />
Collins, W.D., V. Ramaswamy, M.D. Schwarzkopf, Y. Sun, R.W. Portmann, Q. Fu, S.E.B. Casanova, J.L. Dufresne,<br />
D.W. Fillmore, P.M.D. Forster, V.Y. Galin, L.K. Gohar, W.J. Ingram, D.P. Kratz, M.P. Lefebvre, J. Li, P.<br />
Marquet, V. Oinas, Y. Tsushima, T. Uchiyama, W.Y. Zhong, 2006. Radiative forcing by well-mixed<br />
greenhouse gases: Estimates from climate models in the Intergovernmental Panel on Climate Change (IPCC)<br />
Fourth Assessment Report (AR4). J. Geophys. Res.-Atmos., 111 (D14): Art. No. D14317.<br />
Compo, G.P., J.S. Whitaker, P.D. Sardeshmukh, 2006. Feasibility of a 100-year reanalysis using only surface<br />
pressure data. Bull. Amer. Meteorol. Soc., 87 (2): p.175.<br />
Cooper, O.R., A. Stohl, M. Trainer, A.M. Thompson, J.C. Witte, S.J. Oltmans, G. Morris, K.E. Pickering, J.H.<br />
Crawford, G. Chen, R.C. Cohen, T.H. Bertram, P. Wooldridge, A. Perring, W.H. Brune, J. Merrill, J.L.<br />
Moody, D. Tarasick, P. Nedelec, G. Forbes, M.J. Newchurch, F.J. Schmidlin, B.J. Johnson, S. Turquety, S.L.<br />
Baughcum, X. Ren, F.C. Fehsenfeld, J.F. Meagher, N. Spichtinger, C.C. Brown, S.A. McKeen, I.S.<br />
McDermid, T. Leblanc, 2006. Large upper tropospheric ozone enhancements above midlatitude North<br />
America during summer: In situ evidence from the IONS <strong>and</strong> MOZAIC ozone measurement network. J.<br />
Geophys. Res.-Atmos., 111 (D24): Art. No. D24S05.<br />
Corti, T., B.P. Luo, Q. Fu, H. Vomel, T. Peter, 2006. The impact of cirrus clouds on tropical troposphere-tostratosphere<br />
transport. Atmos. Chem. Phys., 6: p.2539.<br />
Cowie, P.A., M. Attal, G.E. Tucker, A.C. Whittaker, M. Naylor, A. Ganas, G.P. Roberts, 2006. Investigating the<br />
surface process response to fault interaction <strong>and</strong> linkage using a numerical modelling approach. Basin Res.,<br />
18 (3): p.231.<br />
Crevoisier, C., M. Gloor, E. Gloaguen, L.W. Horowitz, J.L. Sarmiento, C. Sweeney, P.P. Tans, 2006. A direct<br />
carbon budgeting approach to infer carbon sources <strong>and</strong> sinks. Design <strong>and</strong> synthetic application to complement<br />
the NACP observation network. Tellus Ser. B-Chem. Phys. Meteorol., 58 (5): p.366.<br />
Cronin, G., W.M. Lewis, M.A. Schiehser, 2006. Influence of freshwater macrophytes on the littoral ecosystem<br />
structure <strong>and</strong> function of a young Colorado reservoir. Aquat. Bot., 85 (1): p.37.<br />
Cronin, M.F., N.A. Bond, C.W. Fairall, R.A. Weller, 2006. Surface cloud forcing in the East Pacific stratus<br />
deck/cold tongue/ITCZ complex. J. Clim., 19 (3): p.392.<br />
Cronin, M.F., C.W. Fairall, M.J. McPhaden, 2006. An assessment of buoy-derived <strong>and</strong> numerical weather prediction<br />
surface heat fluxes in the tropical Pacific. J. Geophys. Res.-Oceans, 111 (C6): Art. No. C06038.<br />
Cubison, M.J., M.R. Alfarra, J. Allan, K.N. Bower, H. Coe, G.B. McFiggans, J.D. Whitehead, P.I. Williams, Q.<br />
Zhang, J.L. Jiménez, J. Hopkins, J. Lee, 2006. The characterisation of pollution aerosol in a changing<br />
photochemical environment. Atmos. Chem. Phys., 6: p.5573.<br />
Cullen, N.J., T. Molg, G. Kaser, K. Hussein, K. Steffen, D.R. Hardy, 2006. Kilimanjaro Glaciers: Recent areal<br />
extent from satellite data <strong>and</strong> new interpretation of observed 20th century retreat rates. Geophys. Res. Lett., 33<br />
(16): Art. No. L16502.<br />
Cullen, N.J., K. Steffen, P.D. Blanken, 2006. Nonstationarity of Turbulent Heat Fluxes at Summit, Greenl<strong>and</strong>.<br />
Bound.-Layer Meteor., DOI 10.1007/s10546-006-9112-2.<br />
Curtius, J., E.R. Lovejoy, K.D. Froyd, 2006. Atmospheric ion-induced aerosol nucleation. Space Sci. Rev., 125 (4-<br />
Jan): p.159.<br />
167
Appendices: Publications<br />
Cziczo, D.J., D.S. Thomson, T.L. Thompson, P.J. DeMott, D.M. Murphy, 2006. Particle analysis by laser mass<br />
spectrometry (PALMS) studies of ice nuclei <strong>and</strong> other low number density particles. Int. J. Mass Spectrom.,<br />
258 (3-Jan): p.21.<br />
Dai, M., T.E. Arbetter, W.N. Meier, 2006. Data assimilation of sea-ice motion vectors: Sensitivity to the<br />
parameterization of sea-ice strength. Annals of Glaciology, 44: p.357.<br />
Daniel, J.S., R.W. Portmann, H.L. Miller, S. Solomon, A.O. Langford, C.S. Eubank, R. Schofield, D.D. Turner,<br />
M.D. Shupe, 2006. Cloud property estimates from zenith spectral measurements of scattered sunlight between<br />
0.9 <strong>and</strong> 1.7 mu m. J. Geophys. Res.-Atmos., 111 (D16): Art. No. D16208.<br />
Darby, L.S., K.J. Allwine, R.M. Banta, 2006. Nocturnal low-level jet in a mountain basin complex. Part II:<br />
Transport <strong>and</strong> diffusion of tracer under stable conditions. J. Appl. Meteorol. Climatol., 45 (5): p.740.<br />
Darby, L.S., G.S. Poulos, 2006. The evolution of lee-wave-rotor activity in the lee of Pikes Peak under the influence<br />
of a cold frontal passage: Implications for aircraft safety. Mon. Weather Rev., 134 (10): p.2857.<br />
Davey, C.A., R.A. Pielke, K.P. Gallo, 2006. Differences between near-surface equivalent temperature <strong>and</strong><br />
temperature trends for the Eastern United States - Equivalent temperature as an alternative measure of heat<br />
content. Glob. Planet. Change, 54 (2-Jan): p.19.<br />
de Gouw, J.A., C. Warneke, A. Stohl, A.G. Wollny, C.A. Brock, O.R. Cooper, J.S. Holloway, M. Trainer, F.C.<br />
Fehsenfeld, E.L. Atlas, S.G. Donnelly, V. Stroud, A. Lueb, 2006. Volatile organic compounds composition of<br />
merged <strong>and</strong> aged forest fire plumes from Alaska <strong>and</strong> western Canada. J. Geophys. Res.-Atmos., 111 (D10):<br />
Art. No. D10303.<br />
de Koning, C.A., J.T. Gosling, R.M. Skoug, J.T. Steinberg, 2006. Widths of suprathermal pitch-angle distributions<br />
during solar electron bursts: ACE observations. J. Geophys. Res., 111: 10.1029/2005JA011326.<br />
DeCarlo, P.F., J.R. Kimmel, A. Trimborn, M.J. Northway, J.T. Jayne, A.C. Aiken, M. Gonin, K. Fuhrer, T. Horvath,<br />
K.S. Docherty, D.R. Worsnop, J.L. Jiménez, 2006. Field-deployable, high-resolution, time-of-flight aerosol<br />
mass spectrometer. Anal. Chem., 78 (24): p.8281.<br />
del Rio, C.M.R., 2006. Changes in understory composition following catastrophic windthrow <strong>and</strong> salvage logging in<br />
a subalpine forest ecosystem. Can. J. For. Res.-Rev. Can. Rech., 36 (11): p.2943.<br />
Desai, A.R., K.J. Davis, C.J. Senff, S. Ismail, E.V. Browell, D.R. Stauffer, B.P. Reen, 2006. A case study on the<br />
effects of heterogeneous soil moisture on mesoscale boundary-layer structure in the Southern Great Plains,<br />
USA Part I: Simple prognostic model. Bound.-Layer Meteor., 119 (2): p.195.<br />
Deser, C., A. Capotondi, R. Saravanan, A.S. Phillips, 2006. Tropical Pacific <strong>and</strong> Atlantic climate variability in<br />
CCSM3. J. Clim., 19 (11): p.2451.<br />
Detman, T., M. Smith, C.D. Dryer, C.N. Fry, C.N. Arge, V. Pizzo, 2006. A hybrid heliospheric modeling system:<br />
Background solar wind. J. Geophys. Res-Space Phys., 111 (A7): Art. No. A07102.<br />
Diettrich, J.C., G.J. Nott, P.J. Espy, X.Z. Chu, D. Riggin, 2006. Statistics of sporadic iron layers <strong>and</strong> relation to<br />
atmospheric dynamics. J. Atmos. Sol.-Terr. Phys., 68 (1): p.102.<br />
Donaldson, D.J., V. Vaida, 2006. The influence of organic films at the air-aqueous boundary on atmospheric<br />
processes. Chem. Rev., 106 (4): p.1445.<br />
Douglas, E.M., D. Niyogi, S. Frolking, J.B. Yeluripati, R. A. Pielke Sr., N. Niyogi, C.J. Vörösmarty, U.C. Mohanty,<br />
2006. Changes in moisture <strong>and</strong> energy fluxes due to agricultural l<strong>and</strong> use <strong>and</strong> irrigation in the Indian<br />
Monsoon Belt. Geophys. Res. Lett., 33: doi: 10.1029/2006GL026550.<br />
Douglas, E.M., D. Niyogi, S. Frolking, J.B. Yeluripati, R.A. Pielke, N. Niyogi, C.J. Vorosmarty, U.C. Mohanty,<br />
2006. Changes in moisture <strong>and</strong> energy fluxes due to agricultural l<strong>and</strong> use <strong>and</strong> irrigation in the Indian<br />
Monsoon Belt. Geophys. Res. Lett., 33 (14): Art. No. L14403.<br />
Drobot, S., J. Maslanik, U.C. Herzfeld, C. Fowler, W.L. Wu, 2006. Uncertainty in temperature <strong>and</strong> precipitation<br />
datasets over terrestrial regions of the Western Arctic. Earth Interact., 10: Art. No. 23.<br />
Drobot, S.D., J.A. Maslanik, C. Fowler, 2006. A long-range forecast of Arctic summer sea-ice minimum extent.<br />
Geophys. Res. Lett., 33 (10): Art. No. L10501.<br />
Dube, W.P., S.S. Brown, H.D. Osthoff, M.R. Nunley, S.J. Ciciora, M.W. Paris, R.J. McLaughlin, A.R.<br />
Ravishankara, 2006. Aircraft instrument for simultaneous, in situ measurement of NO3 <strong>and</strong> N2O5 via pulsed<br />
cavity ring-down spectroscopy. Rev. Sci. Instrum., 77 (3): Art. No. 34101.<br />
Duck, T.J., B.J. Firanski, D.B. Millet, A.H. Goldstein, J. Allan, R. Hozinger, D.R. Worsnop, A.B. White, A. Stohl,<br />
C.S. Dickinson, A.V. Donkelaar, 2006. Transport of forest fire emissions from Alaska <strong>and</strong> the Yukon<br />
Territory to Nova Scotia during Summer 2004. J. Geophys. Res. - Atmos, vol.112. D10544, DOI;<br />
10.1092/2006Jd007716.<br />
Dunlea, E.J., S.C. Herndon, D.D. Nelson, R.M. Volkamer, B.K. Lamb, E.J. Allwine, M. Grutter, C.R.R. Villegas, C.<br />
Marquez, S. Blanco, B. Cardenas, C.E. Kolb, L.T. Molina, M.J. Molina, 2006. Technical note: Evaluation of<br />
168
Appendices: Publications<br />
st<strong>and</strong>ard ultraviolet absorption ozone monitors in a polluted urban environment. Atmos. Chem. Phys., 6:<br />
p.3163.<br />
Dutton, E.G., D.W. Nelson, R.S. Stone, D. Longenecker, G. Carbaugh, J.M. Harris, J. Wendell, 2006. Decadal<br />
variations in surface solar irradiance as observed in a globally remote network. J. Geophys. Res.-Atmos., 111<br />
(D19): Art. No. D19101.<br />
Eakins, B.W., J. E. Robinson, 2006. Submarine geology of Hana Ridge <strong>and</strong> Haleakala Volcano‘s northeast flank,<br />
Maui. J. Volcanol. Geothermal Res., 151: p.229.<br />
Edwards, D.P., G. Petron, P.C. Novelli, L.K. Emmons, J.C. Gille, J.R. Drummond, 2006. Southern Hemisphere<br />
carbon monoxide interannual variability observed by Terra/Measurement of Pollution in the Troposphere<br />
(MOPITT). J. Geophys. Res.-Atmos., 111 (D16): Art. No. D16303.<br />
Eisele, F.L., E.R. Lovejoy, E. Kosciuch, K.F. Moore, R.L. Mauldin, J.N. Smith, P.H. McMurry, K. Iida, 2006.<br />
Negative atmospheric ions <strong>and</strong> their potential role in ion-induced nucleation. J. Geophys. Res.-Atmos., 111<br />
(D4): Art. No. D04305.<br />
Engl<strong>and</strong>, S.L., S. Maus, T.J. Immel, S.B. Mende, 2006. Longitudinal variation of the E-region electric fields caused<br />
by atmospheric tides. Geophys. Res. Lett., 33 (21): Art. No. L21105.<br />
Fairall, C.W., L. Bariteau, A.A. Grachev, R.J. Hill, D.E. Wolfe, W.A. Brewer, S.C. Tucker, J.E. Hare, W.M.<br />
Angevine, 2006. Turbulent bulk transfer coefficients <strong>and</strong> ozone deposition velocity in the International<br />
Consortium for Atmospheric Research into Transport <strong>and</strong> Transformation. J. Geophys. Res.-Atmos., 111<br />
(D23): Art. No. D23S20.<br />
Fall R., D.B. Kearns, T. Nguyen, 2006. A defined medium to investigate sliding motility in a Bacillus subtilis<br />
flagella-less mutant. BMC Microbiol., 6 (MAR 17): Art. No.31.<br />
Farmer, G.L., K. Licht, R.J. Swope, J. Andrews, 2006. Isotopic constraints on the provenance of fine-grained<br />
sediment in LGM tills from the Ross Embayment, Antarctica. Earth Planet. Sci. Lett., 249 (2-Jan): p.90.<br />
Fast, J.D., W.I. Gustafson, R.C. Easter, R.A. Zaveri, J.C. Barnard, E.G. Chapman, G.A. Grell, S.E. Peckham, 2006.<br />
Evolution of ozone, particulates, <strong>and</strong> aerosol direct radiative forcing in the vicinity of Houston using a fully<br />
coupled meteorology-chemistry-aerosol model. J. Geophys. Res.-Atmos., 111 (D21): Art. No. D21305.<br />
Fehsenfeld, F.C., G. Ancellet, T.S. Bates, A.H. Goldstein, R.M. Hardesty, R. Honrath, K.S. Law, A.C. Lewis, R.<br />
Leaitch, S. McKeen, J. Meagher, D.D. Parrish, A.A.P. Pszenny, P.B. Russell, H. Schlager, J. Seinfeld, R.<br />
Talbot, R. Zbinden, 2006. International Consortium for Atmospheric Research on Transport <strong>and</strong><br />
Transformation (ICARTT): North America to Europe – Overview of the 2004 summer field study. J.<br />
Geophys. Res.-Atmos., 111 (D23): Art. No. D23S01.<br />
Feierabend, K.J., D.K. Havey, S.S. Brown, V. Vaida, 2006. Experimental absolute intensities of the 4 9 <strong>and</strong> 5 9 O-<br />
H stretching overtones of H2SO4. Chem. Phys. Lett., 420: p.438.<br />
Feierabend, K.J., D.K. Havey, M.E. Varner, J.F. Stanton, V. Vaida, 2006. A comparison of experimental <strong>and</strong><br />
calculated spectra of HNO3 in the near-infrared using Fourier transform infrared spectroscopy <strong>and</strong> vibrational<br />
perturbation theory. J. Chem. Phys., 124 (12): Art. No. 124323.<br />
Feingold, G., R. Furrer, P. Pilewskie, L.A. Remer, Q.L. Min, H. Jonsson, 2006. Aerosol indirect effect studies at<br />
Southern Great Plains during the May 2003 Intensive Operations Period. J. Geophys. Res.-Atmos., 111 (D5):<br />
Art. No. D05S14.<br />
Feldl, N., R. Bilham, 2006. Great Himalayan earthquakes <strong>and</strong> the Tibetan plateau. Nature, 444 (7116): p.165.<br />
Ferrare, R., G. Feingold, S. Ghan, J. Ogren, B. Schmid, S.E. Schwartz, P. Sheridan, 2006. Preface to special section:<br />
Atmospheric Radiation Measurement Program May 2003 Intensive Operations Period examining aerosol<br />
properties <strong>and</strong> radiative influences. J. Geophys. Res.-Atmos., 111 (D5): Art. No. D05S01.<br />
Ferrare, R., D. Turner, M. Clayton, B. Schmid, J. Redemann, D. Covert, R. Elleman, J. Ogren, E. Andrews, J.E.M.<br />
Goldsmith, H. Jonsson, 2006. Evaluation of daytime measurements of aerosols <strong>and</strong> water vapor made by an<br />
operational Raman lidar over the Southern Great Plains. J. Geophys. Res.-Atmos., 111 (D5): Art. No.<br />
D05S08.<br />
Ferretti, D.F., J.B. Miller, J.W.C. White, K.R. Lassey, D.C. Lowe, D.M. Etheridge, 2006. Stable isotopes provide<br />
revised global limits of aerobic methane emissions from plants. Atmos. Chem. Phys. Disc., 6: p.5867.<br />
Fiebig, M., J.A. Ogren, 2006. Retrieval <strong>and</strong> climatology of the aerosol asymmetry parameter in the NOAA aerosol<br />
monitoring network. J. Geophys. Res.-Atmos., 111 (D21): Art. No. D21204.<br />
Fierer, N., B.P. Colman, J.P. Schimel, R.B. Jackson, 2006. Predicting the temperature dependence of microbial<br />
respiration in soil: A continental-scale analysis. Glob. Biogeochem. Cycle, 20 (3): Art. No. GB3026.<br />
Fierer, N., R.B. Jackson, 2006. The diversity <strong>and</strong> biogeography of soil bacterial communities. Proc. Natl. Acad. Sci.<br />
U. S. A., 103 (3): p.626.<br />
169
Appendices: Publications<br />
Finzi, A.C., D.J.P. Moore, E.H. DeLucia, J. Lichter, K.S. Hofmockel, R.B. Jackson, H.-S. Kim, R. Matamala, H.R.<br />
McCarthy, R. Oren, J.S. Pippen, W.H. Schlesinger, 2006. Progressive nitrogen limitation of ecosystem<br />
processed under elevated CO2 in a warm-temperate forest. Ecology, 87: p.15.<br />
Fioletov, V.E., D.W. Tarasick, I. Petropavlovskikh, 2006. Estimating ozone variability <strong>and</strong> instrument uncertainties<br />
from SBUV (/2), ozonesonde, Umkehr, <strong>and</strong> SAGE II measurements: Short-term variations. J. Geophys. Res.-<br />
Atmos., 111 (D2): Art. No. D02305.<br />
Fiore, A.M., L.W. Horowitz, E.J. Dlugokencky, J.J. West, 2006. Impact of meteorology <strong>and</strong> emissions on methane<br />
trends, 1990-2004. Geophys. Res. Lett., 33 (12): Art. No. L12809.<br />
Flad, J.E., S.S. Brown, J.B. Burkholder, H. Stark, A.R. Ravishankara, 2006. Absorption cross sections for à 2 A<br />
(0,9 0 2 1<br />
,0) A (0,0 ,0) b<strong>and</strong> of the HCO radical. Phys. Chem. Chem. Phys., 8 (31): p.3636.<br />
Forsyth, R.J., V. Bothmer, C. Cid, N.U. Crooker, T.S. Horbury, K. Kecskemety, B. Klecker, J.A. Linker, D.<br />
Odstrcil, M.J. Reiner, I.G. Richarson, J. Rodriguez-Pacheco, J.M. Schmidt, R.F. Wimmer-Schweingruber,<br />
2006. ICMEs in the inner heliosphere: Origin, evolution <strong>and</strong> propagation effects. Space Sci. Rev., 123: p.383.<br />
Foster, J., R. Kelly, A. Rango, R. Armstrong, E.F. Erbe, C. Pooley, W.P. Wergin, 2006. Use of low-temperature<br />
scanning electron microscopy to compare <strong>and</strong> characterize three classes of snow cover. Scanning, 28 (4):<br />
p.191.<br />
Frank, W.M., P.E. Roundy, 2006. The role of tropical waves in tropical cyclogenesis. Mon. Wea. Rev., 134 (9):<br />
p.2397.<br />
Frehlich, R., 2006. Adaptive data assimilation including the effect of spatial variations in observation error. Q. J. R.<br />
Meteorol. Soc., 132 (617): p.1225.<br />
Frehlich, R., Y. Meillier, M.L. Jensen, B. Balsley, R. Sharman, 2006. Measurements of boundary layer profiles in an<br />
urban environment. J. Appl. Meteorol. Climatol., 45 (6): p.821.<br />
Fritz, D.E., G.L. Farmer, E.P. Verplanck, 2006. Application of Sr isotopes in secondary silicate minerals to<br />
paleogroundwater hydrology: An example from K-metasomatized rocks in the western U.S. Chem. Geol.,<br />
235: p.276.<br />
Frost, G.J., S.A. McKeen, M. Trainer, T.B. Ryerson, J.A. Neuman, J.M. Roberts, A. Swanson, J.S. Holloway, D.T.<br />
Sueper, T. Fortin, D.D. Parrish, F.C. Fehsenfeld, F. Flocke, S.E. Peckham, G.A. Grell, D. Kowal, J.<br />
Cartwright, N. Auerbach, T. Habermann, 2006. Effects of changing power plant NOx emissions on ozone in<br />
the eastern United States: Proof of concept. J. Geophys. Res.-Atmos., 111 (D12): Art. No. D12306.<br />
Fuks, I.M., 2006. Diffraction corrections to fields specularly reflected by a smooth 2-D surface. IEEE Trans.<br />
Antennas Propag., 54 (10): p.2703.<br />
Fuks, I.M., M.I. Charnotskii, 2006. Statistics of specular points at a r<strong>and</strong>omly rough surface. J. Opt. Soc. Am. A-Opt.<br />
Image Sci. Vis., 23 (1): p.73.<br />
Fuller-Rowell, T., E. Araujo-Pradere, C. Minter, M. Codrescu, P. Spencer, D. Robertson, A.R. Jacobson, 2006. US-<br />
TEC: A new data assimilation product from the Space Environment Center characterizing the ionospheric<br />
total electron content using real-time GPS data. Radio Sci., 41 (6): doi: 10.1029/2005RS003393 Art. No.<br />
RS6003.<br />
Fuller-Rowell, T.J, M.V. Codrescu, C.F. Minter, D. Strickl<strong>and</strong>, 2006. Application of thermospheric general<br />
circulation models for space weather operations. Adv. Space Res., 37 (2): p.401.<br />
Gaffard, C., L. Bianco, V. Klaus, M. Matabuena, 2006. Evaluation of moments calculated from wind profiler<br />
spectra: A comparison between five different processing techniques. Meteorologische Zeitschrift, 15: p.73.<br />
Gallar, C., C.A. Brock, J.L. Jiménez, C. Simons, 2006. A variable supersaturation condensation particle sizer.<br />
Aerosol Sci. Technol., 40 (6): p.431.<br />
Gamblin, B., O.B. Toon, M.A. Tolbert, Y. Kondo, N. Takegawa, H. Irie, M. Koike, J.O. Ballenthin, D.E. Hunton,<br />
T.M. Miller, A.A. Viggiano, B.E. Anderson, M. Avery, G.W. Sachse, J.R. Podolske, K. Guenther, C.<br />
Sorenson, M.J. Mahoney, 2006. Nitric acid condensation on ice: 1. Non-HNO3 constituent of NOY<br />
condensing cirrus particles on upper tropospheric. J. Geophys. Res.-Atmos., 111 (D21): Art. No. D21203.<br />
Gao, R.S., D.W. Fahey, P.J. Popp, T.P. Marcy, R.L. Herman, E.M. Weinstock, J.B. Smith, D.S. Sayres, J.V.<br />
Pittman, K.H. Rosenlof, T.L. Thompson, P.T. Bui, D.G. Baumgardner, B.E. Anderson, G. Kok, A.J.<br />
Weinheimer, 2006. Measurements of relative humidity in a persistent contrail. Atmos. Environ., 40 (9):<br />
p.1590.<br />
Garl<strong>and</strong>, R.M., M.J. Elrod, K. Kincaid, M.R. Beaver, J.L. Jiménez, M.A. Tolbert, 2006. Acid-catalyzed reactions of<br />
hexanal on sulfuric acid particles: Identification of reaction products. Atmos. Environ., 40 (35): p.6863.<br />
170
Appendices: Publications<br />
Garrett, T.J., L. Avey, P.I. Palmer, A. Stohl, J.A. Neuman, C.A. Brock, T.B. Ryerson, J.S. Holloway, 2006.<br />
Quantifying wet scavenging processes in aircraft observations of nitric acid <strong>and</strong> cloud condensation nuclei. J.<br />
Geophys. Res.-Atmos., 111 (D23): Art. No. D23S51.<br />
Garzione, C.N., P. Molnar, J.C. Libarkin, B.J. MacFadden, 2006. Rapid late Miocene rise of the Bolivian Altiplano:<br />
Evidence for removal of mantle lithosphere. Earth Planet. Sci. Lett., 241 (4-Mar): p.543.<br />
Gasparini, R., D.R. Collins, E. Andrews, P.J. Sheridan, J.A.Ogren, J.G.Hudson, 2006. Comparison of humidity<br />
dependent optical properties <strong>and</strong> CCN spectra derived using size-resolved hygroscopicity with direct<br />
measurements made at the ARM Southern Great Plains site. J. Geophys. Res.-Atmos, 111:<br />
doi:10.1029/2005JD006092.<br />
Gasparini, R., D.R. Collins, E. Andrews, P.J. Sheridan, J.A. Ogren, J.G. Hudson, 2006. Coupling aerosol size<br />
distributions <strong>and</strong> size-resolved hygroscopicity to predict humidity-dependent optical properties <strong>and</strong> cloud<br />
condensation nuclei spectra. J. Geophys. Res.-Atmos., 111 (D5): Art. No. D05S13.<br />
Gearheard, S., W. Matumeak, I. Angutikjuak, J. Maslanik, H.P. Huntington, J. Leavitt, D.M. Kagak, G. Tigullarak,<br />
R.G. Barry, 2006. ―It's not that simple‖: A collaborative comparison of sea ice environments, their uses,<br />
observed changes, <strong>and</strong> adaptations in Barrow, Alaska, USA, <strong>and</strong> Clyde River, Nunavut, Canada. Ambio, 35<br />
(4): p.204.<br />
Gero, A.F., A.J. Pitman, G.T. Narisma, C. Jacobson, <strong>and</strong> R.A. Pielke Sr., 2006. The impact of l<strong>and</strong> cover change on<br />
storms in the Sydney Basin. Glob. Planet. Change, 54: p.57.<br />
Gero, A.F., A.J. Pitman, G.T. Narisma, C. Jacobson, R.A. Pielke., 2006. The impact of l<strong>and</strong> cover change on storms<br />
in the Sydney Basin, Australia. Glob. Planet. Change, 54: p.57.<br />
Gierczak, T., J.B. Burkholder, A.R. Ravishankara, 2006. Rate coefficients for the reaction of OH with OClO<br />
between 242 <strong>and</strong> 392 K. Int. J. Chem. Kinet., 38 (4): p.234.<br />
Gilman, J.B., H. Tervahattu, V. Vaida, 2006. Interfacial properties of mixed films of long-chain organics at the airwater<br />
interface. Atmos. Environ., 40 (34): p.6606.<br />
Gilman, J.B., V. Vaida, 2006. Permeability of acetic acid through organic films at the air-aqueous interface. J. Phys.<br />
Chem. A, 110 (24): p.7581.<br />
Gnanadesikan, A., K.W. Dixon, S.M. Griffies, V. Balaji, M. Barreiro, J.A. Beesley, W.F. Cooke, T.L. Delworth, R.<br />
Gerdes, M.J. Harrison, I.M. Held, W.J. Hurlin, H.C. Lee, Z. Liang, G. Nong, R.C. Pacanowski, A. Rosati, J.<br />
Russell, B.L. Samuels, Q. Song, M.J. Spelman, R.J. Stouffer, C.O. Sweeney, G. Vecchi, M. Winton, A.T.<br />
Wittenberg, F. Zeng, R. Zhang, J.P. Dunne, 2006. GFDL‘s CM2 global coupled climate models. Part II: The<br />
baseline ocean simulation. J. Clim., 19 (5): p.675.<br />
Goddard, L., A. Kumar, M.P. Hoerling, A.G. Barnston, 2006. Diagnosis of anomalous winter temperatures over the<br />
eastern United States during the 2002/03 El Niño. J. Clim., 19 (21): p.5624.<br />
Godin, O.A., 2006. Anomalous transparency of water-air interface for low-frequency sound. Phys. Rev. Lett., 97<br />
(16): Art. No. 164301.<br />
Godin, O.A., 2006. Recovering the acoustic Green's function from ambient noise cross correlation in an<br />
inhomogeneous moving medium. Phys. Rev. Lett., 97 (5): Art. No. 54301.<br />
Godin, O.A., 2006. Calculation of amplitudes of acoustic normal modes from the reciprocity principle. J. Acoust.<br />
Soc. Am., 119 (4): p.2096.<br />
Godin, O.A., V.U. Zavorotny, A.G. Voronovich, V.V. Goncharov, 2006. Refraction of sound in a horizontally<br />
inhomogeneous, time-dependent ocean. IEEE J. Ocean. Eng., 31 (2): p.384.<br />
Goedecke, G.H., D.K. Wilson, V.E. Ostashev, 2006. Quasi-wavelet models of turbulent temperature fluctuations.<br />
Bound.-Layer Meteor., 120 (1): p. 1-23.<br />
Golubiewski, N.E., 2006. Urbanization increases grassl<strong>and</strong> carbon pools: Effects of l<strong>and</strong>scaping in Colorado‘s Front<br />
Range. Ecol. Appl., 16 (2): p.555.<br />
Granier, C., U. Niemeier, J.H. Jungclaus, L. Emmons, P. Hess, J.F. Lamarque, S. Walters, G.P. Brasseur, 2006.<br />
Ozone pollution from future ship traffic in the Arctic northern passages. Geophys. Res. Lett., 33 (13): Art. No.<br />
L13807.<br />
Gratz, J., E. Noble, 2006. Lighting safety <strong>and</strong> large stadiums. Bull. Amer. Meteorol. Soc., 87 (9): p.1187.<br />
Green, R.O., T.H. Painter, D.A. Roberts, J. Dozier, 2006. Measuring the expressed abundance of the three phases of<br />
water with an imaging spectrometer over melting snow. Water Resour. Res., 42 (10): Art. No. W10402.<br />
Göötz, B., D.B. Popović, D.E. David, J. Michl, P. Swiderek, 2006. Depth <strong>and</strong> angular profiles of inelastic low<br />
energy electron scattering in condensed molecular samples. J. Phys. Chem. B, (110): p. 5480.<br />
Hall, N.M.J., G.N. Kiladis, C.D. Thorncroft, 2006. Three-dimensional structure <strong>and</strong> dynamics of African easterly<br />
waves. Part II: Dynamical modes. J. Atmos. Sci., 63 (9): p.2231.<br />
171
Appendices: Publications<br />
Hallar, A.G., A.W. Strawa, B. Schmid, E. Andrews, J. Ogren, P. Sheridan, R. Ferrare, D. Covert, R. Elleman, H.<br />
Jonsson, K. Bokarius, A. Luu, 2006. ARM Aerosol Intensive Operating Period: Comparison of aerosol<br />
scattering during coordinated flights. J. Geophys. Res. - Atmos, 111: doi10.1029/2005JD006250.<br />
Hamill, T.M., J.S. Whitaker, 2006. Probabilistic quantitative precipitation forecasts based on reforecast analogs:<br />
Theory <strong>and</strong> application. Mon. Weather Rev., 134 (11): p.3209.<br />
Hamill, T.M., J.S. Whitaker, S.L. Mullen, 2006. Reforecasts – An important dataset for improving weather<br />
predictions. Bull. Amer. Meteorol. Soc., 87 (1): p.33.<br />
Han, W.Q., W.T. Liu, J.L. Lin, 2006. Impact of atmospheric submonthly oscillations on sea surface temperature of<br />
the tropical Indian Ocean. Geophys. Res. Lett., 33 (3): Art. No. L03609.<br />
Han, W.Q., T. Shinoda, L.L. Fu, J.P. McCreary, 2006. Impact of atmospheric intraseasonal oscillations on the Indian<br />
Ocean dipole during the 1990s. J. Phys. Oceanogr., 36 (4): p.670.<br />
Hansen, J.A., C. Penl<strong>and</strong>, 2006. Efficient approximate techniques for integrating stochastic differential equations.<br />
Mon. Weather Rev., 134 (10): p.3006.<br />
Havey, D.K., K.J. Feierabend, K. Takahashi, R.T. Skodje, V. Vaida, 2006. Experimental <strong>and</strong> theoretical<br />
investigation of vibrational overtones of glycolic acid <strong>and</strong> its hydrogen bonding interactions with water. J.<br />
Phys. Chem. A, 110 (20): p.6439.<br />
Hay, L.E., M.P. Clark, M. Pagowski, G.H. Leavesley, W.J. Gutowski, 2006. One-way coupling of an atmospheric<br />
<strong>and</strong> a hydrologic model in Colorado. J. Hydrometeorol., 7 (4): p.569.<br />
Hay, L.E., G.H. Leavesley, M.P. Clark, S.L. Markstrom, R.J. Viger, M. Umemoto, 2006. Step wise, multiple<br />
objective calibration of a hydrologic model for a snowmelt dominated basin. J. Am. Water Resour. Assoc., 42<br />
(4): p.877.<br />
Heald, C.L., D.J. Jacob, S. Turquety, R.C. Hudman, R.J. Weber, A.P. Sullivan, R.E. Peltier, E.L. Atlas, J.A. de<br />
Gouw, C. Warneke, J.S. Holloway, J.A. Neuman, F.M. Flocke, J.H. Seinfeld, 2006. Concentrations <strong>and</strong><br />
sources of organic carbon aerosols in the free troposphere over North America. J. Geophys. - Atmospheres,<br />
111, D23S47: doi: 10.1029/2006JD007705.<br />
Herzfeld, U.C., J.E. Box, K. Steffen, H. Mayer, N.Caine, M. Losleben, 2006. A case study on the influence of snow<br />
<strong>and</strong> ice surface roughness on melt energy. Zeitschrift für Gletscherkunde und Glazialgeology (issue 39 is<br />
nominally a 2004 issue <strong>and</strong> was published in 2006), 39: 11.<br />
Herzfeld, U.C., S. Drobot, W. Wu, C. Fowler, J. Maslanik, 2006. Spatio-temporal climate model validation – Case<br />
studies for MM5 over northwestern Canada <strong>and</strong> Alaska. Earth Interactions, Special Issue``Western Arctic<br />
Linkage Experiment -- WALE", 10.<br />
Herzfeld, U.C., J.A. Maslanik, M. Sturm, 2006. Geostatistical characterization of snow-depth structures on sea ice<br />
near Point Barrow, Alaska – A contribution to the AMSR-Ice03 field validation campaign. IEEE Trans.<br />
Geosci. Remote Sensing, 44 (11): p.3038.<br />
Hewison, T.J., D. Cimini, L. Martin, C. Gaffard, J. Nash, 2006. Validating clear air absorption models using groundbased<br />
microwave radiometers <strong>and</strong> vice-versa. Meteorol. Z., 15 (1): p.27.<br />
Hiemstra, C.A., G.E. Liston, R.A. Pielke Sr., D.L. Birkenheuer, S.C. Albers, 2006. Comparing Local Analysis <strong>and</strong><br />
Prediction <strong>Systems</strong> (LAPS) assimilations with independent observations. Weather <strong>and</strong> Forecasting, 21:<br />
p.1024.<br />
Higgins, W., D. Ahijevych, J. Amador, A. Barros, E.H. Berbery, E. Caetano, R. Carbone, P. Ciesielski, R. Cifelli,<br />
M. Cortez-Vazquez, A. Douglas, M. Douglas, G. Emmanuel, C. Fairall, D. Gochis, D. Gutzler, T. Jackson, R.<br />
Johnson, C. King, T. Lang, M.I. Lee, D. Lettenmaier, R. Lobato, V. Magana, J. Meiten, K. Mo, S. Nesbitt, F.<br />
Ocampo-Torres, E. Pytlak, P. Rogers, S. Rutledge, J. Schemm, S. Schubert, A. White, C. Williams, A. Wood,<br />
R. Zamora, C.D. Zhang, 2006. The NAME 2004 field campaign <strong>and</strong> modelling strategy. Bull. Amer.<br />
Meteorol. Soc., 87 (1): p.79.<br />
Hill, R.J., 2006. Opportunities for use of exact statistical equations. J. Turbul., 7 (43): 11: p.1-13.<br />
Hirsch, A.I., A.M. Michalak, L.M. Bruhwiler, W. Peters, E.J. Dlugokencky, P.P. Tans, 2006. Inverse modeling<br />
estimates of the global nitrous oxide surface flux from 1998-2001. Glob. Biogeochem. Cycle, 20 (1): Art. No.<br />
GB1008.<br />
Hoerling, M.P., T. Xu, G. Bates, A. Kumar, B. Jha, 2006. Warm oceans raise l<strong>and</strong> temperatures. EOS, 87: p.189.<br />
Hoerling, M., J. Hurrell, J. Eischeid, A. Phillips, 2006. Detection <strong>and</strong> attribution of twentieth-century northern <strong>and</strong><br />
southern African rainfall change. J. Clim., 19 (16): p.3989.<br />
Hofmann, D.J., J.H. Butler, E.J. Dlugokencky, J.W. Elkins, K. Masarie, S.A. Montzka, P. Tans, 2006. The role of<br />
carbon dioxide in climate forcing from 1979 to 2004: Introduction of the Annual Greenhouse Gas Index.<br />
Tellus Ser. B-Chem. Phys. Meteorol., 58 (5): p.614.<br />
172
Appendices: Publications<br />
Holl<strong>and</strong>, M.M., J. Finnis, M.C. Serreze, 2006. Simulated Arctic Ocean freshwater budgets in the twentieth <strong>and</strong><br />
twenty-first centuries. J. Clim., 19 (23): p.6221.<br />
Houweling, S., T. Rockmann, I. Aben, F. Keppler, M. Krol, J.F. Meirink, E.J. Dlugokencky, C. Frankenberg, 2006.<br />
Atmospheric constraints on global emissions of methane from plants. Geophys. Res. Lett., 33 (15): Art. No.<br />
L15821.<br />
Hughes, R.F., S.R. Archer, G.P. Asner, C.A. Wessman, C. McMurtry, J. Nelson, R.J. Ansley, 2006. Changes in<br />
aboveground primary production <strong>and</strong> carbon <strong>and</strong> nitrogen pools accompanying woody plant encroachment in<br />
a temperate savanna. Glob. Change Biol., 12 (9): p.1733.<br />
Hunt, A.G., 2006. Comment on ―Fractal approach to hydraulic properties in unsaturated porous media‖, by Y.F. Xu,<br />
Ping Dong [Chaos, Solitons, <strong>and</strong> Fractals, 19 (2004) 327-337]. Chaos Solitons Fractals, 28 (1): p.278.<br />
Hunt, A.G., G.E. Grant, V.K. Gupta, 2006. Spatio-temporal scaling of channels in braided streams. J. Hydrol., 322:<br />
p.192.<br />
Hunter, A.B., S. Laursen, E. Seymour, 2006. Becoming a scientist: The role of undergraduate research in students‘<br />
cognitive, personal <strong>and</strong> professional development. Science Education, 91: p.36.<br />
Hurst, D.F., J.C. Lin, P.A. Romashkin, B.C. Daube, C. Gerbig, D.M. Matross, S.C. Wofsy, B.D. Hall, J.W. Elkins,<br />
2006. Continuing global significance of emissions of Montreal Protocol-restricted halocarbons in the United<br />
States <strong>and</strong> Canada. J. Geophys. Res.-Atmos., 111 (D15): Art. No. D15302.<br />
Jackson, D.L., G.A. Wick, J.J. Bates, 2006. Near-surface retrieval of air temperature <strong>and</strong> specific humidity using<br />
multisensor microwave satellite observations. J. Geophys. Res.-Atmos., 111 (D10): Art. No. D10306.<br />
Jacobson, A.R., M. Festa-Bianchet, A. Provenzale, A. von Hardenberg, B. Bassano, 2006. Comment on Lima &<br />
Berryman (2006): The Alpine ibex revisited. Clim. Res., 32 (2): p.137.<br />
Jiang, H.L., G. Feingold, 2006. Effect of aerosol on warm convective clouds: Aerosol-cloud-surface flux feedbacks<br />
in a new coupled large eddy model. J. Geophys. Res.-Atmos., 111 (D1): Art. No. D01202.<br />
Jiang, H.L., H.W. Xue, A. Teller, G. Feingold, Z. Levin, 2006. Aerosol effects on the lifetime of shallow cumulus.<br />
Geophys. Res. Lett., 33 (14): Art. No. L14806.<br />
Johnson, J.T., A.J. Gasiewski, B. Guner, G.A. Hampson, S.W. Ellingson, R. Krishnamachari, N. Niamsuwan, E.<br />
McIntyre, M. Klein, V.Y. Leuski, 2006. Airborne radio-frequency interference studies at C-b<strong>and</strong> using a<br />
digital receiver. IEEE Trans. Geosci. Remote Sensing, 44 (7): p.1974.<br />
Jones, R.M., 2006. Minimum <strong>and</strong> maximum propagation frequencies for internal gravity waves. J. Geophys. Res.-<br />
Atmos., 111 (D6): Art. No. D06109.<br />
Joughin, I., J.L. Bamber, T. Scambos, S. Tulaczyk, M. Fahnestock, D.R. MacAyeal, 2006. Integrating satellite<br />
observations with modelling: basal shear stress of the Filcher-Ronne ice streams, Antarctica. Philos. Trans. R.<br />
Soc. A-Math. Phys. Eng. Sci., 364 (1844): p.1795.<br />
Kalus, V., L. Bianco, C. Gaffard, M. Matabuena, T. Hewison, 2006. Combining UHF radar wind profiler <strong>and</strong><br />
microwave radiometer for the estimation of atmospheric humidity profiles. Meteorologische Zeitschrift, 15:<br />
p.876.<br />
Karimpour, M. H., L. Farmer, C. Ashouri, S. Saadat, Major, 2006. Trace element <strong>and</strong> REE geochemistry of Paleo-<br />
Tethys collision-related granitoids from Mashad, Iran. J. of Sciences, Islamic Republic of Iran, 145: p.17.<br />
Kaushal, S.S., W.H. Lewis, J.H. McCutchan, 2006. L<strong>and</strong> use change <strong>and</strong> nitrogen enrichment of a Rocky Mountain<br />
watershed. Ecol. Appl., 16 (1): p.299.<br />
Kazil, J., E.R. Lovejoy, M.C. Barth, K. O‘Brien, 2006. Aerosol nucleation over oceans <strong>and</strong> the role of galactic<br />
cosmic rays. Atmos. Chem. Phys., 6: p.4905.<br />
Khromova, T.E., G.B. Osipova, D.G. Tsvetkov, M.B. Dyurgerov, R.G. Barry, 2006. Changes in glacier extent in the<br />
eastern Pamir, Central Asia, determined from historical data <strong>and</strong> ASTER imagery. Remote Sens. Environ.,<br />
102 (2-Jan): p.24.<br />
Kiladis, G.N., B.E. Mapes, 2006. Convective life cycles <strong>and</strong> scale interactions in tropical waves. Dyn. Atmos.<br />
Oceans, 42 (4-Jan).<br />
Kiladis, G.N., C.D. Thorncroft, N.M.J. Hall, 2006. Three-dimensional structure <strong>and</strong> dynamics of African easterly<br />
waves. Part I: Observations. J. Atmos. Sci., 63 (9): p.2212.<br />
Kim, C.H., S.M. Kreidenweis, G. Feingold, K.G. Anlauf, W.R. Leaitch, 2006. Measurement <strong>and</strong> interpretation of<br />
cloud effects on the concentrations of hydrogen peroxide <strong>and</strong> organoperoxides over Ontario, Canada. Atmos.<br />
Res., 81 (2): p.140.<br />
Kim, J., S.C. Yoon, A. Jefferson, S.W. Kim, 2006. Aerosol hygroscopic properties during Asian dust, pollution, <strong>and</strong><br />
biomass burning episodes at Gosan, Korea in April 2001. Atmos. Environ., 40 (8): p.1550.<br />
173
Appendices: Publications<br />
Kim, J., S.C. Yoon, S.W. Kim, F. Brechtel, A. Jefferson, E.G. Dutton, K.N. Bower, S. Cliff, J.J. Schauer, 2006.<br />
Chemical apportionment of shortwave direct aerosol radiative forcing at the Gosan super-site, Korea during<br />
ACE-Asia. Atmos. Environ., 40 (35): p.6718.<br />
Kim, S.W., A. Heckel, S.A. McKeen, G.J. Frost, E.Y. Hsie, M.K. Trainer, A. Richter, J.P. Burrows, S.E. Peckham,<br />
G.A. Grell, 2006. Satellite-observed U.S. power plant NOx emission reductions <strong>and</strong> their impact on air<br />
quality. Geophys. Res. Lett., 33 (22): Art. No. L22812.<br />
Kim, S.W., S.U. Park, D. Pino, J.V.G. de Arellano, 2006. Parameterization of entrainment in a sheared convective<br />
boundary layer using a first-order jump model. Bound.-Layer Meteor., 120 (3): p.455.<br />
Kingsmill, D.E., P.J. Neiman, F.M. Ralph, A.B. White, 2006. Synoptic <strong>and</strong> topographic variability of northern<br />
California precipitation characteristics in l<strong>and</strong>falling winter storms observed during CALJET. Mon. Wea.<br />
Rev., 134 (8): p.2072.<br />
Kita, K., Y. Morino, Y. Kondo, Y. Komazaki, N. Takegawa, Y. Miyazaki, J. Hirokawa, S. Tanaka, T.L. Thompson,<br />
R.S. Gao, D.W. Fahey, 2006. A chemical ionization mass spectrometer for ground-based measurements of<br />
nitric acid. J. Atmos. Ocean. Technol., 23 (8): p.1104.<br />
Klemperer, W., V. Vaida, 2006. Molecular complexes in close <strong>and</strong> far away. Proc. Natl. Acad. Sci. U. S. A., 103<br />
(28): p.10584.<br />
Koehler, K.A., S.M. Kreidenweis, P.J. DeMott, A.J. Prenni, C.M. Carrico, B. Ervens, G. Feingold, 2006. Water<br />
activity <strong>and</strong> activation diameters from hygroscopicity data - Part II: Application to organic species. Atmos.<br />
Chem. Phys., 6: p.795.<br />
Kokhanovsky, A.A., V.V. Rozanov, T. Nauss, C. Reudenbach, J.S. Daniel, H.L. Miller, J.P. Burrows, 2006. The<br />
semianalytical cloud retrieval algorithm for SCIAMACHY - I. The validation. Atmos. Chem. Phys., 6:<br />
p.1905.<br />
Koyama, T., T. Vukicevic, M. Sengupta, T. Vonderhaar, A.S. Jones, 2006. Analysis of information content of<br />
infrared radiances in cloudy conditions. Mon. Wea. Rev., 134: p.3657.<br />
Kucharik, C.J., C.C. Barford, M. El Maayar, S.C. Wofsy, R.K. Monson, D.D. Baldocchi, 2006. A multiyear<br />
evaluation of a Dynamic Global Vegetation Model at three AmeriFlux forest sites: Vegetation structure,<br />
phenology, soil temperature, <strong>and</strong> CO2 <strong>and</strong> H2O vapor exchange. Ecological Modelling, 196: p. 1-31.<br />
Kumar, K.K., B. Rajagopalan, M. Hoerling, G. Bates, M. Cane, 2006. Unraveling the mystery of Indian monsoon<br />
failure during El Niño. Science, 314 (5796): p.115.<br />
Lack, D.A., E.R. Lovejoy, T. Baynard, A. Pettersson, A.R. Ravishankara, 2006. Aerosol absorption measurement<br />
using photoacoustic spectroscopy: Sensitivity, calibration, <strong>and</strong> uncertainty developments. Aerosol Sci.<br />
Technol., 40 (9): p.697.<br />
Lane, T.P., R.D. Sharman, R.G. Frehlich, J.M. Brown, 2006. Numerical simulations of the wake of Kauai. J. Appl.<br />
Meteorol. Climatol., 45 (9): p.1313.<br />
Lau, E.M., S.K. Avery, J.P. Avery, D. Janches, S.E. Palo, R. Schafer, N.A. Makarov, 2006. Statistical<br />
characterization of the meteor trail distribution at the South Pole as seen by a VHF interferometric meteor<br />
radar. Radio Sci., 41 (4): Art. No. RS4007.<br />
Lau, E. M., S.K. Avery, J.P. Avery, S.E. Palo, N.A Makarov, 2006. Tidal analysis of meridional winds at the South<br />
Pole using VHF interferometric meteor radar. J. Geophys. Res.-Atmos., 111 (D16): Art. No. D16108.<br />
Laursen, S., 2006. Getting unstuck: Strategies for escaping the science st<strong>and</strong>ards straitjacket. Astronomy Education<br />
Review, 5: p.162.<br />
Lawrence, D. M., A.G. Slater, 2006. Reply to comment by C.R. Burn <strong>and</strong> F.E. Nelson on ―A projection of nearsurface<br />
permafrost degradation during the 21st century‖. Geophys. Res. Lett., 33 (21): Art. No. L21504.<br />
Laštovička, J., R.A. Akmaev, G. Beig, J. Bremer, J.T. Emmert, 2006. Global change in the upper atmosphere.<br />
Science, 314: p.1253.<br />
Lee, J. L., W.C. Lee, A.E. MacDonald, 2006. Estimating vertical velocity <strong>and</strong> radial flow from Doppler radar<br />
observations of tropical cyclones. Q. J. R. Meteorol. Soc., 132 (614): p.125.<br />
Lee, Y. S., D.R. Collins, R.J. Li, K.P. Bowman, G. Feingold, 2006. Expected impact of an aged biomass burning<br />
aerosol on cloud condensation nuclei <strong>and</strong> cloud droplet concentrations. J. Geophys. Res.-Atmos., 111 (D22):<br />
Art. No. D22204.<br />
Lelieveld, J., C.A.M. Brenninkmeijer, P. Joeckel, I.S.A. Isaksen, M.C. Krol, J.E. Mak, E. Dlugokencky, S.A.<br />
Montzka, P.C. Novelli, W. Peters, P.P. Tans, 2006. New Directions: Watching over tropospheric hydroxyl<br />
(OH). Atmos. Environ., 40 (29): p.5741.<br />
Lesur, V., S. Maus, 2006. A global lithospheric magnetic field model with reduced noise level in the Polar Regions.<br />
Geophys. Res. Lett., 33 (13): Art. No. L13304.<br />
174
Appendices: Publications<br />
Li, S., G.T. Bates, 2006. Influence of Atlantic multi-decadal oscillation on the winter climate of east China. Adv.<br />
Atmos. Sci., 24: p.126.<br />
Li, S. L., M.P. Hoerling, S.L. Peng, 2006. Coupled ocean-atmosphere response to Indian Ocean warmth. Geophys.<br />
Res. Lett., 33 (7): Art. No. L07713.<br />
Li, S. L., M.P. Hoerling, S.L. Peng, K.M. Weickmann, 2006. The annular response to tropical Pacific SST forcing.<br />
J. Clim., 19 (9): p.1802.<br />
Liebmann, B., D. Allured, 2006. Daily precipitation grids for South America - Reply. Bull. Amer. Meteorol. Soc., 87<br />
(8): 10.1175/BAMS-87-8-1096.<br />
Lin, J. C., T. Matsui, R.A. Pielke, C. Kummerow, 2006. Effects of biomass-burning-derived aerosols on<br />
precipitation <strong>and</strong> clouds in the Amazon Basin: a satellite-based empirical study. J. Geophys. Res.-Atmos., 111<br />
(D19): Art. No. D19204.<br />
Lin, J. L., G.N. Kiladis, B.E. Mapes, K.M. Weickmann, K.R. Sperber, W .Lin, M.C. Wheeler, S.D. Schubert, A. Del<br />
Genio, L.J. Donner, S. Emori, J.F. Gueremy, F. Hourdin, P.J. Rasch, E. Roeckner, J.F. Scinocca, 2006.<br />
Tropical intraseasonal variability in 14 IPCC AR4 climate models. Part I: Convective signals. J. Clim., 19<br />
(12): p.2665.<br />
Ling, F., T.J. Zhang, 2006. Sensitivity of ground thermal regime <strong>and</strong> surface energy fluxes to tundra snow density in<br />
northern Alaska. Cold Reg. Sci. Tech., 44 (2): p.121.<br />
Luhr, H., S. Maus, 2006. Direct observation of the F region dynamo currents <strong>and</strong> the spatial structure of the EEJ by<br />
CHAMP. Geophys. Res. Lett., 33 (24): Art. No. L24102.<br />
Lumpe, J., R. Bevilacqua, C. R<strong>and</strong>all, G. Nedoluha, K. Hoppel, J. Russell, V.L. Harvey, C. Schiller, B. Sen, G.<br />
Taha, G. Toon, H. Vomel, 2006. Validation of Polar Ozone <strong>and</strong> Aerosol Measurement (POAM) III version 4<br />
stratospheric water vapor. J. Geophys. Res.-Atmos., 111 (D11): Art. No. D11301.<br />
Lundquist, J. D. A.L. Flint, 2006. Onset of snowmelt <strong>and</strong> streamflow in 2004 in the western United States: How<br />
shading may affect spring streamflow timing in a warmer world. J. Hydrometeorol., 7 (6): p.1199.<br />
Luthcke, S.B., H.J. Zwally, W. Abdalati, D.D. Rowl<strong>and</strong>s, R.D. Ray, R.S. Nerem, F.G. Lemoine, J.J. McCarthy, D.S.<br />
Chinn, 2006. Recent Greenl<strong>and</strong> ice mass loss by drainage system from satellite gravity observations. Science,<br />
314 (5803): p.1286.<br />
Lyakhov, A.N., Y.I. Zetser, T. Fuller-Rowell, 2006. Possible consequences of the displacement of magnetic poles on<br />
the structure <strong>and</strong> dynamics of the Earth's upper atmosphere. Dokl. Earth Sci., 409 (6): p.978.<br />
Lynch, A., P. Uotila, J.J. Cassano, 2006. Changes in synoptic weather patterns in the polar regions in the twentieth<br />
<strong>and</strong> twenty-first centuries, part 2: Antarctic. Int. J. Climatol., 26 (9): p.1181.<br />
Machol, J.L., T. Ayers, K.T. Schwenz, K.W. Koenig, R.M. Hardesty, C.J. Senff, M.A. Krainak, J.B. Abshire, H.E.<br />
Bravo, S.P. S<strong>and</strong>berg, 2006. Preliminary measurements with an automated compact differential absorption<br />
lidar for the profiling of water vapor (vol 43, pg 3110, 2004). Appl. Optics, 45 (15): p.3544.<br />
Mahmood, R., R.A. Pielke, K.G. Hubbard, 2006. L<strong>and</strong> use/l<strong>and</strong> cover change <strong>and</strong> its impacts on climate. Glob.<br />
Planet. Change, 54 (2-Jan): VIIVII.<br />
Manoj, C., A. Kuvshinov, S. Maus, H. Luhr, 2006. Ocean circulation generated magnetic signals. Earth Planets<br />
Space, 58 (4): p.429.<br />
Manoj, C., H. Luhr, S. Maus, N. Nagarajan, 2006. Evidence for short spatial correlation lengths of the noontime<br />
equatorial electrojet inferred from a comparison of satellite <strong>and</strong> ground magnetic data. J. Geophys. Res-Space<br />
Phys., 111 (A11): Art. No. A11312.<br />
Mantilla, R., V.K. Gupta, O.J. Mesa, 2006. Role of coupled flow dynamics <strong>and</strong> real network structures on Hortonian<br />
scaling of peak flows. J. Hydrol., 322: p.155.<br />
Mapes, B., S. Tulich, J. Lin, P. Zuidema, 2006. The mesoscale convection life cycle: Building block or prototype for<br />
large-scale tropical waves? Dyn. Atmos. Oceans, 42.<br />
Marcolli, C., M.R. Canagaratna, D.R. Worsnop, R. Bahreini, J.A. de Gouw, C. Warneke, P.D. Goldan, W.C. Kuster,<br />
E.J. Williams, B.M. Lerner, J.M. Roberts, J.F. Meagher, F.C. Fehsenfeld, M. Marchewka, S.B. Bertman,<br />
A.M. Middlebrook, 2006. Cluster analysis of the organic peaks in bulk mass spectra obtained during the 2002<br />
New Engl<strong>and</strong> air quality study with an Aerodyne aerosol mass spectrometer. Atmos. Chem. Phys., 6: p.5649.<br />
Markus, T., D.J. Cavalieri, A.J. Gasiewski, M. Klein, J.A. Maslanik, D.C. Powell, B.B. Stankov, J.C. Stroeve, M.<br />
Sturm, 2006. Microwave signatures of snow on sea ice: Observations. IEEE Trans. Geosci. Remote Sensing,<br />
44 (11): p.3081.<br />
Marr, L.C., K. Dzepina, J.L. Jiménez, F. Reisen, H.L. Bethel, J. Arey, J.S. Gaffney, N.A. Marley, L.T. Molina, M.J.<br />
Molina, 2006. Sources <strong>and</strong> transformations of particle-bound polycyclic aromatic hydrocarbons in Mexico<br />
City. Atmos. Chem. Phys., 6: p.1733.<br />
175
Appendices: Publications<br />
Marschke, R., S. Laursen, J. Nielsen, P. Rankin, 2006. Demographic inertia revisited: An immodest proposal to<br />
achieve equitable gender representation in higher education. J. Higher Educ., 78: p.11.<br />
Martin, R.V., C.E. Sioris, K. Chance, T.B. Ryerson, T.H. Bertram, P.J. Wooldridge, R.C. Cohen, J.A. Neuman, A.<br />
Swanson, F.M. Flocke, 2006. Evaluation of space-based constraints on global nitrogen oxide emissions with<br />
regional aircraft measurements over <strong>and</strong> downwind of eastern North America. J. Geophys. Res.-Atmos., 111<br />
(D15): Art. No. D15308.<br />
Martynenko, S.I., S.F. Clifford, 2006. On the electrical coupling between the troposphere <strong>and</strong> the mesosphere. Int. J.<br />
Geomag. Aeronomy, Vol. 6, GI 2007: doi: 10.1029/2005GI000094.<br />
Mashburn, C.D., E.K. Frinak, M.A. Tolbert, 2006. Heterogeneous uptake of nitric acid on Na-montmorillonite clay<br />
as a function of relative humidity. J. Geophys. Res.-Atmos., 111 (D15): Art. No. D15213.<br />
Maslanik, J.A., M. Sturm, M.B. Rivas, A.J. Gasiewski, J.E. Heinrichs, U.C. Herzfeld, J. Holmgren, M. Klein, T.<br />
Markus, D.K. Perovich, J.G. Sonntag, J.C. Stroeve, K. Tape, 2006. Spatial variability of barrow-area shorefast<br />
sea ice <strong>and</strong> its relationships to passive microwave emissivity. IEEE Trans. Geosci. Remote Sensing, 44<br />
(11): p.3021.<br />
Massoli, P., M. Maturilli, R. Neuber, 2006. Climatology of Arctic polar stratospheric clouds as measured by lidar in<br />
Ny-Alesund, Spitsbergen (79°N, 12°E). J. Geophys. Res.-Atmos., 111 (D9): Art. No. D09206.<br />
Massom R., A. Worby, V. Lytle, T. Markus, I. Allison, T. Scambos, H. Enomoto, K. Tateyama, T. Haran, J.<br />
Comiso, A. Pfaffling, T. Tamura, A. Muto, P. Kanagaratnam, B. Giles, N. Young, G. Hyl<strong>and</strong>, E. Key, 2006.<br />
ARISE (Antarctic Remote Ice Sensing Experiment) in the East 2003: Validation of satellite-derived sea-ice<br />
data products. Annals of Glaciology, 44: 44A012.<br />
Matrosov, S.Y., R. Cifelli, P.C. Kennedy, S.W. Nesbitt, S.A. Rutledge, V.N. Bringi, B.E. Martner, 2006. A<br />
comparative study of rainfall retrievals based on specific differential phase shifts at X- <strong>and</strong> S-b<strong>and</strong> radar<br />
frequencies. J. Atmos. Ocean. Technol. 23 (7): p.952.<br />
Matrosov, S.Y., P.T. May, M.D. Shupe, 2006. Rainfall profiling using atmospheric radiation measurement program<br />
vertically pointing 8-mm wavelength radars. J. Atmos. Ocean. Technol., 23 (11): p.1478.<br />
Matross, D.M., A. Andrews, M. Pathmathevan, C. Gerbig, J.C. Lin, S.C. Wofsy, B.C. Daube, E.W. Gottlieb, V.Y.<br />
Chow, J.T. Lee, C.L. Zhao, P.S. Bakwin, J.W. Munger, D.Y. Hollinger, 2006. Estimating regional carbon<br />
exchange in New Engl<strong>and</strong> <strong>and</strong> Quebec by combining atmospheric, ground-based <strong>and</strong> satellite data. Tellus<br />
Ser. B-Chem. Phys. Meteorol., 58 (5): p.344.<br />
Matsui, T., <strong>and</strong> R.A. Pielke Sr., 2006. Measurement-based estimation of the spatial gradient of aerosol radiative<br />
forcing. Geophys. Res. Lett., 33: doi: 10.1029/2006GL025974.<br />
Matsui, T; H. Masunaga, S.M. Kreidenweis, R.A. Pielke, W.K. Tao, M. Chin, Y.J. Kaufman, 2006. Satellite-based<br />
assessment of marine low cloud variability associated with aerosol, atmospheric stability, <strong>and</strong> the diurnal<br />
cycle. J. Geophys. Res.-Atmos., 111 (D17): Art. No. D17204.<br />
Matthew, B.M., C. Anastasio, 2006. A chemical probe technique for the determination of reactive halogen species in<br />
aqueous solution: Part 1 - bromide solutions. Atmos. Chem. Phys., 6: p.2423.<br />
Maus, S., H. Luhr, 2006. A gravity-driven electric current in the Earth‘s ionosphere identified in CHAMP satellite<br />
magnetic measurements. Geophys. Res. Lett., 33 (2): Art. No. L02812.<br />
Maus, S., H. Luhr, M. Purucker, 2006. Simulation of the high-degree lithospheric field recovery for the Swarm<br />
constellation of satellites. Earth Planets Space, 58 (4): p.397.<br />
Maus, S., M. Rother, K. Hemant, C. Stolle, H. Luhr, A. Kuvshinov, N. Olsen, 2006. Earth‘s lithospheric magnetic<br />
field determined to spherical harmonic degree 90 from CHAMP satellite measurements. Geophys. J. Int., 164<br />
(2): p.319.<br />
Maus, S., M. Rother, C. Stolle, W. Mai, S. Choi, H. Luhr, D. Cooke, C. Roth, 2006. Third generation of the Potsdam<br />
Magnetic Model of the Earth (POMME). Geochem. Geophys. Geosyst., 7: Art. No. Q07008.<br />
McCabe, D.C., B. Rajakumar, P. Marshall, I.W.M. Smith, A.R. Ravishankara, 2006. The relaxation of OH (ν=1) <strong>and</strong><br />
OD (ν=1) by H2O <strong>and</strong> D2O at temperatures from 251 to 390 K. Phys. Chem. Chem. Phys., 8 (39): p. 4563.<br />
McCabe, D.C., I.W.M. Smith, B. Rajakumar, A.R. Ravishankara, 2006: Rate coefficients for the relaxation of OH<br />
(ν=1) by O2 at temperatures from 204-371 K <strong>and</strong> by N2O from 243-372 K. Chem. Phys. Lett., 421: p.111.<br />
McComiskey, A., P. Ricchiazzi, C. Gautier, D. Lubin, 2006. Assessment of a three dimensional model for<br />
atmospheric radiative transfer over heterogeneous l<strong>and</strong> cover. Geophys. Res. Lett., 33 (10): Art. No. L10813.<br />
McCutchan, J.H., W.M. Lewis, 2006. Groundwater flux <strong>and</strong> open-channel estimation of stream metabolism:<br />
Response to Hall <strong>and</strong> Tank. Limnol. Oceanogr. Meth., 4: p.213.<br />
McFiggans, G., P. Artaxo, U. Baltensperger, H. Coe, M.C. Facchini, G. Feingold, S. Fuzzi, M. Gysel, A. Laaksonen,<br />
U. Lohmann, T.F. Mentel, D.M. Murphy, C.D. O‘Dowd, J.R. Snider, E. Weingartner, 2006. The effect of<br />
physical <strong>and</strong> chemical aerosol properties on warm cloud droplet activation. Atmos. Chem. Phys., 6: p.2593.<br />
176
Appendices: Publications<br />
Mcguire, A.D., J.E. Walsh <strong>and</strong> ... U.C.Herzfeld ... (Wale Project Participants), 2006. The Western Arctic Linkage<br />
Experiment (WALE): Overview <strong>and</strong> Synthesis. Earth Interactions, Special Issue ―Western Arctic Linkage<br />
Experiment -- WALE", 10.<br />
McKenzie, R., G. Bodeker, G. Scott, J. Slusser, K. Lantzc, 2006. Geographical differences in erythemally-weighted<br />
UV measured at mid-latitude USDA sites. Photochem. Photobiol. Sci., 5 (3): p.343.<br />
Meier, W.N., <strong>and</strong> M. Dai, 2006. High-resolution sea ice motions from AMSR-E imagery. Annals of Glaciology, 44:<br />
p.352.<br />
Meier, W.N., J. Stroeve, <strong>and</strong> F. Fetterer, 2006. Whither Arctic sea ice? A clear signal of decline regionally,<br />
seasonally, <strong>and</strong> extending beyond the satellite record. Annals of Glaciology. p. 46.<br />
Meier, W.N., J. Stroeve, <strong>and</strong> S. Gearheard, 2006. Bridging perspectives from remote sensing <strong>and</strong> Inuit communities<br />
on changes in the sea ice cover in the Baffin Bay region. Annals of Glaciology, 44: p.433.<br />
Methven, J., S.R. Arnold, A. Stohl, M.J. Evans, M. Avery, K. Law, A.C. Lewis, P.S. Monks, D.D. Parrish, C.E.<br />
Reeves, H. Schlager, E. Atlas, D.R. Blake, H. Coe, J. Crosier, F.M. Flocke, J.S. Holloway, J.R. Hopkins, J.<br />
McQuaid, R. Purvis, B. Rappengluck, H.B. Singh, N.M. Watson, L.K. Whalley, P.I. Williams, 2006.<br />
Establishing Lagrangian connections between observations within air masses crossing the Atlantic during the<br />
International Consortium for Atmospheric Research on Transport <strong>and</strong> Transformation experiment. J.<br />
Geophys. Res.-Atmos., 111 (D23): Art. No. D23S62.<br />
Meure, C.M., D. Etheridge, C Trudinger, P. Steele, R Langenfelds, T. van Ommen, A. Smith, J. Elkins, 2006. Law<br />
Dome CO2, CH4 <strong>and</strong> N2O ice core records extended to 2000 years BP. Geophys. Res. Lett., 33 (14): Art. No.<br />
L14810.<br />
Michalsky, J.J., G.P. Anderson, J. Barnard, J. Delamere, C. Gueymard, S. Kato, P. Kiedron, A. McComiskey, P.<br />
Ricchiazzi, 2006. Shortwave radiative closure studies for clear skies during the atmospheric radiation<br />
measurement 2003 aerosol intensive observation period. J. Geophys. Res.-Atmos., 111 (D14): Art. No.<br />
D14S90.<br />
Mikaloff, A., S.E. Fletcher, N. Gruber, A.R. Jacobson, <strong>and</strong> 10 others, 2006. Inverse estimates of anthropogenic CO2<br />
uptake, transport, <strong>and</strong> storage by the ocean. Glob. Biogeochem. Cycles, 20: doi: 10.1029/2005GB002530.<br />
Miller, A.J., A.R. Cai, G. Tiao, D.J. Wuebbles, L.E. Flynn, S.K. Yang, E.C. Weatherhead, V. Fioletov, I.<br />
Petropavlovskikh, X.L. Meng, S. Guillas, R.M. Nagatani, G.C. Reinsel, 2006. Examination of ozonesonde<br />
data for trends <strong>and</strong> trend changes incorporating solar <strong>and</strong> Arctic oscillation signals. J. Geophys. Res.-Atmos.,<br />
111 (D13): Art. No. D13305.<br />
Miller, C.A., G. Hidy, J. Hales, C.E. Kolb, A.S. Werner, B. Haneke, D. Parrish, H.C. Frey, L. Rojas-Bracho, M.<br />
Deslauriers, B. Pennell, J.D. Mobley, 2006. Air emission inventories in North America: A critical assessment.<br />
J. Air Waste Manage. Assoc., 56 (8): p.1115.<br />
Millet, D.B., A.H. Goldstein, R. Holzinger, B.J. Williams, J.D. Allan, J.L. Jiménez, D.R. Worsnop, J.M. Roberts,<br />
A.B. White, R.C. Hudman, I.T. Bertschi, A. Stohl, 2006. Chemical characteristics of North American surface<br />
layer outflow: Insights from Chebogue Point, Nova Scotia. J. Geophys. Res.-Atmos., 111 (D23): Art. No.<br />
D23S53.<br />
Miloshevich, L.M., H. Vomel, D.N. Whiteman, B.M. Lesht, F.J. Schmidlin, F. Russo, 2006. Absolute accuracy of<br />
water vapor measurements from six operational radiosonde types launched during AWEX-G <strong>and</strong> implications<br />
for AIRS validation. J. Geophys. Res.-Atmos., 111 (D9): Art. No. D09S10.<br />
Minter, C.F., D.S. Robertson, P.S.J. Spencer, A. R. Jacobson, T.J. Fuller-Rowell, R. Moses, D.M. Susczynsky, <strong>and</strong><br />
E.A. Araujo-Pradere, 2006. A comparison of MAGIC <strong>and</strong> FORTE ionospheric measurements. Radio Sci., 42:<br />
doi: 10.1029/2006RS003460.<br />
Mitrovica, J.X., J. Wahr, I. Matsuyama, A. Paulson, M.E. Tamisiea, 2006. Reanalysis of ancient eclipse, astronomic<br />
<strong>and</strong> geodetic data: A possible route to resolving the enigma of global sea-level rise. Earth Planet. Sci. Lett.,<br />
243 (4-Mar): p.390.<br />
Molnar, P., R.S. Anderson, G. Kier, J. Rose, 2006. Relationships among probability distributions of stream<br />
discharges in floods, climate, bed load transport, <strong>and</strong> river incision. J. Geophys. Res.-Earth Surf., 111 (F2):<br />
Art. No. F02001.<br />
Molnar, P., G.A. Houseman, P.C. Engl<strong>and</strong>, 2006. Earth science-palaeo-altimetry of Tibet. Nature, 444 (7117): p.E4.<br />
Molotch, N.P., R.C. Bales, 2006. Comparison of ground-based <strong>and</strong> airborne snow surface albedo parameterizations<br />
in an alpine watershed: Impact on snowpack mass balance. Water Resour. Res., 42 (5): Art. No. W05410.<br />
Molotch, N.P., R.C. Bales, 2006. SNOTEL representativeness in the Rio Gr<strong>and</strong>e headwaters on the basis of<br />
physiographics <strong>and</strong> remotely sensed snow cover persistence. Hydrol. Process., 20 (4): p.723.<br />
177
Appendices: Publications<br />
Monsalve, G., A. Sheehan, V. Schulte-Pelkum, S. Rajaure, M.R. P<strong>and</strong>ey, F. Wu., 2006. Seismicity <strong>and</strong> onedimensional<br />
velocity structure of the Himalayan collision zone: Earthquakes in the crust <strong>and</strong> upper mantle. J.<br />
Geophys. Res.-Solid Earth, 111 (B10): doi:10.1029/2005JB004062Art. No. B10301.<br />
Monson, R.K., S.P. Burns, M.W. Williams, A.C, Delany, M. Weintraub, D.A. Lipson, 2006. The contribution of<br />
beneath-snow soil respiration to total ecosystem respiration in a high-elevation, subalpine forest. Glob.<br />
Biogeochem. Cycle, 20 (3): Art. No. GB3030.<br />
Monson, R.K., D.L. Lipson, S.P. Burns, A.A. Turnipseed, A.C. Delany, M.W. Williams, S.K. Schmidt, 2006.<br />
Winter forest soil respiration controlled by climate <strong>and</strong> microbial community composition. Nature,<br />
439(7077): p.711.<br />
Monson, R.K., T.N. Rosenstiel, T.A. Forbis, D.A. Lipson, C.H. Jaeger, 2006. Nitrogen <strong>and</strong> carbon storage in alpine<br />
plants. Integr. Comp. Biol., 46 (1): p.35.<br />
Montgomery, M. T., M. E. Nicholls, T. A. Cram, <strong>and</strong> A.B. Saunders, 2006. A vortical hot tower route to tropical<br />
cyclogenesis. J. Atmos. Sci., 63: p.355.<br />
Moore, A.M., J. Zavala-Garay, Y.M. Tang, R. Kleeman, A.T. Weaver, J. Vialard, K. Sahami, D.L.T. Anderson, M.<br />
Fisher, 2006. Optimal forcing patterns for coupled models of ENSO. J. Clim., 19 (18): p.4683.<br />
Moore, D.J.P., S. Aref, R.M. Ho, J.S. Pippen, J.G. Hamilton, <strong>and</strong> E.H. DeLucia, 2006. Annual basal area increment<br />
<strong>and</strong> growth duration of Pinus taeda in response to eight years of free-air carbon dioxide enrichment. Global<br />
Change Biology, 12: p.1367.<br />
Morrill, C., J.T. Overpeck, J.E. Cole, K.B. Liu, C. Shen, <strong>and</strong> L. Tang, 2006. Holocene variations in the Asian<br />
monsoon inferred from the geochemistry of lake sediments in central Tibet. Quaternary Research, 65: p.232.<br />
Morris, G.A., S. Hersey, A.M. Thompson, S. Pawson, J.E. Nielsen, P.R. Colarco, W.W. McMillan, A. Stohl, S.<br />
Turquety, J. Warner, B.J. Johnson, T.L. Kucsera, D.E. Larko, S.J. Oltmans, J.C. Witte, 2006. Alaskan <strong>and</strong><br />
Canadian forest fires exacerbate ozone pollution over Houston, Texas, on 19 <strong>and</strong> 20 July 2004. J. Geophys.<br />
Res.-Atmos., 111 (D24): Art. No. D24S03.<br />
Murphey, H.V., R.M. Wakimoto, C. Flamant, D.E. Kingsmill, 2006. Dryline on 19 June 2002 during IHOP. Part I:<br />
Airborne Doppler <strong>and</strong> LEANDRE II analyses of the thin line structure <strong>and</strong> convection initiation. Mon. Wea.<br />
Rev., 134 (1): p.406.<br />
Murphy, D.J., J.M. Forbes, R.L. Walterscheid, M.E. Hagan, S.K. Avery, T. Aso, G.J. Fraser, D.C. Fritts, M.J. Jarvis,<br />
A.J. McDonald, D.M. Riggin, M. Tsutsumi, R.A. Vincent, 2006. A climatology of tides in the Antarctic<br />
mesosphere <strong>and</strong> lower thermosphere. J. Geophys. Res.-Atmos., 111 (D23): Art. No. D23104.<br />
Murphy, D.M., D.J. Cziczo, K.D. Froyd, P.K. Hudson, B.M. Matthew, A.M. Middlebrook, R.E. Peltier, A. Sullivan,<br />
D.S. Thomson, R.J. Weber, 2006. Single-particle mass spectrometry of tropospheric aerosol particles. J.<br />
Geophys. Res.-Atmos., 111 (D23): Art. No. D23S32.<br />
Murphy, D.M., P.K. Hudson, D.S. Thomson, P.J. Sheridan, J.C. Wilson, 2006. Observations of mercury-containing<br />
aerosols. Environ. Sci. Technol., 40 (10): p.3163.<br />
Neiman, P.J., F.M. Ralph, A.B. White, D.D. Parrish, J.S. Holloway, D.L. Bartels, 2006. A multiwinter analysis of<br />
channeled flow through a prominent gap along the northern California coast during CALJET <strong>and</strong> PACJET.<br />
Mon. Wea. Rev., 134 (7): p.1815.<br />
Nerem, R.S., E. Leuliette, A. Cazenave, 2006. Present-day sea-level change: A review. C. R. Geosci., 338 (14-15):<br />
p.1077.<br />
Neuman, J.A., D.D. Parrish, M. Trainer, T.B. Ryerson, J.S. Holloway, J.B. Nowak, A. Swanson, F. Flocke, J.M.<br />
Roberts, S.S. Brown, H. Stark, R. Sommariva, A. Stohl, R. Peltier, R. Weber, A.G. Wollny, D.T. Sueper, G.<br />
Hubler, F.C. Fehsenfeld, 2006. Reactive nitrogen transport <strong>and</strong> photochemistry in urban plumes over the<br />
North Atlantic Ocean. J. Geophys. Res.-Atmos., 111 (D23): Art. No. D23S54.<br />
Neumann, D., B. Rajagopalan <strong>and</strong> E. Zagona, 2006. A decision support system to manage summer stream<br />
temperatures for water quality improvement in the Truckee River near Reno, NV. J. Amer. Water Resources<br />
Assoc., 42 (5): p.1275.<br />
Niemeier, U., C. Granier, L. Kornblueh, S. Walters, G.P. Brasseur, 2006. Global impact of road traffic on<br />
atmospheric chemical composition <strong>and</strong> on ozone climate forcing. J. Geophys. Res.-Atmos., 111 (D9): Art. No.<br />
D09301.<br />
Nolin, A.W., E.A. Hall-McKim, 2006. Frequency modes of monsoon precipitation in Arizona <strong>and</strong> New Mexico.<br />
Mon. Weather Rev., 134 (12): p.3774.<br />
Nowak, J.B., L.G. Huey, A.G. Russell, D. Tian, J.A. Neuman, D. Orsini, S.J. Sjostedt, A.P. Sullivan, D.J. Tanner,<br />
R.J. Weber, A. Nenes, E. Edgerton, F.C. Fehsenfeld, 2006. Analysis of urban gas phase ammonia<br />
measurements from the 2002 Atlanta Aerosol Nucleation <strong>and</strong> Real-Time Characterization Experiment<br />
(ANARChE). J. Geophys. Res.-Atmos., 111 (D17): Art. No. D17308.<br />
178
Appendices: Publications<br />
Olsen, N., R. Haagmans, T.J. Sabaka, A. Kuvshinov, S Maus, M.E. Purucker, M. Rother, V. Lesur, M. M<strong>and</strong>ea,<br />
2006. The Swarm End-to-End mission simulator study: A demonstration of separating the various<br />
contributions to Earth‘s magnetic field using synthetic data. Earth Planets Space, 58 (4): p.359.<br />
Oltmans, S.J., A.S. Lefohn, J.M. Harris, I. Galbally, H.E. Scheel, G. Bodeker, E. Brunke, H. Claude, D. Tarasick,<br />
B.J. Johnson, P. Simmonds, D. Shadwick, K. Anlauf, K. Hayden, F. Schmidlin, T. Fujimoto, K. Akagi, C.<br />
Meyer, S. Nichol, J. Davies, A. Redondas, E. Cuevas, 2006. Long-term changes in tropospheric ozone.<br />
Atmos. Environ., 40 (17): p.3156.<br />
Osthoff, H.D., S.S. Brown, T.B. Ryerson, T.J. Fortin, B.M. Lerner, E.J. Williams, A. Pettersson, T. Baynard, W.P.<br />
Dube, S.J. Ciciora, A.R. Ravishankara, 2006. Measurement of atmospheric NO2 by pulsed cavity ring-down<br />
spectroscopy. J. Geophys. Res.-Atmos., 111 (D12): Art. No. D12305.<br />
Osthoff, H.D., R. Sommariva, T. Baynard, A. Pettersson, E.J. Williams, B.M. Lerner, J.M. Roberts, H. Stark, P.D.<br />
Goldan, W.C. Kuster, T.S. Bates, D. Coffman, A.R. Ravishankara, S.S. Brown, 2006. Observation of daytime<br />
N2O5 in the marine boundary layer during New Engl<strong>and</strong> Air Quality Study – Intercontinental Transport <strong>and</strong><br />
Chemical Transformation 2004. J. Geophys. Res.-Atmos., 111 (D23): Art. No. D23S14.<br />
Owen, R.C., O.R. Cooper, A. Stohl, R.E. Honrath, 2006. An analysis of the mechanisms of North American<br />
pollutant transport to the central North Atlantic lower free troposphere. J. Geophys. Res.-Atmos., 111 (D23):<br />
Art. No. D23S58.<br />
Paci, I., J.C. Johnson, X. Chen, G. Rana, D. Popović, D.E. David, A.J. Nozik, M.A. Ratner, J. Michl, 2006. Singlet<br />
fission for dye-sensitized solar cells: Can a suitable sensitizer be found? J. Amer. Chem. Soc., 128: 16546.<br />
Pagowski, M., 2006: An iterative solution of flux-profile relationships in the surface layer for regional model<br />
applications. Atmos. Environ., 40 (35): p.6892.<br />
Pagowski, M., G.A. Grell, 2006. Ensemble-based ozone forecasts: Skill <strong>and</strong> economic value. J. Geophys. Res.-<br />
Atmos., 111 (D23): Art. No. D23S30.<br />
Pagowski, M; G.A. Grell, D. Devenyi, S.E. Peckham, S.A. McKeen, W. Gong, L. Delle Monache, J.N. McHenry, J.<br />
McQueen, P. Lee, 2006. Application of dynamic linear regression to improve the skill of ensemble-based<br />
deterministic ozone forecasts. Atmos. Environ., 40 (18): p.3240.<br />
Pahlow, M., G, Feingold, A. Jefferson, E. Andrews, J.A. Ogren, J. Wang, Y.N. Lee, R.A. Ferrare, D.D. Turner,<br />
2006. Comparison between lidar <strong>and</strong> nephelometer measurements of aerosol hygroscopicity at the Southern<br />
Great Plains Atmospheric Radiation Measurement site. J. Geophys. Res.-Atmos., 111 (D5): Art. No. D05S15.<br />
Pahlow, M., D. Muller, M. Tesche, H. Eichler, G. Feingold, W.L. Eberhard, Y.F. Cheng, 2006. Retrieval of aerosol<br />
properties from combined multiwavelength lidar <strong>and</strong> sunphotometer measurements. Appl. Optics, 45 (28):<br />
p.7429.<br />
Parish, T.R., J.J. Cassano, M.W. Seefeldt, 2006. Characteristics of the Ross Ice Shelf air stream as depicted in<br />
Antarctic Mesoscale Prediction System simulations. J. Geophys. Res.-Atmos., 111 (D12): Art. No. D12109.<br />
Park, S.S., M.A. Alex<strong>and</strong>er, C. Deser, 2006. The impact of cloud radiative feedback, remote ENSO forcing, <strong>and</strong><br />
entrainment on the persistence of North Pacific sea surface temperature anomalies. J. Clim., 19 (23): p.6243.<br />
Parsons, M.A. <strong>and</strong> R.G. Barry, 2006. Interdisciplinary data management in support of the International Polar Year,<br />
Eos, Trans. AGU, 87: p.295.<br />
Parsons, M.A. et al., 2006, International Polar Year Data Management Workshop, 3-4 March 2006, Cambridge, UK.<br />
Glaciological Data, 33: p.1-49.<br />
Pechtl, S., E.R. Lovejoy, J.B. Burkholder, R. von Glasow, 2006. <strong>Modeling</strong> the possible role of iodine oxides in<br />
atmospheric new particle formation. Atmos. Chem. Phys., 6: p.505.<br />
Peltier, R.E., A. P. Sullivan, R. J. Weber, C. A. Brock, A. G. Wollny, J. S. Holloway, J. A. de Gouw, C. Warneke,<br />
2006. Fine aerosol bulk composition measured on WP-3D research aircraft in vicinity of the Northeastern<br />
United States - results from NEAQS. Atmos. Chem. Phys. Disc., 7: p.3073.<br />
Penalba, O., A. Beltrán, <strong>and</strong> C.D. Messina, 2006. Monthly rainfall in Central-Eastern Argentina <strong>and</strong> ENSO. Revista<br />
Brasileira de Agrometeorología, 13: p.49.<br />
Peng, S.L., W.A. Robinson, S.L. Li, M.A. Alex<strong>and</strong>er, 2006. Effects of Ekman transport on the NAO response to a<br />
tropical Atlantic SST anomaly. J. Clim., 19 (19): p.4803.<br />
Penl<strong>and</strong>, C., L. Matrosova, 2006. Studies of El Niño <strong>and</strong> interdecadal variability in tropical sea surface temperatures<br />
using a nonnormal filter. J. Clim., 19 (22): p.5796.<br />
Pfister, G.G., L.K. Emmons, P.G. Hess, R. Honrath, J.F. Lamarque, M.V. Martin, R.C. Owen, M.A. Avery, E.V.<br />
Browell, J.S. Holloway, P. Nedelec, R. Purvis, T.B. Ryerson, G.W. Sachse, H. Schlager, 2006. Ozone<br />
production from the 2004 North American boreal fires. J. Geophys. Res.-Atmos., 111 (D24): Art. No.<br />
D24S07.<br />
179
Appendices: Publications<br />
Pielke Sr., R.A., D. Stokowski, J. W. Wang, T. Vukicevic, G. Leoncini, T. Matsui, C. Castro, D. Niyogi, C.M.<br />
Kishtawal, A. Biazar, K. Doty, R.T. McNider, U. Nair, W.K. Tao, 2006. Satellite-based model<br />
parameterization of diabatic heating. EOS, Vol 88, No. 8. p. 96-97.<br />
Pielke Sr., R.A., J. Adegoke, A. Beltran-Przekurat, C.A. Hiemstra, J. Lin, U.S. Nair, D. Niyogi, T.E. Nobis, 2006.<br />
Impacts of regional l<strong>and</strong> use <strong>and</strong> l<strong>and</strong> cover on rainfall: An overview. Hydrol. Sci. J., IAHS Publ. 308.<br />
Pielke Sr., R.A., T. Matsui, G. Leoncini, T. Nobis, U. Nair, E. Lu, J. Eastman, S. Kumar, C. Peters-Lidard, Y. Tian,<br />
R. Walko, 2006. A new paradigm for parameterizations in numerical weather prediction <strong>and</strong> other<br />
atmospheric models. National Weather Digest, 30: p.93.<br />
Pielke, Jr., R. A., 2006. Disasters, Death, <strong>and</strong> Destruction: Making Sense of Recent Calamities. Oceanography, 19:<br />
p.138.<br />
Pielke, Jr., R. A., C.W. L<strong>and</strong>sea, M. Mayfield, J. Laver, R. Pasch, 2006. Reply to Hurricanes <strong>and</strong> global warming<br />
potential linkages <strong>and</strong> consequences. Bull. Amer. Meteorol. Soc., 87: p.628.<br />
Pielke, R.A., Sr., K. Wolter, O. Bliss, N. Doesken, B. McNoldy, 2006. The July 2005 Denver heat wave: How<br />
unusual was it? National Weather Digest, 31 (July 2007) (23): Art. No. L23709.<br />
Pielke, R., C. L<strong>and</strong>sea, M. Mayfield, J. Laver, R. Pasch, 2006. Reply to ―Hurricanes <strong>and</strong> global warming – Potential<br />
linkages <strong>and</strong> consequences.‖ Bull. Amer. Meteorol. Soc., 87 (5): p.628.<br />
Pielke, R.A., 2006. Kicking the carbon habit: Global warming <strong>and</strong> the case for renewable <strong>and</strong> nuclear energy.<br />
Nature, 443 (7113): p.753.<br />
Pielke, R.A., 2006. Attribution of disaster losses (vol 310, pg 1615, 2005). Science, 311 (5760): p.470.<br />
Pincus, R., R. Hemler, S.A. Klein, 2006. Using stochastically generated subcolumns to represent cloud structure in a<br />
large-scale model. Mon. Wea. Rev., 134 (12): p.3644.<br />
Pino, D., J. Vila-Guerau de Arellano, S. W. Kim, 2006. Representing sheared convective boundary layer by zeroth-<br />
<strong>and</strong> first-order jump mixed layer models: large-eddy simulation verification. J. Appl. Meteorol. <strong>and</strong> Clim., 45:<br />
10.1175/JAM23961.<br />
Popp, P.J., T.P. Marcy, E.J. Jensen, B. Karcher, D.W. Fahey, R.S. Gao, T.L. Thompson, K.H. Rosenlof, E.C.<br />
Richard, R.L. Herman, E.M. Weinstock, J.B. Smith, R.D. May, H. Vomel, J.C. Wilson, A.J. Heymsfield, M.J.<br />
Mahoney, A.M. Thompson, 2006. The observation of nitric acid-containing particles in the tropical lower<br />
stratosphere. Atmos. Chem. Phys., 6: p.601.<br />
Poveda, G., P.R. Waylen, R.S. Pulwarty, 2006. Annual <strong>and</strong> inter-annual variability of the present climate in northern<br />
South America <strong>and</strong> southern Mesoamerica. Paleogeogr. Paleoclimatol. Paleoecol., 234 (1): p.33.<br />
Powell, D.C., T. Markus, D.J. Cavalieri, A.J. Gasiewski, M. Klein, J.A. Maslanik, J.C. Stroeve, M. Sturm, 2006.<br />
Microwave signatures of snow on sea ice: <strong>Modeling</strong>. IEEE Trans. Geosci. Remote Sensing, 44 (11): p.3091.<br />
Prairie, J., B. Rajagopalan, T. Fulp, E. Zagona, 2006. Modified K-NN model for stochastic streamflow simulation. J.<br />
Hydro. Eng., 11 (4): p.371.<br />
Quan, X.W., M.P. Hoerling, J.S. Whitaker, G.T. Bates <strong>and</strong> T. Xu, 2006. Diagnosing sources of U.S. seasonal<br />
forecast skill. J. Climate, 19: p.3279.<br />
Quinn, P.K., T.S. Bates, D. Coffman, T.B. Onasch, D. Worsnop, T. Baynard, J.A. de Gouw, P.D. Goldan, W.C.<br />
Kuster, E. Williams, J.M. Roberts, B. Lerner, A. Stohl, A. Pettersson, E.R. Lovejoy, 2006. Impacts of sources<br />
<strong>and</strong> aging on submicrometer aerosol properties in the marine boundary layer across the Gulf of Maine. J.<br />
Geophys. Res.-Atmos., 111 (D23): Art. No. D23S36.<br />
Rajakumar, B., R.W. Portmann, J.B. Burkholder, A.R. Ravishankara, 2006. Rate coefficients for the reactions of OH<br />
with CF3CH2CH3 (HFC-263fb), CF3CHFCH2F (HFC-245eb), <strong>and</strong> CHF2CHFCHF2 (HFC-245ea) between 238<br />
<strong>and</strong> 375 K. J. Phys. Chem. A, 110 (21): p.6724.<br />
Ralph, F.M., P.J. Neiman, G.A. Wick, S.I. Gutman, M.D. Dettinger, D.R. Cayan, A.B. White, 2006. Flooding on<br />
California‘s Russian River: Role of atmospheric rivers. Geophys. Res. Lett., 33 (13): Art. No. L13801.<br />
R<strong>and</strong>el, W.J., F.Wu, H. Vomel, G.E. Nedoluha, P. Forster, 2006. Decreases in stratospheric water vapor after 2001:<br />
Links to changes in the tropical tropopause <strong>and</strong> the Brewer-Dobson circulation. J. Geophys. Res.-Atmos., 111<br />
(D12): Art. No. D12312.<br />
Rau, F., J.S. Kargel, B.H. Raup, 2006. The GLIMS glacier inventory of the Antarctic Peninsula. Earth Observer, 18:<br />
p.99.<br />
Ray, D.K., U.S. Nair, R.O. Lawton, R.M. Welch, <strong>and</strong> R.A. Pielke Sr., 2006. Impact of l<strong>and</strong> use on Costa Rican<br />
tropical montane cloud forests: Sensitivity of orographic cloud formation to deforestation in the plains. J.<br />
Geophys. Res, 111: doi: 10.1029/2005JD006096.<br />
Ray, E., K. Rosenlof, 2006. Hydration of the upper troposphere by tropical cyclones. J. Geophys. Res.–Atmos.:<br />
2006JD008009.<br />
180
Appendices: Publications<br />
Regonda, S.K., B. Rajagopalan, M. Clark, 2006. A new method to produce categorical streamflow forecasts. Water<br />
Resour. Res., 42 (9): Art. No. W09501.<br />
Regonda, S.K., B. Rajagopalan, M. Clark, E. Zagona, 2006. A multimodel ensemble forecast framework:<br />
Application to spring seasonal flows in the Gunnison River Basin. Water Resour. Res., 42 (9): Art. No.<br />
W09404.<br />
Reinard, A., M. Andrews, 2006. Comparison of CME characteristics for SEP <strong>and</strong> non-SEP related events. Adv.<br />
Space Res., 38: p.480.<br />
Rex, M., R.J. Salawitch, H. Deckelmann, P. von der Gathen, N.R.P. Harris, M.P. Chipperfield, B. Naujokat, E.<br />
Reimer, M. Allaart, S.B. Andersen, R. Bevilacqua, G.O. Braathen, H. Claude, J. Davies, H. De Backer, H.<br />
Dier, V. Dorokhov, H. Fast, M. Gerding, S. Godin-Beekmann, K. Hoppel, B. Johnson, E. Kyro, Z. Litynska,<br />
D. Moore, H. Nakane, M.C. Parrondo, A.D. Risley, P. Skrivankova, R. Stubi, P. Viatte, V. Yushkov, C.<br />
Zerefos, 2006. Arctic winter 2005: Implications for stratospheric ozone loss <strong>and</strong> climate change. Geophys.<br />
Res. Lett., 33 (23): Art. No. L23808.<br />
Richard, E.C., A.F. Tuck, K.C. Aikin, K.K. Kelly, R.L. Herman, R.F. Troy, S.J. Hovde, K.H. Rosenlof, T.L.<br />
Thompson, E.A. Ray, 2006. High-resolution airborne profiles of CH4, O3, <strong>and</strong> water vapor near tropical<br />
Central America in late January to early February 2004. J. Geophys. Res.-Atmos., 111 (D13): Art. No.<br />
D13304.<br />
Riffault, V., T. Gierczak, J.B. Burkholder, A.R. Ravishankara, 2006. Quantum yields for OH production in the<br />
photodissociation of HNO3 at 248 <strong>and</strong> 308 nm <strong>and</strong> H2O2 at 308 <strong>and</strong> 320 nm. Phys. Chem. Chem. Phys., 8 (9):<br />
p.1079.<br />
Riley, P., J.A. Linker, Z. Mikic, D. Odstrcil, 2006. <strong>Modeling</strong> interplanetary coronal mass ejections. Adv. Space Res.,<br />
38(3): P.535.<br />
Rinke, A., K. Dethloff, J.J. Cassano, J.H. Christensen, J.A. Curry, P. Du, E. Girard, J.E. Haugen, D. Jacob, C.G.<br />
Jones, M. Koltzow, R. Laprise, A.H. Lynch, S. Pfeifer, M.C. Serreze, M.J. Shaw, M. Tjernstrom, K. Wyser,<br />
M. Zagar, 2006. Evaluation of an ensemble of Arctic regional climate models: Spatiotemporal fields during<br />
the SHEBA year (vol 26, pg 459, 2006). Clim. Dyn., 27 (4): p.433.<br />
Rivas, M.B., J.A. Maslanik, J.G. Sonntag, P. Axelrad, 2006. Sea ice roughness from airborne LIDAR profiles. IEEE<br />
Trans. Geosci. Remote Sensing, 44 (11): p.3032.<br />
Roberts, J.M., M. Marchewka, S.B. Bertman, P. Goldan, W. Kuster, J. de Gouw, C. Warneke, E. Williams, B.<br />
Lerner, P. Murphy, E. Apel, F.C. Fehsenfeld, 2006. Analysis of the isoprene chemistry observed during the<br />
New Engl<strong>and</strong> Air Quality Study (NEAQS) 2002 intensive experiment. J. Geophys. Res.-Atmos., 111 (D23):<br />
Art. No. D23S12.<br />
Robinson, J.E., B.W. Eakins, 2006. Calculated volumes of individual shield volcanoes at the young end of the<br />
Hawaiian Ridge. J. Volcanol. Geotherm. Res., 151: p.309.<br />
Rontu, N., V. Vaida, 2006. Vibrational spectroscopy of perfluoroproplonic acid in the region between 1000 <strong>and</strong><br />
11000 cm (-1). J. Mol. Spectrosc., 237 (1): p.19.<br />
Roundy, P.E., G.N. Kiladis, 2006. Observed relationships between oceanic kelvin waves <strong>and</strong> atmospheric forcing. J.<br />
Clim., 19 (20): p.5253.<br />
Ryan, S., E.J. Dlugokencky, P.P. Tans, M.E. Trudeau, 2006. Ryan, S., E.J. Dlugokencky, P.P. Tans, M.E. Trudeau.<br />
Geophys. Res. Lett., 33: L12301.<br />
Ryan, S., E.J. Dlugokencky, P.P. Tans, M.E. Trudeau, 2006. Mauna Loa volcano is not a methane source:<br />
Implications for Mars. Geophys. Res. Lett., 33 (12): Art. No. L12301.<br />
Sacks, W.J., D.S. Schimel, R.K. Monson, B.H. Braswell, 2006. Model-data synthesis of diurnal <strong>and</strong> seasonal CO2<br />
fluxes at Niwot Ridge, Colorado. Global Change Biology, 12(2): p.240.<br />
Salcedo, D., T.B. Onasch, K. Dzepina, M.R. Canagaratna, Q. Zhang, J.A. Huffman, P.F. DeCarlo, J.T. Jayne, P.<br />
Mortimer, D.R. Worsnop, C.E. Kolb, K.S. Johnson, B. Zuberi, L.C. Marr, R. Volkamer, L.T. Molina, M.J.<br />
Molina, B. Cardenas, R.M. Bernabe, C. Marquez, J.S. Gaffney, N.A. Marley, A. Laskin, V. Shutthan<strong>and</strong>an,<br />
Y. Xie, W. Brune, R. Lesher, T. Shirley, J.L. Jiménez, 2006. Characterization of ambient aerosols in Mexico<br />
City during the MCMA-2003 campaign with Aerosol Mass Spectrometry: Results from the CENICA<br />
Supersite. Atmos. Chem. Phys., 6: p.925.<br />
San Martini, F.M., E.J. Dunlea, M. Grutter, T.B. Onasch, J.T. Jayne, M.R. Canagaratna, D.R. Worsnop, C.E. Kolb,<br />
J.H. Shorter, S.C. Herndon, M.S. Zahniser, J.M. Ortega, G.J. Mcrae, L.T. Molina, M.J. Molina, 2006.<br />
Implementation of a Markov Chain Monte Carlo method to inorganic aerosol modeling of observations from<br />
the MCMA-2003 campaign - Part I: Model description <strong>and</strong> application to the La Merced site. Atmos. Chem.<br />
Phys., 6: p.4867.<br />
181
Appendices: Publications<br />
San Martini, F.M., E.J. Dunlea, R. Volkamer, T.B. Onasch, J.T. Jayne, M.R. Canagaratna, D.R. Worsnop, C.E.<br />
Kolb, J.H. Shorter, S.C. Herndon, M.S. Zahniser, D. Salcedo, K. Dzepina, K; J.L. Jiménez, J.M. Ortega, K.S.<br />
Johnson, G.J. McRae, L.T. Molina, M.J. Molina, 2006. Implementation of a Markov Chain Monte Carlo<br />
method to inorganic aerosol modeling of observations from the MCMA-2003 campaign - Part II: Model<br />
application to the CENICA, Pedregal <strong>and</strong> Santa Ana sites. Atmos. Chem. Phys., 6: p.4889.<br />
Satyabala, S.P., R. Bilham, 2006. Surface deformation <strong>and</strong> subsurface slip of the 28 March 1999 Mw=6.4 west<br />
Himalayan Chamoli earthquake from InSAR analysis. Geophys. Res. Lett., 33 (23): Art. No. L23305.<br />
Schaepman-Strub, G., M.E. Schaepman, T.H. Painter, S. Dangel, J.V. Martonchik, 2006. Reflectance quantities in<br />
optical remote sensing-definitions <strong>and</strong> case studies. Remote Sens. Environ., 103 (1): p.27.<br />
Schmidt, G.A., R. Ruedy, J.E. Hansen, I. Aleinov, N. Bell, M. Bauer, S. Bauer, B. Cairns, V. Canuto, Y. Cheng, A.<br />
Del Genio, G. Faluvegi, A.D. Friend, T.M. Hall, Y. Hu, M. Kelley, N.Y. Kiang, D. Koch, A.A. Lacis, J.<br />
Lerner, K.K. Lo, R.L. Miller, L. Nazarenko, V. Oinas, J. Perlwitz, J. Perlwitz, D. Rind, A. Romanou, G.L.<br />
Russell, Mki. Sato, D.T. Shindell, P.H. Stone, S. Sun, N. Tausnev, D. Thresher, M.S. Yao, 2006. Present day<br />
atmospheric simulations using GISS ModelE: Comparison to in-situ, satellite <strong>and</strong> reanalysis data. J. Climate,<br />
19: p.153.<br />
Schofield, R., P.V. Johnston, A. Thomas, K. Kreher, B.J. Connor, S. Wood, D. Shooter, M.P. Chipperfield, A.<br />
Richter, R. von Glasow, C.D. Rodgers, 2006. Tropospheric <strong>and</strong> stratospheric BrO columns over Arrival<br />
Heights, Antarctica, 2002. J. Geophys. Res.-Atmos., 111 (D22): Art. No. D22310.<br />
Schwarz, J.P., R.S. Gao, D.W. Fahey, D.S. Thomson, L.A. Watts, J.C. Wilson, J.M. Reeves, M. Darbeheshti, D.G.<br />
Baumgardner, G.L. Kok, S.H. Chung, M Schulz, J. Hendricks, A. Lauer, B. Karcher, J.G. Slowik, K.H.<br />
Rosenlof, T.L. Thompson, A.O. Langford, M. Loewenstein, K.C. Aikin, 2006. Single-particle measurements<br />
of midlatitude black carbon <strong>and</strong> light-scattering aerosols from the boundary layer to the lower stratosphere. J.<br />
Geophys. Res.-Atmos., 111 (D16): Art. No. D16207.<br />
Schwing, F.B., N.A. Bond, S.J. Bograd, T. Mitchell, M.A. Alex<strong>and</strong>er, N. Mantua, 2006. Delayed coastal upwelling<br />
along the U.S. West Coast in 2005: A historical perspective. Geophys. Res. Lett., 33 (22): Art. No. L22S01.<br />
Scott-Denton, L.E., T.N. Rosenstiel, R.K. Monson.2006, Differential controls by climate <strong>and</strong> substrate over the<br />
heterotrophic <strong>and</strong> rhizospheric components of soil respiration. Glob. Change Bio., 12(2): p.205.<br />
Serreze, M.C, <strong>and</strong> J.A. Francis, 2006. The Arctic on the fast track of change. Weather, 61(3): p.65.<br />
Serreze, M.C., A.P. Barrett, A.G. Slater, R.A. Woodgate, K. Aagaard, R.B. Lammers, M. Steele, R. Moritz, M.<br />
Meredith, C.M. Lee, 2006. The large-scale freshwater cycle of the Arctic. J. Geophys. Res.-Oceans, 111<br />
(C11): Art. No. C11010.<br />
Serreze, M.C., J.A. Francis, 2006. The Arctic amplification debate. Clim. Change, 76 (4-Mar): p.241.<br />
Shannon, R.D., R.X. Fischer, 2006. Empirical electronic polarizabilities in oxides, hydroxides, oxyfluorides, <strong>and</strong><br />
oxychlorides. Phys. Rev. B, 73 (23): Art. No. 235111.<br />
Sharma, S., E. Andrews, L.A. Barrie, J.A. Ogren, D. Lavoue, 2006. Variations <strong>and</strong> sources of the equivalent black<br />
carbon in the high Arctic revealed by long-term observations at Alert <strong>and</strong> Barrow: 1989-2003. J. Geophys.<br />
Res.-Atmos., 111 (D14): Art. No. D14208.<br />
Shilling, J.E., B.M. Connelly, M.A. Tolbert, 2006. Uptake of small oxygenated organic molecules onto ammonium<br />
nitrate under upper tropospheric conditions. J. Phys. Chem. A, 110 (21): p.6687.<br />
Shilling, J.E., T.J. Fortin, M.A. Tolbert, 2006. Depositional ice nucleation on crystalline organic <strong>and</strong> inorganic<br />
solids. J. Geophys. Res.-Atmos., 111 (D12): Art. No. D12204.<br />
Shilling, J.E., M.A. Tolbert, O.B. Toon, E.J. Jensen, B.J. Murray, A.K. Bertram, 2006. Measurements of the vapor<br />
pressure of cubic ice <strong>and</strong> their implications for atmospheric ice clouds. Geophys. Res. Lett., 33 (17): Art. No.<br />
L17801.<br />
Shin, S.I., P.D. Sardeshmukh, R.S. Webb, R.J. Oglesby, J.J. Barsugli, 2006. Underst<strong>and</strong>ing the mid-Holocene<br />
climate. J. Clim., 19 (12): p.2801.<br />
Shindell, D.T., G. Faluvegi, D.S. Stevenson, M.C. Krol, L.K. Emmons, J.F. Lamarque, G. Petron, F.J. Dentener, K.<br />
Ellingsen, M.G. Schultz, O. Wild, M. Amann, C.S. Atherton, D.J. Bergmann, I. Bey, T. Butler, J. Cofala,<br />
W.J. Collins, R.G. Derwent, R.M. Doherty, J. Drevet, H.J. Eskes, A.M. Fiore, M. Gauss, D.A. Hauglustaine,<br />
L.W. Horowitz, I.S.A. Isaksen, M.G. Lawrence, V. Montanaro, J.F. Muller, G. Pitari, M.J. Prather, J.A. Pyle,<br />
S. Rast, J.M. Rodriguez, M.G. S<strong>and</strong>erson, N.H. Savage, S.E. Strahan, K. Sudo, S. Szopa, N. Unger, T.P.C.<br />
van Noije, G. Zeng, 2006. Multimodel simulations of carbon monoxide: Comparison with observations <strong>and</strong><br />
projected near-future changes. J. Geophys. Res.-Atmos., 111 (D19): Art. No. D19306.<br />
Shupe, M.D., S.Y. Matrosov, T. Uttal, 2006. Arctic mixed-phase cloud properties derived from surface-based<br />
sensors at SHEBA. J. Atmos. Sci., 63 (2): p.697.<br />
182
Appendices: Publications<br />
Sierau, B., D.S. Covert, D.J. Coffman, P.K. Quinn, T.S. Bates, 2006. Aerosol optical properties during the 2004<br />
New Engl<strong>and</strong> Air Quality Study - Intercontinental Transport <strong>and</strong> Chemical Transformation: Gulf of Maine<br />
surface measurements - Regional <strong>and</strong> case studies. J. Geophys. Res.-Atmos., 111 (D23): Art. No. D23S37.<br />
Slater, A.G., M.P. Clark, 2006. Snow data assimilation via an ensemble Kalman filter. J. Hydrometeorol., 7 (3):<br />
p.478.<br />
Smith, B.E., C.F. Raymond, T. Scambos, 2006. Anisotropic texture of ice sheet surfaces. J. Geophys. Res.-Earth<br />
Surf., 111 (F1): Art. No. F01019.<br />
Smith, J.D., C.D. Cappa, W.S. Drisdell, K.R. Wilson, R.C. Cohen, R. J. Saykally, 2006. Probing the local structure<br />
of liquid water by X-ray absorption spectroscopy. J. Phys. Chem. B, 110: p.20038.<br />
Smith, J.D., C.D. Cappa, W.S. Drisdell, K.R. Wilson, R.C. Cohen, R.J. Saykally, 2006. Raman thermometry<br />
measurements of free evaporation from liquid water droplets. J. Amer. Chem. Soc., 128: p.12892.<br />
Smith, L.K., M.A. Voytek, J.K. Bohlke, J.W. Harvey, 2006. Denitrification in nitrate-rich streams: Application of<br />
N2:Ar <strong>and</strong> 15 N-tracer methods in intact cores. Ecol. Appl., 16 (6): p.2191.<br />
Solomon, A., 2006. Impact of latent heat release on polar climate. Geophys. Res. Lett., 33 (7): Art. No. L07716.<br />
Solomon, A., I. Wainer, 2006. Pacific tropical-extratropical thermocline water mass exchanges in the NCAR<br />
coupled climate system model v.3. Ocean Model., 15 (4-Mar): p.218.<br />
Solomon, A., D.X. Zhang, 2006. Pacific subtropical cell variability in coupled climate model simulations of the late<br />
19th-20th century. Ocean Model., 15 (4-Mar): p.236.<br />
Sommariva, R., M.J. Pilling, W.J. Bloss, D.E. Heard, J.D. Lee, Z.L. Fleming, P.S. Monks, J.M.C. Plane, A. Saiz-<br />
Lopez, S.M. Ball, M. Bitter, R.L. Jones, N. Brough, S.A. Penkett, J.R. Hopkins, A.C. Lewis, K.A. Read,<br />
2006. Night-time radical chemistry during the NAMBLEX campaign. Atmos. Chem. Phys. Disc., 6: p.7715.<br />
Sorooshian, A., V. Varutbangkul, F.J. Brechtel, B. Ervens, G. Feingold, R. Bahreini, S.M. Murphy, J.S. Holloway,<br />
E.L. Atlas, G. Buzorius, H. Jonsson, R.C. Flagan, J.H. Seinfeld, 2006. Oxalic acid in clear <strong>and</strong> cloudy<br />
atmospheres: Analysis of data from International Consortium for Atmospheric Research on Transport <strong>and</strong><br />
Transformation 2004. J. Geophys. Res.-Atmos., 111 (D23): Art. No. D23S45.<br />
Stark, H., B.M. Lerner, R. Schmitt, R. Jakoubek, E.J. Williams, T.B. Ryerson, D.D. Parrish, F.C. Fehsenfeld, 2006.<br />
Atmospheric in-situ measurement of nitrate radical (NO3) photolysis rates using spectral <strong>and</strong> filter<br />
radiometry. J. Geophys. Res.–Atmos., 10.1029/2006JD007578.<br />
Stensrud, D.J., N. Yussouf, M.E. Baldwin, J.T. McQueen, J. Du, B.B. Zhou, B. Ferrier, G. Manikin, F.M. Ralph,<br />
J.M. Wilczak, A.B. White, I. Djlalova, J.W. Bao, R.J. Zamora, S.G. Benjamin, P.A. Miller, T.L. Smith, T.<br />
Smirnova, M.F. Barth, 2006. The New Engl<strong>and</strong> high-resolution temperature program. Bull. Amer. Meteorol.<br />
Soc., 87 (4): p.491.<br />
Stohl, A., E. Andrews, J.F. Burkhart, C. Forster, A. Herber, S.W. Hoch, D. Kowal, C. Lunder, T. Mefford, J.A.<br />
Ogren, S. Sharma, N. Spichtinger, K. Stebel, R. Stone, J. Strom, K. Torseth, C. Wehrli, K.E. Yttri, 2006. Pan-<br />
Arctic enhancements of light absorbing aerosol concentrations due to North American boreal forest fires<br />
during summer 2004. J. Geophys. Res.-Atmos., 111 (D22): Art. No. D22214.<br />
Straub, K.H., G.N. Kiladis, P.E. Ciesielski, 2006. The role of equatorial waves in the onset of the South China Sea<br />
summer monsoon <strong>and</strong> the demise of El Niño during 1998. Dyn. Atmos. Oceans, 42 (4-Jan): p.216.<br />
Strawa, A.W., R. Elleman, A.G. Hallar, D. Covert, K. Ricci, R. Provencal, T.W. Owano, H.H. Jonsson, B. Schmid,<br />
A.P. Luu, K. Bokarius, E. Andrews, 2006. Comparison of in situ aerosol extinction <strong>and</strong> scattering coefficient<br />
measurements made during the Aerosol Intensive Operating Period. J. Geophys. Res.-Atmos., 111 (D5): Art.<br />
No. D05S03.<br />
Stroeve, J.C., T. Markus, W.N. Meier, 2006. Recent changes in the Arctic melt season. Annals of Glaciology, 44:<br />
p.367.<br />
Stroeve, J.C., J.E. Box, T. Haran, 2006. Evaluation of the MODIS (MOD10A1) daily snow albedo product over the<br />
Greenl<strong>and</strong> ice sheet. Remote Sens. Environ., 105 (2): p.155.<br />
Stroeve, J.C., T. Markus, J.A. Maslanik, D.J. Cavalieri, A.J. Gasiewski, J.E. Heinrichs, J. Holmgren, D.K. Perovich,<br />
M. Sturm, 2006. Impact of surface roughness on AMSR-E sea ice products. IEEE Trans. Geosci. Remote<br />
Sensing, 44 (11): p.3103.<br />
Sturm, M., J.A. Maslanik, D.K. Perovich, J.C. Stroeve, J. Richter-Menge, T. Markus, J. Holmgren, J.F. Heinrichs,<br />
K. Tape, 2006. Snow depth <strong>and</strong> ice thickness measurements from the Beaufort <strong>and</strong> Chukchi seas collected<br />
during the AMSR-Ice03 campaign. IEEE Trans. Geosci. Remote Sensing, 44 (11): p.3009.<br />
Sullivan, A.P., R.E. Peltier, C.A. Brock, J.A. de Gouw, J.S. Holloway, C. Warneke, A.G. Wollny, R.J. Weber, 2006.<br />
Airborne measurements of carbonaceous aerosol soluble in water over northeastern United States: Method<br />
development <strong>and</strong> an investigation into water-soluble organic carbon sources. J. Geophys. Res.-Atmos., 111<br />
(D23): Art. No. D23S46.<br />
183
Appendices: Publications<br />
Sun, D.Z., T. Zhang, 2006. A regulatory effect of ENSO on the time-mean thermal stratification of the equatorial<br />
upper ocean. Geophys. Res. Lett., 33 (7): Art. No. L07710.<br />
Sun, D.Z., T. Zhang, C. Covey, S.A. Klein, W.D. Collins, J.J. Hack, J.T. Kiehl, G.A. Meehl, I.M. Held, M. Suarez,<br />
2006. Radiative <strong>and</strong> dynamical feedbacks over the equatorial cold tongue: Results from nine atmospheric<br />
GCMs. J. Clim., 19 (16): p.4059.<br />
Sun, S., R. Bleck, 2006. Multi-century simulations with the coupled GISS-HYCOM climate model: control<br />
experiments. Clim Dyn., 26: p.407.<br />
Sun, S., R. Bleck, 2006. Geographic distribution of the diapycnal component of thermohaline circulations in coupled<br />
climate models. Ocean Modelling, 15: p.177.<br />
Sun, Y., S. Solomon, A.G. Dai, R.W. Portmann, 2006. How often does it rain? J. Clim., 19 (6): p.916.<br />
Sura, P., M. Newman, M.A. Alex<strong>and</strong>er, 2006. Daily to decadal sea surface temperature variability driven by statedependent<br />
stochastic heat fluxes. J. Phys. Oceanogr., 36 (10): p.1940.<br />
Sutton, C., T.M. Hamill, T.T. Warner, 2006. Will perturbing soil moisture improve warm-season ensemble<br />
forecasts? A proof of concept. Mon. Wea. Rev., 134 (11): p.3174.<br />
Sutton, E.K., J.M. Forbes, R.S. Nerem, T.N. Woods, 2006. Neutral density response to the solar flares of October<br />
<strong>and</strong> November, 2003. Geophys. Res. Lett., 33 (22): Art. No. L22101.<br />
Swann, A., A.H. Sobel, S.E. Yuter, G.N. Kiladis, 2006. Observed radar reflectivity in convectively coupled Kelvin<br />
<strong>and</strong> mixed Rossby-gravity waves. Geophys. Res. Lett., 33 (10): Art. No. L10804.<br />
Swenson, S., J. Wahr, 2006. Estimating large-scale precipitation minus evapotranspiration from GRACE satellite<br />
gravity measurements. J. Hydrometeorol., 7 (2): p.252.<br />
Swenson, S., J. Wahr, 2006. Post-processing removal of correlated errors in GRACE data. Geophys. Res. Lett., 33<br />
(8): Art. No. L08402.<br />
Swenson, S., P.J.F. Yeh, J. Wahr, J. Famiglietti, 2006. A comparison of terrestrial water storage variations from<br />
GRACE with in situ measurements from Illinois. Geophys. Res. Lett., 33 (16): Art. No. L16401.<br />
Swenson, S.C., P.C.D. Milly, 2006. Climate model biases in seasonality of continental water storage revealed by<br />
satellite gravimetry. Water Resour. Res., 42 (3): Art. No. W03201.<br />
Takegawa, N., T. Miyakawa, Y. Kondo, J.L. Jiménez, Q. Zhang, D.R. Worsnop, M. Fukuda, 2006. Seasonal <strong>and</strong><br />
diurnal variations of submicron organic aerosol in Tokyo observed using the Aerodyne aerosol mass<br />
spectrometer. J. Geophys. Res.-Atmos., 111 (D11): Art. No. D11206.<br />
Talukdar, R.K., E.E. Loukhovitskaya, O.B. Popovicheva, A.R. Ravishankara, 2006. Uptake of HNO3 on hexane <strong>and</strong><br />
aviation kerosene soots. J. Phys. Chem. A, 110 (31): p.9643.<br />
Tanner, D., D. Helmig, J. Hueber, P. Goldan, 2006. Gas chromatography system for the automated, unattended, <strong>and</strong><br />
cryogen-free monitoring of C2 to C6 non-methane hydrocarbons in the remote troposphere. J. Chromatogr. A,<br />
1111 (1): p.76.<br />
Tedesco, M., E.J. Kim, D. Cline, T. Graf, T. Koike, R. Armstrong, M.J. Brodzik, J. Hardy, 2006. Comparison of<br />
local scale measured <strong>and</strong> modelled brightness temperatures <strong>and</strong> snow parameters from the CLPX 2003 by<br />
means of a dense medium radiative transfer theory model. Hydrol. Process., 20 (4): p.657.<br />
Tenningen, E., J.H. Churnside, A. Slotte, J.J. Wilson, 2006. Lidar target-strength measurements on Northeast<br />
Atlantic mackerel (Scomber scombrus). ICES J. Mar. Sci., 63 (4): p.677.<br />
Tervahattu, H., K.J. Kupiainen, M. Raisanen, T. Makela, R. Hillamo, 2006. Generation of urban road dust from antiskid<br />
<strong>and</strong> asphalt concrete aggregates. J. Hazard. Mater., 132 (1): p.39.<br />
Tie, X.X., S. Ch<strong>and</strong>ra, J.R. Ziemke, C. Granier, <strong>and</strong> G. Brasseur, 2006. Satellite measurements if tropospheric O3<br />
<strong>and</strong> NO2 columns in Eastern <strong>and</strong> Southeastern Asia: Comparison with a global model. J. Atmos. Chem., 56:<br />
10.1007/s10874-006-9045-7.<br />
Tie, X.X., G.P. Brasseur, C.S. Zhao, C. Granier, S. Massie, Y. Qin, P.C. Wang, G.L. Wang, P.C. Yang, A. Richter,<br />
2006. Chemical characterization of air pollution in Eastern China <strong>and</strong> the Eastern United States. Atmos.<br />
Environ., 40 (14): p.2606.<br />
Trainer, M.G., A.A. Pavlov, H.L. DeWitt, J.L. Jiménez, C.P. McKay, O.B. Toon, M.A. Tolbert, 2006. Organic haze<br />
on Titan <strong>and</strong> the early Earth. Proc. Natl. Acad. Sci. U. S. A., 103 (48): p.18035.<br />
Trudeau, M.E., P. Chen, G.D. Garcia, L.W. Hollberg, P.P. Tans, 2006. Stable isotopic analysis of atmospheric<br />
methane by infrared spectroscopy by use of diode laser difference-frequency generation. Appl. Optics, 45<br />
(17): p.4136.<br />
Tsurutani B. T., et al., 2006. Extreme solar EUV flares <strong>and</strong> ICMEs <strong>and</strong> resultant extreme ionospheric effects:<br />
Comparison of the Halloween 2003 <strong>and</strong> the Bastille Day events. Radio Sci., 41: doi: 10.1029/2005RS003331.<br />
Tucker, G.E., L. Arnold, R.L. Bras, H. Flores, E. Istanbulluoglu, P. Solyom, 2006. Headwater channel dynamics in<br />
semiarid rangel<strong>and</strong>s, Colorado high plains, USA. Geol. Soc. Am. Bull., 118 (8-Jul): p.959.<br />
184
Appendices: Publications<br />
Turnbull, J.C., J.B. Miller, S.J. Lehman, P.P. Tans, R.J. Sparks, J. Southon, 2006. Comparison of (CO2)-C -14 , CO,<br />
<strong>and</strong> SF6 as tracers for recently added fossil fuel CO2 in the atmosphere <strong>and</strong> implications for biological CO2<br />
exchange. Geophys. Res. Lett., 33 (1): Art. No. L01817.<br />
Vecherin, S.N., V.E. Ostashev, G.H. Goedecke, D.K. Wilson, A.G. Voronovich, 2006. Time-dependent stochastic<br />
inversion in acoustic travel-time tomography of the atmosphere. J. Acoust. Soc. Am., 119 (5): p.2579.<br />
Velicogna, I., J. Wahr, 2006. Acceleration of Greenl<strong>and</strong> ice mass loss in spring 2004. Nature, 443 (7109): p.329.<br />
Velicogna, I., J. Wahr, 2006. Measurements of time-variable gravity show mass loss in Antarctica. Science, 311<br />
(5768): p.1754.<br />
Vera, C., G. Silvestri, B. Liebmann, P. Gonzalez, 2006. Climate change scenarios for seasonal precipitation in South<br />
America from IPCC-AR4 models. Geophys. Res. Lett., 33 (13): Art. No. L13707.<br />
Voigt, C., H. Schlager, H. Ziereis, B. Karcher, B.P. Luo, C. Schiller, M. Kramer, P.J. Popp, H. Irie, Y. Kondo, 2006.<br />
Nitric acid in cirrus clouds. Geophys. Res. Lett., 33 (5): Art. No. L05803.<br />
Volkamer, R., J.L. Jiménez, F. San Martini, K. Dzepina, Q. Zhang, D. Salcedo, L.T. Molina, D.R. Worsnop, M.J.<br />
Molina, 2006. Secondary organic aerosol formation from anthropogenic air pollution: Rapid <strong>and</strong> higher than<br />
expected. Geophys. Res. Lett., 33 (17): Art. No. L17811.<br />
Voronovich, A.G., V.E. Ostashev, 2006. Low-frequency sound scattering by internal waves in the ocean. J. Acoust.<br />
Soc. Am., 119 (3): p.1406.<br />
Voronovich, A.G., V.E. Ostashev, 2006. Mean field of a low-frequency sound wave propagating in a fluctuating<br />
ocean. J. Acoust. Soc. Am., 119 (4): p.2101.<br />
Wahr, J., S. Swenson, I. Velicogna, 2006. Accuracy of GRACE mass estimates. Geophys. Res. Lett., 33 (6): Art. No.<br />
L06401.<br />
Wahr, J.M., M.T. Zuber, D.E. Smith, J.I. Lunine, 2006. Tides on Europa, <strong>and</strong> the thickness of Europa‘s icy shell. J.<br />
Geophys. Res.-Planets, 111 (E12): Art. No. E12005.<br />
Walden, V.P., W.L. Roth, R.S. Stone, B. Halter, 2006. Radiometric validation of the Atmospheric Infrared Sounder<br />
over the Antarctic Plateau. J. Geophys. Res.-Atmos., 111 (D9): Art. No. D09S03.<br />
Waliser, D., K. Weickmann, R. Dole, S. Schubert, O. Alves, C. Jones, M. Newman, H.L. Pan, A. Roubicek, S. Saha,<br />
C. Smith, H. van den Dool, F. Vitart, M. Wheeler, J. Whitaker, 2006. The experimental MJO prediction<br />
project. Bull. Amer. Meteorol. Soc., 87 (4): p.425.<br />
Walker, J.D., T.D. Bowers, R.A. Black, A.F. Glazner, L.G. Farmer, R.W.A. Carlson, 2006. Geochemical database<br />
for western North American volcanic <strong>and</strong> intrusive rocks (NAVDAT). Geological Society of America, 397<br />
(Special Paper): p.31.<br />
Wallace, K., R. Bilham, F. Blume, V.K. Gaur, V. Gahalaut, 2006. Geodetic constraints on the Bhuj 2001 earthquake<br />
<strong>and</strong> surface deformation in the Kachchh Rift Basin. Geophys. Res. Lett., 33 (10): Art. No. L10301.<br />
Wang, J., D. Collins, D. Covert, R. Elleman, R.A. Ferrare, R. Gasparini, H. Jonsson, J. Ogren, P. Sheridan, S.C.<br />
Tsay, 2006. Temporal variation of aerosol properties at a rural continental site <strong>and</strong> study of aerosol evolution<br />
through growth law analysis. J. Geophys. Res.-Atmos., 111 (D18): Art. No. D18203.<br />
Warneke, C., J.A. de Gouw, A. Stohl, O.R. Cooper, P.D. Goldan, W.C. Kuster, J.S. Holloway, E.J. Williams, B.M.<br />
Lerner, S.A. McKeen, M. Trainer, F.C. Fehsenfeld, E.L. Atlas, S.G. Donnelly, V. Stroud, A. Lueb, S. Kato,<br />
2006. Biomass burning <strong>and</strong> anthropogenic sources of CO over New Engl<strong>and</strong> in the summer 2004. J.<br />
Geophys. Res.-Atmos., 111 (D23): Art. No. D23S15.<br />
Weatherhead, E.C., S.B. Andersen, 2006. The search for signs of recovery of the ozone layer. Nature, 441 (7089):<br />
p.39.<br />
Wei, M.Z., Z. Toth, R. Wobus, Y.J. Zhu, C.H. Bishop, X.G. Wang, 2006. Ensemble transform Kalman filter-based<br />
ensemble perturbations in an operational global prediction system at NCEP. Tellus Ser. A-Dyn. Meteorol.<br />
Oceanol., 58 (1): p.28.<br />
Weinstock, E.M., J.B. Smith, D. Sayres, J.R. Spackman, J.V. Pittman, N. Allen, J. Demusz, M. Greenberg, M.<br />
Rivero, L. Solomon, J.G. Anderson, 2006. Measurements of the total water content of cirrus clouds. Part I:<br />
Instrument details <strong>and</strong> calibration. J. Atmos. Ocean. Technol., 23 (11): p.1397.<br />
Whitaker, J.S., T.M. Hamill, 2006. Ensemble data assimilation without perturbed observations. (vol. 130, pg 1313,<br />
2002). Mon. Wea. Rev., 134 (6): p.1722.<br />
Whitaker, J.S., X. Wei, F. Vitart, 2006. Improving week-2 forecasts with multimodel reforecast ensembles. Mon.<br />
Wea. Rev., 134 (8): p.2279.<br />
White, A.B., C.J. Senff, A.N. Keane, L.S. Darby, I.V. Djalalova, D.C. Ruffieux, D.E. White, B.J. Williams, A.H.<br />
Goldstein, 2006. A wind profiler trajectory tool for air quality transport applications. J. Geophys. Res.-<br />
Atmos., 111 (D23): Art. No. D23S23.<br />
185
Appendices: Publications<br />
White, J.D., N.A. Scott, A.I. Hirsch, S.W. Running, 2006. 3-PG productivity modeling of regenerating Amazon<br />
forests: Climate sensitivity <strong>and</strong> comparison with MODIS-derived NPP. Earth Interact., 10: Art. No. 8.<br />
Whiteman, D.N., F. Russo, B. Demoz, L.M. Miloshevich, I. Veselovskii, S. Hannon, Z. Wang, H. Vomel, F.<br />
Schmidlin, B. Lesht, P.J. Moore, A.S. Beebe, A. Gambacorta, C. Barnet, 2006. Analysis of Raman lidar <strong>and</strong><br />
radiosonde measurements from the AWEX-G field campaign <strong>and</strong> its relation to Aqua validation. J. Geophys.<br />
Res.-Atmos., 111 (D9): Art. No. D09S09.<br />
Wiedinmyer, C., X.X. Tie, A. Guenther, R. Neilson, C. Granier, 2006. Future changes in biogenic isoprene<br />
emissions: How might they affect regional <strong>and</strong> global atmospheric chemistry? Earth Interact., 10: Art. No.3.<br />
Wilczak, J., S. McKeen, I. Djalalova, G. Grell, S. Peckham, W. Gong, V. Bouchet, R. Moffet, J. McHenry, J.<br />
McQueen, P. Lee, Y. Tang, G.R. Carmichael, 2006. Bias-corrected ensemble <strong>and</strong> probabilistic forecasts of<br />
surface ozone over eastern North America during the summer of 2004. J. Geophys. Res.-Atmos., 111 (D23):<br />
Art. No. D23S28.<br />
Williams, B.J., A.H. Goldstein, D.B. Millet, R. Holzinger, N.M. Kreisberg, S.V. Hering, J.D. Allan, D.R. Worsnop,<br />
J.L. Jiménez, <strong>and</strong> A.B. White, 2006. Chemical speciation of organic aerosol during ICARTT 2004: Results<br />
from in-situ measurements. J. Geophys. Res. - Atmos, 112.<br />
Williams, E.J., F.C. Fehsenfeld, B.T. Jobson, W.C. Kuster, P.D. Goldan, J. Stutz, W.A. McCleanny, 2006.<br />
Comparison of ultraviolet absorbance, chemiluminescence, <strong>and</strong> DOAS instruments for ambient ozone<br />
monitoring. Environ. Sci. Technol., 40 (18):p.5755.<br />
Wilmouth, D.M., R.M. Stimpfle, J.G. Anderson, J.W. Elkins, D.F. Hurst, R.J. Salawitch, L.R. Lait, 2006. Evolution<br />
of inorganic chlorine partitioning in the Arctic polar vortex. J. Geophys. Res.-Atmos., 111 (D16): Art. No.<br />
D16308.<br />
Wilson, D.K., S.L. Collier, V.E. Ostashev, D.F. Aldridge, N.P. Symons, D.H. Marlin, 2006. Time-domain modeling<br />
of the acoustic impedance of porous surfaces. Acustica - Acta Acustica, 92: p.965.<br />
Wilson, K.L., J.W. Birks, 2006. Mechanism <strong>and</strong> elimination of a water vapor interference in the measurement of<br />
ozone by UV absorbance. Environ. Sci. Technol., 40 (20): p.6361.<br />
Wobus, C.W., B.T. Crosby, K.X. Whipple, 2006. Hanging valleys in fluvial systems: Controls on occurrence <strong>and</strong><br />
implications for l<strong>and</strong>scape evolution. J. Geophys. Res.-Earth Surf., 111 (F2): Art. No. F02017.<br />
Wobus, C.W., G.E. Tucker, R.S. Anderson, 2006. Self-formed bedrock channels (vol. 33, art no L18408, 2006).<br />
Geophys. Res. Lett., 33 (20): Art. No. L20402: p.27.<br />
Wobus, C.W., G.E. Tucker, R.S Anderson, 2006. Self-formed bedrock channels. Geophys. Res. Lett., 33 (18): Art.<br />
No. L18408.<br />
Wobus, C.W., K.W. Whipple, K.V. Hodges, 2006. Neotectonics of the central Nepalese Himalaya: Constraints from<br />
geomorphology, detrital Ar-40/Ar-39 thermochronology, <strong>and</strong> thermal modeling. Tectonics, 25 (4): Art. No.<br />
TC4011.<br />
Wolfe, D., C. Fairall, M. Ratterree, W.A. Brewer, J. Intrieri, C. Senff, B. McCarty, S. Tucker, D. Law, A. White,<br />
<strong>and</strong> D. White, 2006. Shipboard multi-sensor wind profiles from NEAQS 2004: Radar wind profiler, high<br />
resolution Doppler lidar, GPS rawindsonde. J. Geophys. Res., 112. D10S15, doi:10.1029/2006JD007344.<br />
Worden, J.; K.Bowman, D. Noone, R. Beer, S. Clough, A. Eldering, B. Fisher, A. Goldman, M. Gunson, R.<br />
Herman, S.S. Kulawik, M. Lampel, M. Luo, G. Osterman, C. Rinsl<strong>and</strong>, C. Rodgers, S. S<strong>and</strong>er, M. Shephard,<br />
H. Worden, 2006. Tropospheric emission spectrometer observations of the tropospheric HDO/H2O ratio:<br />
Estimation approach <strong>and</strong> characterization. J. Geophys. Res.-Atmos., 111 (D16): Art. No. D16309.<br />
Wuttke, S., G. Seckmeyer, G. Bernhard, J. Ehramjian, R. McKenzie, P. Johnston, M. O'Neill, 2006. New<br />
spectroradiometers complying with the NDSC st<strong>and</strong>ards. J. Atmos. Ocean. Technol., 23 (2): p.241.<br />
Xue, H.W., G. Feingold, 2006. Large-eddy simulations of trade wind cumuli: Investigation of aerosol indirect<br />
effects. J. Atmos. Sci., 63 (6): p.1605.<br />
Yang, E.S., D.M. Cunnold, R.J. Salawitch, M.P. McCormick, J. Russell, J.M. Zawodny, S. Oltmans, M.J.<br />
Newchurch, 2006. Attribution of recovery in lower-stratospheric ozone. J. Geophys. Res.-Atmos., 111 (D17):<br />
Art. No. D17309.<br />
Yang, W.Z., D. Huang, B. Tan, J.C. Stroeve, N.V. Shabanov, Y. Knyazikhin, R.R. Nemani, R.B. Myneni, 2006.<br />
Analysis of leaf area index <strong>and</strong> fraction of PAR absorbed by vegetation products from the terra MODIS<br />
sensor: 2000-2005. IEEE Trans. Geosci. Remote Sensing, 44 (7): p.1829.<br />
Yeh, P.J.F., S.C. Swenson, J.S. Famiglietti, M. Rodell, 2006. Remote sensing of groundwater storage changes in<br />
Illinois using the Gravity Recovery <strong>and</strong> Climate Experiment (GRACE). Water Resour. Res., 42 (12): Art. No.<br />
W12203.<br />
186
Appendices: Publications<br />
Yoon, S.C., S.W. Kim, J. Kim, B.J. Sohn, A. Jefferson, S.J. Choi, D.H. Cha, D.K. Lee, T.L. Anderson, S.J. Doherty,<br />
R.J. Weber, 2006. Enhanced water vapor in Asian dust layer: Entrainment processes <strong>and</strong> implication for<br />
aerosol optical properties. Atmos. Environ., 40 (13): p.2409.<br />
Yoshida, Y., Y.H. Wang, C. Shim, D. Cunnold, D.R. Blake, G.S. Dutton, 2006. Inverse modeling of the global<br />
methyl chloride sources. J. Geophys. Res.-Atmos., 111 (D16): Art. No. D16307.<br />
Yu, H., Y.J. Kaufman, M. Chin, G. Feingold, L.A. Remer, T.L. Anderson, Y. Balkanski, N. Bellouin, O. Boucher,<br />
S. Christopher, P. DeCola, R. Kahn, D. Koch, N. Loeb, M.S. Reddy, M. Schulz, T. Takemura, M. Zhou,<br />
2006. A review of measurement-based assessments of the aerosol direct radiative effect <strong>and</strong> forcing. Atmos.<br />
Chem. Phys., 6: p.613.<br />
Yuter, S.E., D.E. Kingsmill, L.B. Nance, M. Loffler-Mang, 2006. Observations of precipitation size <strong>and</strong> fall speed<br />
characteristics within coexisting rain <strong>and</strong> wet snow. J. Appl. Meteorol. Climatol., 45 (10): p.1450.<br />
Zabotin, N.A., J.W. Wright, G.A. Zhbankov, 2006. NeXtYZ: Three-dimensional electron density inversion for<br />
dynasonde ionograms. Radio Sci., 41 (6): Art. No. RS6S32.<br />
Zhang, G.J., H.J. Wang, 2006. Toward mitigating the double ITCZ problem in NCAR CCSM3. Geophys. Res. Lett.,<br />
33 (6): Art. No. L06709.<br />
Zhang, T., D.Z. Sun, 2006. Response of water vapor <strong>and</strong> clouds to El Niño warming in three National Center for<br />
Atmospheric Research atmospheric models. J. Geophys. Res.-Atmos., 111 (D17): D17103, doi:10.1029/<br />
2005JD006700.Art. No. D17103.<br />
Zhao, C.L., P.P. Tans, 2006. Estimating uncertainty of the WMO mole fraction scale for carbon dioxide in air. J.<br />
Geophys. Res.-Atmos., 111 (D8): Art. No. D08S09.<br />
Zhou, L.X., J.W.C. White, T.J. Conway, H. Mukai, K. MacClune, X.C. Zhang, Y.P. Wen, J.L. Li., 2006. Long-term<br />
record of atmospheric CO2 <strong>and</strong> stable isotopic ratios at Waliguan Observatory: Seasonally averaged 1991-<br />
2002 source/sink signals, <strong>and</strong> a comparison of 1998-2002 record to the 11 selected sites in the northern<br />
hemisphere. Glob. Biogeochem. Cycle, 20 (2): Art. No. GB2001.<br />
Zhou, M.Y., X.B. Zeng, M. Brunke, Z.H. Zhang, C. Fairall, 2006. An analysis of statistical characteristics of stratus<br />
<strong>and</strong> stratocumulus over eastern Pacific. Geophys. Res. Lett., 33 (2): Art. No. L02807.<br />
Zhu, L., A. Nenes, P.H. Wine, J.M. Nicovich, 2006. Effects of aqueous organosulfur chemistry on particulate<br />
methanesulfonate to non-sea salt sulfate ratios in the marine atmosphere. J. Geophys. Res.-Atmos., 111 (D5):<br />
Art. No. D05316.<br />
Zilitinkevich, S.S., J.C.R. Hunt, I.N. Esau, A.A. Grachev, D.P. Lalas, E. Akylas, M. Tombrou, C.W. Fairall, H.J.S.<br />
Fern<strong>and</strong>o, A.A. Baklanov, S.M. Joffre, 2006. The influence of large convective eddies on the surface-layer<br />
turbulence. Q. J. R. Meteorol. Soc., 132 (618): p.1423.<br />
Zobrist, B., C. Marcolli, T. Koop, B.P. Luo, D.M. Murphy, U. Lohmann, A.A. Zardini, U.K. Krieger, T. Corti, D.J.<br />
Cziczo, S. Fueglistaler, P.K. Hudson, D.S. Thomson, T. Peter, 2006. Oxalic acid as a heterogeneous ice<br />
nucleus in the upper troposphere <strong>and</strong> its indirect aerosol effect. Atmos. Chem. Phys., 6: p.3115.<br />
Zuidema, P., B. Mapes, J.L. Lin, C. Fairall, G. Wick, 2006. The interaction of clouds <strong>and</strong> dry air in the Eastern<br />
tropical Pacific. J. Clim., 19 (18): p.4531.<br />
187
Appendices: Publications<br />
Non-Refereed Publications Published during Calendar Year 2006<br />
Books<br />
Brekhovskikh, L.M., <strong>and</strong> O.A. Godin, 2006. Acoustics of Inhomogeneous Media. 1: Fundamentals of sound<br />
reflection <strong>and</strong> propagation theory. Nauka (Moscow, Russia): p. 440.<br />
Burger, H.R., A.F. Sheehan, <strong>and</strong> C.H. Jones, 2006. Introduction to Applied Geophysics: Exploring the Shallow<br />
Subsurface. W. W. Norton Publishers: p. 554.<br />
Cotton, W.R. <strong>and</strong> R.A. Pielke Sr., 2006. Human Impacts on Weather <strong>and</strong> Climate. Cambridge University Press: p.<br />
330.<br />
Godin, O.A., <strong>and</strong> D.R. Palmer (eds.), 2006. History of Russian Underwater Acoustics. World <strong>Scientific</strong> (Singapore):<br />
p. 850.<br />
Lynch, A.H, <strong>and</strong> J.J. Cassano, 2006. Applied Atmospheric Dynamics. J. Wiley <strong>and</strong> Sons, West Sussex: p. 280.<br />
Lyons, W.B., K. Alverson, D. Barber, J. Bellingham, Callaghan, T., L. Cooper, M. Edwards, S. Gearheard, M.<br />
McCammon, J. Morison, S. Palo, A. Proshutinsky, L.O. Reiersen, V. Romanovsky, P. Schlosser, J.C.<br />
Stroeve, C. Tweedie, J. Walsh, 2006. Toward an Integrated Arctic <strong>Observing</strong> Network. National Academies<br />
of Science: p. 200.<br />
Moser, S.C <strong>and</strong> L. Dilling, eds., 2006. Creating a Climate for Change: Communicating Climate Change <strong>and</strong><br />
Facilitating Social Change. Cambridge University Press: p. 576.<br />
Renfrow, S. (ed), 2006. NASA: Supporting Earth System Science 2006. NASA: p. 56.<br />
Shaw, M., <strong>and</strong> J.J. Cassano, 2006. Applied Atmospheric Dynamics: Review Question Solutions. J. Wiley <strong>and</strong> Sons,<br />
West Sussex, available as electronic document from publisher: p. 110.<br />
Book Chapters<br />
Bais, A., D. Lubin, 2006.Ultraviolet Radiation: Past, Present <strong>and</strong> Future. <strong>Scientific</strong> Assessment of O3 Depletion:<br />
2006. WMO, Ozone Research <strong>and</strong> Monitoring Project.<br />
Barry, R.G., 2006. Klimaticheskoyoe znachenie snega i l'da. (Climatological significance of snow <strong>and</strong> ice).<br />
Sovremennye global'nye izmenneniya prirodnoi sredy (Modern Global Changes in the Natural Environment).<br />
R. N. Klige, Nauchny Mir, Moscow: p. 482-89.<br />
Bilham, R.., 2006. Moving Mountains. Himalaya. R.C. Blum, E. Stone <strong>and</strong> B. Coburn, National Geographic<br />
Society: p. 132-137.<br />
Clark, M., D. Slater, T. Painter, W. Meier, J. Stroeve, A. Barrett, B. Raup, <strong>and</strong> M. Serreze, 2006. <strong>Scientific</strong> <strong>and</strong><br />
Societal Uses of Remotely Sensed Snow <strong>and</strong> Ice Information. Research <strong>and</strong> Economic Applications of<br />
Remote Sensing Data Products. U. Aswathanarayana (India) & R. Balaji (USA), American Geophysical<br />
Union.<br />
Crane, R.L., L. Pedersen-Gallegos, S.L. Laursen, E.Seymour, R. Donohue, 2006. Schema Disjunction Among<br />
Undergraduate Women in Computer Science. Encyclopedia of Gender <strong>and</strong> Information Technology. E.M.<br />
Trauth, Idea Group Reference: p. 1087-1091.<br />
Cunnold, D.M., C. Clerbaux, J. Anderson, P. Bernath, A. Engel, P.J. Fraser, E. Mahieu, A.C. Manning, J. Miller,<br />
S.A. Montzka, R. Prinn, S. Reimann, C.P. Rinsl<strong>and</strong>, P. Simmonds, D. Verdonik, D. Wuebbles, <strong>and</strong> Y.<br />
Yokouchi, 2006. Long-lived Compounds. The 2006 UNEP/WMO <strong>Scientific</strong> Assessment of Ozone Depletion.<br />
Dilling, L., 2006: Introduction. Creating a Climate for Change: Communicating Climate Change - Facilitating<br />
Social Change. Cambridge University Press: p. 1.<br />
Dilling, L., 2006: Toward the Social Tipping Point: Creating a Climate for Change. Creating a Climate for Change:<br />
Communicating Climate Change - Facilitating Social Change. Cambridge University Press; P. 491.<br />
Dilling, L. <strong>and</strong> B. Farhar, 2006: Making it Easy: Establishing Energy Efficiency <strong>and</strong> Renewable Energy as Routine<br />
Best Practice. Creating a Climate for Change: Communicating Climate Change—Facilitating Social Change.<br />
Cambridge University Press: P. 359.<br />
Grell, G.A., 2006. Coupled Weather Chemistry <strong>Modeling</strong>. Large-Scale Disasters: Prediction, Control, Mitigation.<br />
Cambridge University Press.<br />
Laursen, S., A.B. Hunter, E. Seymour, T. DeAntoni, K. DeWelde, H. Thiry, 2006. Undergraduate Research: Not<br />
Just for Science Majors Any More. H<strong>and</strong>book of College Science Teaching. National Science Teachers<br />
Association: p. 55-66.<br />
Lawrence, P.J., <strong>and</strong> T.N. Chase, 2006. Climate Impacts. Our Earth’s Changing L<strong>and</strong>: An Encyclopedia of L<strong>and</strong>-use<br />
<strong>and</strong> L<strong>and</strong>-cover Change. Greenwood Press: p. 115-124.<br />
188
Appendices: Publications<br />
Maus, S., 2006. CHAMP Magnetic Mission. Encyclopedia of Geomagnetism <strong>and</strong> Paleomagnetism. Kluwer<br />
Academic Publishers.<br />
Maus, S., 2006. Electromagnetic Ocean Effects. Encyclopedia of Geomagnetism <strong>and</strong> Paleomagnetism. Kluwer<br />
Academic Publishers.<br />
Pielke, Jr., R.A., 2006. When Scientists Politicize Science. Regulation, spring: p. 28-34.<br />
Serreze, M.C., A.P. Barrett <strong>and</strong> A.G. Slater, 2006: Variability <strong>and</strong> Change in the Atmospheric Branch of the Arctic<br />
Hydrologic Cycle. Accomplishments of the Arctic <strong>and</strong> Subarctic Ocean Fluxes (ASOF) Programme.<br />
Sun, D. Z., 2006. The Role of ENSO in Regulating its Background State. Advances in Nonlinear Dynamics in<br />
Geosciences. Springer Publishers.<br />
Wessman, C.A. <strong>and</strong> C.A. Bateson, 2006. Building Up with a Top-down Approach: The Role of Remote Sensing in<br />
Deciphering Functional <strong>and</strong> Structural Diversity. Scaling <strong>and</strong> Uncertainty Analysis in Ecology: Methods <strong>and</strong><br />
Applications. Springer Publishers: p. 147-164.<br />
Wobus, C.W., K.X. Whipple, E. Kirby, N.P. Snyder, J. Johnson, K. Spyropolou, B. Crosby, <strong>and</strong> D. Sheehan, 2006.<br />
Tectonics from Topography: Procedures, Promise <strong>and</strong> Pitfalls. GSA Special Penrose publication on<br />
Tectonics, Climate <strong>and</strong> L<strong>and</strong>scape Evolution. Geological Society of America: p. 55-74.<br />
Series<br />
Robinson, J.E., B.W. Eakins, T. Kanamatsu, J. Naka, E. Takahashi, K. Satake, J.R. Smith, D.A. Clahue, <strong>and</strong> H.<br />
Yokose, 2006. JAMSTEC Multibeam Surveys <strong>and</strong> Submersible Dives around the Hawaiian Isl<strong>and</strong>s: A<br />
Collaborative Japan–USA Exploration of Hawaii‘s Deep Seafloor. Data Series 171, U.S. Geological Survey,<br />
CD-ROM.<br />
Report/Note/Memo/Brochure<br />
Alvord, C., J. Lowrey, A. Ray, <strong>and</strong> E. McKim, 2006. Intermountain West Climate Summary, 7 Issues: p. 100.<br />
Bao, Jian-Wen, S. A. Michelson, O. Persson, L. Bianco, I. Djalalova, D. E. White, <strong>and</strong> J. M. Wilczak, 2006. NOAA<br />
Contributions to the Central California Ozone Study <strong>and</strong> Ongoing Meteorological Monitoring. Draft Final<br />
Report prepared for San Joaquin Valleywide Air Pollution Study Agency, California Air Resources Board: p.<br />
310.<br />
Barry, R.G., 2006. A Review of World Glacier Trends, in CO2 Science. Center for the Study of Carbon Dioxide <strong>and</strong><br />
Global Change.<br />
Campbell, W. C., R. J. Hill <strong>and</strong> D. C. Welsh, 2006. NOAA/K Radar Data from the RICO 2005 Experiment:<br />
Description <strong>and</strong> Visualizations. NOAA Technical Memor<strong>and</strong>um, OAR PSD-310: p. 25.<br />
Casey, K. L., N. Connor, J. Lillibridge, L. Miller, R. Stumpf, <strong>and</strong> F. Fetterer, 2006. Satellite Contributions to the<br />
Ocean <strong>Observing</strong> System for Climate. NOAA Office of Climate Observations Annual Report.<br />
Dilling, L., R. Mitchell, D. Fairman, M. Lahsen, S. Mohser, A. Patt, C. Potter, C. Rice, S. VanDeveer, 2006. How<br />
Can We Improve the Usefulness of Carbon Science for Decision-making, The First State of the Carbon Cycle<br />
Report (SOCCR): The North American Carbon Budget <strong>and</strong> Implications for the Global Carbon Cycle:<br />
Chapter 5.<br />
Fetterer, F., 2006. A Selection of Documentation Related To National Ice Center Sea Ice Charts in Digital Format.<br />
NSIDC Special Report: p. 13.<br />
Fozzard, R., T. Habermann, 2006. NOAA Metadata ITAT Report, 2nd Quarter 2006: p.8.<br />
Husted, L.E., 2006. SHEBA Upper Ocean CTD <strong>and</strong> Thermal Microstructure, Western Arctic Ocean. ARCSS151.<br />
Husted, L.E., 2006. Coring Data from Drained Thaw-Lake Basins of the Arctic Coastal Plain, Alaska. ARCSS143.<br />
Husted, L.E., 2006. MODIS Mosaic of Antarctica (MOA) Image Map. NSIDC-0280.<br />
Husted, L.E., 2006. Compilation of Antarctic Radar Data, Siple Coast, 2000-2002. NSIDC-0274.<br />
Husted, L.E., 2006. GPS <strong>and</strong> GPR Data: Characteristics of Snow Megadunes <strong>and</strong> Their Potential Effect on Ice Core<br />
Interpretation. NSIDC-0282.<br />
Husted, L.E., 2006. Firn Air Chemistry Observations from Siple Dome, 1996, <strong>and</strong> the South Pole, 2001. NSIDC-<br />
0290.<br />
Husted, L.E., 2006. North Pole Environmental Observatory Aerial CTD Survey. ARCSS088.<br />
Husted, L.E., 2006. Subglacial Topography: Airborne Geophysical Survey of the Amundsen Sea Embayment,<br />
Antarctica. NSIDC-0292.<br />
Husted, L.E., 2006. Reduced-Resolution QuickBird Imagery <strong>and</strong> Related GIS Layers for Barrow, Alaska, USA.<br />
ARCSS305.<br />
Husted, L.E., 2006. Cloud-Radiation Feedback: Boundary Layer Cloud Microphysical Properties <strong>and</strong> Processes.<br />
ARCSS140.<br />
189
Appendices: Publications<br />
Husted, L.E., 2006. Time Series of Active Layer Thickness in the Russian Arctic, 1915-1990. ARCSS160.<br />
Husted, L.E., 2006. Model Output of Active Layer Depth in the Arctic Drainage Basin, 1979-2001. ARCSS158.<br />
Husted, L.E., 2006. High-Resolution QuickBird Imagery <strong>and</strong> Related GIS Layers for Barrow, Alaska, USA.<br />
ARCSS304.<br />
Husted, L.E., 2006. Antarctic Data Management at the National Snow <strong>and</strong> Ice Data Center. AGDC 2006 Brochure.<br />
Husted, L.E., 2006. Atmospheric Nitrate Isotopic Analysis at Amundsen-Scott South Pole Station, A Twenty-Five<br />
Year Record. NSIDC-0281.<br />
Husted, L.E., 2006. North Pole Environmental Observatory (NPEO) Oceanographic Mooring Data, 2001-2002.<br />
ARCSS156.<br />
Husted, L.E., 2006. AWS Data: Characteristics of Snow Megadunes <strong>and</strong> Their Potential Effect on Ice Core<br />
Interpretation. NSIDC-0283.<br />
Husted, L.E., 2006. SMEX02 L<strong>and</strong> Surface Information: Soils Database. NSIDC-0278.<br />
Husted, L.E., 2006. SHEBA Ocean Turbulence Mast Data Archive. ARCSS142.<br />
Husted, L.E., 2006. Resource Allocation <strong>and</strong> Allometry of Plant Growth at Selected Sites in the Arctic: 2003-2005<br />
Growing Seasons. ARCSS164.<br />
Husted, L.E., 2006. North Pole Environmental Observatory PMEL/CRREL 2000-2003 Ice Temperature <strong>and</strong> Mass<br />
Balance Buoy Data. ARCSS128.<br />
Husted, L.E., 2006 Predicting Productivity: Managing L<strong>and</strong> from Space. NASA: Supporting Earth System Science<br />
2006: p.20.<br />
Hutto, L., R. Weller, J. Lord, J. Smith, P. Bouchard, C. Fairall, S. Pezoa, L. Bariteau, J. Lundquist, V. Ghate, R.<br />
Castro, C. Cisternas, 2006. Stratus Ocean Reference Station (20˚S, 85˚W), Mooring Recovery <strong>and</strong><br />
Deployment Cruise R/V Ronald H. Brown cruise 05-05. WHOI Technical Reports: p.142.<br />
Jamiyansharav, K., D. Ojima, <strong>and</strong> R.A. Pielke Sr., 2006. Exposure characteristics of the Mongolian weather<br />
stations. Atmospheric Science Paper No. 779, Colorado State University: p. 75.<br />
Jordan, J., D. Costa, J. Churnside, 2006. 915 MHz Wind Profiling RASS Radar during Test Emma: p. 24.<br />
Jordan, J., J. Churnside, D. Costa, 2006. RASS Progress Report: p. 21.<br />
Kay, M.P., J.K. Henderson, <strong>and</strong> J.L. Mahoney, 2006. Quality Assessment Report. GTG Version 1.0 Proposed<br />
Threshold Changes for Aviation Digital Data Service Displays: p.11.<br />
Kay, M.P., J.K. Henderson, S.A. Krieger, J.L. Mahoney, L.D. Holl<strong>and</strong>, <strong>and</strong> B.G. Brown, 2006. Quality Assessment<br />
Report - Graphical Turbulence Guidance (GTG) Version 2.3: p. 58.<br />
Kay, M.P., S.A. Madine, <strong>and</strong> J.L. Mahoney, 2006: Quality Assessment Report - National Convective Hazard<br />
Detection Product.<br />
King, A.W., L. Dilling, G.P. Zimmerman, D.F. Fairman, R.A. Houghton, G. Marl<strong>and</strong>, A.Z. Rose, T.J. Wilbanks,<br />
2006. The First State of the Carbon Cycle Report (SOCCR). The North American Carbon Budget <strong>and</strong><br />
Implications for the Global Carbon Cycle: Executive Summary.<br />
King, A.W., L. Dilling, G.P. Zimmerman, D.F. Fairman, R.A. Houghton, G. Marl<strong>and</strong>, A.Z. Rose, T.J. Wilbanks,<br />
2006. What Is the Carbon Cycle <strong>and</strong> Why Care. The First State of the Carbon Cycle Report (SOCCR): The<br />
North American Carbon Budget <strong>and</strong> Implications for the Global Carbon Cycle: Chapter 1.<br />
Kingsmill, D.E., B.E. Martner, D.P. Jorgensen, <strong>and</strong> J.A. McGinley, 2006. HMT NOAA Hydrometeorology Testbed<br />
Science <strong>and</strong> Experiment Plan. NOAA/ESR.<br />
Klein, R., D.S. Kenney, J. Lowrey, <strong>and</strong> C. Goemans, 2006. Factors influencing residential water dem<strong>and</strong>: A review<br />
of the literature: p. 44.<br />
http://wwa.colorado.edu/resources/water_dem<strong>and</strong>_<strong>and</strong>_conservation/literature_review_version_1_12_07.pdf.<br />
Lemke, P., J. Ren, R.B. Alley, I. Allison, J. Carrasco, G. Flato, Y. Fujii, G. Kaser, P. Mote, R.H. Thomas, <strong>and</strong> T.<br />
Zhang, 2006. Observations: Changes in Snow, Ice, <strong>and</strong> Frozen Ground. IPCC Working Group 1 Fourth<br />
Assessment Report.<br />
Lowrey, J.L., A.J. Ray, E. McKim, C. Alvord, 2006. Intermountain West Climate Summary: p. 100.<br />
Lynds, S., 2006. Earthworks Interview Project - A Preliminary Assessment (CIRES Outreach Internal Report): p. 17<br />
Lynds, S., S. Buhr, 2006. DLESE Data Services Workshop Digital Library for Earth System Education, Evaluation<br />
Report: p. 53.<br />
Maus, S., G. Hulot, G. Egbert, <strong>and</strong> T. Sabaka, 2006. Report on the Workshop ―Global models <strong>and</strong> data assimilation<br />
strategies”. Proceedings of the First Swarm International Science Meeting, ESA WPP-261: p. 2.<br />
McCaffrey, M., P. Tuddenham, T. Bishop, S. Lynds, 2006. The Integrated Collaborative Education Online Strategic<br />
Planning Workshop: p.100. http://www.coexploration.org/ipy/.<br />
McCaffrey, M., S. Lynds, 2006. Poles Together: Coordinating International Polar Year (IPY) Outreach <strong>and</strong><br />
Education. Summary Report: p. 45.<br />
190
Appendices: Publications<br />
Miller, J.B. (Ed.), 2006. 13th WMO/IAEA Meeting of Experts on Carbon Dioxide Concentration <strong>and</strong> Related<br />
Measurement Techniques. World Meteorological Organization, Global Atmosphere Watch, 168: p. 217.<br />
Neuman, J.A., 2006. Efficient Pollution Transport Affects Remote Regions. ICARTT Fact Sheet, 5: p. 2.<br />
Pielke Sr. R.A., 2006. The Partnership of Weather <strong>and</strong> Air Quality - An Essay. Atmospheric Science Paper No. 770,<br />
Colorado State University: p. 44.<br />
Pielke Sr., R.A., G. Leoncini, T. Matsui, D. Stokowski, J.-W. Wang, T. Vukicevic, C.L. Castro, D. Niyogi, C.M.<br />
Kishtawal, A. Biazar, K. Doty, R.T. McNider, U. Nair, <strong>and</strong> W.-K. Tao, 2006: Development of generalized<br />
parameterization of diabatic heating for use in weather <strong>and</strong> climate models. Atmospheric Science Paper No.<br />
776, Colorado State University: p. 15.<br />
Restrepo, P., B. Martner, et. al., 2006. NOAA/USGS Debris-Flow Project Year-1 Report. NOAA Office of<br />
Hydrologic Development: p.37.<br />
Richter-Menge, J., J. Overl<strong>and</strong>, A. Proshutinsky, V. Romanovsky, L. Bengtsson, L. Brigham, M. Dyurgerov, J.C.<br />
Gascard, S. Gerl<strong>and</strong>, R. Graversen, C. Haas, M. Karcher, P. Kuhry, J. Maslanik, H. Melling, W. Maslowski,<br />
J. Morison, D. Perovich, R. Przybylak, V. Rachold, I. Rigor, A. Shiklomanov, J. Stroeve, D. Walker, <strong>and</strong> J.<br />
Walsh, 2006. State of the Arctic Report. NOAA OAR Special Report. NOAA/OAR/PME: p. 36.<br />
Seseske, S.A., M.P. Kay, S. Madine, J.E. Hart, J.L. Mahoney, <strong>and</strong> B. Brown, 2006. Quality Assessment Report:<br />
National Convective Weather Forecast 2 (NCWF-2): p. 28.<br />
Seseske, S.A., M.P. Kay, S. Madine, J.E. Hart, J.L. Mahoney, <strong>and</strong> B. Brown, 2006. NOAA Technical Memor<strong>and</strong>um<br />
OAR GSD-33. Quality Assessment Report: National Convective Weather Forecast 2 (NCWF-2): p. 23.<br />
Smirnov, A.V., S.F. Clifford, J. Burdette, 2006. The effect of the group velocity of Bragg scatters in ocean radar<br />
backscatter. NAWCADPAX Technical Memor<strong>and</strong>um, Vol. 16: 1.<br />
Squillace, M., S. Krakoff, D. Kenney, J. Hanna, E. Plaut, S. Grayson, <strong>and</strong> C. Alvord, 2006. Native Communities <strong>and</strong><br />
Climate Change: Legal <strong>and</strong> Policy Approaches to Protect Tribal Legal Rights. Natural Resource Law Center<br />
publication: p. 76.<br />
Taylor, L.A., B.W. Eakins, K.S. Carignan, R.R. Warnken, D.C. Schoolcraft <strong>and</strong> G.F. Sharman, 2006. Digital<br />
Elevation Model for Cape Hatteras, North Carolina: Procedures, Data Sources <strong>and</strong> Analysis: p. 18.<br />
Taylor, L.A., B.W. Eakins, K.S. Carignan, R.R. Warnken, D.C. Schoolcraft <strong>and</strong> G.F. Sharman, 2006. Digital<br />
Elevation Model for Port San Luis, California: Procedures, Data Sources <strong>and</strong> Analysis: p. 25.<br />
Taylor, L.A., B.W. Eakins, K.S. Carignan, R.R. Warnken, D.C. Schoolcraft, T. Sazonova, <strong>and</strong> G.F. Sharman, 2006.<br />
Digital Elevation Model for Dutch Harbor, Alaska: Procedures, Data Sources <strong>and</strong> Analysis: p. 27.<br />
Taylor, L.A., B.W. Eakins, K.S. Carignan, R.R. Warnken, T. Sazonova, D.C. Schoolcraft, <strong>and</strong> G.F. Sharman, 2006.<br />
Digital Elevation Model for Savannah, Georgia: Procedures, Data Sources <strong>and</strong> Analysis: p. 32.<br />
Taylor, L.A., B.W. Eakins, K.S. Carignan, R.R. Warnken, T. Sazonova, D.C. Schoolcraft, <strong>and</strong> G.F. Sharman, 2006.<br />
Digital Elevation Models for S<strong>and</strong> Point, Alaska: Procedures, Data Sources <strong>and</strong> Analysis: p.28.<br />
Taylor, L.A., B.W. Eakins, R.R. Warnken, K.S. Carignan, G.F. Sharman, <strong>and</strong> P. W. Sloss, 2006. Digital Elevation<br />
Models for San Juan <strong>and</strong> Mayaguez, Puerto Rico: Procedures, Data Sources <strong>and</strong> Analysis: p. 35.<br />
Taylor, L.A., B.W. Eakins, R.R. Warnken, K.S. Carignan, G.F. Sharman, D.C. Schoolcraft, <strong>and</strong> P. W. Sloss, 2006.<br />
Digital Elevation Models for Myrtle Beach, South Carolina: Procedures, Data Sources <strong>and</strong> Analysis: p. 20.<br />
Udall, B., 2006. The Water Report: Water Rights, Water Quality & Water Solutions in the West. Global Warming,<br />
The Hydrologic Cycle, <strong>and</strong> Water Management, 28: p. 8.<br />
Weil, J.C., 2006. An Update on ―Urbanizing‖ the ADAPT/LODI <strong>Modeling</strong> System. Interim Report to the Lawrence<br />
Livermore National Laboratory: p. 18.<br />
Weil, J.C., 2006. Outdoor Airborne Dispersion Model White Paper. Interim Report to the Lawrence Livermore<br />
National Laboratory: p. 18.<br />
Wolfe, D. E., V. Ghate, <strong>and</strong> L. Bariteau, 2006. 2006 WHOI/NOAA Stratus2006 - Field Program on the NOAA<br />
Research Vessel Ronald H. Brown - Results from the PSD Cloud <strong>and</strong> Flux Group <strong>and</strong> University of Miami<br />
Measurements. PSD3 archive.<br />
Wu, W., S. Drobot, J. Maslanik, U.C. Herzfeld, A. Lynch, 2006. Comparative Analysis of the Western Arctic<br />
Surface Climate with <strong>Modeling</strong> <strong>and</strong> Observations. Earth Interactions, Special Issue``Western Arctic Linkage<br />
Experiment -- WALE": p. 34.<br />
Newspaper/Magazine Article/Press Release<br />
Beitler, J. A., 2006. Data more powerful than hurricanes. NASA: Supporting Earth <strong>Systems</strong> Science 2006: p. 60.<br />
Beitler, J. A., 2006. Seeing climate through the lives of plants. NASA: Supporting Earth <strong>Systems</strong> Science 2006: p.<br />
60.<br />
Beitler, J. A., 2006. Nature‘s contribution. NASA: Supporting Earth <strong>Systems</strong> Science 2006: p. 60.<br />
191
Appendices: Publications<br />
Bilham R., S. Hough, 2006. Future earthquakes on the Indian Continent: Inevitable hazard, preventable risk. South<br />
Asia Magazine, 12 (April-June 2006): 11. p.1-9.<br />
McCaffrey, M. S., 2006. The 125 Year Legacy of the International Polar Year. The Office of Science &<br />
Technology’s (OST) Publication on S&T Policy.<br />
Naranjo, L., 2006. On the trail of global pollution drift. NASA: Supporting Earth System Science 2006: p. 56.<br />
Naranjo, L., 2006. Cloud to cloud: Forecasting storm severity with lightning. NASA: Supporting Earth System<br />
Science 2006: p. 56.<br />
Naranjo, L., 2006. Gridding the risks of natural disasters. NASA: Supporting Earth System Science 2006: p. 56.<br />
Renfrow, S., 2006. Arctic Shrinks as Temperatures Rise. The Earth Observer Newsletter, volume 18, issue 6: p. 2.<br />
Scott, M., 2006. Beating the Heat in the World's Big Cities. NASA Earth Observatory.<br />
Scott, M., 2006. Monitoring Great Lakes Ice from Space. NASA DAAC Yearbook.<br />
Scott, M., 2006. Earth's Big Heat Bucket. NASA Earth Observatory.<br />
Conference Preprints/Proceedings/Extended Abstracts<br />
Alvarez, R.J., J.L. Machol, R.D. Marchbanks, A.M. Weickmann, D.C. Law, C.J. Senff, S.P. S<strong>and</strong>berg, <strong>and</strong> W.A.<br />
Brewer, 2006. First tests of the TOPAZ lidar for airborne measurements of tropospheric ozone <strong>and</strong> aerosol<br />
backscatter. 7th International Symposium on Tropospheric Profiling: Needs <strong>and</strong> Technologies.<br />
Anderson, D., A. Anghel, J. Chau, K. Yumoto, A. Bhattacharyya <strong>and</strong> S. Alex, 2006. Daytime, low latitude, vertical<br />
ExB drift velocities, inferred from ground-based magnetometer observations in the Peruvian, Philippine <strong>and</strong><br />
Indian longitude sectors under quiet <strong>and</strong> disturbed conditions. International Living With a Star Workshop: p.<br />
389-394.<br />
Andreas, E.L, C.W. Fairall, A.A. Grachev, P.S. Guest, R.E. Jordan, <strong>and</strong> P.O.G. Persson, 2006. Turbulent surface<br />
flux measurements over Ssnow-covered sea ice. AGU Fall Meeting.<br />
Angevine, W. A., J. Hare, C. Fairall, D. Wolfe, <strong>and</strong> C. Senff, 2006. Structure <strong>and</strong> formation of the highly stable<br />
marine boundary layer over the Gulf of Maine. 7th International Symposium on Tropospheric Profiling:<br />
Needs <strong>and</strong> Technologies.<br />
Arakelyan A., S. Clifford (numerous co-authors), 2006. Polarimetric, combined, short pulse scatterometerradiometer<br />
system at 15GHz for platform <strong>and</strong> vessel application. SPIE 2007 Defense <strong>and</strong> Security.<br />
Bao, J.W. <strong>and</strong> S.A. Michelson, 2006. A method to illustrate <strong>and</strong> measure the relative sensitivity of RCMs to<br />
uncertainties in the physics parameterizations <strong>and</strong> the large-scale forcing. Symposium on Connections<br />
between Mesoscale Processes <strong>and</strong> Climate Variability.<br />
Bauer, R., T. Scambos, G. Scharfen, C. Judy, <strong>and</strong> L. Husted, 2006. Antarctic data management support at the<br />
National Snow <strong>and</strong> Ice Data Center. Thirteenth Annual WAIS Workshop.<br />
Bauer, R., L. Husted, T. Scambos, J. Bohl<strong>and</strong>er, T. Haran, C. Judy, G. Scharfen, 2006. Antarctic data management<br />
at the National Snow <strong>and</strong> Ice Data Center: Web-based geospatial tools for Antarctic discovery <strong>and</strong> analysis.<br />
AGU Fall Meeting, Abstract C21C-1186.<br />
Bedard Jr., A. J., 2006. The Infrasound Network (ISNet) as a 88D adjunct tornado detection tool: A perspective after<br />
operations since the spring of 2003. Proceedings 7th International Symposium on Tropospheric Profiling:<br />
Needs <strong>and</strong> Technologies.<br />
Bedard, A.J., R. T. Nishiyama, <strong>and</strong> P. Stauffer, 2006. Potential of infrasonic observing systems for monitoring<br />
mountain-induced turbulence. International Symposium on Tropospheric Profiling: Needs <strong>and</strong> Technologies.<br />
Benjamin, S., D. Devenyi, T. Smirnova, S. Weyg<strong>and</strong>t, J. M. Brown, S. Peckham, K. Brundage, T. L. Smith, G.<br />
Grell, <strong>and</strong> T. Schlatter, 2006. From the 13km RUC to the Rapid Refresh. 12th Conference on Aviation Range<br />
<strong>and</strong> Aerospace Meteorology: paper 9.1, p. 3.<br />
Brewer, W.A., Tucker, S., Post, M.J., Machol, J., Intrieri, J., McCarty, B., S<strong>and</strong>berg, S., Hardesty, R.M., 2006.<br />
Characterizing boundary layer winds <strong>and</strong> turbulence using ship-based coherent doppler lidar measurements.<br />
7th International Symposium on Tropospheric Profiling: Needs <strong>and</strong> Technologies.<br />
Brocko, V.R., P.K. Dunbar, 2006. Developing a tsunami deposit database. AGU Fall Meeting.<br />
Chapman, M.B., A. Holmes, C.A. Wolff, 2006. Verification of aviation icing algorithms for the Second Alliance<br />
Icing Research Study. 12th Aviation, Range <strong>and</strong> Aerospace Meteorology Conference (2006 AMS Annual<br />
meeting).<br />
Chapman, M.B., <strong>and</strong> A. Holmes, 2006. The statistical verification of NASA LaRC GOES derived cloud products<br />
with respect to in-flight aircraft icing. 2006 IEEE International Geoscience <strong>and</strong> Remote Sensing Symposium.<br />
Chapman, M.B., B.G. Brown, <strong>and</strong> A. Takacs, 2006. An evaluation of the impacts of grid resolution on the<br />
verification of aviation weather forecasts. 2006 Joint Conference Probability <strong>and</strong> Statistics/ Aviation, Range,<br />
<strong>and</strong> Aerospace Meteorology Conference (2006 AMS Annual).<br />
192
Appendices: Publications<br />
Chernogor, L., S. Clifford, S. Panasenko, V. Rozumenko, 2006. MF radar studies of wave disturbances in the<br />
mesosphere. 36th COSPAR <strong>Scientific</strong> Assembly, C2.2-0083-06.<br />
Cimini, D., E.R. Westwater, A.J. Gasiewski, M. Klein, V. Leuski, V. Mattioli, S. Dowlatshahi, J. Liljegren, 2006.<br />
Ground-based millimeter- <strong>and</strong> submillimeter-wave observations of the Arctic atmosphere. 2006 IEEE<br />
MicroRad Proceedings 9th Specialist Meeting on Microwave Radiometry <strong>and</strong> Remote Sensing Applications:<br />
p. 247-251.<br />
Cimini,D., E. R. Westwater, A. J. Gasiewski, M. Klein, V. Leuski, <strong>and</strong> J.C. Liljegren, 2006. Millimeter <strong>and</strong><br />
submillimeter wave observations of low vapor <strong>and</strong> liquid water amounts in the Arctic winter. Proc.of the<br />
16th. ARM Science Team Meeting.<br />
Collier S. L, V. E. Ostashev, <strong>and</strong> D. K. Wilson, 2006. Maximum likelihood estimation of the angle of arrival for an<br />
acoustic wave propagating in atmospheric turbulence. 2006 Meeting of the Military Sensing Symposia<br />
(MSS), Specialty Group on Battlefield Acoustic <strong>and</strong> Seismic Sensing, Magnetic <strong>and</strong> Electric Field Sensors.<br />
Collier S.L., V.E. Ostashev, <strong>and</strong> D.K. Wilson, 2006. Angle-of-arrival estimator for waves propagating in<br />
atmospheric turbulence. 12th Intern. Symp. on Long Range Sound Propagation.<br />
Collier S.L., V.E. Ostashev, <strong>and</strong> D.K. Wilson, 2006. Effect of longitudinal coherence on angle-of-arrival estimation<br />
in atmospheric turbulence. 151st Meeting Acoustical Society of America.<br />
Compo, G.P., J.S. Whitaker, <strong>and</strong> P.D. Sardeshmukh, 2006. Ensemble Kalman filter analysis, <strong>and</strong> its application to<br />
reanalysis using only surface-pressure observations. ECMWF/GEO Workshop on Atmospheric Reanalysis: p.<br />
105-106.<br />
Duerr, R. <strong>and</strong> A. Howard, 2006. Discovery <strong>and</strong> access of historic literature from the IPYs (DAHLI): Rescuing<br />
records <strong>and</strong> publications of early IPY ventures. Polar Libraries Colloquy.<br />
Duerr, R., Mark A. Parsons, <strong>and</strong> Ron Weaver, 2006. A new approach to preservation metadata for scientific data -<br />
A real world example. IGARSS: 10.1109/IGARSS.2006.83.<br />
Dunbar, P.K, Stroker, K.J, Brocko, R, 2006. WDC/National Geophysical Data Center 2004 Indian Ocean Tsunami<br />
Data. AGU Fall Meeting.<br />
Eberhard, W. L., C. Senff, R. Marchbanks, J. George, <strong>and</strong> B. McCarty, 2006. Aerosol extinction using a lidar slant<br />
path method sans calibration control. 7th International Symposium on Tropospheric Profiling: Needs <strong>and</strong><br />
Technologies, 3.D.5: p. 4-22.<br />
Eberhard, W., A. Brewer, R. Wayson, R. Marchbanks, B. McCarty, A. Weickmann, G. Fleming, 2006. Lidar<br />
method to measure soot emission rates from aircraft jet engines. 7th International Aerosol Conference.<br />
Eberhard, W., Wayson, R., Brewer, W.A., Marchbanks, R., McCarty, B., Fleming, G., 2006. Lidar method to<br />
measure soot emission rates from aircraft jet engines. AAAR.<br />
Etringer, A, T Zhang, L Lu, K Schaefer, S Denning, 2006. Impacts of soil freeze/thaw dynamics on the North<br />
American carbon cycle. AGU Fall Meeting.<br />
Fedrizzi, M., Tim Fuller-Rowell, N. Maruyama, E. Araujo, A. Anghel, D. Anderson , C. Minter,, 2006. Physical<br />
interpretation of the thermosphere-ionosphere response to the April 2002 magnetic storm. AGU Fall Meeting.<br />
Frauenfeld, OW, T Zhang, H Teng, AJ Etringer, 2006. Projections of the 21st century freezing/thawing index in the<br />
northern hemisphere. AGU Fall Meeting.<br />
Frehlich, R. G., 2006. SABLE R&D needs, capabilities, <strong>and</strong> opportunities. International workshop on Stable<br />
Boundary Layers (SABLE), Invited Talk.<br />
Frehlich, R., R. Sharman, Y. Meillier, M. L. Jensen, <strong>and</strong> B. Balsley, 2006. Profiles of winds <strong>and</strong> turbulence from a<br />
coherent Doppler lidar <strong>and</strong> the tethered lifting system. International Symposium on Tropospheric Profiling.<br />
Godin, O. A., 2006. L.M. Brekhovskikh <strong>and</strong> the theory of wave propagation in layered media. Calculation of mode<br />
amplitudes from the reciprocity principle. 11th L. M. Brekhovskikh‘s Conference on Ocean Acoustics: p. 64-<br />
69.<br />
Huang, W., P.E. James, L. Alexei <strong>and</strong> D.D. Dana, 2006. Shock compression spectroscopy with high time <strong>and</strong> space<br />
resolution. Shock Compression of Condensed Matter-2005: p. 1265-1270.<br />
Petropavlovskikh, R. Shetter, L. Froidevaux, P.K. Bhartia, M. Kroon, T. Beck, 2006. CAFS partial ozone column<br />
data for in-flight validation of the AURA ozone products. EGU Spring meeting.<br />
Petropavlovskikh, S. Oltmans, P. Disterhoft, K. Lantz, P. Kiedron, 2006. The short-term <strong>and</strong> long-term tropospheric<br />
ozone variability available from zenith sky measurements. AGU Fall Meeting.<br />
Jorgensen, D., D. Kingsmill, <strong>and</strong> B. Martner, 2006. Precipitation estimation by radar over complex terrain. 5th Intl.<br />
Conf. on Mesoscale Meteorology <strong>and</strong> Typhoon.<br />
Kay, M.P., J.L. Mahoney, <strong>and</strong> J.E. Hart, 2006. An analysis of CCFP forecast performance for the 2005 Convective<br />
Season. 12th Conference on Aviation <strong>and</strong> Range Meteorology.<br />
193
Appendices: Publications<br />
Khalsa, S.J.S., <strong>and</strong> W.N. Meier, 2006. Near-real-time global ice concentration from spaceborne passive microwave<br />
sensors. IEEE Oceans '06.<br />
Kim, S. W., S. A. McKeen, E.-Y. Hsie, M. K. Trainer, G. J. Frost, G. A. Grell, <strong>and</strong> S. E. Peckham, 2006. The<br />
influence of PBL parameterizations on the distributions of chemical species in a mesoscale chemical transport<br />
model. American Meteorological Society 17th Symposium on Boundary Layers.<br />
Lantz, K., P. Disterhoft, C. Wilson, G. Janson, B. Durham, J. Slusser, 2006. Long term evaluation of the calibration<br />
of YES UVB-1 broadb<strong>and</strong> radiometers of the Central UV Calibration Facility <strong>and</strong> the suite of UV<br />
radiometers in the USDA UV monitoring network. SPIE, Remote Sensing of Clouds <strong>and</strong> the Atmosphere, XI,<br />
6362: 63620X-63628X.<br />
Lehtinen R., Gottas D., Jordan J., White A., 2006. Improving wind profiler data recovery in non-uniform<br />
precipitation using a modified consensus algorithm. 7th International Symposium on Tropospheric Profiling.<br />
Leon, A, M. Holm, 2006. AMSR-E Products <strong>and</strong> NASAs AMSR-E validation data at the NSIDC DAAC. American<br />
Geophysical Union Fall Meeting.<br />
Lesur, V., <strong>and</strong> S. Maus, 2006. A global lithospheric magnetic field model with reduced noise level in the polar<br />
regions. Proceedings of the First Swarm International Science Meeting.<br />
Lundquist, J.D., P.J. Neiman, B. Martner, A.B. White, D.J. Gottas, <strong>and</strong> F.M. Ralph, 2006. Rain versus snow in the<br />
Sierra Nevada: Comparing free-air observations of the melting level with surface measurements. 12th Conf.<br />
on Mountain Meteorology, Amer. Meteor. Soc.<br />
Lühr, H., S. Maus, C. Stolle, H. Liu <strong>and</strong> M. Rother, 2006. Recent achievements in characterizing the magnetosphere,<br />
ionosphere <strong>and</strong> thermosphere. Proceedings of the First Swarm International Science Meeting.<br />
Madine, S., M.P. Kay, <strong>and</strong> J.L. Mahoney, 2006. Comparing the FAA cloud top height product <strong>and</strong> the<br />
NESDIS/CIMMS cloud top pressure product in oceanic regions. Preprints, 12th Conference on Aviation <strong>and</strong><br />
Range Meteorology, Atlanta, GA, Amer. Met. Soc.<br />
Matrosov, S.Y., B.E. Martner, <strong>and</strong> K.A. Clark, 2006. Dual-polarization X-b<strong>and</strong> radar measurements of rainfall<br />
parameters in different climate regimes. IGARSS-2006 Symposium.<br />
Maus, S., <strong>and</strong> H. Lühr, 2006. A global gravity-driven electric current system identified in CHAMP satellite<br />
magnetic measurements. Proceedings of the First Swarm International Science Meeting.<br />
Maus, S., G. Hulot, G. Egbert, <strong>and</strong> T. Sabaka, 2006. Report on the Workshop ―Global models <strong>and</strong> data assimilation<br />
strategies”. Proceedings of the First Swarm International Science Meeting.<br />
Maus, S., M. Rother, <strong>and</strong> H. Lühr, 2006. Field models from CHAMP data: the main field model POMME-3 <strong>and</strong> the<br />
lithospheric field model MF4. Proceedings of the First Swarm International Science Meeting.<br />
Meillier, Y., R. G. Frehlich, M. L. Jensen, <strong>and</strong> B.B. Balsley, 2006. Unique high-resolution measurements of wind,<br />
temperature, <strong>and</strong> turbulence for wind energy research. University of Colorado <strong>and</strong> National Renewable<br />
Energy Laboratory Research Symposium.<br />
Nance, L., L. Bernardet, M. Demirtas, A. Loughe, 2006: A look at the performance of WRF quantitative<br />
precipitation forecasts. Second International Symposium on Quantitative Precipitation Forecasting <strong>and</strong><br />
Hydrology.<br />
Nance, L., L. Bernardet, T. Smirnova, S. Benjamin, J. Brown, M. Demirtas, <strong>and</strong> A. Loughe, 2006. WRF<br />
development testbed center core tests. WRF Workshop.<br />
Nicholls, M. E., <strong>and</strong> M. T. Montgomery, 2006. The effect of mid-level moistening on tropical cyclogensis. 27th<br />
Conference on Hurricanes <strong>and</strong> Tropical Meteorology.<br />
Ostashev, V.E., D.K. Wilson, <strong>and</strong> G.H. Goedecke, 2006. Intermittent scalar QW model <strong>and</strong> sound propagation<br />
through intermittent turbulence. 12th Intern. Symp. on Long Range Sound Propagation.<br />
Ostashev, V.E., S.L. Collier, <strong>and</strong> D.K. Wilson, 2006. Transverse-longitudinal coherence function of a sound wave<br />
propagating in a turbulent atmosphere. InterNoise2006.<br />
Ostashev, V.E., S.L. Collier, <strong>and</strong> D.K. Wilson, 2006. The coherence function of a sound field propagating in a<br />
turbulent atmosphere. 151st Meeting Acoustical Society of America.<br />
Ostashev, V.E., S.N. Vecherin, D.K. Wilson, A. Ziemann, M. Barth, <strong>and</strong> K. Arnold, 2006. Acoustic travel-time<br />
tomography of temperature <strong>and</strong> wind velocity fields in the atmosphere. Fourth Joint Meeting Acoustical<br />
Society of America <strong>and</strong> Acoustical Society of Japan.<br />
Ostashev V.E., S.N. Vecherin, D.K. Wilson, <strong>and</strong> S.L. Collier, 2006. Correlation functions of temperature <strong>and</strong><br />
velocity fluctuations in a turbulent atmosphere. 151st Meeting Acoustical Society of America.<br />
Persson, P. Ola G., <strong>and</strong> R. Stone, 2006. Evidence of forcing of Arctic regional climates by mesoscale processes.<br />
Symposium on Connections between Mesoscale Processes <strong>and</strong> Climate Variability.<br />
194
Appendices: Publications<br />
Petropavlovskikh, I., R. Shetter, S. Hall, K. Ullmann, M. Kroon, R. McPeters, G. Labow, 2006. Combining CAFS<br />
stratospheric ozone with lidar measurements for the OMI total ozone validation. CRAVE Science Team<br />
Meeting.<br />
Petropavlovskikh, I., R. Shetter, S. Hall, P.K. Bhartia, 2006. CAFS ozone data for validation of AURA products.<br />
AURA Science Team Meeting.<br />
Raup, B., S.J.S. Khalsa, R. Armstrong, C. Helm, R.G. Barry, 2006. GLIMS: Status <strong>and</strong> Asian activity. Asia CLiC<br />
(Climate <strong>and</strong> the Cryosphere).<br />
Raup, B., S.J.S. Khalsa, R. Armstrong, 2006. Creating improved ASTER DEMs over glacierized terrain. American<br />
Geophysical Union.<br />
Renfrow, S., 2006. Using blogs to create <strong>and</strong> manage media buzz. American Geophysical Union Fall Conference.<br />
Restrepo, P., <strong>and</strong> colleagues, including B. Martner, 2006. The joint NOAA, NWS <strong>and</strong> USGS debris flow warning<br />
systems. 22nd Intl. Conf. on Interactive Information Processing <strong>Systems</strong> for Meteorology, Oceanography,<br />
<strong>and</strong> Hydrology, Amer. Meteor. Soc.<br />
Safran, J., Elvidge, C.E., Sutton, P., Tuttle, B.T., 2006. Potential for global mapping of development via a NightSat<br />
mission. Association of American Geographers Annual Meeting.<br />
Scambos, T., L. Husted, <strong>and</strong> K. Pharris, 2006. Antarctic peninsula climate variability: Observations, models, <strong>and</strong><br />
plans for IPY research. http://nsidc.org/news/events/IPY_APCV/IPY-APCV_booklet.pdf<br />
Schafer, R., K. S. Gage, G. N. Kiladis, <strong>and</strong> S. K. Avery, 2006. Wind profiler measurements over the central<br />
equatorial Pacific. International Symposium on Tropospheric Profiling: Needs <strong>and</strong> Technologies (ISTP).<br />
Schafer, R., S. K. Avery, K. S. Gage, <strong>and</strong> G. N. Kiladis, 2006. Seventeen years of wind profiler observations over<br />
the central equatorial Pacific. CIRES Member‘s Council Symposium.<br />
Schafer, R., S. K. Avery, K. S. Gage, <strong>and</strong> G. N. Kiladis, 2006. Seventeen years of wind profiler observations over<br />
the central equatorial Pacific. NOAA PSD Science Day.<br />
Senff, C. J., R. M. Banta, R. M. Hardesty, W. A. Brewer, R. J. Alvarez, S. P. S<strong>and</strong>berg, S. C. Tucker, J. M. Intrieri,<br />
L. S. Darby, A. B. White, J. M. Wilczak, <strong>and</strong> I. V. Djalalova, 2006. Vertical structure <strong>and</strong> transport of ozone<br />
over the northeastern United States: Lidar observations <strong>and</strong> comparisons with air quality forecast models. 7th<br />
International Symposium on Tropospheric Profiling: Needs <strong>and</strong> Technologies.<br />
Seseske, S.A. <strong>and</strong> J.E. Hart, 2006. Collaborative Convective Forecast Product (CCFP) issuance analysis. American<br />
Meteorology Society, Joint Session of Aviation, Range <strong>and</strong> Aerospace Meteorology/Probability <strong>and</strong><br />
Statistics.<br />
Shinoda, T, 2006. Interannual variability of surface heat fluxes <strong>and</strong> upper ocean under stratus cloud decks in the<br />
southeast Pacific. 27th Conference on Hurricane <strong>and</strong> Tropical Meteorology.<br />
Shuman, C.A., M.A. Fahnestock, T.A. Scambos, M. Albert, R. Bauer, V.P. Suchdeo, 2006. Antarctic megadunes<br />
characteristics from ICESat elevation data. European Geosciences Union 2006 Geophysical Research<br />
Abstracts, 8: 08686.<br />
Sievers, R.E., S. P. Cape, B. P. Quinn, J. A. Searles, J. A. Best, J. L. Burger, D. H. McAdams, <strong>and</strong> L. G. Rebits,<br />
2006. Stabilization, nebulization, <strong>and</strong> near-ambient temperature drying of measles vaccine, IgG antibody, TB<br />
antibiotics, <strong>and</strong> Zanamivir. Proceedings of the Respiratory Drug Delivery, Book 2: p. 401-404.<br />
Sievers, R.E., B.P. Quinn, S.P. Cape, J.A. Searles, C. S. Braun, P. Bhagwat, L.G. Rebits, D.H. McAdams, J.L.<br />
Burger, J.A. Best, L. Lindsay, M. T. Hern<strong>and</strong>ez, T. Iacovangelo, D. Kristensen, D. Chen, 2006. Near-critical<br />
fluid micronization of stabilized vaccines, antibiotics, <strong>and</strong> anti-virals. Eighth Conference on Supercritical<br />
Fluids <strong>and</strong> Their Applications, Ischia: p. 407-412.<br />
Symons N.P., D.F. Aldridge, D.K. Wilson, D.H. Marlin, S.L. Collier, <strong>and</strong> V.E. Ostashev, 2006. Finite-difference<br />
simulation of atmospheric acoustic sound through a complex meteorological background over a<br />
topographically complex surface. Euronoise.<br />
Szoke, E.J., R.S. Coll<strong>and</strong>er, B.D. Jamison, T.L. Smith, T.W. Schlatter, S. Benjamin, <strong>and</strong> W.R. Moninger, 2006. An<br />
evaluation of TAMDAR soundings in severe storm forecasting. 23rd Conference on Severe Local Storms:<br />
Paper 8.1, p. 6.<br />
Tucker, S.C., A Brewer, M.J. Post, A.M. Weickmann, C.J. Senff <strong>and</strong> R.M. Hardesty, 2006. Doppler lidar<br />
measurements of wind <strong>and</strong> velocity turbulence profiles in the Mount Washington Valley, October 2003. 7th<br />
International Symposium on Tropospheric Profiling: Needs <strong>and</strong> Technologies.<br />
Tuttle, B.T., C.E. Elvidge, J. Safran, K. Baugh, R. Nemani, C. Milesi, P. Sutton, 2006. Spatial mapping of<br />
impervious surfaces associated with urban development. Association of American Geographers Annual<br />
Meeting.<br />
195
Appendices: Publications<br />
Vecherin S. N., V. E. Ostashev, G.H. Goedecke, D. K. Wilson, A. Ziemann, M. Barth, <strong>and</strong> K. Arnold, 2006.<br />
Reconstruction of turbulent fields in acoustic tomography experiments. 12th Intern. Symp. on Long Range<br />
Sound Propagation.<br />
Voronovich A.G., <strong>and</strong> V. E. Ostashev, 2006. Vertical coherence of low-frequency sound waves propagating through<br />
a fluctuating ocean. Fourth Joint Meeting Acoustical Society of America <strong>and</strong> Acoustical Society of Japan.<br />
Weil, J.C., E.G. Patton, <strong>and</strong> P.P. Sullivan, 2006. Lagrangian modeling of dispersion in the stable boundary layer.<br />
AMS 17th Symposium on Boundary Layers <strong>and</strong> Turbulence, on CDROM.<br />
Westwater, E.R., D. Cimini, V. Mattioli, A. J. Gasiewski, M. Klein, V. Leuski , <strong>and</strong> J. C. Liljegren, 2006. The 2004<br />
North Slope of Alaska Arctic Winter Radiometric Experiment: Overview <strong>and</strong> recent results. Proc. of the 16th.<br />
ARM Science Team Meeting.<br />
Westwater, E.R., D. Cimini, V. Mattioli, A.J Gasiewski, M. Klein, V. Leuski, J. Liljegren, 2006. The 2004 North<br />
Slope of Alaska Arctic winter radiometric experiment: Overview <strong>and</strong> highlights. 2006 IEEE MicroRad<br />
Proceedings 9th Specialist Meeting on Microwave Radiometry <strong>and</strong> Remote Sensing Applications: p. 77-81.<br />
White, A., C. Senff, A. Keane, D. Ruffieux, <strong>and</strong> S. McDonnel, 2006. A wind profiler trajectory tool for air-quality<br />
transport applications. 14th Joint Conference on the Applications of Air Pollution Meteorology with the Air<br />
<strong>and</strong> Waste Management Association, CD.<br />
White, A., C. Senff, L. Darby, A. Keane, I. Djalalova, D. White, D. Ruffieux, <strong>and</strong> S. McDonnel, 2006. A new windprofiler<br />
prajectory pool for weather <strong>and</strong> air quality. 7th International Symposium on Tropospheric Profiling:<br />
Needs <strong>and</strong> Technologies.<br />
Wilson D.K., G.H. Goedecke, <strong>and</strong> V.E. Ostashev, 2006. Quasi-wavelet formulations of turbulence with<br />
intermittency <strong>and</strong> correlated properties. AMS Symposium on Boundary Layers <strong>and</strong> Turbulence.<br />
Wilson D.K., R. Bey-Hern<strong>and</strong>ez, <strong>and</strong> V.E. Ostashev, 2006. Statistical characterization of sound-wave scattering in<br />
urban environments. 12th Intern. Symp. on Long Range Sound Propagation.<br />
Wilson D.K., R. Bey-Hern<strong>and</strong>ez, <strong>and</strong> V.E. Ostashev, 2006. Models for fading <strong>and</strong> coherence of sound in urban<br />
environments. Fourth Joint Meeting Acoustical Society of America <strong>and</strong> Acoustical Society of Japan.<br />
Zavorotny V. U., A.J.Gasiewski, R.J.Zamora, E.M. McIntyre, V.Y. Leuski, V.G. Irisov, 2006. Stationary L-b<strong>and</strong><br />
radiometry for seasonal measurements of soil moisture. Proceedings of IGARSS06.<br />
Zhang T, R.G. Barry, L Hinzman, O.W. Frauenfeld, D. Gilichinsky, A. Etringer, J. McCreight, 2006. Observed<br />
evidence of permafrost degradation <strong>and</strong> its potential environmental impacts in Siberia. AGU Fall Meeting.<br />
196
Appendices: Publications<br />
Refereed Journals in which CIRES Scientists Published in 2006<br />
Acoustical Physics<br />
Acoustical Society of America, Journal of the<br />
Acustica-Acta Acustica<br />
Advances in Atmospheric Sciences<br />
Advances in Space Research<br />
Advances in Water Resources<br />
Aerosol Science <strong>and</strong> Technology<br />
Air <strong>and</strong> Waste Management Association, Journal of the<br />
Ambio<br />
American Chemical Society, Journal of the<br />
American Water Resources Association, Journal of the<br />
Analytical Chemistry<br />
Annales Geophysicae<br />
Annals of Glaciology<br />
Applied Meteorology <strong>and</strong> Climatology, Journal of<br />
Applied Optics<br />
Aquatic Botany<br />
Astronomy Education Review<br />
Atmospheric <strong>and</strong> Solar-Terrestrial Physics, Journal of<br />
Atmospheric <strong>and</strong> Oceanic Technology, Journal of<br />
Atmospheric Chemistry <strong>and</strong> Physics<br />
Atmospheric Chemistry <strong>and</strong> Physics Discussions<br />
Atmospheric Environment<br />
Atmospheric Research, Journal of<br />
Atmospheric Sciences, Journal of<br />
Basin Research<br />
BioMed Central Microbiology<br />
Boundary-Layer Meteorology<br />
Bulletin de la Société Géologique de France<br />
Bulletin of the American Meteorological Society<br />
Comptes Rendus Geosciences<br />
Canadian Journal of Forest Research<br />
Chaos, Solitons, & Fractals<br />
Chemical Reviews.<br />
Chromatography, Journal of<br />
Climate Change, Journal of<br />
Climate Dynamics<br />
Climate Research<br />
Climate, Journal of<br />
Cold Regions Science <strong>and</strong> Technology<br />
Computers <strong>and</strong> Geoscience<br />
Doklady Earth Sciences<br />
Dynamics of Atmospheres <strong>and</strong> Oceans<br />
Earth <strong>and</strong> Planetary Sciences Letters<br />
Earth Interactions<br />
Earth Observer<br />
Earth Planets <strong>and</strong> Space<br />
Ecological Applications<br />
Ecological Modelling<br />
Ecology<br />
Environmental Science <strong>and</strong> Technology<br />
EOS Transactions of the AGU<br />
Fluid Mechanics, Journal of<br />
Geoarchaeology<br />
197<br />
Geochemistry, Geophysics <strong>and</strong> Geosystems<br />
Geological Society of America Bulletin<br />
Geological Society of America, Journal of the<br />
Geophysical Journal International<br />
Geophysical Monograph Series<br />
Geophysical Research Letters<br />
Geophysical Research, Journal of<br />
Geophysics, Journal of<br />
Geoscience Education, Journal of<br />
Glaciological Data<br />
Global <strong>and</strong> Planetary Change<br />
Global Biogeochemical Cycles<br />
Global Change Biology<br />
Global Planetary Change<br />
Hazardous Materials, Journal of<br />
Higher Education, Journal of<br />
Hydrologic Engineering, Journal of<br />
Hydrological Processes<br />
Hydrological Sciences, Journal of<br />
Hydrology, Journal of<br />
Hydrometeorology, Journal of<br />
ICES Journal of Marine Sciences<br />
IEEE Journal of Oceanic Engineering<br />
IEEE Transactions on Antennas <strong>and</strong> Propagation<br />
IEEE Transactions in Geoscience <strong>and</strong> Remote Sensing<br />
Integrative <strong>and</strong> Comparative Biology<br />
International Journal of Chemical Kinetics<br />
International Journal of Climatology<br />
International Journal of Geomagnetism <strong>and</strong> Aeronomy<br />
International Journal of Mass Spectrometry<br />
Journal of Sciences of the Islamic Republic of Iran<br />
Limnology<strong>and</strong> Oceanography: Methods<br />
Meteorologische Zeitschrift<br />
Molecular Spectroscopy, Journal of<br />
Monthly Weather Review<br />
NASA XXX<br />
National Weather Digest<br />
Nature<br />
Ocean Modelling<br />
Oceanography<br />
Optical Society of America, Journal of the<br />
Paleogeography Paleoclimatology Paleoecology<br />
Philosophical Transactions of the Royal Society<br />
Photochemistry <strong>and</strong> Photobiology<br />
Physical Chemistry Chemical Physics<br />
Physics Review<br />
Physics Review Letters<br />
Physical Chemistry, Journal of<br />
Physical Oceanography, Journal of<br />
Proceedings of the National Acadamies of Science<br />
Progress in Physical Geography<br />
Quaternary Journal of the Royal Meteorological Soc.<br />
Quaternary Research<br />
Radio Science
Remote Sensing of the Environment<br />
Review of <strong>Scientific</strong> Instrument<br />
Revista Brasileira de Agrometeorologia<br />
Scanning<br />
Science<br />
Science Education<br />
<strong>Scientific</strong> American<br />
Seismological Research Letters<br />
Space Science Reviews<br />
Space Weather<br />
Tectonics<br />
Tellus<br />
Turbulence, Journal of<br />
Volcanology <strong>and</strong> Geothermal Research, Journal of<br />
Water Resources Research<br />
Weather<br />
Weather <strong>and</strong> Forecasting, Journal of<br />
Zeitschrift für Gletscherkunde und Glaziogeology<br />
Appendices: Publications<br />
198
Appendices: Honors <strong>and</strong> Awards<br />
Honors <strong>and</strong> Awards: Calendar Year 2006<br />
CIRES/NOAA Bronze Medal<br />
In 2006, NOAA presented its 2006 Bronze Award to NOAA employees for demonstrating the usefulness of<br />
unmanned aircraft systems in accomplishing NOAA's mission, including operational <strong>and</strong> research goals. Several<br />
CIRES members were integral members of this stellar team, <strong>and</strong> in April 2007, CIRES presented them each with<br />
plaques recognizing their contributions. These CIRES members are Dale Hurst (GMD), Fred Moore (GMD),<br />
Geoffrey Dutton (GMD) David Nance (GMD), Brian Vasel (GMD), Marian Klein (formerly PSD) Vladimir<br />
Leuski (formerly PSD), Eric Ray (CSD<br />
Akmaev, Rashid<br />
Career track promotion to Senior Research Scientist.<br />
Bauer, Robert<br />
Antarctic Service Medal of the United States National Science Foundation<br />
Barry, Roger<br />
2006 Goldthwait Polar Medal Byrd Polar Research Center, Ohio State University<br />
Atmospheric Science Librarians International (ASLI) Choice Award for 2005 The Arctic Climate System: by M C<br />
Serreze <strong>and</strong> R G Barry, Cambridge University Press.<br />
Zayed International Prize for the Environment Second Prize to Contributors to the Millennium Ecosystem<br />
Assessment<br />
NASA Group Achievement Award EOSDIS Data Centers Customer Support Team<br />
Cape, Stephen<br />
2006 Kalpana Chawla Outst<strong>and</strong>ing Recent Graduate Award CU-Boulder Alumni Association<br />
Cassano, Elizabeth<br />
Career track promotion to Associate Scientist III.<br />
Chu, Xinzhao<br />
Director, Technology Center for the Consortium of Resonance <strong>and</strong> Rayleigh Lidars, National Science Foundation<br />
Clifford, Steven<br />
Member, National Academy of Engineering<br />
Fellow, of the Acoustical Society of America<br />
Fellow, of the Optical Society of America<br />
Senior Member, of the IEEE<br />
Meritorious Presidential Rank Award winner.<br />
Coloma, Francine<br />
NASA Group Achievement Award to EOSDIS Data Centers Customer Support Team.<br />
Certificate of Appreciation, UNAVCO's Research Experience in Solid Earth Sciences for Students (RESESS)<br />
program<br />
Cooper, Owen<br />
Career track promotion to Research Scientist III<br />
Dempsey, Karen<br />
Outst<strong>and</strong>ing Department Liaison University of CO Colorado Combined Campaign<br />
Disterhoft, Patrick<br />
EPA Stratospheric Ozone Protection Award<br />
199
Dubé, William<br />
CIRES Outst<strong>and</strong>ing Performance Award CIRES<br />
Duerr, Ruth<br />
Hubert Wenger award Polar Libraries Colloquy<br />
Appendices: Honors <strong>and</strong> Awards<br />
Frauenfeld, Oliver<br />
Association of American Geographers 2006 John Russell Mather Paper of the Year Award, awarded by the Climate<br />
Specialty Group of the Association of American Geographers (for Frauenfeld, O. W., R. E. Davis, <strong>and</strong> M. E.<br />
Mann, 2005: A Distinctly Interdecadal Signal of Pacific Ocean-Atmosphere Interaction. J. Climate, 18(11),<br />
1709–1718)<br />
Board of Directors (Secretary) United States Permafrost Association<br />
Golden, Joseph<br />
The Thunderbird Award Weather Modification Association Award given occasionally for sustained contributions to<br />
the advancement of weather modifications science <strong>and</strong> technology, second-highest award from the Association.<br />
Gupta, Vijay<br />
Member, International Advisory Board J. Hydrologic Eng. ASCE<br />
Member, IIHR Advisory board University of Iowa<br />
Hartman, Michael<br />
CIRES Outst<strong>and</strong>ing Performance Award<br />
NASA Group Achievement Award for the EOSDIS Data Centers Customer Support Team's exceptional customer<br />
service to a diverse community of Earth system science data users.<br />
Hartten, Leslie<br />
Significant Opportunities in Atmospheric Research <strong>and</strong> Science (SOARS) acknowledges 5 years of service as a<br />
SOARS Science Mentor.<br />
Howard, Allaina<br />
SRMA Board Member, Society of Rocky Mountain Archivists Program Coordinator<br />
Frank B. Sessa Continuing Professional Education Scholarship Beta Phi Mu<br />
Hurst, Dale<br />
NOAA Oceanic <strong>and</strong> Atmospheric Research Outst<strong>and</strong>ing <strong>Scientific</strong> Paper of 2005 NOAA OAR<br />
Husted, Lindsay<br />
NASA Group Achievement Award to Earth <strong>Observing</strong> System Data <strong>and</strong> Information System (EOSDIS) Data<br />
Centers<br />
Klein, Roberta<br />
CIRES Outst<strong>and</strong>ing Service Award CIRES<br />
Korn, David<br />
NASA GSFC Customer Service Award<br />
Leon, Am<strong>and</strong>a<br />
NASA Group Achievement Award for the EOSDIS Data Centers Customer Service Support Team<br />
Maslanik, James<br />
Lead editor for Journal of Geophysical Research<br />
Massoli, Paola<br />
Boulder Lab Postdoc Symposium award DOC-Boulder Laboratories<br />
200
Appendices: Honors <strong>and</strong> Awards<br />
Maurer, John<br />
"Art in Science | Science in Art" juried exhibition selection University of Colorado<br />
Career track Promotion to Associate Scientist III<br />
McAllister, Molly<br />
NASA Group Achievement Award to the EOSDIS Data Centers Customer Support Team<br />
Meier, Walter<br />
Science <strong>and</strong> Engineering Visualization Challenge NSF <strong>and</strong> AAAS Honorable Mention award in the Non-Interactive<br />
Media category for the NASA <strong>Scientific</strong> Visualization Studio "Tour of the Cryosphere" animation DVD.<br />
Morrill, Carrie<br />
Elected Councilor for Paleoclimatology American Quaternary Association<br />
Nacu-Schmidt, Ami<br />
CIRES Outst<strong>and</strong>ing Performance/Service Award<br />
Naranjo, Laura<br />
NASA Group Achievement Award to EOSDIS Data Centers Customer Support Team<br />
Nerem, Steven<br />
2006 Geodesy Section Award American Geophysical Union<br />
Neuman, Jonathan<br />
Career track Promotion to Research Scientist III<br />
Nowak, John<br />
Career track promotion to CIRES Research Scientist II.<br />
AOC Safety Medallion NOAA Aircraft Operations in Tampa, FL<br />
Parsons, Mark<br />
Career track promotion to Senior Associate Scientist<br />
Co-Chairmanship IPY Data Policy <strong>and</strong> Management Subcommittee ICSU/WMO Joint Committee for IPY<br />
Member National Research Council (NRC) Committee on Archiving Environmental <strong>and</strong> Geospatial Data at<br />
National Acadamy of Science<br />
Pendergrass, Linda<br />
CIRES Outst<strong>and</strong>ing Performance Award<br />
Pielke Jr., Roger<br />
Eduard Brueckner Prize for Outst<strong>and</strong>ing Achievement in interdisciplinary Climate Research<br />
Pincus, Robert<br />
Career track promotion to Research Scientist III<br />
Ray, Eric<br />
UARS Science Team NASA Group Achievement Award<br />
Savoie, Matthew<br />
NASA Group Achievement Award for exceptional customer service to a diverse community of Earth system science<br />
data users.<br />
Scambos, Theodore<br />
Career track promotion to Senior Research Scientist<br />
Keynote speaker Gordon Research Conference: Polar Marine Science<br />
201
Appendices: Honors <strong>and</strong> Awards<br />
Scott, Michon<br />
People's Voice Winner for Education 10th Annual Webby Awards For http://earthobservatory.nasa.gov<br />
2006 Gallery: Brilliant Display Nature For http://earthobservatory.nasa.gov<br />
Website of the Week Voice of America For http://earthobservatory.nasa.gov<br />
Internet Guide Selection Britannica Online For http://www.strangescience.net<br />
NASA Group Award Goddard Space Flight Center for EOSDIS Data Centers Customer Support Team<br />
Shah, Anju<br />
NASA Group Achievement Award - EOSDIS Data Centers Customer Support Team<br />
Sheehan, Anne<br />
Incorporated Research Institutions for Seismology/Seismological Society of America (IRIS/SSA), Distinguished<br />
Lecturer<br />
Kansas State University Women in Engineering <strong>and</strong> Science Program, Distinguished Lecturer<br />
CU Faculty Fellowship<br />
Emerging Leaders Program Fellow University of Colorado, Office of the President<br />
Sheffield, Elizabeth<br />
NASA Customer Service award NASA/GSFC received certificate for helping NASA achieve an excellent customer<br />
service rating.<br />
Shupe, Matthew<br />
Career track promotion to Associate Scientist III<br />
Simons, Craig<br />
CIRES Outst<strong>and</strong>ing Performance Award CIRES<br />
Smirnova, Tatiana<br />
Outst<strong>and</strong>ing <strong>Scientific</strong> Paper NOAA Award for the research paper:<br />
"An Hourly Assimilation-Forecast Cycle, THe RUC", published in Monthly Weather Review, v.132, pp. 495-518,<br />
2004.<br />
Solomon, Amy<br />
Associate Editor Journal of Geophyscial Research-Atmospheres AGU<br />
Thornberry, Troy<br />
Career track promotion to Research Scientist II.<br />
Vaida, Veronica<br />
Sigma Xi Distinguished Lecturer 2007-2008<br />
Veale, Anthony<br />
NASA Group Achievement Award to the members of EOSDIS Data Centers Customer Support Team.<br />
Vukicevic, Tomislava<br />
Fulbright International Scholar Fulbright foundation<br />
Wahr, John<br />
2006 Recipient of The Charles A.Whitten Medal of the American Geophysical Union Awarded at the Fall Meeting<br />
of the AGU<br />
Williams, Christopher<br />
CIRES Outst<strong>and</strong>ing Performance Award CIRES<br />
202
Appendices: Service<br />
Service: Calendar Year 2006<br />
CIRES members serve the scientific communities within the University of Colorado <strong>and</strong> NOAA, <strong>and</strong> beyond<br />
through participation in professional societies; organization of meetings <strong>and</strong> special sessions at conferences; review<br />
of journal publications <strong>and</strong> proposals from funding agencies, <strong>and</strong> service on editorial boards for major journals <strong>and</strong><br />
committees. Following is a selected list of such memberships <strong>and</strong> activities, reflecting CIRES employees‘ service<br />
<strong>and</strong> dedication to their diverse fields of expertise. It is impossible to list all the organizations which benefit from<br />
CIRES‘ involvement, but we have tried to include an overview here. For the sake of brevity, service to CIRES, the<br />
University of Colorado, <strong>and</strong> NOAA are not included as the aim is to illustrate the global reach of CIRES expertise<br />
<strong>and</strong> contributions. Also omitted is the considerable list of services CIRES members contribute to the greater<br />
Boulder/Denver community.<br />
Professional Memberships<br />
Acoustical Society of America<br />
Alex<strong>and</strong>er von Humboldt Association of America<br />
American Association for the Advancement of Science<br />
American Association of Geographers<br />
American Association of Pharmaceutical Scientists<br />
American Chemical Society<br />
American Indian Science <strong>and</strong> Engineering Society<br />
American Meteorological Society<br />
American Soceity for Information Science & Technology<br />
American Society for Limnology <strong>and</strong> Oceanography<br />
American Society of Mass Spectrometry<br />
American Society for Quality<br />
American Society of Parasitologists<br />
American Water Resources Association<br />
American Water Works Association<br />
American Geophysical Union<br />
Association for Computing Machinery<br />
Boulder Writers' Alliance<br />
China Society of Glaciology <strong>and</strong> Geocryology<br />
Climate <strong>and</strong> Weather of the Sun-Earth System<br />
Colorado Association of Science Teachers<br />
Colorado Water Congress<br />
Computer Professionals for Social Responsibility<br />
Deutsche Gesellschaft fuer Polarforschung<br />
Deutsche Physikalische Gesellschaft<br />
EcoHealth<br />
Ecological Society of America<br />
European Geophysical Society<br />
European Geophysical Union<br />
Geological Society of America<br />
Geoscience Education & Public Outreach Network<br />
Human Factors <strong>and</strong> Ergonomics Society<br />
Institute of Electrical <strong>and</strong> Electronics Engineers<br />
Intergovernmental Panel on Climate Change<br />
International Association for Geomagnetism <strong>and</strong> Aeronomy<br />
International Association for Mathematical Physics<br />
International Association for Mathematical Geology<br />
International Facilities Management Association<br />
International Glaciological Society<br />
International Society on General Relativity <strong>and</strong> Gravitation<br />
Morris K. Udall Foundation<br />
National Association of Science Writers<br />
203
Appendices: Service<br />
National Center for Science Education<br />
National Marine Educators Association<br />
Permafrost Young Researchers Network<br />
Rocky Mountain Climate Organization<br />
Science Communications <strong>and</strong> Marine Public Information Network<br />
Society for Advancement of Chicanos <strong>and</strong> Native Americans in Science<br />
Society of American Archivists<br />
Society of Research Administrators<br />
Society of Rocky Mountain Archivists<br />
Tsunami Society<br />
Urban <strong>and</strong> Regional Informations <strong>Systems</strong> Association<br />
U.S. Permafrost Association<br />
World Meteorological Organization<br />
Editorial Service<br />
Arctic, Antarctic <strong>and</strong> Alpine Research<br />
Climate Research<br />
Cold Regions Science <strong>and</strong> Technology<br />
Express Letters of the Journal of the Acoustical Society of America<br />
Journal of Applied Meteorology<br />
Journal of Atmospheric Chemistry<br />
Journal of Geophysical Research<br />
Journal of Glaciology <strong>and</strong> Geocryology<br />
Journal of the Counstical Society of America<br />
Journal of Volcanology <strong>and</strong> Geothermal Research<br />
Mathematical Geology<br />
World Meteorological Organization/Global Atmosphere Watch Report<br />
Organizer/Convenor<br />
1 st Asian Conference on Permafrost, Lanzhou, China: Special session: Climate <strong>and</strong> Environmental Controls of the<br />
Cryosphere<br />
1 st Asian Conference on Permafrost, Lanzhou, China: Special session: Permafrost Hydrology<br />
10 th Symposium on Integrated <strong>Observing</strong> <strong>and</strong> Assimilation <strong>Systems</strong> for Atmosphere, Oceans <strong>and</strong> L<strong>and</strong> Surface<br />
AGU Special session: International Polar Year<br />
AGU: Special session: Climatological Variations in the Upper Atmosphere <strong>and</strong> Ionosphere<br />
AGU: Special session: Creating Usable Science in the 21 st Century: Strategies for more effectively connecting<br />
science to societyal needs<br />
AGU: Special session: Outst<strong>and</strong>ing Issues in Seasonal to Interannual Climate Prediction<br />
AGU: Special session: Toward High-resolution Greenhouse Gas Emission Inventories for Fossil Fuel Combustion<br />
AGU: Western Pacific Geophysics Meeting, Beijing, China: Special session on Tropical Air-Sea Interaction<br />
American Meteorological Society Middle Atmosphere Conference<br />
Association of American Geographers: Special session: L<strong>and</strong> Cover/L<strong>and</strong> Use Change I <strong>and</strong> II<br />
European Geophysical Union session on education <strong>and</strong> outreach<br />
International Polar Year IceFest<br />
Virtual Globes Conference<br />
WCRP/Global Climate <strong>Observing</strong> System Surface Pressure<br />
Review Papers <strong>and</strong> Proposals for:<br />
Acoustical Society of America, Journal of the<br />
Advances in Space Research<br />
American Water Resources Association, Journal of the<br />
Annals of Glaciology<br />
Applied Meteorology, Journal of<br />
Applied Meteorology <strong>and</strong> Climatology, Journal of<br />
Arctic, Antarctic, <strong>and</strong> Alpine Research<br />
204
Appendices: Service<br />
Army Office of <strong>Scientific</strong> Research<br />
Astrophysics <strong>and</strong> Space Sciences<br />
Atmospheric Chemistry, Journal of<br />
Atmospheric Chemistry <strong>and</strong> Physics<br />
Atmospheric Environment<br />
Atmospheric Sciences, Journal of<br />
Atmospheric <strong>and</strong> Solar-Terrestrial Physics, Journal of<br />
Boundary-Layer Meteorology<br />
Bulletin of the American Meteorological Society<br />
Canadian Journal of Fisheries <strong>and</strong> Aquatic Sciences<br />
Canadian Journal of Zoology<br />
Chemical Geology<br />
China Society of Glaciology <strong>and</strong> Geocryology Journal<br />
Chinese Academy of Sciences Journal<br />
Climate Dynamics<br />
Climate Research<br />
Climate, Journal of<br />
Cold Regions Science <strong>and</strong> Technology<br />
Computational Acoustics, Journal of<br />
Department of Commerce<br />
Environmental Chemistry<br />
Environmental <strong>Modeling</strong> <strong>and</strong> Software<br />
Environmental Science <strong>and</strong> Policy<br />
Environmental Science & Technology<br />
Geophysical Research Letters<br />
Geophysical Research, Journal of<br />
Global <strong>and</strong> Planetary Change<br />
Hydrometeorology, Journal of<br />
IEEE Transactions on Geoscience <strong>and</strong> Remote Sensing<br />
International Journal of Climatology<br />
International Journal of Parasitology<br />
Limnology <strong>and</strong> Oceanography<br />
Marine Ecology Progress Series<br />
Marine <strong>and</strong> Freshwater Research<br />
Mass Spectrometry, Journal of<br />
Meteorologische Zeitschrift<br />
Monthly Weather Review<br />
NASA<br />
Natural Sciences <strong>and</strong> Engineering Research Council of Canada<br />
Nature<br />
Netherl<strong>and</strong>s Organisation for <strong>Scientific</strong> Research (Dutch Research Council)<br />
NOAA<br />
North American Benthological Society, Journal of the<br />
NSF<br />
Ocean <strong>Modeling</strong><br />
Oceanography, Tokyo, Journal ofOecologia<br />
Paleoclimatology<br />
Physical Chemistry, Journal of<br />
Physical Oceanography, Journal of<br />
Polar Geography<br />
Proceedings of the Royal Society (London)<br />
Quarterly Journal of Mechanics <strong>and</strong> Applied Mathematics<br />
Quarterly Journal of the Royal Meteorological Society<br />
Quaternary Research<br />
Quaternary Science Reviews<br />
Radio Science<br />
205
Remote Sensing of the Environment<br />
Royal Meteorological Society<br />
Tellus<br />
Wave Motion<br />
Weather <strong>and</strong> Forecasting<br />
Appendices: Service<br />
206
Appendices: Acronyms<br />
Acronyms <strong>and</strong> Abbreviations<br />
A/Q Air Quality<br />
AAAR American Association for Aerosol Research<br />
AARI Arctic <strong>and</strong> Antarctic Research Institute<br />
ADCC ARCSS Data Coordination Center<br />
AFCCC Air Force Combat Climatology Center<br />
AFWA Air Force Weather Agency<br />
AGCM Atmospheric Global Circulation Model<br />
AGDC Antarctic Glaciological Data Center<br />
AGU American Geophysical Union<br />
AIRS <strong>Advanced</strong> Infra Red Sounder<br />
AMF Air Mass Factor<br />
AMIE Assimilative Mapping of Ionospheric Electrodynamics<br />
AMIP Atmospheric Model Intercomparison Project<br />
AMMA African Monsoon Multidisciplinary Analysis<br />
AMOS <strong>Advanced</strong> <strong>Modeling</strong> <strong>and</strong> <strong>Observing</strong> <strong>Systems</strong> (CIRES scientific theme)<br />
AMS American Meteorological Society<br />
AMSU Satellite microwave sensor<br />
ANOSIM Analysis Of Similarities<br />
ANTCI Antarctic Tropospheric Chemistry Investigation<br />
AOD Aerosol Optical Depth<br />
AOS Aerosol Observation System<br />
APEX Geomagnetic field coordinate system<br />
ArcIMS Arc Internet Map Server<br />
ARCSS Arctic System Science<br />
ARM Atmospheric Radiation Measurement<br />
ARW <strong>Advanced</strong> Research WRF<br />
ASCE American Society of Civil Engineers<br />
ASD Analytical Spectral Devices<br />
ASD-FR Analytical Spectral Devices Field Spectroradiometer<br />
ASG Automated Spectro-Goniometer<br />
ASR Arctic System Reanalysis<br />
ASLI Atmospheric Sciences Librarians International<br />
ATOC Atmospheric <strong>and</strong> Oceanic Sciences (CU academic department)<br />
AVE Aircraft Validation Experiments<br />
AXS Avalanche X-ray Spectrometer<br />
BBH Brightb<strong>and</strong> Height<br />
BCM Billion Cubic Meters<br />
B-RAMS Brazilian-Regional Atmospheric <strong>Modeling</strong> System<br />
BSRN Baseline Surface Radiation Network<br />
CAC Computing Advisory Committee<br />
CAFS CCD-based Actinic Flux Spectroradiometers<br />
CAM Community Atmosphere Model<br />
CAN-BD Carbon Dioxide-Assisted Nebulization with a Bubble Dryer®<br />
CASES Cooperative Atmosphere-Surface Exchange Study-99<br />
CCD Comparative Climate Data<br />
CCF CIRES Computing Facility<br />
CCMC Community Coordinated <strong>Modeling</strong> Center<br />
CCSM Community Climate System Model<br />
CDC Climate Diagnostics Center<br />
CDMP Climate Database Modernization Project<br />
CDPW Climate Diagnostics <strong>and</strong> Prediction Workshop<br />
CDR Climate Data Record<br />
CDSS Colorado Decision Support System<br />
CEDAR Coupling, Energetics, <strong>and</strong> Dynamics of Atmospheric Regions<br />
207
Appendices: Acronyms<br />
CET Center for Environmental Technology (CU Center)<br />
CGCM Coupled Global Circulation Model<br />
CHAMP CHAllenging Minisatellite Payload<br />
CHASM Chameleon Surface Model<br />
CHILD Channel-Hillslope Integrated L<strong>and</strong>scape Development model<br />
CILER Cooperative Institute for Limnology <strong>and</strong> Ecosystem Research<br />
CIMS Chemical Ionization Mass Spectrometry<br />
CIRES Cooperative Institute for Research in Environmental Sciences<br />
CIRPAS Center for Interdisciplinary Remotely-Piloted Aircraft Studies<br />
CISM Solar wind model<br />
CLASIC Cloud <strong>and</strong> LAnd Surface Interaction Campaign<br />
CliC Climate <strong>and</strong> Cryosphere<br />
C-LIM Coupled empirical-dynamical Linear Inverse Model<br />
CLM Community L<strong>and</strong> Model<br />
CMAP CPC Merged Analysis of Precipitation<br />
CMCC Community Coordinated <strong>Modeling</strong> Center<br />
CME Coronal Mass Ejection<br />
CO Carbon Monoxide<br />
CO2<br />
Carbon Dioxide<br />
COARE Coupled Ocean-Atmosphere Response Experiment<br />
CONUS Continental United States<br />
CORS Continuously Operating Reference Stations<br />
CPASW Climate Prediction Applications Science Workshop<br />
CPC Climate Prediction Center<br />
CPC Condensation Particle Counter<br />
CPO Climate Program Office<br />
CPP Cryospheric <strong>and</strong> Polar Processes<br />
CR-AVE Costa Rica Aura Validation Experiment<br />
CRD Cavity Ring-Down Spectroscopy<br />
CRRL Consortium of Resonance <strong>and</strong> Rayleigh Lidars<br />
CRSS Colorado River Simulation System<br />
CRTM Community Radiative Transfer Model<br />
CSD Chemical Sciences Division (ESRL)<br />
CSES Center for the Study of Earth from Space<br />
CSIRO Australian Commonwealth <strong>Scientific</strong> <strong>and</strong> Research Organization<br />
CSPHOT Cimel SunPHOTometer<br />
CSTPR Center for Science <strong>and</strong> Technology Policy Research<br />
CSU Colorado State University<br />
CSV Climate System Variability (CIRES scientific theme)<br />
CTC Consortium Technology Center<br />
CTIPe Coupled-Thermosphere-Ionosphere-Plasmasphere-electrodyamics<br />
CU University of Colorado<br />
CUCF Central UV Calibration Center<br />
CVI Counterflow Virtual Impactor<br />
DAAC Distributed Active Archive Center<br />
DAFM Dynamical Area Fraction Model<br />
DAHLI Discovery <strong>and</strong> Access of Historical Literature of the IPYs<br />
DEM Digital Elevation Model<br />
DFI Digital Filter Initialization<br />
DLESE Digital Library for Earth System Education<br />
DLR German Space Agency<br />
DMS Dimethyl-Sulfide<br />
DMSP Defense Meteorological Satellite Program<br />
DOAS Differential Optical Absorption Spectroscopy<br />
DOC Department of Commerce<br />
DOD Department of Defense<br />
208
Appendices: Acronyms<br />
DOE Department of Energy<br />
DOTLRT Discrete Ordinate Tangent Linear Radiative Transfer<br />
DPI Dry Powder Inhaler<br />
DSD Drop Size Distribution<br />
DU Dobson Units<br />
EASE-GRID Equal-Area Scalable Earth grid<br />
EB Environmental Biology (CIRES Division)<br />
EBIO Ecology <strong>and</strong> Evolutionary Biology (University Department)<br />
EC Environmental Chemistry (CIRES Division)<br />
EC European Commission<br />
ECMWF European Center for Medium Range Weather Forecasts<br />
EEJM1 Equatorial Electrojet Model<br />
EIS Environmental Impact Statement<br />
EIT Extreme Ultraviolet Imaging Telescope<br />
EMM-06 Extended Magnetic Field Model<br />
ENLIL A time-dependent 3D MHD solar wind model of the heliosphere<br />
ENSO El Niño/Southern Oscillation<br />
EO Education <strong>and</strong> Outreach<br />
EOMF Environmental Observations, <strong>Modeling</strong> <strong>and</strong> Forecasting (CIRES Division)<br />
EOSDIS Earth <strong>Observing</strong> System Data <strong>and</strong> Information System<br />
EPIC Eastern Pacific Investigations of Climate<br />
ERA-40 ECMWF Re-Analysis<br />
ERB Earth‘s Radiation Budget<br />
ESRL Earth <strong>Systems</strong> Research Laboratory<br />
ETH Eidgenössische Technische Hochschule (Swiss Federal Institute of Technology)<br />
EUVS Extreme Ultraviolet Spectrometer<br />
EVE-MESA Extreme ultraviolet Variability Experiment – Mathematics, Engineering, Science, Achievement<br />
FEMA Federal Emergency Management Agency<br />
FGDC Frozen Ground Data Center<br />
FIP Forecast Icing Product<br />
FLEXPART Lagrangian particle dispersion model<br />
FRAMES Fire Research And Management Exchange System<br />
FTE Full Time Equivalent<br />
FTIR Fourier Transform Infrared (spectroscopy)<br />
FTP File Transfer Protocol<br />
FY Fiscal Year<br />
GAIM Global Assimilation of Ionospheric Measurements<br />
GaP Gallium Phosphide<br />
GCM Global Circulation Model<br />
GCOS Global Climate <strong>Observing</strong> System<br />
GCSM Global Climate System Model<br />
GDSIDB Global Digital Sea Ice Data Bank<br />
GEM GEostationary Microwave imager/sounder<br />
GEO Geodynamics (CIRES scientific theme)<br />
GFDL Geophysical Fluid Dynamics Laboratory<br />
GFS Global Forecast System<br />
GIF Graphics Interchange Format<br />
GIP Global Ionosphere Plasmasphere<br />
GIS Geographic Information System<br />
GISS Goddard Institute for Space Studies<br />
GITM Global Ionosphere-Thermosphere Model<br />
GLDAS Global L<strong>and</strong> Data Assimilation <strong>Systems</strong><br />
GLIMS Global L<strong>and</strong> Ice Measurements from Space<br />
GLOBEC Global Ocean Ecosystem Dynamics<br />
GMD Global Monitoring Division<br />
GNSS Global Navigation Satellite <strong>Systems</strong><br />
209
Appendices: Acronyms<br />
GOES Geostationary Operational Environmental Satellite<br />
GoMACCS Gulf of Mexico Atmospheric Composition <strong>and</strong> Climate Study<br />
GOMECC Gulf of Mexico <strong>and</strong> East Coast Carbon Cruise<br />
GPCP Global Precipitation Climatology Project<br />
GPS Global Positioning System<br />
GPS-MET Ground-based GPS Meteorology<br />
GRACE Gravity Recovery <strong>and</strong> Climate Experiment<br />
GSD Global <strong>Systems</strong> Division (ESRL)<br />
GSFC Goddard Space Flight Center<br />
GSI Gridpoint Statistical Interpolation<br />
HCO Formyl radicals<br />
HD High Definition<br />
HIRS High-Resolution Infrared Radiation Sounder<br />
HMT Hydrometeorological Testbed<br />
HIRS High-resolution Radiation Sounder<br />
HRDL High Resolution Doppler Lidar<br />
HWRF Hurricane Weather Research <strong>and</strong> Forecasting<br />
HYCOM Hybrid Coordinate Ocean Model<br />
IA Integrating Activities (CIRES scientific theme)<br />
IAGA International Association of Geomagnetism <strong>and</strong> Aeronomy<br />
IARC International Arctic Research Center<br />
ICARTT Int‘l Consortium for Atmospheric Research on Transport <strong>and</strong> Transformation<br />
I-COADS International Comprehensive Ocean-Atmosphere Data Set<br />
ICR Indirect Cost Recovery<br />
ICSU International Council for Science<br />
IDEA Integrated Dynamics through Earth‘s Atmosphere<br />
IEEE Institute of Electrical <strong>and</strong> Electronics Engineers<br />
IGRF International Geomagnetic Reference Field<br />
IGS International GNSS Service<br />
INMARTECH International Marine Technician<br />
INSTAAR Institute of Arctic <strong>and</strong> Alpine Research<br />
IOP Intensive Observation Period<br />
IOZDM Indian Ocean Zonal Dipole Model<br />
IPCC Intergovernmental Panel on Climate Change<br />
IPE Ionosphere-Plasmasphere-Electrodynamics<br />
IPY International Polar Year<br />
IPYDIS IPY Data <strong>and</strong> Information Service<br />
IR Infrared<br />
IRIS Incorporated Research Institutions for Seismology<br />
IRP Innovative Research Program<br />
ISA Impervious Surface Area<br />
ISM index sequential method<br />
ISO International St<strong>and</strong>ards Organization<br />
IT Information Technology<br />
ITCT Intercontinental Transport <strong>and</strong> Chemical Transformation<br />
ITCZ Intertropical Convergence Zone<br />
JCSDA Joint Center for Satellite Data Assimilation<br />
JHT Joint Hurricane Testbed<br />
KML Keyhole Markup Language<br />
KPP Kinetic PreProcessor<br />
LASP Laboratory for Atmospheric <strong>and</strong> Space Physics<br />
LHF Latent Heat Flux<br />
LIM Linear Inverse Model<br />
LPAS Laser-Photo-Acoustic Spectroscopy<br />
LST Local St<strong>and</strong>ard Time<br />
MAG Magnetometer (NEAR data set)<br />
210
Appendices: Acronyms<br />
MBBDB MultiBeam Bathymetric Data Base<br />
MCI Mid-Continent Intensive<br />
MEI Multivariate ENSO Index<br />
METAR A format for reporting weather information (from French)<br />
MFRSR Multi-Filter Rotating Shadowb<strong>and</strong> Radiometer<br />
MHD Magnetohydrodynamic<br />
MHW Mean High Water<br />
MIRRION Mirrored Ionosonde database<br />
MJO Madden-Julian Oscillation<br />
MLO Moana Loa Obervatory<br />
MLS Microwave Limb Sounder<br />
MODIS Moderate Resolution Imaging Spectroradiometer<br />
MONA Measurements of Ozone over North America<br />
MOST Method of Splitting Tsunami<br />
MRE Major Research Equipment grant<br />
MRI Major Research Instrumentation grant<br />
MRS&S MDL (Multi-Use Data Link) Receive System <strong>and</strong> Server<br />
mVOC Microbial Volatile Organic Compounds<br />
N2O Nitrous Oxide<br />
NAAQS National Ambient Air Quality St<strong>and</strong>ards<br />
NACP North American Carbon Program<br />
NAM North American Monsoon<br />
NAME North American Monsoon Experiment<br />
NAO North Atlantic Oscillation<br />
NARR North American Regional Reanalysis<br />
NASA National Aeronautics <strong>and</strong> Space Administration<br />
NASM North America Summer Monsoon<br />
NAVDAT North American Volcanic <strong>and</strong> intrusive ignious rock DATabase<br />
NCAR National Center for Atmospheric Research<br />
NCDC National Climatic Data Center<br />
NCEP National Centers for Environmental Prediction<br />
NCS National Critical <strong>Systems</strong><br />
NDGPS National Differential GPS Service<br />
NEAQS New Engl<strong>and</strong> Air Quality Study<br />
NEAQS2k4 New Engl<strong>and</strong> Air Quality Study 2004<br />
NESDIS National Environmental Satellite, Data, <strong>and</strong> Information Service<br />
netCDF network Common Data Form<br />
NGDC National Geophysical Data Center<br />
NGO Non-Governmental Organizations<br />
NGS National Geodetic Survey<br />
NH3<br />
Ammonia<br />
NIC National Ice Center<br />
NIDIS National Integrated Drought Information System<br />
NIST National Institute of St<strong>and</strong>ards <strong>and</strong> Technology<br />
NO Nitrogen Oxide<br />
NOAA National Oceanic <strong>and</strong> Atmospheric Administration<br />
Noah L<strong>and</strong> surface model:<br />
N: National Centers for Environmental Prediction (NCEP)<br />
O: Oregon State University (Dept of Atmospheric Sciences)<br />
A: Air Force (both AFWA <strong>and</strong> AFRL - formerly AFGL, PL)<br />
H: Hydrologic Research Lab - NWS (now Office of Hydrologic Dev -- OHD)<br />
NOS National Ocean Service<br />
NOSB National Ocean Sciences Bowl<br />
NOx Nitrogen oxides<br />
NRLC Natural Resources Law Center<br />
NSAW National Seasonal Assessment Workshop<br />
211
NSF National Science Foundation<br />
NSIDC National Snow <strong>and</strong> Ice Data Center<br />
NSSL National Severe Storms Laboratory<br />
NWS National Weather Service<br />
O3<br />
Ozone<br />
Appendices: Acronyms<br />
OAI Open Architectural Initiative<br />
OAR Oceanic <strong>and</strong> Atmospheric Research<br />
ODS Ozone Depleting Substances<br />
OGCM Oceanic General Circulation Model<br />
OLR Outgoing Longwave Radiation<br />
OLS Operational Linescan System<br />
OMB Office of Management <strong>and</strong> Budget<br />
OMI Ozone Monitoring Instrument<br />
OPAL Ozone Profiling Atmospheric Lidar<br />
OSU Ohio State University<br />
OWS Ocean Weather Station<br />
PAGES Past Global Changes<br />
PASSCAL Program for the Array Seismic Studies of the Continental Lithosphere<br />
PBL Planetary Boundary Layer<br />
PCP Pentachlorophenol<br />
PCR Polymerase Chain Reaction<br />
PDO Pacific Decadal Oscillation<br />
PFA Perfluoroalkoxy (Teflon tubing)<br />
PM Planetary Metabolism (CIRES scientific theme)<br />
PMEL Pacific Marine Environment Laboratory<br />
PMH Protocol for Metadata Harvesting<br />
PNA Pacific-North America<br />
POMME Geomagnetic field model<br />
PRP Program Review Panel<br />
Prt Pr<strong>and</strong>tl Number<br />
PSD Physical Sciences Division (ESRL)<br />
PSR Polar Scanning Radiometer<br />
PTR-MS Proton-Transfer-Reaction Mass Spectrometry<br />
PTR-ITMS Proton-Transfer-Reaction Ion Transfer Mass Spectrometry<br />
QPE Quantitative Precipitation Estimate<br />
QPF Quantitative Precipitation Forecast<br />
R/V Research Vessel<br />
ReSciPE Resources for Scientists in Partnerships with Education<br />
RH Relative Humidity<br />
RISA Regional Integrated Sciences <strong>and</strong> Assessments<br />
rivmSHIC Software to improve comparability of data sets obtained with different spectral instruments<br />
RL Residual Layer<br />
RP Regional Processes (CIRES scientific theme)<br />
RR Rapid Refresh<br />
RTVS Real-Time Verification System<br />
RUC Rapid Update Cycle<br />
SAC-C Satelite de Aplicanciones Cientificas-C<br />
SARP Sector Applications Research Program<br />
SBL Stable Boundary Layer<br />
SDO Solar Dynamics Observatory<br />
SEARCH Study of Environmental Arctic Change<br />
SEC Space Environment Center<br />
SEISS Space Environment In-Situ Suite<br />
SEM Space Environment Monitor<br />
SEMS Scanning Electrical Mobility Sizer<br />
SES Solid Earth Sciences (CIRES Division)<br />
212
Appendices: Acronyms<br />
SHEBA Surface Heat Budget of the Arctic Ocean<br />
Si Silicon<br />
SiB Simple Biosphere Model<br />
SIFT Short-term Inundation Forecasting for Tsunamis<br />
SII Serum Institute of India<br />
SIMM Simple Inner Magnetosphere Model<br />
SIPNET Simple Photosynthesis <strong>and</strong> Evapotranspiration<br />
SM Soil Moisture<br />
SMART-R Shared Mobile Atmospheric Research <strong>and</strong> Teaching Radar<br />
SMMR Scanning Multichannel Microwave Radiometer<br />
SNEP Sierra Nevada Ecosystem Project<br />
SO2<br />
Sulfur Dioxide<br />
SOARS Significant Opportunities in Atmospheric Research <strong>and</strong> Science<br />
SOF Solar Occultation Flux<br />
SOHO Solar <strong>and</strong> Heliospheric Observatory<br />
SOLAR Solar activity On-Line Activity Resources<br />
SOM Self-Organizing Maps<br />
SPARC Science Policy Assessment <strong>and</strong> Research on Climate<br />
SPIDR Space Physics Interactive Data Resource<br />
SPIE International Society for Optical Engineering<br />
SPMAP South Platte Mapping <strong>and</strong> Analysis Program<br />
SPRAT South Platte Regional Assessment Tool<br />
SSM/I Special Sensor Microwave/Imager<br />
SST Sea Surface Temperature<br />
STEREO Solar Terrestrial Relations Observatory<br />
STRATUS Surface mooring component of the CLIVAR Long Term Evolution <strong>and</strong> Coupling of the<br />
Boundary Layers in the Stratus Deck Regions study<br />
SURFRAD Surface Radiation<br />
SWA Space Weather Analysis<br />
SWDS Space Weather Data Stores<br />
SWE Snow Water Equivalent<br />
SWF Shortwave Flux<br />
SXI Solar X-ray Imager<br />
TAF Terminal Aerodrome Forecast<br />
TAO Tropical Atmosphere Ocean<br />
TCHQ Tetrachlorohydroquinone<br />
TEC Total Electron Content<br />
TECQ Texas Commission on Environmental Quality<br />
TES Tropospheric Emission Spectrometer<br />
TexAQS Texas Air Quality Study<br />
TLS Tethered Lifting System<br />
TM5 Transport Model<br />
TMO Table Mountain Observatory<br />
TMTF Table Mountain Test Facility<br />
TOMS Total Ozone Mapping Spectrometer<br />
TOPAZ Tunable Optical Profiler for Aerosol <strong>and</strong> oZone<br />
TOPEX Ocean Topography Experiment<br />
TRMM Tropical Rainfall Measurement Mission<br />
TWP-ICE Tropical Western Pacific-International Cloud Experiment<br />
UAS Unmanned Aircraft System<br />
UNAVCO University NAVSTAR Consortium<br />
UNESCO United Nations Educational, <strong>Scientific</strong> <strong>and</strong> Cultural Organization<br />
UROP Undergraduate Research Opportunities Program (CU)<br />
USADCC U.S. Antarctic Data Coordination Center<br />
USAF U.S. Air Force<br />
USBR U.S. Bureau of Reclamation<br />
213
Appendices: Acronyms<br />
USDA U.S. Department of Agriculture<br />
USGS United States Geological Survey<br />
UV Ultraviolet<br />
UVB Ultraviolet Broadb<strong>and</strong><br />
VIC Variable Infiltration Capacity (VIC) Macroscale Hydrologic Model<br />
ViRBO Virtual Radiation Belt Observatory<br />
VO Virtual Observatory<br />
VOC Volatile Organic Carbon<br />
VOCALS VAMOS Ocean Cloud Atmospheric L<strong>and</strong> Study<br />
WAM Whole Atmosphere Model<br />
WCD Weather <strong>and</strong> Climate Dynamics (CIRES Division)<br />
WCS Web Coverage Service<br />
WDC World Data Center<br />
WDI World Development Indicators<br />
WDMAM World Digital Magnetic Anomaly Map project<br />
WGA Western Governors‘ Association<br />
WGS World Geodetic System<br />
WHO World Health Organization<br />
WMM World Magnetic Model<br />
WMO World Meteorological Organization<br />
WMS Web Mapping Service<br />
WRF Weather Research <strong>and</strong> Forecasting<br />
WRF/Chem Weather Research <strong>and</strong> Forecasting/Chemistry<br />
WSA Wang-Sheeley-Arge<br />
WSR-88D Weather Surveillance Radar 88 Doppler<br />
WWA Western Water Assessment<br />
XRS X-Ray Sensor<br />
XSLT Extensible Stylesheet Language Transformations<br />
YES Yankee Environmental System<br />
214