Ph. D. THESIS 2009
Ph. D. THESIS 2009
Ph. D. THESIS 2009

Create successful ePaper yourself
Turn your PDF publications into a flip-book with our unique Google optimized e-Paper software.
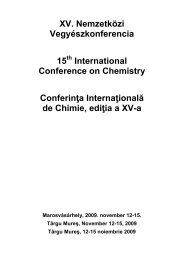
Figure 11. Evolution of the UV absorption spectra of an aqueous solution<br />
containing 1 mMol Au(III), 1 mMol Fe(III)-citrate and 1 mL PSS upon irradiation:<br />
a) in solution, at every 20 minutes; b) in thin film, at every 15 minutes.<br />
Upon irradiation a plasmon band clearly appears (Figure 11a) indicating the<br />
generation of gold nanoparticles. The gradual increase of this band and the red<br />
shifted plasmon peak position represent the growth of the gold particles in<br />
solution. As expected, this phenomenon is coupled with the decrease of the<br />
Au(III) band located at around 310 nm, assuming that the Au(III) ions are<br />
reduced upon irradiation. In the solid state, similar spectra can be observed.<br />
Nevertheless as diffusion of active species is much slower than in solution,<br />
after similar time of irradiation (an hour), the plasmon band is less broad and<br />
located at lower wavelenght around 550 nm.<br />
Figure 12. UV spectrum recorded for the mixture containing 1 mMol<br />
Au(III), Fe(III)-citrate and 1 mL PSS upon irradiation at the same irradiation<br />
times in thin film, at 1:2 ammonium ferric citrate:gold salt ratio.<br />
4.3. The gold structures fabrication process<br />
8