Ph. D. THESIS 2009
Ph. D. THESIS 2009
Ph. D. THESIS 2009

Create successful ePaper yourself
Turn your PDF publications into a flip-book with our unique Google optimized e-Paper software.
set used , the anarmonicities that occurs and the fact that the molecule is<br />
considered as being isolated.<br />
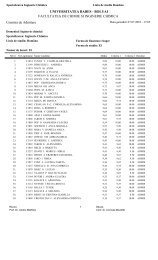
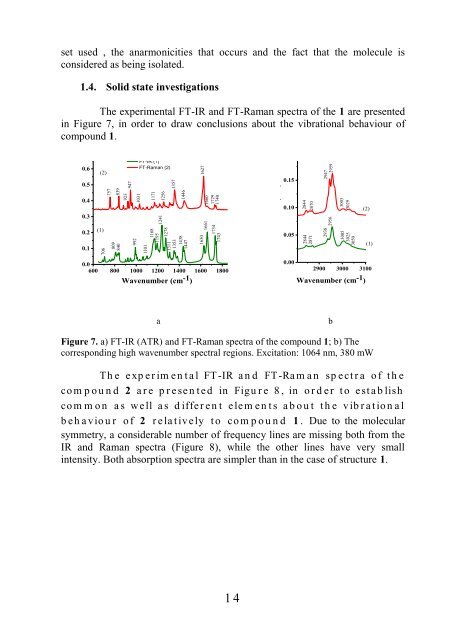
1.4. Solid state investigations<br />
The experimental FT-IR and FT-Raman spectra of the 1 are presented<br />
in Figure 7, in order to draw conclusions about the vibrational behaviour of<br />
compound 1.<br />
Absorbance (a.u.)<br />
0.7<br />
0.6<br />
0.5<br />
0.4<br />
0.3<br />
0.2<br />
0.1<br />
(2)<br />
(1)<br />
706<br />
839<br />
757<br />
809<br />
840<br />
923<br />
947<br />
992<br />
1031<br />
FT-IR (1)<br />
FT-Raman (2)<br />
1171<br />
1101<br />
1168<br />
1195<br />
1278<br />
1311<br />
1353<br />
1438<br />
1447<br />
0.0<br />
600 800 1000 1200 1400 1600 1800<br />
Wavenumber (cm-1 )<br />
1241<br />
1256<br />
1357<br />
1446<br />
1630<br />
1627<br />
1660<br />
1729<br />
1740<br />
1661<br />
1734<br />
1743<br />
14<br />
Absorbance (a.u.)<br />
0.20<br />
0.15<br />
0.10<br />
0.05<br />
0.00<br />
839<br />
2844<br />
757<br />
2844<br />
2871<br />
2870<br />
2947<br />
2959<br />
2938<br />
2956<br />
454<br />
368<br />
233<br />
3003<br />
3029<br />
3005<br />
3025<br />
3050<br />
(2)<br />
2900 3000 3100<br />
Wavenumber (cm -1 )<br />
a b<br />
Figure 7. a) FT-IR (ATR) and FT-Raman spectra of the compound 1; b) The<br />
corresponding high wavenumber spectral regions. Excitation: 1064 nm, 380 mW<br />
Th e e xp er im en t a l FT-IR a n d FT-Ra m a n sp ect r a o f t h e<br />
co m p o u n d 2 a r e p r e se n t ed in Figu r e 8 , in o r d er t o est a b lish<br />
co m m o n a s well a s d iffer en t elem en t s a b o u t t h e v ib r a t io n a l<br />
b eh a vio u r o f 2 r e la t iv ely t o co m p o u n d 1 . Due to the molecular<br />
symmetry, a considerable number of frequency lines are missing both from the<br />
IR and Raman spectra (Figure 8), while the other lines have very small<br />
intensity. Both absorption spectra are simpler than in the case of structure 1.<br />
(1)