Design and Development of a Diagnostics Client for a Beam Loss ...
Design and Development of a Diagnostics Client for a Beam Loss ...
Design and Development of a Diagnostics Client for a Beam Loss ...

You also want an ePaper? Increase the reach of your titles
YUMPU automatically turns print PDFs into web optimized ePapers that Google loves.
<strong>Design</strong> <strong>and</strong> <strong>Development</strong> <strong>of</strong> a <strong>Diagnostics</strong> <strong>Client</strong> <strong>for</strong> a <strong>Beam</strong> <strong>Loss</strong> Measurement System at CERN<br />
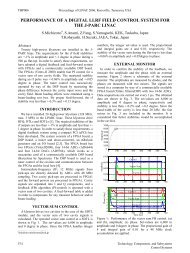
Figure 33: PS Single-Channel Acquisition. Online Tab.<br />
data h<strong>and</strong>ling <strong>and</strong> viewing. We have to note here that the SFP2 graph <strong>and</strong> the cor-<br />
responding components in Figure 35 remain inactive, because the connection in this<br />
case was achieved through the Ethernet SFP (SFP1). The optical fiber SFP (SFP2)<br />
was not even connected to the system during this acquisition.<br />
Accordingly, we can examine Figures 36 <strong>and</strong> 37 which represent a multi-channel<br />
acquisition from the same system in the PS facility. We exclude the figure with the<br />
Hardware Info status tab, because it is identical to the single-channel transmission.<br />
Figure 36 shows the online display during a multi-channel acquisition. Every aver-<br />
aged data plot corresponds to a specific channel. In this example, only three detec-<br />
tors are connected with the input <strong>of</strong> every channel, so the other channels produce<br />
simply a stable trace or noise. In this mode, a user is able to hide or reveal channel<br />
plots at will. The channel checkboxes are used <strong>for</strong> that purpose.<br />
Likewise, Figure 37 indicates the first status tab in the multi-channel acquisition. The<br />
only difference from the single-channel mode is that the first data graph contains the<br />
data plots from all 8 channels <strong>for</strong>ming a micrography <strong>of</strong> the online graph.<br />
• Storing the acquired data -in parallel with the real time view- into files <strong>for</strong> further<br />
Emmanouil I. Angelogiannopoulos 50