Design and Development of a Diagnostics Client for a Beam Loss ...
Design and Development of a Diagnostics Client for a Beam Loss ...
Design and Development of a Diagnostics Client for a Beam Loss ...

Create successful ePaper yourself
Turn your PDF publications into a flip-book with our unique Google optimized e-Paper software.
<strong>Design</strong> <strong>and</strong> <strong>Development</strong> <strong>of</strong> a <strong>Diagnostics</strong> <strong>Client</strong> <strong>for</strong> a <strong>Beam</strong> <strong>Loss</strong> Measurement System at CERN<br />
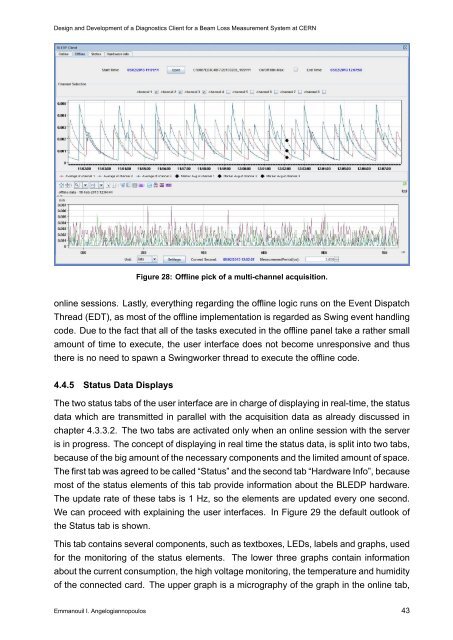
Figure 28: Offline pick <strong>of</strong> a multi-channel acquisition.<br />
online sessions. Lastly, everything regarding the <strong>of</strong>fline logic runs on the Event Dispatch<br />
Thread (EDT), as most <strong>of</strong> the <strong>of</strong>fline implementation is regarded as Swing event h<strong>and</strong>ling<br />
code. Due to the fact that all <strong>of</strong> the tasks executed in the <strong>of</strong>fline panel take a rather small<br />
amount <strong>of</strong> time to execute, the user interface does not become unresponsive <strong>and</strong> thus<br />
there is no need to spawn a Swingworker thread to execute the <strong>of</strong>fline code.<br />
4.4.5 Status Data Displays<br />
The two status tabs <strong>of</strong> the user interface are in charge <strong>of</strong> displaying in real-time, the status<br />
data which are transmitted in parallel with the acquisition data as already discussed in<br />
chapter 4.3.3.2. The two tabs are activated only when an online session with the server<br />
is in progress. The concept <strong>of</strong> displaying in real time the status data, is split into two tabs,<br />
because <strong>of</strong> the big amount <strong>of</strong> the necessary components <strong>and</strong> the limited amount <strong>of</strong> space.<br />
The first tab was agreed to be called “Status” <strong>and</strong> the second tab “Hardware Info”, because<br />
most <strong>of</strong> the status elements <strong>of</strong> this tab provide in<strong>for</strong>mation about the BLEDP hardware.<br />
The update rate <strong>of</strong> these tabs is 1 Hz, so the elements are updated every one second.<br />
We can proceed with explaining the user interfaces. In Figure 29 the default outlook <strong>of</strong><br />
the Status tab is shown.<br />
This tab contains several components, such as textboxes, LEDs, labels <strong>and</strong> graphs, used<br />
<strong>for</strong> the monitoring <strong>of</strong> the status elements. The lower three graphs contain in<strong>for</strong>mation<br />
about the current consumption, the high voltage monitoring, the temperature <strong>and</strong> humidity<br />
<strong>of</strong> the connected card. The upper graph is a micrography <strong>of</strong> the graph in the online tab,<br />
Emmanouil I. Angelogiannopoulos 43