Design and Development of a Diagnostics Client for a Beam Loss ...
Design and Development of a Diagnostics Client for a Beam Loss ...
Design and Development of a Diagnostics Client for a Beam Loss ...

You also want an ePaper? Increase the reach of your titles
YUMPU automatically turns print PDFs into web optimized ePapers that Google loves.
CERN-THESIS-2013-057<br />
24/05/2013<br />
NATIONAL AND KAPODISTRIAN UNIVERSITY OF ATHENS<br />
SCHOOL OF SCIENCES<br />
DEPARTMENT OF INFORMATICS AND TELECOMMUNICATIONS<br />
DIPLOMA THESIS<br />
<strong>Design</strong> <strong>and</strong> <strong>Development</strong> <strong>of</strong> a <strong>Diagnostics</strong> <strong>Client</strong> <strong>for</strong> a <strong>Beam</strong><br />
<strong>Loss</strong> Measurement System at CERN<br />
Emmanouil I. Angelogiannopoulos<br />
Supervisor: Alexis Delis, Pr<strong>of</strong>essor UOA<br />
ATHENS<br />
MAY 2013
DIPLOMA THESIS<br />
<strong>Design</strong> <strong>and</strong> <strong>Development</strong> <strong>of</strong> a <strong>Diagnostics</strong> <strong>Client</strong> <strong>for</strong> a <strong>Beam</strong> <strong>Loss</strong> Measurement System<br />
at CERN<br />
Emmanouil I. Angelogiannopoulos<br />
I.D.: 1115200700077<br />
SUPERVISOR: Alexis Delis, Pr<strong>of</strong>essor UOA
ΕΘΝΙΚΟ ΚΑΙ ΚΑΠΟΔΙΣΤΡΙΑΚΟ ΠΑΝΕΠΙΣΤΗΜΙΟ ΑΘΗΝΩΝ<br />
ΣΧΟΛΗ ΘΕΤΙΚΩΝ ΕΠΙΣΤΗΜΩΝ<br />
ΤΜΗΜΑ ΠΛΗΡΟΦΟΡΙΚΗΣ ΚΑΙ ΤΗΛΕΠΙΚΟΙΝΩΝΙΩΝ<br />
ΠΤΥΧΙΑΚΗ ΕΡΓΑΣΙΑ<br />
Σχεδιασμός και Υλοποίηση ενός Διαγνωστικού Πελάτη για<br />
ένα Σύστημα Παρακολούθησης Εκροής Σωματιδίων στο<br />
CERN<br />
Εμμανουήλ Ι. Αγγελογιαννόπουλος<br />
Επιβλέπων: Αλέξης Δελής, Καθηγητής ΕΚΠΑ<br />
ΑΘΗΝΑ<br />
ΜΑΙΟΣ 2013
ΠΤΥΧΙΑΚΗ ΕΡΓΑΣΙΑ<br />
Σχεδιασμός και Υλοποίηση ενός Διαγνωστικού Πελάτη για ένα Σύστημα<br />
Παρακολούθησης Εκροής Σωματιδίων στο CERN<br />
Εμμανουήλ Ι. Αγγελογιαννόπουλος<br />
Α.Μ.: 1115200700077<br />
ΕΠΙΒΛΕΠΩΝ: Αλέξης Δελής, Καθηγητής ΕΚΠΑ
ΠΕΡΙΛΗΨΗ<br />
Ο Ευρωπαικός Οργανισμός Πυρηνικών Ερευνών, γνωστός ως CERN, είναι ένα από τα με-<br />
γαλύτερα ερευνητικά κέντρα στον τομέα της σωματιδιακής φυσικής. Ο κύριος σκοπός του<br />
κέντρου είναι η παροχή επιταχυντών σωματιδίων και άλλων υποδομών, απαραίτητων για<br />
την ερευνητική διαδικασία στον τομέα της φυσικής υψηλών ενεργειών. Τα σωματίδια επι-<br />
ταχύνονται μέσα από ένα σύμπλεγμα επιταχυντών και έρχονται σε σύγκρουση, έτσι ώστε<br />
να μελετηθούν τα θεμελιώδη στοιχεία της ύλης και οι δυνάμεις μεταξύ αυτών. Φυσικά,<br />
τέτοιου είδους περίπλοκα και κοστοβόρα μηχανήματα χρειάζονται έλεγχο και προστασία.<br />
Για αυτό το σκοπό, μια ποικιλία διαφορετικών συστημάτων -υλικό και/ή λογισμικό- είναι<br />
απαραίτητα. Ένα τέτοιο σύστημα είναι το σύστημα Παρακολούθησης Εκροής Σωματιδίων<br />
(ΠΕΣ) ενός επιταχυντή. Ένα τέτοιου είδους σύστημα είναι σχεδιασμένο για την μέτρηση<br />
απωλειών σωματιδίων σε έναν επιταχυντή. O κατάλληλος σχεδιασμός του συστήματος<br />
ΠΕΣ και αντίστοιχα κατάλληλη τοποθέτηση των μηχανημάτων παρακολούθησης, επιτρέ-<br />
πουν ένα μεγάλο εύρος χρήσιμων δυνατοτήτων διαγνωστικών ακτίνας και μηχανισμών<br />
προστασίας των μηχανημάτων. Η συγκεκριμένη πτυχιακή εργασία επικεντρώνεται στον<br />
σχεδιασμό και την υλοποίηση μιας εφαρμογής πελάτη, η οποία πραγματοποιήθηκε με<br />
σκοπό τον έλεγχο, την συλλογή, την αποθήκευση και την προβολή δεδομένων τα οποία<br />
στέλνονται από ένα σύστημα παρακολούθησης εκροής σωματιδίων. Το υλικό του συστή-<br />
ματος περιγράφεται επίσης εν συντομία.<br />
ΘΕΜΑΤΙΚΗ ΠΕΡΙΟΧΗ: Πελάτης-Διακομιστής, Λογισμικό για Όργανα και Μετρήσεις<br />
ΛΕΞΕΙΣ ΚΛΕΙΔΙΑ: cern, blm, bledp, διαγνωστικός, ενσωματωμένος
ABSTRACT<br />
The European Organization <strong>for</strong> Nuclear Research, known as CERN, is one <strong>of</strong> the biggest<br />
research centers in the field <strong>of</strong> particle physics. Its main function is to provide particle<br />
accelerators <strong>and</strong> other infrastructure needed <strong>for</strong> high energy physics research. Particles<br />
are accelerated through a complex <strong>of</strong> accelerators <strong>and</strong> are brought into collision, in order<br />
to study the fundamental elements <strong>of</strong> matter <strong>and</strong> the <strong>for</strong>ces acting between them. Of<br />
course, such complex <strong>and</strong> expensive machines need control <strong>and</strong> protection. For that<br />
purpose, a variety <strong>of</strong> different systems -hardware <strong>and</strong>/or s<strong>of</strong>tware- is needed. One such<br />
system is the <strong>Beam</strong> <strong>Loss</strong> Monitoring (BLM) system <strong>of</strong> an accelerator. This kind <strong>of</strong> system<br />
is designed <strong>for</strong> measuring beam losses around an accelerator. An appropriate design<br />
<strong>of</strong> the BLM system <strong>and</strong> an appropriate location <strong>of</strong> the monitors enable a wide field <strong>of</strong><br />
very useful beam diagnostics <strong>and</strong> machine protection possibilities. This thesis focuses<br />
on the design <strong>and</strong> development <strong>of</strong> a client application, which is realized with the purpose<br />
<strong>of</strong> comm<strong>and</strong>ing, collecting, storing <strong>and</strong> viewing data sent by a beam loss measurement<br />
system. The hardware <strong>of</strong> the system is also described briefly.<br />
SUBJECT AREA: <strong>Client</strong>-Server, S<strong>of</strong>tware <strong>for</strong> Instrumentation <strong>and</strong> Measurements<br />
KEYWORDS: cern, blm, bledp, diagnostics, embedded
ACKNOWLEDGMENTS<br />
I would like to express my gratitude to my supervisor at CERN, Stephen Jackson, <strong>for</strong> his<br />
comments, support <strong>and</strong> pr<strong>of</strong>essional guidance during the implementation <strong>of</strong> this project.<br />
I would also like to thank all the members <strong>of</strong> the BE-BI-BLM team <strong>and</strong> especially Maciej<br />
Kwiatkowski <strong>for</strong> their excellent collaboration <strong>and</strong> guidance. Lastly, I would like to thank<br />
my supervisor at the University <strong>of</strong> Athens, Pr<strong>of</strong>. Alex Delis <strong>for</strong> his excellent cooperation,<br />
suggestions <strong>and</strong> corrections on this work.
CONTENTS<br />
INTRODUCTION . . . . . . . . . . . . . . . . . . . . . . . . . . . . . . . . . . . . . . 11<br />
1. BACKGROUND . . . . . . . . . . . . . . . . . . . . . . . . . . . . . . . . . . . . 12<br />
1.1 CERN . . . . . . . . . . . . . . . . . . . . . . . . . . . . . . . . . . . . . . . . . . 12<br />
1.2 The CERN Accelerator Complex . . . . . . . . . . . . . . . . . . . . . . . . . . . . 12<br />
2. SCOPE OF THE ASSIGNMENT . . . . . . . . . . . . . . . . . . . . . . . . . . 14<br />
2.1 Necessary requirements upon the s<strong>of</strong>tware architecture . . . . . . . . . . . . . . . . 14<br />
2.2 Technical Tools . . . . . . . . . . . . . . . . . . . . . . . . . . . . . . . . . . . . . 15<br />
3. HARDWARE IMPLEMENTATION . . . . . . . . . . . . . . . . . . . . . . . . . . 16<br />
3.1 Description <strong>of</strong> the new BLM System . . . . . . . . . . . . . . . . . . . . . . . . . . 16<br />
3.2 Acquisition Electronics <strong>of</strong> the BLM System . . . . . . . . . . . . . . . . . . . . . . . 17<br />
3.2.1 <strong>Beam</strong> <strong>Loss</strong> Electronic Acquisition Crate (BLEAC) . . . . . . . . . . . . . . . . . . 17<br />
3.2.2 <strong>Beam</strong> <strong>Loss</strong> Electronic Dual Polarity (BLEDP) . . . . . . . . . . . . . . . . . . . . 18<br />
3.2.2.1 Acquisition methods <strong>of</strong> the BLEDP: FDFC <strong>and</strong> DADC . . . 19<br />
4. CLIENT IMPLEMENTATION . . . . . . . . . . . . . . . . . . . . . . . . . . . . . 22<br />
4.1 Motivation <strong>for</strong> this <strong>Client</strong> <strong>Development</strong> . . . . . . . . . . . . . . . . . . . . . . . . . 22<br />
4.2 FPGA Firmware <strong>and</strong> Embedded Server . . . . . . . . . . . . . . . . . . . . . . . . . 23<br />
4.3 <strong>Client</strong> Server Architecture Protocol . . . . . . . . . . . . . . . . . . . . . . . . . . . 24<br />
4.3.1 Comm<strong>and</strong>s Sent by the <strong>Client</strong> . . . . . . . . . . . . . . . . . . . . . . . . . . . 24<br />
4.3.2 BLEDP Frames Encapsulation . . . . . . . . . . . . . . . . . . . . . . . . . . . 25<br />
4.3.3 Data Sent by the Server . . . . . . . . . . . . . . . . . . . . . . . . . . . . . . 26<br />
4.3.3.1 BLEDP Acquisition Frame . . . . . . . . . . . . . . . . . . . 26<br />
4.3.3.2 BLEDP Status Frame . . . . . . . . . . . . . . . . . . . . . 27<br />
4.3.4 <strong>Development</strong> Phases <strong>of</strong> the Communication Protocol . . . . . . . . . . . . . . . . 29<br />
4.4 <strong>Client</strong> <strong>Development</strong> <strong>and</strong> Requirements . . . . . . . . . . . . . . . . . . . . . . . . . 30<br />
4.4.1 Initial Resources . . . . . . . . . . . . . . . . . . . . . . . . . . . . . . . . . . 30<br />
4.4.2 Online Acquisition Data Display . . . . . . . . . . . . . . . . . . . . . . . . . . . 31<br />
4.4.2.1 <strong>Design</strong> implementation <strong>of</strong> the online interface . . . . . . . . 34<br />
4.4.3 Communication <strong>and</strong> data processing . . . . . . . . . . . . . . . . . . . . . . . . 35<br />
4.4.4 Offline Acquisition Data Display . . . . . . . . . . . . . . . . . . . . . . . . . . . 38<br />
4.4.4.1 <strong>Design</strong> implementation <strong>of</strong> the <strong>of</strong>fline interface . . . . . . . . 42
4.4.5 Status Data Displays . . . . . . . . . . . . . . . . . . . . . . . . . . . . . . . . 43<br />
4.4.5.1 <strong>Design</strong> implementation <strong>of</strong> the <strong>of</strong>fline interface . . . . . . . . 44<br />
4.4.6 Comm<strong>and</strong>s Displays . . . . . . . . . . . . . . . . . . . . . . . . . . . . . . . . 45<br />
4.4.6.1 <strong>Design</strong> implementation <strong>of</strong> the comm<strong>and</strong>s interfaces . . . . 47<br />
5. EVALUATION . . . . . . . . . . . . . . . . . . . . . . . . . . . . . . . . . . . . . 48<br />
5.1 Deliverables <strong>and</strong> their validity . . . . . . . . . . . . . . . . . . . . . . . . . . . . . 48<br />
5.1.1 Reliability Analysis . . . . . . . . . . . . . . . . . . . . . . . . . . . . . . . . . 53<br />
5.1.2 Per<strong>for</strong>mance . . . . . . . . . . . . . . . . . . . . . . . . . . . . . . . . . . . 54<br />
6. CONCLUSION . . . . . . . . . . . . . . . . . . . . . . . . . . . . . . . . . . . . 59<br />
TABLE OF TERMINOLOGY . . . . . . . . . . . . . . . . . . . . . . . . . . . . . . . 60<br />
ABBREVIATIONS AND ACRONYMS . . . . . . . . . . . . . . . . . . . . . . . . . . 61<br />
REFERENCES . . . . . . . . . . . . . . . . . . . . . . . . . . . . . . . . . . . . . . . 62
LIST OF FIGURES<br />
Figure 1: CERN’s Accelerator Complex . . . . . . . . . . . . . . . . . . . . . 13<br />
Figure 2: Overview <strong>of</strong> the new BLM System . . . . . . . . . . . . . . . . . . . 16<br />
Figure 3: Acquisition Crate’s Elements . . . . . . . . . . . . . . . . . . . . . . 18<br />
Figure 4: BLEDP Card [18] . . . . . . . . . . . . . . . . . . . . . . . . . . . . 19<br />
Figure 5: FDFC <strong>and</strong> DADC switch . . . . . . . . . . . . . . . . . . . . . . . . 20<br />
Figure 6: Fully Differential Integrator . . . . . . . . . . . . . . . . . . . . . . . 21<br />
Figure 7: Test Acquisition System <strong>and</strong> Accompanying <strong>Diagnostics</strong> <strong>Client</strong> . . . 22<br />
Figure 8: Architecture <strong>of</strong> the Nios-II system used <strong>for</strong> the Gigabit Ethernet<br />
Readout in the BLEDP firmware . . . . . . . . . . . . . . . . . . . . 23<br />
Figure 9: BLEDP data frames encapsulated into one TCP/IP frame . . . . . . 25<br />
Figure 10: BLEDP bundle <strong>and</strong> Acquisition frame . . . . . . . . . . . . . . . . . 26<br />
Figure 11: Status buffer interleaving between acquisition bundles. . . . . . . . 27<br />
Figure 12: Status Memory Map. . . . . . . . . . . . . . . . . . . . . . . . . . . 28<br />
Figure 13: Chart component with three rendering types associated with three<br />
different Y scales. [13] . . . . . . . . . . . . . . . . . . . . . . . . . 31<br />
Figure 14: Online tab without data acquisition. . . . . . . . . . . . . . . . . . . 32<br />
Figure 15: Connection settings . . . . . . . . . . . . . . . . . . . . . . . . . . . 32<br />
Figure 16: Acquisition settings . . . . . . . . . . . . . . . . . . . . . . . . . . . 32<br />
Figure 17: Display settings . . . . . . . . . . . . . . . . . . . . . . . . . . . . . 33<br />
Figure 18: Scaling . . . . . . . . . . . . . . . . . . . . . . . . . . . . . . . . . . 33<br />
Figure 19: Scaling pop-up window . . . . . . . . . . . . . . . . . . . . . . . . . 33<br />
Figure 20: Storage . . . . . . . . . . . . . . . . . . . . . . . . . . . . . . . . . . 33<br />
Figure 21: Socket, plot <strong>and</strong> log threads. . . . . . . . . . . . . . . . . . . . . . . 36<br />
Figure 22: Storing <strong>for</strong>mat <strong>of</strong> acquisition <strong>and</strong> status files. . . . . . . . . . . . . . 39
Figure 23: Offline tab without data. . . . . . . . . . . . . . . . . . . . . . . . . . 40<br />
Figure 24: Different Mac Addresses (BLEDP Cards) . . . . . . . . . . . . . . . 40<br />
Figure 25: Different Acquisition sessions to pick <strong>for</strong> analysis . . . . . . . . . . 40<br />
Figure 26: Offline Data-Picker. . . . . . . . . . . . . . . . . . . . . . . . . . . . 41<br />
Figure 27: Offline pick with minimum-maximum enabled <strong>and</strong> measurement pe-<br />
riod 2 μs. . . . . . . . . . . . . . . . . . . . . . . . . . . . . . . . . . 42<br />
Figure 28: Offline pick <strong>of</strong> a multi-channel acquisition. . . . . . . . . . . . . . . . 43<br />
Figure 29: Default outlook <strong>of</strong> the status tab. . . . . . . . . . . . . . . . . . . . . 44<br />
Figure 30: Default outlook <strong>of</strong> the hardware info tab. . . . . . . . . . . . . . . . 45<br />
Figure 31: Default outlook <strong>of</strong> the static comm<strong>and</strong>s tab. . . . . . . . . . . . . . . 46<br />
Figure 32: Default outlook <strong>of</strong> an advanced comm<strong>and</strong>s tab. . . . . . . . . . . . 47<br />
Figure 33: PS Single-Channel Acquisition. Online Tab. . . . . . . . . . . . . . 50<br />
Figure 34: PS Single Channel Acquisition. Status Tab. . . . . . . . . . . . . . . 51<br />
Figure 35: PS Single Channel Acquisition. Hardware Info Tab. . . . . . . . . . 52<br />
Figure 36: PS Multi Channel Acquisition. Online Tab. . . . . . . . . . . . . . . 53<br />
Figure 37: Multi Channel Acquisition. Status Tab. . . . . . . . . . . . . . . . . 54<br />
Figure 38: Multi Channel Offline tool. BLM Detectors Decay. . . . . . . . . . . 55
LIST OF TABLES<br />
Table 1: BLEDP Acquisition Frame . . . . . . . . . . . . . . . . . . . . . . . . 27<br />
Table 2: Portion <strong>of</strong> Status Buffer Example . . . . . . . . . . . . . . . . . . . . 29
INTRODUCTION<br />
The Large Hadron Collider (LHC) Injectors Upgrade project was launched at CERN to<br />
provide higher intensity beam <strong>for</strong> the LHC, which will allow an increase <strong>of</strong> its luminosity. A<br />
new <strong>Beam</strong> <strong>Loss</strong> Monitoring (BLM) system is under design <strong>for</strong> the monitoring <strong>of</strong> the beam<br />
losses <strong>and</strong> the machine protection. The BLM Dual Polarity (BLEDP) module is the first<br />
stage <strong>of</strong> that system. The acquisition crate will be able to host up to 8 BLEDP modules<br />
each having 8 analogue inputs to attach various detectors. The BLEDP module should<br />
be able to digitise input current in a wide range from 10 pA up to 200 mA. The total range<br />
is split into two partially overlapping sub-ranges <strong>and</strong> <strong>for</strong> each <strong>of</strong> them a different mea-<br />
surement method is used. The current from 100 mA up to 200 mA should be measured<br />
directly by the ADC as a voltage drop on the input resistor. This method is called Direct<br />
Analogue Digital Conversion (DADC). The current in the lower range from 10 pA to 10 mA<br />
is measured by making use <strong>of</strong> a low noise Fully Differential Frequency Converter (FDFC).<br />
The BLEDP module is equipped with a Cyclone 4GX150 FPGA which is responsible <strong>for</strong><br />
the processing <strong>of</strong> the FDFC data. In the st<strong>and</strong>alone version <strong>of</strong> the module a custom made<br />
Ethernet server is implemented in the FPGA. The server is written in the C Programming<br />
Language. [10] Each BLEDP module in the acquisition crate can have a separate Ether-<br />
net link. The measurement data is sent to a dedicated JAVA client application which is the<br />
main subject <strong>of</strong> this thesis. The task <strong>of</strong> the client is to send comm<strong>and</strong>s to the server, col-<br />
lect, view <strong>and</strong> store the different types <strong>of</strong> acquisition data. The application is a Graphical<br />
User Interface (GUI) <strong>and</strong> makes use <strong>of</strong> the Java Swing Framework <strong>and</strong> many other Java<br />
features such as multi-threading <strong>and</strong> file I/O manipulation.
<strong>Design</strong> <strong>and</strong> <strong>Development</strong> <strong>of</strong> a <strong>Diagnostics</strong> <strong>Client</strong> <strong>for</strong> a <strong>Beam</strong> <strong>Loss</strong> Measurement System at CERN<br />
1.1 CERN<br />
1. BACKGROUND<br />
The European Organization <strong>for</strong> Nuclear Research, known as CERN, is one <strong>of</strong> the world’s<br />
largest <strong>and</strong> most respected centers <strong>for</strong> scientific research. It was established in 1954 <strong>and</strong><br />
is situated in the northwest suburbs <strong>of</strong> Geneva on the Franco-Swiss border. CERN’s main<br />
function is to provide the particle accelerators <strong>and</strong> other infrastructure needed <strong>for</strong> funda-<br />
mental physics research. The output <strong>of</strong> the organization is nominally pure research <strong>and</strong><br />
trained pr<strong>of</strong>essional staff experienced in research activity; a large proportion <strong>of</strong> whom sub-<br />
sequently contribute significantly to a wide variety <strong>of</strong> economic activity typically within Eu-<br />
rope. Whilst there is little direct financial benefit to CERN from spin<strong>of</strong>fs, CERN generates<br />
significant economic support <strong>and</strong> effectively R+D funding to the European high-technology<br />
industry <strong>and</strong> numerous small company start-ups through the technological developments<br />
required to build the large experiments. Lastly, there are numerous by-products <strong>of</strong> the<br />
research which benefit society as a whole, the most obvious examples <strong>of</strong> which are the<br />
World Wide Web, GRID <strong>and</strong> cloud computing, <strong>and</strong> also large contribution in the medical<br />
physics arena. Numerous experiments have been constructed at CERN by international<br />
collaborations to make use <strong>of</strong> them. As an international facility, the CERN sites are <strong>of</strong>fi-<br />
cially under neither Swiss nor French jurisdiction. Member states’ contributions to CERN<br />
<strong>for</strong> the year 2008 total CHF 1 billion which is approximately 664 million euros. CERN is<br />
also noted <strong>for</strong> being the birthplace <strong>of</strong> the World Wide Web. The main site at Meyrin has a<br />
large computer centre containing very powerful data processing facilities primarily <strong>for</strong> ex-<br />
perimental data analysis, <strong>and</strong> because <strong>of</strong> the need to make them available to researchers<br />
elsewhere, has historically been (<strong>and</strong> continues to be) a major wide area networking hub.<br />
Grid computing is developed at CERN, which is the combination <strong>of</strong> computer resources<br />
from multiple administrative domains applied to a common task, usually to a scientific,<br />
technical or business problem that requires a great number <strong>of</strong> computer processing cycles<br />
or the need to process large amounts <strong>of</strong> data. Grid computing is distributed, large-scale<br />
cluster computing, as well as a <strong>for</strong>m <strong>of</strong> network distributed parallel processing [1].<br />
1.2 The CERN Accelerator Complex<br />
The accelerator complex is a succession <strong>of</strong> particle accelerators that can reach increas-<br />
ingly higher energies. Each accelerator boosts the speed <strong>of</strong> a beam <strong>of</strong> particles, be<strong>for</strong>e<br />
injecting it into the next one in the sequence [5], which takes over to bring the beam to an<br />
even higher energy, <strong>and</strong> so on. In the LHC-the last element <strong>of</strong> this chain- each particle<br />
beam is accelerated up to the record energy <strong>of</strong> 7-8 TeV (April 2012) [6].<br />
Protons are obtained by removing electrons from hydrogen atoms. They are injected<br />
from the linear accelerator (LINAC2) into the PS Booster, then the Proton Synchrotron<br />
(PS), followed by the Super Proton Synchrotron (SPS), be<strong>for</strong>e finally reaching the Large<br />
Hadron Collider (LHC). Protons will circulate in the LHC <strong>for</strong> 20 minutes be<strong>for</strong>e reaching<br />
Emmanouil I. Angelogiannopoulos 12
<strong>Design</strong> <strong>and</strong> <strong>Development</strong> <strong>of</strong> a <strong>Diagnostics</strong> <strong>Client</strong> <strong>for</strong> a <strong>Beam</strong> <strong>Loss</strong> Measurement System at CERN<br />
Figure 1: CERN’s Accelerator Complex<br />
the maximum speed <strong>and</strong> energy. The accelerators be<strong>for</strong>e the LHC are called injectors,<br />
because they are injecting the protons from one to the other to gain acceleration, until they<br />
finally reach the LHC. Lead ions <strong>for</strong> the LHC start from a source <strong>of</strong> vaporized lead <strong>and</strong><br />
enter LINAC3 be<strong>for</strong>e being collected <strong>and</strong> accelerated in the Low Energy Ion Ring (LEIR).<br />
They then follow the same route to maximum acceleration as the protons [5].<br />
The newly introduced BLM system is designed <strong>and</strong> developed only <strong>for</strong> the LHC injectors,<br />
i.e. every accelerator that boosts protons behind the LHC. We have to note here that a<br />
new linear accelerator, the Linac4 will replace the old Linac2 in the boosting process. The<br />
new BLM system is intended <strong>for</strong> use with this new accelerator as well. The upgrade will<br />
take place during Long-Shutdown 1 (LS1), which will start on February 2013 <strong>and</strong> will last<br />
approximately 18 months. This period is scheduled <strong>for</strong> the maintenance <strong>and</strong> upgrade <strong>of</strong><br />
the accelerator complex <strong>and</strong> no beam will be commissioned until the end <strong>of</strong> it.<br />
The client-server model discussed in this thesis is realised with the purpose <strong>of</strong> developing<br />
<strong>and</strong> testing the new BLM system, which will be used <strong>for</strong> the upgrade <strong>of</strong> the LHC injectors<br />
during the LS1 period. The current CERN accelerator complex as <strong>of</strong> April 2013 is shown<br />
in Figure 1.<br />
Emmanouil I. Angelogiannopoulos 13
<strong>Design</strong> <strong>and</strong> <strong>Development</strong> <strong>of</strong> a <strong>Diagnostics</strong> <strong>Client</strong> <strong>for</strong> a <strong>Beam</strong> <strong>Loss</strong> Measurement System at CERN<br />
2. SCOPE OF THE ASSIGNMENT<br />
The scope <strong>of</strong> this assignment includes designing, developing, maintaining <strong>and</strong> supporting<br />
the client application <strong>for</strong> the BLM Dual Polarity (BLEDP) modules.<br />
2.1 Necessary requirements upon the s<strong>of</strong>tware architecture<br />
The necessary requirements upon the s<strong>of</strong>tware architecture include the following tasks:<br />
• Communicating with the custom made server, implemented in the BLEDP FPGA,<br />
through the network. Each module has a separate Ethernet link <strong>and</strong> thus it is ad-<br />
dressed individually by its unique address <strong>and</strong> port number. Each server is limited<br />
to accept only one client at a time. At this step it is necessary to decide which pro-<br />
tocol (TCP/IP or UDP/IP) is suitable <strong>for</strong> the project’s needs. The <strong>for</strong>eseen data rate<br />
should be taken into account.<br />
• Comm<strong>and</strong>ing the server. After establishing connection with the server, the client<br />
should be able to send a comm<strong>and</strong> packet. There are two types <strong>of</strong> comm<strong>and</strong>s in<br />
the system. The first group <strong>of</strong> comm<strong>and</strong>s contains details <strong>of</strong> the acquisition request.<br />
There are also expert comm<strong>and</strong>s which can be sent to the server in order to set its<br />
internal registers. At this point a protocol <strong>for</strong> the comm<strong>and</strong>ing should be designed.<br />
• Data sorting <strong>and</strong> processing. The server can send both mixed acquisition <strong>and</strong> status<br />
data. The protocol should be designed, so that the data type can be distinguished<br />
<strong>and</strong> processed accordingly.<br />
• Displaying in real time two different types <strong>of</strong> data, acquisition <strong>and</strong> status, <strong>for</strong> diag-<br />
nostics purposes. This is the main function <strong>of</strong> the application <strong>and</strong> the final goal <strong>of</strong><br />
the development process.<br />
• Storing the acquired data -in parallel with the real time view- into files <strong>for</strong> further<br />
<strong>of</strong>fline analysis. The logic <strong>for</strong> the file storing follows a specific <strong>for</strong>mat, so it will be<br />
easier <strong>for</strong> the user to find a precise time frame from a previous acquisition.<br />
• <strong>Design</strong>ing the graphical user interface. The application must be user friendly. In<br />
order to achieve this goal it should group functionalities <strong>of</strong> a given category in a sep-<br />
arate tab. It should also allow online real time data viewing <strong>and</strong> optional storage<br />
in the <strong>of</strong>fline files. The online viewing <strong>of</strong> the acquisition <strong>and</strong> status data should be<br />
implemented by use <strong>of</strong> separate tabs. The file structure <strong>for</strong> the <strong>of</strong>fline data should be<br />
proposed as well. The <strong>of</strong>fline data analysis tool should be designed within the ap-<br />
plication. This stage <strong>of</strong> development makes use <strong>of</strong> the Java Swing framework. This<br />
framework provides a set <strong>of</strong> powerful <strong>and</strong> flexible components, which synthesize the<br />
look <strong>and</strong> feel <strong>of</strong> modern Java GUI applications.<br />
• High data rate. The application will receive data stream at a high data rate (16 kbps<br />
in single-channel mode <strong>and</strong> 128 kbps in multi-channel mode). To manage online<br />
Emmanouil I. Angelogiannopoulos 14
<strong>Design</strong> <strong>and</strong> <strong>Development</strong> <strong>of</strong> a <strong>Diagnostics</strong> <strong>Client</strong> <strong>for</strong> a <strong>Beam</strong> <strong>Loss</strong> Measurement System at CERN<br />
data display <strong>and</strong> <strong>of</strong>fline data storage in parallel, multi-threading technology must be<br />
engaged. Moreover, data reduction in the online view will be necessary.<br />
2.2 Technical Tools<br />
A variety <strong>of</strong> technical tools was used during the design <strong>and</strong> development process <strong>of</strong> the<br />
application:<br />
• Programming Language: Java version 1.6 <strong>and</strong> 1.7.<br />
• Linux Ubuntu version 12.04.<br />
• MS Windows 7.<br />
• Eclipse IDE environment, Indigo <strong>and</strong> Juno.<br />
• Apache Subversion (SVN) as a revision control system.<br />
• Apache Maven building tools.<br />
• Communication Protocols: TCP, UDP.<br />
• Java Swing Framework.<br />
• JDataViewer, a Java based charting library developed at CERN.<br />
• JIRA as an issue <strong>and</strong> bug tracking s<strong>of</strong>tware.<br />
• BDI Application Launcher, a s<strong>of</strong>tware tool, developed inside the BI-SW section,<br />
which enables a user to start Java applications from different computers in the net-<br />
work. The application has to be deployed with the Ant building tool, be<strong>for</strong>e using<br />
it.<br />
Emmanouil I. Angelogiannopoulos 15
<strong>Design</strong> <strong>and</strong> <strong>Development</strong> <strong>of</strong> a <strong>Diagnostics</strong> <strong>Client</strong> <strong>for</strong> a <strong>Beam</strong> <strong>Loss</strong> Measurement System at CERN<br />
3. HARDWARE IMPLEMENTATION<br />
After giving the general in<strong>for</strong>mation about the BLM <strong>for</strong> the Injectors project, that is going<br />
to be needed in the next sessions, we are going to describe the hardware architecture<br />
<strong>and</strong> implementation <strong>of</strong> the new BLM system. This up-to-date BLM system will be included<br />
<strong>for</strong> the monitoring <strong>of</strong> the beam losses, machine protection <strong>and</strong> is still under development<br />
in terms <strong>of</strong> hardware (Electronics) <strong>and</strong> low-level s<strong>of</strong>tware. The system is making use <strong>of</strong><br />
reprogrammable devices, i.e. Field Programmable Gate Arrays (FPGA), to allow flexibility<br />
<strong>and</strong> target all injector’s requirements. An overview <strong>of</strong> the new BLM system can be seen<br />
in Figure 2 [19].<br />
3.1 Description <strong>of</strong> the new BLM System<br />
Figure 2: Overview <strong>of</strong> the new BLM System<br />
The purpose <strong>of</strong> the new <strong>Beam</strong> <strong>Loss</strong> Monitoring System (BLM) is the beam setup <strong>and</strong> ma-<br />
chine protection <strong>of</strong> the Injector accelerators at CERN. For their upgrade to higher beam<br />
energies <strong>and</strong> intensities, this new BLM system is under development. It will focus on pro-<br />
viding faster measurement updates with higher dynamic range <strong>and</strong> the ability to accept<br />
more types <strong>of</strong> detectors as input compared to its predecessors. The detectors are con-<br />
nected to the acquisition part <strong>of</strong> the system. These detectors in the majority <strong>of</strong> the cases, is<br />
<strong>for</strong>eseen to use ionization chambers similar to those developed <strong>for</strong> the LHC. Nonetheless,<br />
several other types, such as secondary emission monitors, diamonds <strong>and</strong> Cherenkov de-<br />
tectors, may need to be used in some locations to cover particular cases. The detectors<br />
will be connected with the front-end using coaxial double-shielded cables <strong>and</strong> wherever<br />
possible, these cables will pass through enclosed cable trays, in order to make use <strong>of</strong><br />
any possible means <strong>for</strong> noise reduction. The digitization <strong>of</strong> the detectors current input will<br />
make use <strong>of</strong> a new concept, which is currently under development. The input channel<br />
circuit should be able to measure current from 10 pA to 200 mA, a dynamic range <strong>of</strong> 10 11 ,<br />
making use <strong>of</strong> two measurement methods. These methods will be explained briefly in the<br />
next chapters. The connection between the acquisition <strong>and</strong> the processing part <strong>of</strong> the<br />
Emmanouil I. Angelogiannopoulos 16
<strong>Design</strong> <strong>and</strong> <strong>Development</strong> <strong>of</strong> a <strong>Diagnostics</strong> <strong>Client</strong> <strong>for</strong> a <strong>Beam</strong> <strong>Loss</strong> Measurement System at CERN<br />
system will be made with the use <strong>of</strong> optical fibres.<br />
Regarding the processing part, it will combine the in<strong>for</strong>mation gathered by each channel<br />
<strong>and</strong> keep several moving integration windows between 2 μs <strong>and</strong> 1.2 s. The calculated<br />
values <strong>for</strong> each channel will be checked continuously against predefined threshold values<br />
both at the hardware <strong>and</strong> s<strong>of</strong>tware level, as well as being <strong>for</strong>warded to the control centre<br />
<strong>and</strong> databases <strong>for</strong> online observation <strong>and</strong> later analysis. The final system implementation<br />
will make use <strong>of</strong> a FESA server [20] running on a Linux CPU, which will provide data to<br />
clients to deal with settings <strong>and</strong> interlocks. The new BLM system, through its direct con-<br />
nection to the beam interlock system, will have the ability to block all upcoming injections,<br />
when the machine protection thresholds get exceeded [19].<br />
3.2 Acquisition Electronics <strong>of</strong> the BLM System<br />
The acquisition electronics refer to the part <strong>of</strong> the system, which contains the digitizer<br />
modules, the control unit <strong>and</strong> the crate that provides the hosting <strong>and</strong> interconnections.<br />
3.2.1 <strong>Beam</strong> <strong>Loss</strong> Electronic Acquisition Crate (BLEAC)<br />
The <strong>Beam</strong> <strong>Loss</strong> Electronic Acquisition Crate is the Electronic Crate, which hosts the<br />
BLEDP acquisition modules. Its design philosophy is to give the same attention to the<br />
measurement per<strong>for</strong>mance as well as the reliability <strong>of</strong> the entire system. The summary <strong>of</strong><br />
the design philosophy <strong>of</strong> the crate is explained through the following points:<br />
• Per<strong>for</strong>mance improving with respect to previous systems.<br />
• Increase the <strong>Beam</strong> <strong>Loss</strong> Measurement system reliability.<br />
• Preference to simple architectures.<br />
• Implementation <strong>of</strong> the design architecture independent from the component manu-<br />
facturers.<br />
• Implementation <strong>of</strong> protection <strong>and</strong> current limiting.<br />
• Guarantee a total separation between System Functionality <strong>and</strong> System Safety Func-<br />
tions.<br />
• Allowance <strong>of</strong> remote diagnosis.<br />
• Implementation <strong>of</strong> the full remote control <strong>and</strong> calibration. [14]<br />
The crate is based on a custom designed backplane which provides connection <strong>for</strong> 64<br />
channels (8x8) <strong>and</strong> <strong>for</strong> the BLEDP acquisition module, the connection with the power<br />
supply, voltages <strong>and</strong> control signals. In addition, the backplane has support <strong>for</strong> direct<br />
injection <strong>of</strong> a remotely adjustable reference current with two ways: (i) via a dedicated<br />
input or (ii) via an internal current source. For that purpose, each channel’s input goes<br />
through a relay contact. As a result, the system will be able to guarantee the full dynamic<br />
Emmanouil I. Angelogiannopoulos 17
<strong>Design</strong> <strong>and</strong> <strong>Development</strong> <strong>of</strong> a <strong>Diagnostics</strong> <strong>Client</strong> <strong>for</strong> a <strong>Beam</strong> <strong>Loss</strong> Measurement System at CERN<br />
range <strong>and</strong> maximum linear response <strong>of</strong> each channel <strong>and</strong> check frequently the complete<br />
channel’s connection. [19]<br />
In Figure 3 below, the Acquisition Crate <strong>and</strong> some <strong>of</strong> its Technical elements are shown.<br />
Figure 3: Acquisition Crate’s Elements<br />
The detailed description <strong>of</strong> the elements is not part <strong>of</strong> this thesis. Complete in<strong>for</strong>mation<br />
about these technical elements <strong>of</strong> the <strong>Beam</strong> <strong>Loss</strong> Electronic Acquisition Crate can be<br />
found in the corresponding notes. [14]<br />
3.2.2 <strong>Beam</strong> <strong>Loss</strong> Electronic Dual Polarity (BLEDP)<br />
The BLEDP is the <strong>Beam</strong> <strong>Loss</strong> Electronic Dual Polarity Card. It is the most important part <strong>of</strong><br />
the BLEAC <strong>and</strong> its aim is to measure with high precision the current produced by the <strong>Beam</strong><br />
<strong>Loss</strong> Monitors. The crate can host up to 8 BLEDP cards. The BLEDP card contains an<br />
Altera Cyclone IV GX FPGA in which a Nios II s<strong>of</strong>t processor is implemented. The server<br />
application implemented in this processor is written in C. Each card can acquire up to 8<br />
input channels, so the total <strong>of</strong> input channels available on the crate can sum up to 64 (8x8).<br />
In addition, each card has an Ethernet Link, in order to be able to connect with the network<br />
<strong>for</strong> external diagnosis. The diagnostics client communicates with the cards through this<br />
link. The card implements two types <strong>of</strong> measurement: (i) The Fully Differential Frequency<br />
Converter (FDFC) <strong>and</strong> (ii) The Direct Acquisition Data Converter (DADC). Both methods<br />
produce raw digitized input at different rates:<br />
• In the FDFC mode, the input current is integrated during 2μs period. The integrator<br />
produce count pulses which are combined with ADC values to provide precise digital<br />
values at 0.5 MSPS rate (i.e. one sample every 2μs).<br />
• In the DADC mode the input current is converted into ADC values with the same<br />
conversion frequency <strong>of</strong> 0.5 MSPS (i.e. one sample every 2 μs).<br />
Emmanouil I. Angelogiannopoulos 18
<strong>Design</strong> <strong>and</strong> <strong>Development</strong> <strong>of</strong> a <strong>Diagnostics</strong> <strong>Client</strong> <strong>for</strong> a <strong>Beam</strong> <strong>Loss</strong> Measurement System at CERN<br />
More detailed description about these two methods will follow in the next chapter. Also,<br />
to be noted, that the raw ADC data is produced at conversion frequency <strong>of</strong> 10 MSPS (100<br />
ns). In both methods it is then trans<strong>for</strong>med by the BLEDP into processed data with a<br />
constant conversion frequency <strong>of</strong> 0.5 MSPS (2 μs). This means that one data sample is<br />
produced every 2μs <strong>and</strong> thus 500000 samples in one second. Each sample is a double<br />
word <strong>of</strong> 32 bits. A picture <strong>of</strong> the prototype BLEDP module is shown in Figure 4.<br />
The main functions managed by the BLEDP card are the following:<br />
• FPGA local or remote programming.<br />
• 8 Input Analog Interfaces <strong>for</strong> <strong>Beam</strong> <strong>Loss</strong> Monitor.<br />
• Bidirectional Optical Link.<br />
• Power supplies with protection <strong>and</strong> diagnosis.<br />
• Temperature <strong>and</strong> Humidity Measurement.<br />
• Temperature <strong>and</strong> Humidity Measurement.<br />
• ID Chip.<br />
• Auxiliary Ethernet Link <strong>for</strong> diagnosis.<br />
Figure 4: BLEDP Card [18]<br />
3.2.2.1 Acquisition methods <strong>of</strong> the BLEDP: FDFC <strong>and</strong> DADC For the implementa-<br />
tion <strong>of</strong> the electronic acquisition module (BLEDP) <strong>of</strong> the new <strong>Beam</strong> <strong>Loss</strong> Monitoring Sys-<br />
tem in CERN Injector complex, a wide range digitizer card is needed. In order to reach a<br />
high dynamic measurement range <strong>of</strong> 10 11 (10 pA to 200 mA), a mixed technique has been<br />
applied in the new BLEDP card. This technique is based on two matching principles:<br />
• Fully Differential Frequency Converter (FDFC) circuit. In this method, the ADC con-<br />
Emmanouil I. Angelogiannopoulos 19
<strong>Design</strong> <strong>and</strong> <strong>Development</strong> <strong>of</strong> a <strong>Diagnostics</strong> <strong>Client</strong> <strong>for</strong> a <strong>Beam</strong> <strong>Loss</strong> Measurement System at CERN<br />
verter is attached to the differential output <strong>of</strong> the integrator.<br />
• Direct Analogue Digital Conversion (DADC) circuit. In this method the ADC converter<br />
is attached to the input resistor on which the voltage drop is measured.<br />
In this way the measurement range is split into two overlapping ranges. The FDFC is<br />
used between 10 pA – 30 mA <strong>and</strong> the DADC between 100μΑ – 200 mA. The analogue<br />
switch, that selects which <strong>of</strong> the two circuits is active at any given time, is automatic <strong>and</strong><br />
controlled by the FPGA device. A module inside the FPGA is monitoring the data stream<br />
<strong>and</strong> depending on the measurements it receives, selects the most suitable measurement<br />
method <strong>for</strong> the next period. This switching between the two principles, depending on the<br />
input current, can be seen in Figure 5.<br />
Figure 5: FDFC <strong>and</strong> DADC switch<br />
The FDFC method is using an integrator <strong>and</strong> a status signal to select in which branch <strong>of</strong><br />
the fully differential stage, the input current is integrated. This mechanism is shown in<br />
Figure 6.<br />
The FDFC circuit’s output is processed by the FPGA device. The outputs <strong>of</strong> both ana-<br />
logue comparators are complemented by the ADC samples to reach higher measurement<br />
precision. The calculation <strong>of</strong> the integrated loss is triggered by the FPGA over a 2 μs<br />
period. [18] This also marks the integration period, in which the measurement result is<br />
produced. In general, most <strong>of</strong> the operations are h<strong>and</strong>led by the FPGA. So, the FPGA<br />
defines when the acquisition period starts or stops. It also keeps a count <strong>of</strong> the pulses<br />
occurred in the acquisition period <strong>and</strong> clocks the ADC circuitries in order to make differ-<br />
ences <strong>of</strong> the recorded ADC values. Finally, it processes the data <strong>and</strong> provides this 2μs<br />
integral per acquisition channel.<br />
Emmanouil I. Angelogiannopoulos 20
<strong>Design</strong> <strong>and</strong> <strong>Development</strong> <strong>of</strong> a <strong>Diagnostics</strong> <strong>Client</strong> <strong>for</strong> a <strong>Beam</strong> <strong>Loss</strong> Measurement System at CERN<br />
Figure 6: Fully Differential Integrator<br />
On the other h<strong>and</strong>, the principle behind the DADC measurement method is much simpler.<br />
The input signal is sent directly to a digital converter, in order to produce the digital output.<br />
As already mentioned, the switching between the two methods is automatic <strong>and</strong> depends<br />
on the input current.<br />
Emmanouil I. Angelogiannopoulos 21
<strong>Design</strong> <strong>and</strong> <strong>Development</strong> <strong>of</strong> a <strong>Diagnostics</strong> <strong>Client</strong> <strong>for</strong> a <strong>Beam</strong> <strong>Loss</strong> Measurement System at CERN<br />
4. CLIENT IMPLEMENTATION<br />
In the previous chapter we discussed briefly about the new <strong>Beam</strong> <strong>Loss</strong> Monitoring System<br />
<strong>for</strong> the LHC Injectors <strong>and</strong> more specifically about the acquisition part <strong>of</strong> the system, <strong>for</strong><br />
which the communication client is designed. In this chapter, we outline the design <strong>and</strong><br />
development <strong>of</strong> the client by first introducing the motivation <strong>for</strong> building this application.<br />
We then advance with a quick introduction <strong>of</strong> the FPGA firmware <strong>and</strong> embedded s<strong>of</strong>tware.<br />
Afterwards, a full description <strong>of</strong> the client-server architecture protocol is analyzed. This<br />
section includes the definition <strong>of</strong> the comm<strong>and</strong>s sent by the client, the encapsulation <strong>of</strong><br />
the frames sent by the server, the types <strong>of</strong> data sent by the server <strong>and</strong> the development<br />
steps <strong>of</strong> the architecture protocol. Finally, the last subchapter follows a detailed outline <strong>of</strong><br />
the user interface <strong>and</strong> in general <strong>of</strong> the design <strong>and</strong> implementation <strong>of</strong> the client.<br />
4.1 Motivation <strong>for</strong> this <strong>Client</strong> <strong>Development</strong><br />
The final implementation <strong>of</strong> the new <strong>Beam</strong> <strong>Loss</strong> Monitoring System is shown in Figure 2.<br />
The detectors are connected to the input <strong>of</strong> the new <strong>Beam</strong> <strong>Loss</strong> Acquisition Crate, which<br />
hosts up to 8 acquisition modules. Each module is equipped with two small <strong>for</strong>m-factor<br />
pluggable (SFP) transceivers. The first one is a 1310 nm <strong>of</strong> type LX used <strong>for</strong> single mode<br />
fiber communication <strong>and</strong> the other one a 1000Base-T used <strong>for</strong> Gigabit Ethernet [21]. In<br />
the final system the optical SFPs will be used to communicate directly with the processing<br />
electronics (VME64x crate). Then, through the VME64x Bus, a module with a FESA server<br />
running on a Linux CPU, will be used to provide data to accompanying clients.The purpose<br />
<strong>of</strong> this communication is <strong>for</strong> the clients to deal with different settings <strong>and</strong> interlocks <strong>of</strong> the<br />
system. This is the st<strong>and</strong>ard way <strong>for</strong> most <strong>of</strong> the accelerator systems at CERN.<br />
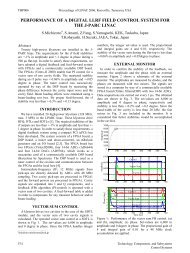
Figure 7: Test Acquisition System <strong>and</strong> Accompanying <strong>Diagnostics</strong> <strong>Client</strong><br />
At the time <strong>of</strong> development <strong>of</strong> the acquisition electronics, the processing electronics were<br />
not yet available. For that purpose, a test system implementation was introduced. This test<br />
system is based on a client-server model using Gigabit Ethernet readout, instead <strong>of</strong> fiber<br />
optics in the final system. A Nios II s<strong>of</strong>t-core CPU is implemented inside the reconfigurable<br />
Emmanouil I. Angelogiannopoulos 22
<strong>Design</strong> <strong>and</strong> <strong>Development</strong> <strong>of</strong> a <strong>Diagnostics</strong> <strong>Client</strong> <strong>for</strong> a <strong>Beam</strong> <strong>Loss</strong> Measurement System at CERN<br />
FPGA device giving the possibility <strong>of</strong> a custom made server. This way a client application<br />
can communicate directly with the modules in order to collect <strong>and</strong> manipulate the different<br />
types <strong>of</strong> data provided by the server. The aim <strong>of</strong> this test system is the development, test<br />
<strong>and</strong> validation <strong>of</strong> the new acquisition system, as well as to later serve as a st<strong>and</strong>alone<br />
measurement system. A graphical idea <strong>of</strong> how this new test system looks like is shown in<br />
Figure 7.<br />
4.2 FPGA Firmware <strong>and</strong> Embedded Server<br />
A block diagram <strong>of</strong> the Field Programmable Gate Array (FPGA) system architecture is<br />
shown in Figure 4.2. This architecture is used <strong>for</strong> the Gigabit Ethernet Readout in the<br />
BLEDP firmware. It consists <strong>of</strong> two parts. The first one is the custom User logic <strong>and</strong> the<br />
other one a System-On-a-Chip (SOC), generated by the Altera tools. [10]<br />
Figure 8: Architecture <strong>of</strong> the Nios-II system used <strong>for</strong> the Gigabit Ethernet Readout in the BLEDP<br />
firmware<br />
More details regarding the block diagram, namely the user logic <strong>and</strong> the SOC, can be<br />
found on [10].<br />
Most <strong>of</strong> the components included in the embedded s<strong>of</strong>tware are provided by Altera <strong>and</strong><br />
other vendors. The advantage <strong>of</strong> that solution is the very short time from a specification to<br />
a first working prototype. Another advantage <strong>of</strong> the ready-made s<strong>of</strong>tware libraries is the<br />
availability <strong>of</strong> numerous services like ICMP, DHCP, etc.<br />
The only custom s<strong>of</strong>tware implemented <strong>for</strong> the BLEDP module is the server application. It<br />
is written in the C programming language <strong>and</strong> is a single-threaded application. The server<br />
creates a st<strong>and</strong>ard TCP/IP socket which listens <strong>for</strong> incoming client connections. It is lim-<br />
ited to listen <strong>for</strong> only one client at a time <strong>and</strong> where there are requests <strong>for</strong> more clients<br />
the connection is refused. The server is parsing incoming comm<strong>and</strong>s <strong>and</strong> disables or en-<br />
Emmanouil I. Angelogiannopoulos 23
<strong>Design</strong> <strong>and</strong> <strong>Development</strong> <strong>of</strong> a <strong>Diagnostics</strong> <strong>Client</strong> <strong>for</strong> a <strong>Beam</strong> <strong>Loss</strong> Measurement System at CERN<br />
ables requested channels <strong>of</strong> the BLEDP module. The detailed logic <strong>of</strong> how the embedded<br />
BLEDP server transmits data from the input channels can be found on [10].<br />
4.3 <strong>Client</strong> Server Architecture Protocol<br />
A specific architecture was discussed, designed <strong>and</strong> then implemented <strong>for</strong> the communi-<br />
cation <strong>of</strong> the Java client <strong>and</strong> the embedded server inside the FPGA. As already mentioned,<br />
the server application is limited to serve only one client at a time <strong>and</strong> when other requests<br />
come they are refused. The connection is established via a st<strong>and</strong>ard TCP/IP h<strong>and</strong>shake<br />
between the two applications, after a connection request from the client is received by the<br />
server. The first thing sent by the server is the MAC address <strong>of</strong> the module on which it<br />
is running. This MAC address is used by the client in the logging protocol specified. The<br />
top folder which contains data from a specific module is named after this address. This<br />
logging-to binary files protocol will be discussed later on. The next thing done by the client<br />
is to send a comm<strong>and</strong> to the server in order to specify several parameters like the amount<br />
<strong>of</strong> expected data, the data <strong>for</strong>mat <strong>and</strong> the channel number it would like to receive. In re-<br />
sponse to that comm<strong>and</strong>, the server will either start the data transmission or it will stop<br />
all active transmissions. The corresponding options concerning readout <strong>and</strong> triggering <strong>for</strong><br />
this comm<strong>and</strong> are listed in the following chapter.<br />
4.3.1 Comm<strong>and</strong>s Sent by the <strong>Client</strong><br />
There are three groups <strong>of</strong> comm<strong>and</strong>s sent by the client to the server. All types use a<br />
TCP socket <strong>for</strong> communication. The first group is called Acquisition comm<strong>and</strong>s <strong>and</strong> re-<br />
fer to an online acquisition. After the establishment <strong>of</strong> a connection with the server, a<br />
start comm<strong>and</strong> is sent. It contains all the critical in<strong>for</strong>mation <strong>for</strong> the acquisition, like the<br />
mode, channel number <strong>and</strong> time. On the other h<strong>and</strong>, a stop comm<strong>and</strong> can be sent at any<br />
time, be<strong>for</strong>e the end <strong>of</strong> a requested acquisition time. This comm<strong>and</strong> is triggered by the<br />
stop button in the graphical interface. The server simply terminates the data flow after<br />
receiving this comm<strong>and</strong> <strong>and</strong> the client reinitializes. The last acquisition comm<strong>and</strong> con-<br />
tains the destination UDP port in the server. The UDP stream sent by the server will be<br />
addressed to that port. This comm<strong>and</strong> is sent only if multi-channel mode is selected. The<br />
user is responsible to open this port, so that incoming UDP data won’t be blocked by a<br />
firewall or other computer protection. The second group <strong>of</strong> comm<strong>and</strong>s is called Expert<br />
or Static comm<strong>and</strong>s. The purpose <strong>of</strong> these comm<strong>and</strong>s is to set the values <strong>of</strong> different<br />
internal registers <strong>of</strong> the BLEDP hardware, such as relays <strong>and</strong> potentiometers. The third<br />
group is called Advanced or Dynamic comm<strong>and</strong>s. Its purpose is to add a dynamic set <strong>of</strong><br />
comm<strong>and</strong>s to control different hardware elements in the card. All the comm<strong>and</strong>s sent by<br />
the client share a common characteristic. Every comm<strong>and</strong> has a fixed size <strong>of</strong> 7 bytes. The<br />
first two bytes constitute the header, which the server uses to distinguish them. Further-<br />
more, the next 4 bytes represent the payload <strong>of</strong> the comm<strong>and</strong>. This payload has different<br />
meaning depending on the type. The last byte is a CRC byte <strong>and</strong> is used to protect against<br />
Emmanouil I. Angelogiannopoulos 24
<strong>Design</strong> <strong>and</strong> <strong>Development</strong> <strong>of</strong> a <strong>Diagnostics</strong> <strong>Client</strong> <strong>for</strong> a <strong>Beam</strong> <strong>Loss</strong> Measurement System at CERN<br />
accidental/incorrect comm<strong>and</strong>s reception. Every comm<strong>and</strong> from the client side is fired by<br />
user actions. More specifically, two different panels in the user interface implement the<br />
Expert <strong>and</strong> Advanced comm<strong>and</strong>s. These panels implementation will be discussed later<br />
on. The Acquisition comm<strong>and</strong>s are produced automatically inside the client’s logic, when<br />
a connection is initiated.<br />
4.3.2 BLEDP Frames Encapsulation<br />
The data frames produced by the BLEDP acquisition module <strong>and</strong> sent over the network by<br />
the embedded server are encapsulated into TCP/IP or UDP/IP frames depending on the<br />
mode <strong>of</strong> acquisition. Each data frame has an integer point <strong>of</strong> 32 bit size. The TCP protocol<br />
was selected only <strong>for</strong> the slower single-channel transmission due to its high reliability <strong>and</strong><br />
automatic data reordering. The expected data rate <strong>for</strong> the single-channel transmission is<br />
16 Mbit/s <strong>and</strong> the TCP protocol was considered the best choice <strong>for</strong> this mode. This rate<br />
comes from the fact that a new data frame is produced <strong>and</strong> transmitted every 2 μs. Re-<br />
spectively, <strong>for</strong> the multi-channel mode the transmission rate is expected to be 128 Mbit/s,<br />
so it is considered necessary the use <strong>of</strong> the UDP protocol <strong>for</strong> this mode. The UDP protocol<br />
is less reliable <strong>and</strong> data frames can arrive in the wrong order, but in comparison with the<br />
TCP it is much faster, because it does not make use <strong>of</strong> any error-checking <strong>and</strong> requires<br />
less computing resources. In respect to these principles, the UDP protocol may be more<br />
reasonable choice <strong>for</strong> a small embedded system like the Nios II.<br />
The acquisition data frames encapsulated into one TCP/IP frame are presented in Figure<br />
9. Each acquisition data frame sent by the server has 32 bits consisting <strong>of</strong> a 6 bits long<br />
header <strong>and</strong> 26 bits payload. The header <strong>and</strong> data <strong>for</strong>mat are described in more details<br />
in the next chapter. The “Maximum Segment Size” <strong>of</strong> the TCP frame has a size <strong>of</strong> 1460<br />
bytes <strong>and</strong> can contain up to 365 acquisition frames. [16]<br />
Figure 9: BLEDP data frames encapsulated into one TCP/IP frame<br />
It is vital <strong>for</strong> the Nios II CPU per<strong>for</strong>mance to avoid the IP fragmentation at all costs, because<br />
<strong>of</strong> the lack <strong>of</strong> memory resources inside the embedded system. As a result the allowed<br />
payload was reduced <strong>and</strong> fixed to 1400 bytes. So, the BLEDP server always transmits<br />
TCP frames with a fixed TCP payload <strong>of</strong> 350 BLEDP acquisition frames. The package<br />
<strong>of</strong> 350 BLEDP frames was agreed to be referred to as BLEDP data bundle. The request<br />
from the client contains the data count number <strong>of</strong> BLEDP bundles. Regarding the case<br />
where the UDP protocol is used, the same principle is applied, which means that the data<br />
Emmanouil I. Angelogiannopoulos 25
<strong>Design</strong> <strong>and</strong> <strong>Development</strong> <strong>of</strong> a <strong>Diagnostics</strong> <strong>Client</strong> <strong>for</strong> a <strong>Beam</strong> <strong>Loss</strong> Measurement System at CERN<br />
count number request refers also to data bundles, even though UDP has no restriction <strong>for</strong><br />
the payload size <strong>of</strong> the datagrams. This is <strong>for</strong> simplicity reasons. In Figure 10, a BLEDP<br />
bundle <strong>of</strong> size 350 <strong>and</strong> one <strong>of</strong> its acquisition frames is shown.<br />
4.3.3 Data Sent by the Server<br />
Figure 10: BLEDP bundle <strong>and</strong> Acquisition frame<br />
There are two types <strong>of</strong> data sent by the embedded server inside the BLEDP cards. The<br />
first type is the acquisition data frames stored inside fixed-size buffers (bundles) as already<br />
mentioned in the previous chapter. The second type is the status data frames. This type is<br />
also transmitted inside fixed-size buffers <strong>and</strong> is interleaving in parallel with the acquisition<br />
data from the established TCP socket.<br />
4.3.3.1 BLEDP Acquisition Frame<br />
The BLEDP acquisition frame is the main packet produced by the FPGA <strong>and</strong> sent by the<br />
embedded server. The monitoring <strong>of</strong> these packets is the main goal <strong>of</strong> the design <strong>and</strong><br />
development process <strong>of</strong> the client application.<br />
In the final operating version <strong>of</strong> the system, several beam loss detectors like secondary<br />
emission monitors, diamonds, Cherenkov detectors <strong>and</strong> ionization chambers are going<br />
to be connected to the input <strong>of</strong> the acquisition system. The system makes use <strong>of</strong> two<br />
measurement acquisition methods, described in the corresponding chapters, <strong>and</strong> pro-<br />
duces digital processed data out <strong>of</strong> the analog input signal. One processed data frame<br />
is produced every 2 μs <strong>for</strong> each <strong>of</strong> the 8 acquisition channels. The embedded server<br />
“talks” directly to the hardware enabling the transmission <strong>of</strong> these acquired processed<br />
data points.<br />
Each processed data frame is acquired <strong>and</strong> manipulated by the embedded server into a<br />
32-bit integer point with header, sequence number <strong>and</strong> payload. There are 6 bits com-<br />
posing the header with 3 types <strong>of</strong> in<strong>for</strong>mation. Subsequently, there are 6 bits <strong>of</strong> sequence<br />
after the header <strong>for</strong> the processed data. These bits indicate an incremental counter value<br />
<strong>for</strong> debugging purposes. The range <strong>of</strong> this number goes up to its maximum value <strong>and</strong> then<br />
rolls back to 0. Lastly, the next bits indicate the payload value. The detailed in<strong>for</strong>mation<br />
about the BLEDP acquisition packet structure is shown in table 1.<br />
Emmanouil I. Angelogiannopoulos 26
<strong>Design</strong> <strong>and</strong> <strong>Development</strong> <strong>of</strong> a <strong>Diagnostics</strong> <strong>Client</strong> <strong>for</strong> a <strong>Beam</strong> <strong>Loss</strong> Measurement System at CERN<br />
Bits Name Description<br />
31 Acquisition/status 0 - acquisition data<br />
1 - status data<br />
30:29 Acquisition Data type 00 - processed data FDFC<br />
01 - processed data DADC<br />
28:26 Acquisition channel channel number 0 to 7<br />
25:20 Debug Counter Increasing counter value 0-63 (<strong>for</strong> debug purposes). When<br />
counter riches max value it will roll back to 0.<br />
19:0 Payload Processed data value (unsigned integer number)<br />
4.3.3.2 BLEDP Status Frame<br />
Table 1: BLEDP Acquisition Frame<br />
The second type <strong>of</strong> data sent by the embedded server is the status data frames. Status<br />
data refer to a number <strong>of</strong> sensors on the card <strong>and</strong> also several other parameters to be<br />
monitored (e.g. Temperature). This status data is interleaving in parallel with the acqui-<br />
sition data frames at 1 Hz frequency. Status data are transmitted exclusively through the<br />
TCP socket regardless <strong>of</strong> the protocol used <strong>for</strong> the transmission <strong>of</strong> acquisition data (TCP<br />
or UDP).<br />
As already discussed, acquisition buffers (bundles) are sent through the network with a<br />
constant rate. The same principle is applied to the status data, so they are collected by<br />
the hardware <strong>and</strong> then packed by the server into fixed-size buffers <strong>and</strong> afterwards sent<br />
through the network. This fixed-size buffer transmission takes place every 1 second <strong>of</strong><br />
acquisition time. The size <strong>of</strong> the buffer may differ throughout the development process. In<br />
Figure 11 an example <strong>of</strong> how a fixed-size status buffer interleaves between the acquisition<br />
bundles is shown. This example is from a single-channel transmission where in 1 second<br />
<strong>of</strong> acquisition, 1428 to 1429 acquisition data bundles are transmitted.<br />
Figure 11: Status buffer interleaving between acquisition bundles.<br />
The status packet has also a size <strong>of</strong> 32 bits <strong>and</strong> can be distinguished from the acquisition<br />
packet from the top bit (see Table 1). Furthermore, the first 16 bits <strong>of</strong> each status packet<br />
are the header <strong>and</strong> have a hexadecimal value <strong>of</strong> “0x8002”. In order to decode the desired<br />
payload values <strong>of</strong> the status packets (bottom 16 bits) the use <strong>of</strong> a complex memory map<br />
Emmanouil I. Angelogiannopoulos 27
<strong>Design</strong> <strong>and</strong> <strong>Development</strong> <strong>of</strong> a <strong>Diagnostics</strong> <strong>Client</strong> <strong>for</strong> a <strong>Beam</strong> <strong>Loss</strong> Measurement System at CERN<br />
as shown in Figure 12 is necessary. This process is done inside an appropriate class <strong>of</strong><br />
the client application.<br />
Figure 12: Status Memory Map.<br />
The above Figure shows only a part <strong>of</strong> the actual size <strong>of</strong> the real status memory map.<br />
Nonetheless, the logic remains the same <strong>for</strong> the rest <strong>of</strong> the elements. It is referring to the<br />
bottom 16 bits <strong>of</strong> the packets in a status buffer. For each status element a decode process<br />
is described. In this regard, each element has an interface <strong>and</strong> a tag number translated<br />
as a header <strong>of</strong> 16 bits <strong>and</strong> a given payload size. For example, the temperature element<br />
has an interface number <strong>of</strong> 0x04 <strong>and</strong> a tag number <strong>of</strong> 0x03 as well as a payload size <strong>of</strong><br />
14 bits following this header (see Figure 12).<br />
Now, we can analyze an example <strong>of</strong> how status elements are decoded from the integer<br />
packets inside the status buffers. There<strong>for</strong>e, we have an arriving status fixed-size integer<br />
buffer <strong>and</strong> we are looking <strong>for</strong> the BLEDP FW element. The first few integer points <strong>of</strong> the<br />
buffer have the values in the following table:<br />
Emmanouil I. Angelogiannopoulos 28
<strong>Design</strong> <strong>and</strong> <strong>Development</strong> <strong>of</strong> a <strong>Diagnostics</strong> <strong>Client</strong> <strong>for</strong> a <strong>Beam</strong> <strong>Loss</strong> Measurement System at CERN<br />
Name Status Prefix Interface Number Tag Number<br />
Payload<br />
Power Header x8002 x00 x00<br />
Power Payload x8002 x003f<br />
BLEDP FW Header x8002 x01 x00<br />
BLEDP FW Payload [31...16] x8002 x4e49<br />
BLEDP FW Payload [15...0] x8002 x4f53<br />
Chip ID Header x8002 x02 x00<br />
Chip ID Payload [63...48] x8002 xf700<br />
Chip ID Payload [47...32] x8002 x000e<br />
Chip ID Payload [31...16] x8002 x323c<br />
Chip ID Payload [15...00] x8002 x4801<br />
Table 2: Portion <strong>of</strong> Status Buffer Example<br />
We know from the memory map that the BLEDP FW record has a header with hex value<br />
0x0100 <strong>and</strong> a payload size <strong>of</strong> 32 bits. Firstly, we track the third integer point in the buffer<br />
<strong>and</strong> we notice that the bottom 16 bits match the BLEDP FW header. Following this ob-<br />
servation, we know that the next two points in the buffer contain the 32-bit payload <strong>of</strong> this<br />
element. It is shared between the bottom 16-bits <strong>of</strong> them. The same principles apply <strong>for</strong><br />
all the status elements.<br />
There is a specific class in the client side, which is designed <strong>and</strong> developed with the<br />
purpose <strong>of</strong> decoding the status buffers <strong>and</strong> getting the payload using several bitwise op-<br />
erations, in order to update the corresponding panel <strong>of</strong> the graphical user interface.<br />
4.3.4 <strong>Development</strong> Phases <strong>of</strong> the Communication Protocol<br />
The communication protocol between the embedded server <strong>and</strong> the diagnostics client<br />
was designed <strong>and</strong> developed in three different stages. These stages depend on whether<br />
single or multi-channel transmission is chosen <strong>and</strong> on the two acquisition methods (see<br />
chapter 3.2.2.1). The order <strong>of</strong> the development is the following:<br />
• Processed Data Transmission From One Channel.<br />
This mode is using the TCP/IP protocol <strong>for</strong> transmission <strong>of</strong> both the acquisition <strong>and</strong><br />
the status data. As already mentioned (see chapter 4.3.2), the <strong>for</strong>eseen data rate<br />
<strong>for</strong> this mode is around 16 Mbit/s. The BLEDP processed packet is produced every<br />
2 μs. There<strong>for</strong>e, a TCP packet with its agreed payload <strong>of</strong> 1400 bytes will contain<br />
350 BLEDP acquisition frames <strong>and</strong> will be filled within 700 μs.<br />
• Processed Data Transmission From All 8 Channels.<br />
This mode is using the UDP/IP protocol <strong>for</strong> the transmission <strong>of</strong> the acquisition data<br />
<strong>and</strong> the TCP/IP protocol <strong>for</strong> the transmission <strong>of</strong> the status data. The <strong>for</strong>eseen data<br />
rate <strong>of</strong> the acquisition data is 128 Mbit/s. Each channel produces one packet every 2<br />
Emmanouil I. Angelogiannopoulos 29
<strong>Design</strong> <strong>and</strong> <strong>Development</strong> <strong>of</strong> a <strong>Diagnostics</strong> <strong>Client</strong> <strong>for</strong> a <strong>Beam</strong> <strong>Loss</strong> Measurement System at CERN<br />
μs. Accordingly, each UDP datagram with a payload <strong>of</strong> 1400 bytes will contain 350<br />
BLEDP acquisition bundles with multiple channels frames inside <strong>and</strong> will be filled<br />
within a time <strong>of</strong> approximately 87 μs. The associated channel number will be stored<br />
inside each frame header.<br />
4.4 <strong>Client</strong> <strong>Development</strong> <strong>and</strong> Requirements<br />
The BLEDP diagnostics client is developed using the JAVA programming language. It is<br />
a graphical user interface application, which was built using the Swing framework. The<br />
general purpose <strong>of</strong> this application is to test <strong>and</strong> validate the new beam loss acquisition<br />
system, be<strong>for</strong>e the final implementation. In this aspect, comm<strong>and</strong>ing <strong>and</strong> collecting data<br />
from the embedded server is required. The collected data –acquisition <strong>and</strong>/or status-<br />
should be displayed in a real-time view <strong>and</strong> also stored in binary files <strong>for</strong> further <strong>of</strong>fline<br />
analysis. For the online view data reduction <strong>and</strong> processing is necessary due to the very<br />
high data rate. This high data rate is the reason <strong>and</strong> purpose <strong>of</strong> the <strong>of</strong>fline view as well.<br />
The logic behind the <strong>of</strong>fline analysis is that a user can navigate into previous acquisition<br />
sessions <strong>and</strong> analyze the data with a desired accuracy. A graphical user interface is<br />
needed to achieve the a<strong>for</strong>ementioned functionalities. A user friendly environment, which<br />
separates the 3 different categories into tabs, was introduced. The online interface <strong>of</strong> the<br />
acquisition <strong>and</strong> status data <strong>and</strong> the <strong>of</strong>fline interface is designed into 3 different tabs with<br />
multiple panels inside. There are several java classes within the project <strong>for</strong> h<strong>and</strong>ling the<br />
GUI tabs, the overall processing <strong>and</strong> the different modes <strong>of</strong> communication with the server.<br />
In addition, the integrity <strong>of</strong> the incoming data is <strong>of</strong> high importance <strong>and</strong> the relatively high<br />
data acquisition rate as well as other exogenous factors like network load, complicate this<br />
fact. The client should by any means cope with the server in terms <strong>of</strong> speed. In order to<br />
manage data reduction, online viewing, GUI updating <strong>and</strong> <strong>of</strong>fline data storage in parallel,<br />
java multithreading technology is engaged.<br />
4.4.1 Initial Resources<br />
The most important component <strong>of</strong> the online <strong>and</strong> <strong>of</strong>fline visualization interfaces is the<br />
JDataViewer package [13] developed at CERN.<br />
JDataViewer (JDVE) is a plotting package that creates a simple representation <strong>of</strong> data,<br />
with powerful, extensible <strong>and</strong> easy to use function editing capabilities. The main reason<br />
why the JDVE package was chosen instead <strong>of</strong> other technologies, is the fact that it is<br />
developed at CERN, which meant instant support <strong>and</strong> feedback at the time <strong>of</strong> develop-<br />
ment <strong>and</strong> also it has the implementation <strong>of</strong> all necessary components <strong>for</strong> data monitoring,<br />
which includes data modeling (DataSource <strong>and</strong> DataSet objects), DataViewer class (the<br />
simple display object <strong>and</strong> its basis part), Chart class (simple chart object), different plotting<br />
renderers (Bar, Scatters, Polyline, etc), chart interactors (Zoom interactor, Pick interac-<br />
tor) , scalers, as well as data point annotations <strong>and</strong> data indicators. Also, a clear API is<br />
Emmanouil I. Angelogiannopoulos 30
<strong>Design</strong> <strong>and</strong> <strong>Development</strong> <strong>of</strong> a <strong>Diagnostics</strong> <strong>Client</strong> <strong>for</strong> a <strong>Beam</strong> <strong>Loss</strong> Measurement System at CERN<br />
provided to configure <strong>and</strong> customize all chart elements (e.g. colors, fonts, data ranges…)<br />
programmatically. The package has a nice user interface <strong>and</strong> also the ability to develop its<br />
functionality in general. Last but not least, the package <strong>of</strong>fers class-leading per<strong>for</strong>mance,<br />
a very important feature <strong>for</strong> our data-intensive application. A visual example <strong>of</strong> a Chart<br />
component <strong>and</strong> different renderers <strong>and</strong> scales, produced by the JDVE package is shown<br />
in Figure 13.<br />
Figure 13: Chart component with three rendering types associated with three different Y scales.<br />
[13]<br />
4.4.2 Online Acquisition Data Display<br />
The most important tab <strong>and</strong> starting point <strong>of</strong> the diagnostics GUI client application is the<br />
online display. Data transmitted by the embedded server <strong>and</strong> received by the client are<br />
plotted on the online display after the desired data reduction. The online acquisition user<br />
interface is shown in Figure 14.<br />
The online user interface is the first <strong>and</strong> default tab, which a user who starts the diagnostics<br />
client observes. A number <strong>of</strong> different settings have to be set be<strong>for</strong>e starting an online<br />
session.<br />
First <strong>of</strong> all, a user has to select the data type <strong>of</strong> the acquisition, i.e. single or multi-channel<br />
processed data. This setting is represented by a group <strong>of</strong> two radio buttons <strong>and</strong> is lo-<br />
cated in the north-west <strong>of</strong> the GUI. It is referring to the 3 different modes <strong>of</strong> acquisition<br />
<strong>of</strong> the BLEDP cards. The next important setting is referring to the channel selection <strong>and</strong><br />
is represented also by a group <strong>of</strong> 8 radio buttons. This setting has to be set only when<br />
we have single-channel transmission. Hereupon, the next group <strong>of</strong> settings refers to the<br />
connection with the BLEDP server. It is a group <strong>of</strong> 3 text fields, in which the user must<br />
enter in<strong>for</strong>mation about the remote address <strong>of</strong> the embedded server <strong>and</strong> the TCP remote<br />
port. The third field is the UDP port <strong>and</strong> is referring to the local port, where acquisition<br />
data are coming, when the UDP protocol is engaged <strong>for</strong> the data transmission. To be<br />
noted here, that if the application is running on a PC, this port number has to be opened<br />
<strong>and</strong> secured in order to receive data, because in many cases, an installed firewall blocks<br />
Emmanouil I. Angelogiannopoulos 31
<strong>Design</strong> <strong>and</strong> <strong>Development</strong> <strong>of</strong> a <strong>Diagnostics</strong> <strong>Client</strong> <strong>for</strong> a <strong>Beam</strong> <strong>Loss</strong> Measurement System at CERN<br />
Figure 14: Online tab without data acquisition.<br />
incoming UDP datagrams. Figure 15 shows the connection parameters. Next to them,<br />
another small but important group <strong>of</strong> settings is located. It is the acquisition group <strong>of</strong> set-<br />
tings <strong>and</strong> consists <strong>of</strong> two text fields. The first one is the acquisition time to be requested<br />
from the BLEDP server. The input value must be in seconds. The application trans<strong>for</strong>ms<br />
the value from seconds into the amount <strong>of</strong> data bundles which are equal to the requested<br />
time <strong>and</strong> sets the appropriate bits <strong>of</strong> the acquisition comm<strong>and</strong> to be sent to the server (see<br />
chapter 4.3.1). The second text field represents the desired measurement period in the<br />
online graph. The value should be put in μs. The measurement period refers to how many<br />
acquisition points will be averaged in the online display. The actual averaging number is<br />
the measurement period divided by 2, because one point is acquired every 2 μs by the<br />
card. For example if 10000 μs is put as measurement period, then one displayed point will<br />
be the average <strong>of</strong> 5000 acquisition points. Figure 16 shows the acquisition parameters as<br />
they appear in the interface.<br />
Figure 15: Connection settings Figure 16: Acquisition settings<br />
The next 3 groups are the display, scaling <strong>and</strong> storage settings <strong>and</strong> parameters. Regard-<br />
ing the display group, there are three components inside. The first one is a text field about<br />
the observation window in points <strong>and</strong> refers to the amount <strong>of</strong> points to be displayed in the<br />
online graph. The second one is spinner <strong>and</strong> refers to the shift window, again in points.<br />
Emmanouil I. Angelogiannopoulos 32
<strong>Design</strong> <strong>and</strong> <strong>Development</strong> <strong>of</strong> a <strong>Diagnostics</strong> <strong>Client</strong> <strong>for</strong> a <strong>Beam</strong> <strong>Loss</strong> Measurement System at CERN<br />
The shift window is strictly related to the observation window. Its value cannot be lower<br />
than 1 <strong>and</strong> higher than the value <strong>of</strong> the observation window. These restrictions justify the<br />
use <strong>of</strong> a spinner instead <strong>of</strong> a text field. More specifically, the shift window value states the<br />
limit where the display buffer filled with averaged points is refreshed with new values. The<br />
last component <strong>of</strong> this group is the Minimum-Maximum checkbox. It states whether or not<br />
the minimum <strong>and</strong> maximum plots should be displayed along with the average plot. This<br />
checkbox is also editable while an online session is running. The display parameters are<br />
shown in Figure 17.<br />
Figure 17: Display settings Figure 18: Scaling<br />
The next group <strong>of</strong> parameters is the scaling settings. It consists <strong>of</strong> a settings button <strong>and</strong><br />
a combo box. The Settings button fires a pop-up window, which is shown in Figure 19.<br />
The name <strong>of</strong> the units in this window indicates the name <strong>of</strong> the Y-Axis in the online graph.<br />
Furthermore, the A <strong>and</strong> B parameters are used in the scaling equation along with the<br />
payload value <strong>of</strong> the received BLEDP acquisition frames, in order to calculate the actual<br />
displayed value. The user can save the desired A <strong>and</strong> B values <strong>for</strong> each unit. This pop-up<br />
window <strong>and</strong> the panels <strong>and</strong> operations <strong>of</strong> it are h<strong>and</strong>led by a class named ScaleSettings.<br />
This class is also used later in the <strong>of</strong>fline <strong>and</strong> status tabs.<br />
Figure 19: Scaling pop-up window<br />
Figure 20: Storage<br />
The combo box is used to select the desired display unit <strong>for</strong> the upcoming online ses-<br />
sion. You can spot that the A <strong>and</strong> B parameters are different depending on the acquisition<br />
method (DADC or FDFC). The purpose <strong>of</strong> the scaling units is mainly to provide better<br />
development <strong>and</strong> feedback.<br />
Emmanouil I. Angelogiannopoulos 33
<strong>Design</strong> <strong>and</strong> <strong>Development</strong> <strong>of</strong> a <strong>Diagnostics</strong> <strong>Client</strong> <strong>for</strong> a <strong>Beam</strong> <strong>Loss</strong> Measurement System at CERN<br />
The last <strong>and</strong> very important group <strong>of</strong> settings is the storage group. It consists <strong>of</strong> a button,<br />
a small text field <strong>and</strong> a checkbox. It is shown in Figure 20. A user should utilize the check<br />
box to select whether or not to save the incoming data into binary files. The path used <strong>for</strong><br />
the logging process is displayed in the text field. This path is specified by the user, who<br />
must press the directory button, so that a pop-up window with a Folder-Chooser appears<br />
<strong>for</strong> path selection.<br />
All <strong>of</strong> the a<strong>for</strong>ementioned parameters should be set be<strong>for</strong>e starting a new acquisition ses-<br />
sion. In the actions group <strong>of</strong> the GUI the Start <strong>and</strong> Stop buttons exist. A control check<br />
<strong>of</strong> the values <strong>of</strong> the parameters should be initiated be<strong>for</strong>e establishing a connection with<br />
the BLEDP server. If a parameter is wrongfully or not set <strong>and</strong> the user presses the Start<br />
button, an error pop-up window appears.<br />
Most <strong>of</strong> the important parameters have default values, in case it is the first time that the<br />
client executes on a computer. If it has been executed more than once on the same<br />
computer, then the application “remembers” the settings <strong>of</strong> the last time. This feature is<br />
achieved with the help <strong>of</strong> a class named PersonalSettingsManager. This class makes use<br />
<strong>of</strong> a HashMap <strong>and</strong> a binary file, where the latest values <strong>of</strong> many Swing components are<br />
stored. The directory where this binary file is stored, depends on the operating system on<br />
which the client is running. Furthermore, it is obvious that different binary files are stored<br />
<strong>for</strong> different users <strong>of</strong> the client.<br />
4.4.2.1 <strong>Design</strong> implementation <strong>of</strong> the online interface<br />
In general, the online panel is h<strong>and</strong>led by a class named OnlineDataViewerGUI. This class<br />
creates <strong>and</strong> h<strong>and</strong>les all the panels <strong>and</strong> the components inside them using several swing<br />
layout managers, i.e. FlowLayout, GridLayout, GridBagLayout <strong>and</strong> BorderLayout. It also<br />
contains several action listeners <strong>and</strong> event-h<strong>and</strong>ling methods <strong>for</strong> the different components<br />
<strong>and</strong> manages every control check <strong>of</strong> the parameter values be<strong>for</strong>e initiating the communi-<br />
cation with the embedded server. Also, the main method <strong>of</strong> the application is part <strong>of</strong> this<br />
class.<br />
The Swing event h<strong>and</strong>ling code runs on a special thread known as the event dispatch<br />
thread (EDT). Most code that invokes Swing methods also runs on this thread. This is nec-<br />
essary because most Swing objects methods are not “thread safe”, so invoking them from<br />
multiple threads risks thread interference or memory consistency errors. It’s useful to think<br />
<strong>of</strong> the code running on the event dispatch thread as a series <strong>of</strong> short tasks. Most tasks are<br />
invocations <strong>of</strong> event-h<strong>and</strong>ling methods, such as ActionListener.actionPer<strong>for</strong>med. Other<br />
tasks can be scheduled by application code, using invokeLater or invokeAndWait. Tasks<br />
on the event dispatch thread must finish quickly; if they don’t, unh<strong>and</strong>led events back up<br />
<strong>and</strong> the user interface becomes unresponsive. [12] In our case, we need to execute a<br />
long-running task, which is the communication with the server <strong>and</strong> then data acquisition,<br />
processing, logging <strong>and</strong> plotting. We have to use a background worker thread <strong>for</strong> that<br />
Emmanouil I. Angelogiannopoulos 34
<strong>Design</strong> <strong>and</strong> <strong>Development</strong> <strong>of</strong> a <strong>Diagnostics</strong> <strong>Client</strong> <strong>for</strong> a <strong>Beam</strong> <strong>Loss</strong> Measurement System at CERN<br />
purpose. For our background task we will use an instance <strong>of</strong> the SwingWorker abstract<br />
class <strong>and</strong> two simple custom-implemented methods:<br />
• public void doInBackground(), which executes our time-consuming task by calling<br />
the start method <strong>of</strong> Communication class. This class will be discussed later on.<br />
• public void done(), which in our case h<strong>and</strong>les gui operations like activating or deac-<br />
tivating critical components or reinitializes other variables, after the background task<br />
is done. We have to note here that the done() method is executed on the EDT.<br />
Our SwingWorker has the ability to terminate at any given time be<strong>for</strong>e the original end <strong>of</strong><br />
the background task. This is the purpose <strong>of</strong> the Stop Button in the Actions group <strong>of</strong> param-<br />
eters. In case <strong>of</strong> early cancellation, the SwingWorker.cancel is invoked. Our background<br />
task cooperates with its own cancellation by invoking SwingWorker.isCancelled at short<br />
intervals <strong>and</strong> terminates depending on the return value; true if cancel has been invoked<br />
<strong>for</strong> this SwingWorker.<br />
4.4.3 Communication <strong>and</strong> data processing<br />
A user is asked to set an ensemble <strong>of</strong> different parameters <strong>and</strong> then initiate the beginning<br />
<strong>of</strong> an online session with the BLEDP server by pressing the Start button on the interface.<br />
As already discussed, a Swingworker is spawned in order to h<strong>and</strong>le the background pro-<br />
cessing.The Communication class is responsible <strong>for</strong> the establishment <strong>of</strong> the link with the<br />
server, as well as the acquisition, distribution <strong>and</strong> processing <strong>of</strong> the data.<br />
It is required that the client will be able to cope in terms <strong>of</strong> speed with the server, so a simple<br />
threading mechanism is used to achieve this feature. The current Swingworker thread<br />
spawns another two threads; the first is responsible <strong>for</strong> the processing <strong>and</strong> plotting in the<br />
online graph <strong>and</strong> the second <strong>for</strong> the logging <strong>of</strong> the data to binary files. These three threads<br />
have different execution priorities. The current thread that acquires data from the socket<br />
has the maximum priority, the plotting thread has medium priority <strong>and</strong> finally the logging<br />
thread has minimum priority. The three threads are sharing two ConcurrentLinkedQueues.<br />
This type <strong>of</strong> queue is thread-safe <strong>and</strong> based on linked-nodes. Furthermore, it orders<br />
elements in a classical first-in-first-out (FIFO) mode. The head <strong>of</strong> the queue is the element<br />
that has been on the queue the longest time <strong>and</strong> the tail is the element with the shortest<br />
time on the queue. The elements <strong>of</strong> the queue are fixed size integer buffers as they<br />
are acquired by the socket; TCP or UDP depending on the mode. Additionally, there is no<br />
alteration <strong>of</strong> the data by the plotting thread, in terms that the buffer polled by the first queue<br />
is the buffer <strong>of</strong>fered to the second queue with no corruption. Figure 21 demonstrates the<br />
function <strong>of</strong> the 3 threads <strong>and</strong> the shared queues.<br />
The queues contain only acquisition data. The distribution <strong>of</strong> the acquisition <strong>and</strong> status<br />
data packets takes place inside the Swingworker socket-acquisition thread. Status data<br />
buffers are first plotted online with the help <strong>of</strong> another class in the status panel. The<br />
Emmanouil I. Angelogiannopoulos 35
<strong>Design</strong> <strong>and</strong> <strong>Development</strong> <strong>of</strong> a <strong>Diagnostics</strong> <strong>Client</strong> <strong>for</strong> a <strong>Beam</strong> <strong>Loss</strong> Measurement System at CERN<br />
Figure 21: Socket, plot <strong>and</strong> log threads.<br />
status panel will be discussed later on. Thereafter, status buffers are <strong>of</strong>fered to another<br />
ConcurrentLinkedQueue which is polled only by the logging thread. The update <strong>of</strong> the<br />
status panels, which takes place inside the Swingworker socket-acquisition thread, was<br />
not considered harmful <strong>for</strong> the per<strong>for</strong>mance <strong>of</strong> the thread due to the low data rate <strong>of</strong> the<br />
status buffers (1 Hz).<br />
The algorithms used by the three threads <strong>for</strong> sharing <strong>and</strong> processing the data is described<br />
below. We have to emphasize here again that the queues are thread-safe, which means<br />
Emmanouil I. Angelogiannopoulos 36
<strong>Design</strong> <strong>and</strong> <strong>Development</strong> <strong>of</strong> a <strong>Diagnostics</strong> <strong>Client</strong> <strong>for</strong> a <strong>Beam</strong> <strong>Loss</strong> Measurement System at CERN<br />
that a safe execution with no conflicts is guaranteed.<br />
1. Read Data from the socket(s) –TCP always, UDP if applicable;<br />
2. Distribute acquisition/status data;<br />
2.1 Update status panels if enough data;<br />
2.2 Offer Status_Log_Queue filled buffer;<br />
2.3 Condition-signal Status_Log_Queue;<br />
3. Offer Plotting_Queue buffer;<br />
4. Condition-Signal Plotting_Queue;<br />
5. Goto 1;<br />
1. while Plotting_Queue.isEmpty do<br />
wait_<strong>for</strong>_condition_signal<br />
end<br />
2. Poll buffer;<br />
3. Offer Logging_Queue buffer;<br />
4. Condition_Signal Logging_Queue;<br />
5. Process buffer <strong>and</strong> plot data;<br />
6. Goto 1;<br />
1. while Logging_Queue.isEmpty do<br />
wait_<strong>for</strong>_condition_signal<br />
end<br />
2.Poll buffer;<br />
Algorithm 1: Swingworker-Socket Thread<br />
Algorithm 2: Plotting Thread<br />
3.Process buffer <strong>and</strong> log acquisition data into files;<br />
3.1 Poll status data from the Status_Log_Queue <strong>and</strong> log them into files;<br />
4. Goto 1;<br />
Algorithm 3: Plotting Thread<br />
The plotting thread uses the settings given by the user to calculate the average, maximum<br />
<strong>and</strong> minimum values <strong>of</strong> incoming data <strong>and</strong> then plots them in the graph <strong>of</strong> the online panel.<br />
This data reduction depends on the display width <strong>of</strong> the graph <strong>and</strong> on the width <strong>of</strong> the<br />
observation window.<br />
On the other h<strong>and</strong>, the logging thread is responsible <strong>for</strong> storing all the data into files (ac-<br />
quisition <strong>and</strong> status) without data reduction. The data stored in these files will be used<br />
<strong>for</strong> the <strong>of</strong>fline data display panel, which will be discussed later. Only processed data are<br />
plotted both online <strong>and</strong> <strong>of</strong>fline. A special <strong>for</strong>mat <strong>for</strong> the data storage was discussed <strong>and</strong><br />
agreed. The number <strong>of</strong> the BLEDP packets in the storage file is configurable with default<br />
value 500000 <strong>for</strong> the single-channel <strong>and</strong> 4000000 <strong>for</strong> the multi-channel transmission. In<br />
the default setting the client application creates one file per each second <strong>of</strong> acquisition.<br />
The BLEDP packets are written into files with their header. Each file name is composed<br />
Emmanouil I. Angelogiannopoulos 37
<strong>Design</strong> <strong>and</strong> <strong>Development</strong> <strong>of</strong> a <strong>Diagnostics</strong> <strong>Client</strong> <strong>for</strong> a <strong>Beam</strong> <strong>Loss</strong> Measurement System at CERN<br />
<strong>of</strong> the UTC time (in ms) <strong>and</strong> <strong>of</strong> the data type (0 – processed data from one channel, 1 –<br />
processed data from all channels). Along with the acquisition file, a stats <strong>and</strong> a status file<br />
is created every second. The stats files include three values; the average, the maximum<br />
<strong>and</strong> the minimum value <strong>of</strong> the payload <strong>of</strong> the data in the corresponding acquisition file.<br />
The status file includes the status buffer <strong>for</strong> the given second. Each <strong>of</strong> these three files<br />
share the same filename with a different extension <strong>for</strong> each type. Every hour <strong>of</strong> the ac-<br />
quisition (3600 files) is stored in a separate folder named using time in a human readable<br />
<strong>for</strong>mat: YYYYMMD_hh. Every new acquisition is represented by a folder which is created<br />
as the parent <strong>of</strong> the hour folders. This folder is also named in a human readable <strong>for</strong>mat:<br />
YYYYMMDD_hhmmss, more accurate than the hour folders. All these folders are created<br />
in the top folder, created inside the configurable input path <strong>and</strong> named using the MAC ad-<br />
dress <strong>of</strong> the BLEDP card. We mentioned already that this MAC address is the first status<br />
element sent by the embedded server after the establishment <strong>of</strong> connection. A graphical<br />
representation <strong>of</strong> the storing <strong>for</strong>mat is shown in Figure 22.<br />
The incoming data are stored in binary files, only when a user selects the corresponding<br />
checkbox in the online panel. Otherwise, only the plotting thread is active. It is also quite<br />
important the amount <strong>of</strong> free space on the target hard drive, due to the high data rate <strong>of</strong> the<br />
incoming data. For example, a 2-hour single-channel acquisition would require approxi-<br />
mately 13.42 gigabytes <strong>of</strong> free space. For the same period <strong>of</strong> multi-channel acquisition<br />
almost 107.3 gigabytes should be available.<br />
4.4.4 Offline Acquisition Data Display<br />
The second <strong>and</strong> equally important tab <strong>of</strong> the diagnostics client is the <strong>of</strong>fline panel. This<br />
panel is designed <strong>and</strong> implemented <strong>for</strong> the <strong>of</strong>fline analysis <strong>of</strong> past online sessions with the<br />
BLEDP server. The logic behind this feature <strong>of</strong> the application is that a user is able to load<br />
data files stored from previous online sessions <strong>and</strong> using the designed interface, make a<br />
very accurate analysis <strong>of</strong> past acquisition data.<br />
We can proceed with explaining the user interface <strong>of</strong> the <strong>of</strong>fline panel. In Figure 23 a<br />
screenshot <strong>of</strong> the <strong>of</strong>fline panel with the Open button marked is shown. In general, the<br />
interface <strong>of</strong> the <strong>of</strong>fline panel is quite simple. It contains two buttons, some labels indicating<br />
names <strong>of</strong> settings, a combo-box, a checkbox, a spinner <strong>and</strong> one or two graphs depending<br />
on the state.<br />
The first step from the user perspective is to press the Open button. After this action a file<br />
search window will appear like the one in Figure 24. Following the storing <strong>for</strong>mat discussed<br />
in the previous chapter, a user should navigate through the selected path <strong>and</strong> then find<br />
the folder(s) named after the BLEDP card MAC address(es). Inside these folders, an<br />
acquisition or hour folder should be picked <strong>for</strong> the <strong>of</strong>fline analysis. A visual representation<br />
<strong>of</strong> the pop-up window used <strong>for</strong> the path selection is shown in Figures 24 <strong>and</strong> 25.<br />
After this action a very important component should appear in the <strong>of</strong>fline user interface,<br />
Emmanouil I. Angelogiannopoulos 38
<strong>Design</strong> <strong>and</strong> <strong>Development</strong> <strong>of</strong> a <strong>Diagnostics</strong> <strong>Client</strong> <strong>for</strong> a <strong>Beam</strong> <strong>Loss</strong> Measurement System at CERN<br />
Figure 22: Storing <strong>for</strong>mat <strong>of</strong> acquisition <strong>and</strong> status files.<br />
the data-picker graph. The plots in this graph are created by the .stats files inside the<br />
acquisition folders, which are created <strong>for</strong> that purpose by the logging thread during a past<br />
online session. Accordingly, there is a plot <strong>for</strong> the minimum, maximum <strong>and</strong> average values<br />
<strong>for</strong> every second <strong>of</strong> each channel in the selected acquisition period. This means, that<br />
each point <strong>of</strong> the average plot represents the average value <strong>of</strong> 500000 acquisition points<br />
as they were calculated <strong>and</strong> stored from the logging thread. Respectively, each point <strong>of</strong><br />
the minimum <strong>and</strong> maximum plots represents the minimum <strong>and</strong> maximum values <strong>for</strong> the<br />
500000 points <strong>of</strong> a second. Depending on the mode, the maximum amount <strong>of</strong> plots in<br />
the data-picker graph is from 3 (single-channel mode) to 24 (multi-channel mode). There<br />
is also an option <strong>for</strong> switching On/Off the maximum <strong>and</strong> minimum plots. Furthermore, on<br />
multi-channel mode there is a possibility to disable/hide different channels average values<br />
<strong>for</strong> comparison purposes.<br />
For example, the figure below shows the created data-picker with an average plot <strong>of</strong> a past<br />
single-channel acquisition. The minimum <strong>and</strong> maximum plots are disabled in this case.<br />
Additionally, in parallel with the data-picker, several other labels appear on either sides <strong>of</strong><br />
the Open button, after the selection action. These in<strong>for</strong>m the user about the selected path,<br />
as well as the starting <strong>and</strong> ending point <strong>of</strong> the past period <strong>of</strong> the displayed acquisition. The<br />
example below shows a 100-second single-channel acquisition. The data-picker graph is<br />
Emmanouil I. Angelogiannopoulos 39
<strong>Design</strong> <strong>and</strong> <strong>Development</strong> <strong>of</strong> a <strong>Diagnostics</strong> <strong>Client</strong> <strong>for</strong> a <strong>Beam</strong> <strong>Loss</strong> Measurement System at CERN<br />
Figure 24: Different Mac Addresses (BLEDP<br />
Cards)<br />
Figure 23: Offline tab without data.<br />
Figure 25: Different Acquisition sessions to pick<br />
<strong>for</strong> analysis<br />
equipped with two mouse <strong>and</strong> one keyboard interactors. The first mouse interactor is the<br />
zoom interactor, provided by the JDataViewer API, <strong>and</strong> the second is a custom-made data-<br />
pick interactor, which we will discuss about in the next few lines. The keyboard interactor is<br />
about moving around the data using the arrow keys, if a zoom interaction was per<strong>for</strong>med.<br />
The most important custom-made data-pick interactor gives the possibility to pick a point<br />
using the left mouse button. After this action, the data <strong>of</strong> the picked point, which represents<br />
a second, are read from the corresponding data file <strong>and</strong> plotted in the lower graph using the<br />
average value from the measurement period as reference. Furthermore, all the settings in<br />
the lower part <strong>of</strong> the interface get enabled. The measurement period <strong>and</strong> the combo-box<br />
have the same meaning as in the online interface. There is also a label in<strong>for</strong>ming the user<br />
about the current second picked. Additionally, a set <strong>of</strong> black markers appear in the upper<br />
graph, one on every point <strong>of</strong> every plot visible, indicating which second was last picked.<br />
Emmanouil I. Angelogiannopoulos 40
<strong>Design</strong> <strong>and</strong> <strong>Development</strong> <strong>of</strong> a <strong>Diagnostics</strong> <strong>Client</strong> <strong>for</strong> a <strong>Beam</strong> <strong>Loss</strong> Measurement System at CERN<br />
Figure 26: Offline Data-Picker.<br />
The number <strong>of</strong> plots in the lower graph is the same as the number <strong>of</strong> plots in the upper<br />
data-picker graph, i.e. from 1 to 3 <strong>for</strong> single-channel acquisitions <strong>and</strong> from 1 to 24 <strong>for</strong><br />
multi-channel acquisition. The only exception in this rule is when the measurement period<br />
equals 2 μs <strong>and</strong> the minimum <strong>and</strong> maximum plots are enabled. In this scenario there will<br />
be no maximum <strong>and</strong> minimum plots in the lower graph, because every single point <strong>of</strong> the<br />
500000 points in the picked second will be plotted. In Figure 27 an example <strong>of</strong> the above<br />
description is shown.<br />
Another important fact about the <strong>of</strong>fline logic is that except from the current second picked,<br />
another 5% <strong>of</strong> the previous <strong>and</strong> the next, if they exist, is plotted on the lower graph. This<br />
feature was proposed <strong>for</strong> more flexibility regarding the navigation between the acquisition<br />
seconds. In the above figure, the edge borders <strong>of</strong> the X scale indicate the start <strong>and</strong> the<br />
end <strong>of</strong> the data stream <strong>of</strong> the picked second respectively. The remaining data make up<br />
the 5% <strong>of</strong> each neighboring second.<br />
Furthermore, there is a small difference in the interface depending on the mode <strong>of</strong> the<br />
acquisition session that was opened. If a multi-channel acquisition was opened, a small<br />
panel will appear south <strong>of</strong> the Open button, containing 8 labels with channel numbering<br />
<strong>and</strong> 8 corresponding checkboxes. This panel gives the option to enable/disable one or<br />
more channels from the graphs dynamically. This feature is very useful <strong>for</strong> comparison<br />
<strong>of</strong> the data between the channels, especially when different detectors are connected to<br />
them. The following figure demonstrates this fact with 3 enabled channels.<br />
Emmanouil I. Angelogiannopoulos 41
<strong>Design</strong> <strong>and</strong> <strong>Development</strong> <strong>of</strong> a <strong>Diagnostics</strong> <strong>Client</strong> <strong>for</strong> a <strong>Beam</strong> <strong>Loss</strong> Measurement System at CERN<br />
Figure 27: Offline pick with minimum-maximum enabled <strong>and</strong> measurement period 2 μs.<br />
4.4.4.1 <strong>Design</strong> implementation <strong>of</strong> the <strong>of</strong>fline interface<br />
The <strong>of</strong>fline user interface <strong>and</strong> the logic behind it, is created <strong>and</strong> h<strong>and</strong>led by 3 different<br />
sub-classes which extend a JPanel class. The first one named OfflineDataViewerGUI is<br />
responsible <strong>for</strong> the creation <strong>of</strong> the interface. Similar to the online interface, this class uses<br />
different layout managers to create small inner panels with all the required components.<br />
An object <strong>of</strong> this class is created inside the constructor <strong>of</strong> the OnlineDataViewerGUI. The<br />
second class <strong>of</strong> the <strong>of</strong>fline concept is named UpperOfflinePanel. Likewise, an object <strong>of</strong><br />
that class is created inside the constructor <strong>of</strong> the OfflineDataViewerGUI <strong>and</strong> is added to<br />
the north <strong>of</strong> the interface as a JPanel. Basically, it implements the logic behind the Open<br />
button <strong>and</strong> all the different components that lie in the upper panel <strong>of</strong> the interface. It creates<br />
an action listener <strong>for</strong> the button which h<strong>and</strong>les requests <strong>for</strong> displaying past online sessions<br />
by the user. Given the selected online session path, all the data are collected by the .stats<br />
files <strong>of</strong> the acquisition <strong>and</strong> stored into buffers. These buffers, along with other variables<br />
such as file descriptors <strong>and</strong> lengths, constitute the arguments <strong>of</strong> the constructor <strong>of</strong> the third<br />
class; the DataPicker. This class creates the data-picker graph with the stats plots from<br />
the requested acquisition session. A DataPicker instance is constructed inside the action<br />
listener after a selection <strong>of</strong> an acquisition session path by the user. This is the reason why<br />
the graph appears in the interface after a valid path selection. This class h<strong>and</strong>les most <strong>of</strong><br />
the picking <strong>and</strong> processing logic <strong>of</strong> the displayed data in both graphs. It also contains an<br />
action <strong>and</strong> an item listener <strong>for</strong> the scaling settings <strong>and</strong> the measurement period spinner<br />
respectively. Finally, it provides a method to dereference every inner object field. This is<br />
vital to avoid memory leaks in the heap space after a sequence <strong>of</strong> opening different past<br />
Emmanouil I. Angelogiannopoulos 42
<strong>Design</strong> <strong>and</strong> <strong>Development</strong> <strong>of</strong> a <strong>Diagnostics</strong> <strong>Client</strong> <strong>for</strong> a <strong>Beam</strong> <strong>Loss</strong> Measurement System at CERN<br />
Figure 28: Offline pick <strong>of</strong> a multi-channel acquisition.<br />
online sessions. Lastly, everything regarding the <strong>of</strong>fline logic runs on the Event Dispatch<br />
Thread (EDT), as most <strong>of</strong> the <strong>of</strong>fline implementation is regarded as Swing event h<strong>and</strong>ling<br />
code. Due to the fact that all <strong>of</strong> the tasks executed in the <strong>of</strong>fline panel take a rather small<br />
amount <strong>of</strong> time to execute, the user interface does not become unresponsive <strong>and</strong> thus<br />
there is no need to spawn a Swingworker thread to execute the <strong>of</strong>fline code.<br />
4.4.5 Status Data Displays<br />
The two status tabs <strong>of</strong> the user interface are in charge <strong>of</strong> displaying in real-time, the status<br />
data which are transmitted in parallel with the acquisition data as already discussed in<br />
chapter 4.3.3.2. The two tabs are activated only when an online session with the server<br />
is in progress. The concept <strong>of</strong> displaying in real time the status data, is split into two tabs,<br />
because <strong>of</strong> the big amount <strong>of</strong> the necessary components <strong>and</strong> the limited amount <strong>of</strong> space.<br />
The first tab was agreed to be called “Status” <strong>and</strong> the second tab “Hardware Info”, because<br />
most <strong>of</strong> the status elements <strong>of</strong> this tab provide in<strong>for</strong>mation about the BLEDP hardware.<br />
The update rate <strong>of</strong> these tabs is 1 Hz, so the elements are updated every one second.<br />
We can proceed with explaining the user interfaces. In Figure 29 the default outlook <strong>of</strong><br />
the Status tab is shown.<br />
This tab contains several components, such as textboxes, LEDs, labels <strong>and</strong> graphs, used<br />
<strong>for</strong> the monitoring <strong>of</strong> the status elements. The lower three graphs contain in<strong>for</strong>mation<br />
about the current consumption, the high voltage monitoring, the temperature <strong>and</strong> humidity<br />
<strong>of</strong> the connected card. The upper graph is a micrography <strong>of</strong> the graph in the online tab,<br />
Emmanouil I. Angelogiannopoulos 43
<strong>Design</strong> <strong>and</strong> <strong>Development</strong> <strong>of</strong> a <strong>Diagnostics</strong> <strong>Client</strong> <strong>for</strong> a <strong>Beam</strong> <strong>Loss</strong> Measurement System at CERN<br />
Figure 29: Default outlook <strong>of</strong> the status tab.<br />
with the difference that the measurement period in this one is stable at 1000000 μs. This<br />
way an update rate <strong>of</strong> 1 point per second <strong>for</strong> the acquisition data is achieved, matching<br />
the rate <strong>of</strong> the status data. We anticipate that the plots <strong>of</strong> the four graphs will be aligned in<br />
the X axis during an online session. In the south point <strong>of</strong> the status tab, several settings<br />
related to the graphs exist. These settings are similar to the ones in the online tab <strong>and</strong> refer<br />
to the scaling, observation window <strong>and</strong> the shift window <strong>of</strong> the graphs. In the west <strong>of</strong> the<br />
tab, several other components exist. They are in charge <strong>of</strong> plotting the values that appear<br />
in the textboxes, the status <strong>of</strong> the power supplies as well as the status <strong>of</strong> the calibration<br />
relays using state changing LEDs. Lastly, in the southeast <strong>and</strong> the west <strong>of</strong> the tab, other<br />
status values like potentiometers <strong>and</strong> event counters subsist.<br />
The second Hardware In<strong>for</strong>mation tab displays the remaining status elements. The default<br />
view <strong>of</strong> this tab is shown in Figure 30.<br />
The Hardware info tab contains several components like textboxes, LEDs, labels <strong>and</strong><br />
graphs. Most <strong>of</strong> the elements are mainly in<strong>for</strong>mation about the status <strong>of</strong> the two small <strong>for</strong>m-<br />
factor pluggable transceivers (SFPs) on the BLEDP card used <strong>for</strong> the communication <strong>of</strong><br />
the card with the network, as well as other hardware in<strong>for</strong>mation such as firmware version,<br />
chip ID <strong>and</strong> global address. The same update rate <strong>of</strong> 1 Hz <strong>for</strong> the plots <strong>and</strong> the other<br />
in<strong>for</strong>mation applies here as well<br />
4.4.5.1 <strong>Design</strong> implementation <strong>of</strong> the <strong>of</strong>fline interface<br />
The two status tabs are developed around two main classes, but also include a number<br />
Emmanouil I. Angelogiannopoulos 44
<strong>Design</strong> <strong>and</strong> <strong>Development</strong> <strong>of</strong> a <strong>Diagnostics</strong> <strong>Client</strong> <strong>for</strong> a <strong>Beam</strong> <strong>Loss</strong> Measurement System at CERN<br />
<strong>of</strong> auxiliary ones <strong>for</strong> the inner panels.<br />
Figure 30: Default outlook <strong>of</strong> the hardware info tab.<br />
StatusGUI is the entry point class. An object <strong>of</strong> this class is created inside the constructor<br />
<strong>of</strong> the OnlineDataViewerGUI class, where the base frame <strong>of</strong> the application is created<br />
as well. Similarly to the other tabs <strong>of</strong> the GUI, the constructor <strong>of</strong> this class builds the<br />
interface <strong>of</strong> the first status tab using different swing layout managers <strong>and</strong> utilities. The<br />
other main class is the HwGUI. The main principles <strong>of</strong> the StatusGUI apply to this class<br />
as well, i.e. an object is constructed in the same place <strong>and</strong> the interface is built with the<br />
same techniques. These two tabs are updated every one second via a dedicated method<br />
in the StatusGUI, which takes as an argument the status buffer (see chapter 4.3.3.2).<br />
This method distributes the status elements in the buffer <strong>and</strong> makes all the necessary<br />
processing <strong>for</strong> the final result. Afterwards, it calls other methods from the auxiliary classes<br />
in order to update both interfaces with the newly calculated status values. The creation<br />
occurs in the EDT, but the update <strong>of</strong> the status panels is executed in the Swingworker<br />
socket thread (see the algorithm in chapter 4.4.3)<br />
4.4.6 Comm<strong>and</strong>s Displays<br />
The two remaining tabs <strong>of</strong> the GUI implement the Static <strong>and</strong> Advanced comm<strong>and</strong>s dis-<br />
cussed in Chapter 4.3.1. These comm<strong>and</strong>s are sent to the server via the TCP socket.<br />
Their purpose is to set different internal registers <strong>of</strong> the FGPA <strong>and</strong> thus affect the mea-<br />
surements. Regarding the static comm<strong>and</strong>s tab, the payload <strong>of</strong> every unique comm<strong>and</strong><br />
can be set either with the use <strong>of</strong> a textbox or a toggle button. A textbox is used in case<br />
Emmanouil I. Angelogiannopoulos 45
<strong>Design</strong> <strong>and</strong> <strong>Development</strong> <strong>of</strong> a <strong>Diagnostics</strong> <strong>Client</strong> <strong>for</strong> a <strong>Beam</strong> <strong>Loss</strong> Measurement System at CERN<br />
the required comm<strong>and</strong> payload is greater than one bit. Similarly, a toggle button is used<br />
in case the payload <strong>of</strong> the comm<strong>and</strong> is one bit (On-Off state). In Figure 31, the static<br />
comm<strong>and</strong>s tab is illustrated. In this Figure every component is disabled, because a con-<br />
nection with a BLEDP server is not established. The tab groups similar comm<strong>and</strong>s inside<br />
titled borders. For every group there is a “Get All” button. Since all these comm<strong>and</strong>s<br />
refer to status elements, the purpose <strong>of</strong> the “Get” buttons is to update the textfields <strong>and</strong><br />
togglebuttons with the very last values <strong>of</strong> the status elements they refer to. These values<br />
lie inside a dedicated buffer, which is updated every one second with the new incoming<br />
status values. The buffer is protected against concurrent access when a “Get” button is<br />
pressed. Furthermore, the “Set” <strong>and</strong> “Set All” buttons, inside the Potentiometers group,<br />
fire a corresponding block <strong>of</strong> code, which is responsible <strong>for</strong> the structuring <strong>of</strong> the comm<strong>and</strong><br />
using the value in the textfield <strong>and</strong> then sending it to the server. In a similar way, a set<br />
action in the other two groups is initiated by the dedicated togglebuttons.<br />
Figure 31: Default outlook <strong>of</strong> the static comm<strong>and</strong>s tab.<br />
Finally, inside the potentiometers group several checkboxes exist. If checked, a special<br />
bit is activated inside the comm<strong>and</strong> byte buffer, which tells the server to write the incoming<br />
comm<strong>and</strong> in the flash memory <strong>of</strong> the FPGA instead <strong>of</strong> the RAM.<br />
Regarding the Advanced comm<strong>and</strong>s tab, it is created only in case a dedicated CSV file<br />
is included in the project’s resources. This file contains all the in<strong>for</strong>mation needed to<br />
construct this tab. Figure 32 illustrates the outlook <strong>of</strong> the Advanced comm<strong>and</strong>s tab, when<br />
a connection with a server is not initiated.<br />
Each row <strong>of</strong> this panel implements an advanced comm<strong>and</strong> to the server. The payload<br />
Emmanouil I. Angelogiannopoulos 46
<strong>Design</strong> <strong>and</strong> <strong>Development</strong> <strong>of</strong> a <strong>Diagnostics</strong> <strong>Client</strong> <strong>for</strong> a <strong>Beam</strong> <strong>Loss</strong> Measurement System at CERN<br />
Figure 32: Default outlook <strong>of</strong> an advanced comm<strong>and</strong>s tab.<br />
size <strong>of</strong> each advanced comm<strong>and</strong> is variable, so it can be either greater or equal to 1. In<br />
the first case, the payload value is parsed from a textfield as in the first two rows. The Set<br />
button is used to send the comm<strong>and</strong> in this respect. In the second case, the payload value<br />
(On/Off states) is set <strong>and</strong> the comm<strong>and</strong> is sent, by a “Press” action <strong>of</strong> the corresponding<br />
On/Off buttons. The total number <strong>of</strong> the advanced comm<strong>and</strong>s in this tab is based on the<br />
CSV file <strong>and</strong> is completely dynamic. Using this feature, the developers <strong>of</strong> the FPGA can<br />
add/remove new comm<strong>and</strong>s in the file <strong>and</strong> reload the client updated.<br />
4.4.6.1 <strong>Design</strong> implementation <strong>of</strong> the comm<strong>and</strong>s interfaces<br />
The two comm<strong>and</strong>s displays are developed around two main classes <strong>and</strong> an auxiliary one.<br />
The static comm<strong>and</strong>s tab is implemented by a class named StaticComm<strong>and</strong>sGUI. This<br />
class responsibility is to create the static comm<strong>and</strong>s tab interface, as well as implement<br />
action listeners <strong>for</strong> the different elements inside the interface. The auxiliary class named<br />
Comm<strong>and</strong>s, implements the separate construction <strong>of</strong> each comm<strong>and</strong>. The comm<strong>and</strong>s<br />
are sent via the TCP socket to the server after construction. A “Set” action by the user is<br />
required to fire the code <strong>for</strong> constructing <strong>and</strong> sending the corresponding comm<strong>and</strong> inside<br />
an action listener. The other main class, used <strong>for</strong> the creation <strong>of</strong> the Advanced comm<strong>and</strong>s<br />
tab, is called GUIScalarElement. This class is used only in case a suitable CSV file is<br />
present in the project’s resources. Firstly, it parses the CSV file <strong>and</strong> sets its fields with the<br />
required in<strong>for</strong>mation. Finally, an ArrayList, which contains all the Advanced comm<strong>and</strong>s<br />
rows as elements, is returned by dedicated methods <strong>and</strong> manipulated properly.<br />
Emmanouil I. Angelogiannopoulos 47
<strong>Design</strong> <strong>and</strong> <strong>Development</strong> <strong>of</strong> a <strong>Diagnostics</strong> <strong>Client</strong> <strong>for</strong> a <strong>Beam</strong> <strong>Loss</strong> Measurement System at CERN<br />
5. EVALUATION<br />
For the evaluation <strong>of</strong> the diagnostics application we used two methods <strong>of</strong> communication.<br />
The first is remote <strong>and</strong> the second is point-to-point. The remote method requires two<br />
computer systems <strong>and</strong> <strong>of</strong> course a BLEDP card. The first computer system resides next<br />
to the <strong>Beam</strong> <strong>Loss</strong> Electronic Acquisition Crate (BLEAC) <strong>and</strong> is connected directly with<br />
it using the Ethernet SFP transceiver at 1 GBps. The diagnostics client is executed in<br />
the second computer, which initiates a connection with the BLEDP server after a request<br />
from the user. The request is sent through the CERN network to the first computer, which<br />
redirects to the corresponding BLEDP card. The point-to-point method is used when the<br />
client is executed in the computer system next to the BLEAC.<br />
The final implementation <strong>of</strong> the client runs under both Linux <strong>and</strong> Windows 7 Operating<br />
Systems. For our tests we used a Linux system, featuring an Intel Core i7 2670QM pro-<br />
cessor running at 2.8 GHz, 4 GB <strong>of</strong> RAM <strong>and</strong> an Intel SSD Drive <strong>for</strong> the remote connection.<br />
For the point-to-point connection, a Windows 7 system was engaged, residing next to the<br />
<strong>Beam</strong> <strong>Loss</strong> Electronic Acquisition Crate (BLEAC) inside the BLM Laboratory or again a<br />
Windows 7 system next to the BLEAC in the Proton Synchrotron (PS) accelerator facility.<br />
Using the latter system, we can examine real data from the accelerator detectors, which<br />
are connected to the input channels <strong>of</strong> the BLEDP cards.<br />
5.1 Deliverables <strong>and</strong> their validity<br />
The final deliverable can be defined as a successfully implemented diagnostics system<br />
that meets the requirements <strong>of</strong> the <strong>Beam</strong> <strong>Loss</strong> Monitoring team. Thereby, the quality <strong>of</strong><br />
the end product can be evaluated by the detailed analysis <strong>of</strong> the system characteristics<br />
against the list <strong>of</strong> requirements in Chapter 2.<br />
• Communicating with the custom made server, implemented in the BLEDP FPGA,<br />
through the network. Each module has a separate Ethernet link <strong>and</strong> thus it is ad-<br />
dressed individually by its unique address <strong>and</strong> port number. Each server is limited<br />
to accept only one client at a time. At this step it is necessary to decide which pro-<br />
tocol (TCP/IP or UDP/IP) is suitable <strong>for</strong> the project’s needs. The <strong>for</strong>eseen data rate<br />
should be taken into account.<br />
A user is able to establish a connection with the BLEDP server, through the Online<br />
Panel Interface <strong>of</strong> the client. All the necessary parameters, depending on the mode<br />
<strong>of</strong> acquisition, should be set be<strong>for</strong>e a Start Communication action. Otherwise, an<br />
error message should appear. It was decided, that the TCP protocol should be used<br />
<strong>for</strong> a single channel transmission <strong>and</strong> the UDP protocol <strong>for</strong> the multi-channel. The<br />
data rates <strong>of</strong> the two modes were the most important factor <strong>for</strong> this decision. Of<br />
course, the connection is always established through the TCP socket, regardless <strong>of</strong><br />
the acquisition mode, as the UDP protocol is connectionless.<br />
Emmanouil I. Angelogiannopoulos 48
<strong>Design</strong> <strong>and</strong> <strong>Development</strong> <strong>of</strong> a <strong>Diagnostics</strong> <strong>Client</strong> <strong>for</strong> a <strong>Beam</strong> <strong>Loss</strong> Measurement System at CERN<br />
• Comm<strong>and</strong>ing the server. After establishing a connection with the server, the client<br />
should be able to send a comm<strong>and</strong> packet. There are two types <strong>of</strong> comm<strong>and</strong>s in<br />
the system. The first group <strong>of</strong> comm<strong>and</strong>s contains details <strong>of</strong> the acquisition request.<br />
There are also expert comm<strong>and</strong>s which can be sent to the server in order to set its<br />
internal registers. At this point a protocol <strong>for</strong> the comm<strong>and</strong>ing should be designed.<br />
The client’s logic implements this feature. The protocol <strong>and</strong> the description <strong>of</strong> all<br />
the types <strong>of</strong> comm<strong>and</strong>s (Acquisition, Expert <strong>and</strong> Advanced) is presented in Chapter<br />
4.3.1. Furthermore, the description <strong>and</strong> implementation <strong>of</strong> the Expert <strong>and</strong> Advanced<br />
comm<strong>and</strong>s is explained thoroughly in Chapters 4.4.6 <strong>and</strong> 4.4.6.1.<br />
• Data sorting <strong>and</strong> processing. The server can send both mixed acquisition <strong>and</strong> sta-<br />
tus/diagnostic data. The protocol should be designed so the data type can be dis-<br />
tinguished <strong>and</strong> processed accordingly.<br />
In Chapter 4.4.3, we explain the internal distribution process <strong>of</strong> the two data types.<br />
The acquisition, distribution <strong>and</strong> processing <strong>of</strong> the data is done by three different<br />
threads <strong>for</strong> better per<strong>for</strong>mance.<br />
• Displaying in real time two different types <strong>of</strong> data, acquisition <strong>and</strong>/or status, <strong>for</strong> di-<br />
agnostics purposes. This is the main function <strong>of</strong> the application <strong>and</strong> the final goal <strong>of</strong><br />
the development process.<br />
The online acquisition tab <strong>and</strong> more precisely the graph component inside it is used<br />
<strong>for</strong> displaying the acquisition data in real-time. The status data tabs are used <strong>for</strong> dis-<br />
playing the status elements in parallel with the acquisition data. The refresh rate <strong>of</strong><br />
the data in the graphs inside the status tabs is always 1 Hz. For the online graph, the<br />
refresh rate depends always on the measurement period field, but the user should<br />
be careful with this value, because a small measurement period could cause per<strong>for</strong>-<br />
mance issues.<br />
We can examine in the following figures, some real-time data coming from a BLEDP<br />
server in the Proton Synchrotron (PS) accelerator facility. Different detectors are<br />
connected in the input <strong>of</strong> some channels <strong>of</strong> that system. All the following figures<br />
were captured during an online data transmission.<br />
Figures 33, 34 <strong>and</strong> 35 illustrate the real-time data-viewing <strong>of</strong> the two different types <strong>of</strong><br />
data, distributed in three tabs, from a single-channel acquisition with a measurement<br />
period <strong>of</strong> 10000 μs. The type <strong>of</strong> detector in the acquisition channel <strong>of</strong> this example<br />
is an ionization chamber.<br />
In Figure 33, the averaged acquisition data plot in the online display is shown. The<br />
observable peaks indicate beam losses produced by the connected detector in chan-<br />
nel 5. Obviously, the different components used <strong>for</strong> settings manipulation are dis-<br />
abled during an online session. Only the stop button <strong>and</strong> the Min-Max checkbox are<br />
enabled. Similarly, from the same acquisition, Figures 34 <strong>and</strong> 35 illustrate the status<br />
Emmanouil I. Angelogiannopoulos 49
<strong>Design</strong> <strong>and</strong> <strong>Development</strong> <strong>of</strong> a <strong>Diagnostics</strong> <strong>Client</strong> <strong>for</strong> a <strong>Beam</strong> <strong>Loss</strong> Measurement System at CERN<br />
Figure 33: PS Single-Channel Acquisition. Online Tab.<br />
data h<strong>and</strong>ling <strong>and</strong> viewing. We have to note here that the SFP2 graph <strong>and</strong> the cor-<br />
responding components in Figure 35 remain inactive, because the connection in this<br />
case was achieved through the Ethernet SFP (SFP1). The optical fiber SFP (SFP2)<br />
was not even connected to the system during this acquisition.<br />
Accordingly, we can examine Figures 36 <strong>and</strong> 37 which represent a multi-channel<br />
acquisition from the same system in the PS facility. We exclude the figure with the<br />
Hardware Info status tab, because it is identical to the single-channel transmission.<br />
Figure 36 shows the online display during a multi-channel acquisition. Every aver-<br />
aged data plot corresponds to a specific channel. In this example, only three detec-<br />
tors are connected with the input <strong>of</strong> every channel, so the other channels produce<br />
simply a stable trace or noise. In this mode, a user is able to hide or reveal channel<br />
plots at will. The channel checkboxes are used <strong>for</strong> that purpose.<br />
Likewise, Figure 37 indicates the first status tab in the multi-channel acquisition. The<br />
only difference from the single-channel mode is that the first data graph contains the<br />
data plots from all 8 channels <strong>for</strong>ming a micrography <strong>of</strong> the online graph.<br />
• Storing the acquired data -in parallel with the real time view- into files <strong>for</strong> further<br />
Emmanouil I. Angelogiannopoulos 50
<strong>Design</strong> <strong>and</strong> <strong>Development</strong> <strong>of</strong> a <strong>Diagnostics</strong> <strong>Client</strong> <strong>for</strong> a <strong>Beam</strong> <strong>Loss</strong> Measurement System at CERN<br />
Figure 34: PS Single Channel Acquisition. Status Tab.<br />
<strong>of</strong>fline analysis. The logic <strong>for</strong> the file storing follows a specific <strong>for</strong>mat, so it will be<br />
easier <strong>for</strong> the user to find a precise time frame from a previous acquisition.<br />
The parallel data storage is achieved with a process that is discussed in Chapter<br />
4.4.3. The <strong>of</strong>fline tab is used <strong>for</strong> further <strong>of</strong>fline analysis <strong>of</strong> the acquired data. A full<br />
description <strong>of</strong> this interface is given in Chapter 4.4.4. In Figure 38, we can examine<br />
some real accelerator data, received <strong>and</strong> stored using the BLEDP client’s online<br />
interface, from the BLM system inside the PS accelerator facility.<br />
Figure 38 represents a glimpse <strong>of</strong> the <strong>of</strong>fline tool capabilities. A user started by<br />
choosing the stored acquisition session. Afterwards, they picked the desired second<br />
from the picker graph (see Chapter 4.4.4). Inside the picked second, a beam loss<br />
occurred. At the time <strong>of</strong> acquisition, three different detectors were connected in<br />
channels 1, 2 <strong>and</strong> 5 <strong>of</strong> the BLEDP card. The lower graph <strong>of</strong> the <strong>of</strong>fline analysis tool<br />
shows the different decays in the 3 channel traces, when the beam loss occurred.<br />
Each detector behaves differently to the loss <strong>and</strong> thus the observable data decay<br />
differs between the traces.<br />
• <strong>Design</strong>ing the graphical user interface. The application must be user friendly. To<br />
Emmanouil I. Angelogiannopoulos 51
<strong>Design</strong> <strong>and</strong> <strong>Development</strong> <strong>of</strong> a <strong>Diagnostics</strong> <strong>Client</strong> <strong>for</strong> a <strong>Beam</strong> <strong>Loss</strong> Measurement System at CERN<br />
Figure 35: PS Single Channel Acquisition. Hardware Info Tab.<br />
achieve this goal it should group functionalities <strong>of</strong> given category in a separate tab.<br />
It should also allow online real time data viewing <strong>and</strong> optional storage in the <strong>of</strong>fline<br />
files. The online viewing <strong>of</strong> the acquisition <strong>and</strong> status data should be implemented<br />
by use <strong>of</strong> separate tabs. The file structure <strong>for</strong> the <strong>of</strong>fline data should be proposed as<br />
well. The <strong>of</strong>fline data analysis tool should be designed within the application. This<br />
stage <strong>of</strong> development makes use <strong>of</strong> the Java Swing framework. This framework<br />
provides a set <strong>of</strong> powerful <strong>and</strong> flexible components, which synthesize the look <strong>and</strong><br />
feel <strong>of</strong> modern Java GUI applications.<br />
The final outlook <strong>of</strong> the GUI was discussed <strong>and</strong> agreed between the members <strong>of</strong> the<br />
development team <strong>and</strong> <strong>of</strong> course the end users. It groups the different functionalities<br />
<strong>of</strong> the application into separate tabs, i.e. Online, Offline, Status, Hardware Info,<br />
Static <strong>and</strong> Advanced Comm<strong>and</strong>s. A user-friendly environment was achieved with<br />
the use <strong>of</strong> the Java Swing framework with several built-in components, as well as<br />
the JDataViewer[13] <strong>for</strong> the graphical representations.<br />
• High data rate. The application will receive data streamed at a high rate (16 kbps<br />
in single-channel mode <strong>and</strong> 128 kbps in multi-channel mode). To manage online<br />
data display <strong>and</strong> <strong>of</strong>fline data storage in parallel, multi-threading technology must be<br />
Emmanouil I. Angelogiannopoulos 52
<strong>Design</strong> <strong>and</strong> <strong>Development</strong> <strong>of</strong> a <strong>Diagnostics</strong> <strong>Client</strong> <strong>for</strong> a <strong>Beam</strong> <strong>Loss</strong> Measurement System at CERN<br />
Figure 36: PS Multi Channel Acquisition. Online Tab.<br />
engaged. Moreover, data reduction in the online view will be necessary.<br />
The high data rate in both modes from the server’s side was known from the begin-<br />
ning <strong>and</strong> considered as a very important fact during the development phases. A sim-<br />
ple multi-threading process, described in Chapter 4.4.3, was employed to achieve<br />
parallel data socket acquisition, online plotting <strong>and</strong> storing. This parallel manipula-<br />
tion <strong>of</strong> incoming data streams is expected to boost the per<strong>for</strong>mance <strong>of</strong> the client,<br />
especially in multi-core systems. Furthermore, the data reduction in the online view<br />
is necessary <strong>and</strong> vital <strong>for</strong> the per<strong>for</strong>mance. The measurement period field should<br />
be set with a proper value <strong>for</strong> averaging, that won’t cause any stability issues. Prior<br />
to any online session, a recommended minimum value <strong>of</strong> 400μs, ascertained after<br />
many tests, <strong>for</strong> measurement period should be used <strong>for</strong> stable per<strong>for</strong>mance.<br />
5.1.1 Reliability Analysis<br />
The reliability <strong>of</strong> the client application can be assessed by several methods. First <strong>of</strong> all,<br />
the main factor that impacts the system reliability is how well the end product meets the<br />
predefined requirements. This factor is indicated by the quality <strong>of</strong> the design <strong>and</strong> final<br />
implementation <strong>of</strong> the system discussed in Chapter 4. The final characteristics <strong>of</strong> the<br />
BLEDP client are compared against the list <strong>of</strong> the predefined requirements in the previous<br />
section. Summarizing the points presented there, the general conclusion that can be<br />
drawn is that the final system successfully fulfills the list <strong>of</strong> specifications at the required<br />
level. During the BLEDP cards development, the client application proved to be stable<br />
Emmanouil I. Angelogiannopoulos 53
<strong>Design</strong> <strong>and</strong> <strong>Development</strong> <strong>of</strong> a <strong>Diagnostics</strong> <strong>Client</strong> <strong>for</strong> a <strong>Beam</strong> <strong>Loss</strong> Measurement System at CERN<br />
Figure 37: Multi Channel Acquisition. Status Tab.<br />
enough to successfully per<strong>for</strong>m all the dem<strong>and</strong>ed functions.<br />
Another important factor that affects the reliability <strong>and</strong> effectiveness <strong>of</strong> the client application<br />
is its efficiency. This includes the system crash rate <strong>and</strong> unexpected behavior. Many<br />
problems <strong>of</strong> this nature arose during the development process, but the end product, after<br />
all the required testing <strong>and</strong> bug fixing, proved to be stable enough <strong>for</strong> operational usage.<br />
A last important factor that reflects the success <strong>of</strong> the end product is the user satisfaction<br />
rate. This criteria is closely dependent on the system per<strong>for</strong>mance <strong>and</strong> behavior. The<br />
main users <strong>of</strong> this application are the developers <strong>of</strong> the BLEDP FPGAs, members <strong>of</strong> the<br />
BLM team <strong>and</strong> also sometimes the operators’ crew in the Cern Control Center (CCC).<br />
During the development period, the application received many positive responses from its<br />
users, whereby it could be concluded that it satisfies the main function it is employed to<br />
fulfill.<br />
5.1.2 Per<strong>for</strong>mance<br />
It could be very interesting to measure the per<strong>for</strong>mance <strong>of</strong> the application in a typical<br />
computer system, such as the one mentioned <strong>for</strong> the remote connection in the beginning<br />
Emmanouil I. Angelogiannopoulos 54
<strong>Design</strong> <strong>and</strong> <strong>Development</strong> <strong>of</strong> a <strong>Diagnostics</strong> <strong>Client</strong> <strong>for</strong> a <strong>Beam</strong> <strong>Loss</strong> Measurement System at CERN<br />
Figure 38: Multi Channel Offline tool. BLM Detectors Decay.<br />
<strong>of</strong> this chapter. For that purpose, we ran 4 indicative 100 seconds online acquisitions in<br />
single <strong>and</strong> multi-channel modes with storing <strong>and</strong> not storing data to the hard drive. We<br />
used the time comm<strong>and</strong> to measure the per<strong>for</strong>mance. The quoted results per case follow:<br />
☛ Single-Channel 100s, no save.<br />
Comm<strong>and</strong> being timed: ”java -jar BLEDP<strong>Client</strong>.jar”<br />
User time (seconds): 52.12<br />
System time (seconds): 7.83<br />
Percent <strong>of</strong> CPU this job got: 53%<br />
Elapsed (wall clock) time (h:mm:ss or m:ss): 1:52.46<br />
Average shared text size (kbytes): 0<br />
Average unshared data size (kbytes): 0<br />
Average stack size (kbytes): 0<br />
Average total size (kbytes): 0<br />
Maximum resident set size (kbytes): 1364400<br />
Average resident set size (kbytes): 0<br />
Major (requiring I/O) page faults: 0<br />
Minor (reclaiming a frame) page faults: 139854<br />
Voluntary context switches: 1479949<br />
Involuntary context switches: 9336<br />
Swaps: 0<br />
File system inputs: 168<br />
File system outputs: 240<br />
Emmanouil I. Angelogiannopoulos 55
<strong>Design</strong> <strong>and</strong> <strong>Development</strong> <strong>of</strong> a <strong>Diagnostics</strong> <strong>Client</strong> <strong>for</strong> a <strong>Beam</strong> <strong>Loss</strong> Measurement System at CERN<br />
Socket messages sent: 0<br />
Socket messages received: 0<br />
Signals delivered: 0<br />
Page size (bytes): 4096<br />
Exit status: 0<br />
☛ Single-Channel 100s, save.<br />
Comm<strong>and</strong> being timed: ”java -jar BLEDP<strong>Client</strong>.jar”<br />
User time (seconds): 57.44<br />
System time (seconds): 9.06<br />
Percent <strong>of</strong> CPU this job got: 56%<br />
Elapsed (wall clock) time (h:mm:ss or m:ss): 1:56.93<br />
Average shared text size (kbytes): 0<br />
Average unshared data size (kbytes): 0<br />
Average stack size (kbytes): 0<br />
Average total size (kbytes): 0<br />
Maximum resident set size (kbytes): 1414992<br />
Average resident set size (kbytes): 0<br />
Major (requiring I/O) page faults: 0<br />
Minor (reclaiming a frame) page faults: 140258<br />
Voluntary context switches: 1492263<br />
Involuntary context switches: 11040<br />
Swaps: 0<br />
File system inputs: 1104<br />
File system outputs: 393296<br />
Socket messages sent: 0<br />
Socket messages received: 0<br />
Signals delivered: 0<br />
Page size (bytes): 4096<br />
Exit status: 0<br />
☛ Multi-Channel 100s, no save.<br />
Comm<strong>and</strong> being timed: ”java -jar BLEDP<strong>Client</strong>.jar”<br />
User time (seconds): 101.30<br />
System time (seconds): 10.01<br />
Percent <strong>of</strong> CPU this job got: 93%<br />
Elapsed (wall clock) time (h:mm:ss or m:ss): 1:59.04<br />
Average shared text size (kbytes): 0<br />
Emmanouil I. Angelogiannopoulos 56
<strong>Design</strong> <strong>and</strong> <strong>Development</strong> <strong>of</strong> a <strong>Diagnostics</strong> <strong>Client</strong> <strong>for</strong> a <strong>Beam</strong> <strong>Loss</strong> Measurement System at CERN<br />
Average unshared data size (kbytes): 0<br />
Average stack size (kbytes): 0<br />
Average total size (kbytes): 0<br />
Maximum resident set size (kbytes): 2026208<br />
Average resident set size (kbytes): 0<br />
Major (requiring I/O) page faults: 0<br />
Minor (reclaiming a frame) page faults: 174890<br />
Voluntary context switches: 2271883<br />
Involuntary context switches: 22096<br />
Swaps: 0<br />
File system inputs: 0<br />
File system outputs: 208<br />
Socket messages sent: 0<br />
Socket messages received: 0<br />
Signals delivered: 0<br />
Page size (bytes): 4096<br />
Exit status: 0<br />
☛ Multi-Channel 100s, save.<br />
Comm<strong>and</strong> being timed: ”java -jar BLEDP<strong>Client</strong>.jar”<br />
User time (seconds): 133.31<br />
System time (seconds): 14.67<br />
Percent <strong>of</strong> CPU this job got: 124%<br />
Elapsed (wall clock) time (h:mm:ss or m:ss): 1:58.40<br />
Average shared text size (kbytes): 0<br />
Average unshared data size (kbytes): 0<br />
Average stack size (kbytes): 0<br />
Average total size (kbytes): 0<br />
Maximum resident set size (kbytes): 2229312<br />
Average resident set size (kbytes): 0<br />
Major (requiring I/O) page faults: 0<br />
Minor (reclaiming a frame) page faults: 183921<br />
Voluntary context switches: 2478495<br />
Involuntary context switches: 29019<br />
Swaps: 0<br />
File system inputs: 16<br />
File system outputs: 3127672<br />
Socket messages sent: 0<br />
Socket messages received: 0<br />
Emmanouil I. Angelogiannopoulos 57
<strong>Design</strong> <strong>and</strong> <strong>Development</strong> <strong>of</strong> a <strong>Diagnostics</strong> <strong>Client</strong> <strong>for</strong> a <strong>Beam</strong> <strong>Loss</strong> Measurement System at CERN<br />
Signals delivered: 0<br />
Page size (bytes): 4096<br />
Exit status: 0<br />
A lot <strong>of</strong> useful in<strong>for</strong>mation can be drawn after observing the above results. For example,<br />
the CPU usage varies from case to case with multi-channel mode consuming more CPU<br />
time. Furthermore, the file system outputs rises up to a high value when data storage is on.<br />
In general, the final deduction after studying these indicative results is that this application<br />
is stable <strong>and</strong> medium resource consuming <strong>for</strong> an average computer system.<br />
Emmanouil I. Angelogiannopoulos 58
<strong>Design</strong> <strong>and</strong> <strong>Development</strong> <strong>of</strong> a <strong>Diagnostics</strong> <strong>Client</strong> <strong>for</strong> a <strong>Beam</strong> <strong>Loss</strong> Measurement System at CERN<br />
6. CONCLUSION<br />
The BLEDP diagnostics client application was designed <strong>and</strong> developed as a non-commercial<br />
CERN internal tool to satisfy the needs <strong>of</strong> the <strong>Beam</strong> <strong>Loss</strong> Monitoring team. The devel-<br />
opment <strong>of</strong> the system was fully implemented inside the S<strong>of</strong>tware section in collaboration<br />
with the BLM team, which set certain specific characteristics to the working process. It is<br />
very important the fact that in the confined working environment the developer <strong>and</strong> the end<br />
users <strong>of</strong> the system constantly interact with each other, which speeds up the development<br />
process <strong>and</strong> provides the necessary feedback instantly.<br />
As <strong>for</strong> the technical details, it is very important to mention that the concept <strong>of</strong> develop-<br />
ing the diagnostics client in the first place, is based on the need to debug <strong>and</strong> verify the<br />
final hardware, as well as further develop the analogue circuits <strong>and</strong> the final firmware.<br />
Hence, this test system implementation with a direct Ethernet communication facilitated<br />
a st<strong>and</strong>alone implementation, be<strong>for</strong>e the final system, using this client. This GUI allowed<br />
the development <strong>of</strong> both firmware <strong>and</strong> hardware along with the detailed analysis <strong>of</strong> the<br />
Real-Time algorithm implemented inside the FPGA.<br />
The future work regarding the whole BLM <strong>for</strong> the Injectors project, includes developing<br />
s<strong>of</strong>tware <strong>for</strong> controlling the new BLM electronics after installation in the injectors, i.e. us-<br />
age <strong>of</strong> processing electronics <strong>and</strong> FESA servers to provide data to clients to deal with set-<br />
tings <strong>and</strong> interlocks (see Chapter 3). This is going to be the final system implementation<br />
following the st<strong>and</strong>ard way at CERN, after the full development <strong>and</strong> validation <strong>of</strong> the new<br />
BLM electronics. Our proposed test system implementation with the direct-communication<br />
diagnostics client, detours the a<strong>for</strong>ementioned procedure <strong>and</strong> allows the development <strong>and</strong><br />
validation <strong>of</strong> the hardware, be<strong>for</strong>e the final operational usage. Eventually, it can serve as<br />
a future st<strong>and</strong>alone diagnostics s<strong>of</strong>tware implementation <strong>for</strong> these instruments.<br />
Emmanouil I. Angelogiannopoulos 59
<strong>Design</strong> <strong>and</strong> <strong>Development</strong> <strong>of</strong> a <strong>Diagnostics</strong> <strong>Client</strong> <strong>for</strong> a <strong>Beam</strong> <strong>Loss</strong> Measurement System at CERN<br />
Below is a sample <strong>of</strong> a table <strong>of</strong> terminology.<br />
TABLE OF TERMINOLOGY<br />
επιταχυντής accelerator<br />
κλάσση class<br />
εντολή comm<strong>and</strong><br />
γραφικό περιβάλλον graphical interface<br />
πελάτης client<br />
ενσωματωμένος διακομιστής embedded server<br />
νήμα thread<br />
επικοινωνία communication<br />
εκροή σωματιδίων beam loss<br />
Emmanouil I. Angelogiannopoulos 60
<strong>Design</strong> <strong>and</strong> <strong>Development</strong> <strong>of</strong> a <strong>Diagnostics</strong> <strong>Client</strong> <strong>for</strong> a <strong>Beam</strong> <strong>Loss</strong> Measurement System at CERN<br />
ABBREVIATIONS AND ACRONYMS<br />
Below is a sample <strong>of</strong> abbreviations <strong>and</strong> acronyms .<br />
CERN European Organization <strong>for</strong> Nuclear Re-<br />
search<br />
LHC Large Hadron Collider<br />
FPGA Field Programmable Gate Array<br />
BLEAC <strong>Beam</strong> <strong>Loss</strong> Electronic Acquisition Crate<br />
BLEDP <strong>Beam</strong> <strong>Loss</strong> Electronic Dual Polarity<br />
GUI Graphical User Interface<br />
TCP Transmission Control Protocol<br />
UDP User Datagram Protocol<br />
MAC address media access control address<br />
JDVE JDataViewer<br />
CSV Comma-seperated values<br />
SFP Small <strong>for</strong>m-factor pluggable transceiver<br />
DADC Direct Analogue Digital Conversion<br />
FDFC Fully Differential Frequency Converter<br />
FESA Front End S<strong>of</strong>tware Architecture<br />
Emmanouil I. Angelogiannopoulos 61
<strong>Design</strong> <strong>and</strong> <strong>Development</strong> <strong>of</strong> a <strong>Diagnostics</strong> <strong>Client</strong> <strong>for</strong> a <strong>Beam</strong> <strong>Loss</strong> Measurement System at CERN<br />
REFERENCES<br />
[1] CERN in a nutshell, Available: http://public.web.cern.ch/public/en/About/About-en.html.<br />
[2] CERN’s Structure, Available: http://public.web.cern.ch/public/en/About/Structure-en.html.<br />
[3] BI-SW Section page, Availabe: http://project-beam-instr-sw.web.cern.ch/project-beam-instr-sw/<br />
Welcome.php.<br />
[4] BI-BL Section page, Availabe: http://sl-div-bi-pb.web.cern.ch/sl-div-bi-pb/.<br />
[5] CERN’s Accelerator Complex, Availabe: http://public.web.cern.ch/public/en/research/<br />
AccelComplex-en.html.<br />
[6] LHC the guide, Availabe: http://cdsweb.cern.ch/record/1092437/files/<br />
CERN-Brochure-2008-001-Eng.pdf.<br />
[7] C. Zamantzas, ”BLM <strong>for</strong> the Injectors Project, Linac4 <strong>and</strong> PSB”.<br />
[8] Linac4 Project, Availabe: http://linac4-project.web.cern.ch/linac4-project/.<br />
[9] Kay Wittenburg, ”<strong>Beam</strong> <strong>Loss</strong> Monitoring <strong>and</strong> Control”, Proceedings <strong>of</strong> EPAC 2002, Paris, France.<br />
[10] M. Kwiatkowski, M. Alsdorf, E. Angelogiannopoulos, B. Dehning, S. Jackson, W. Vigano, C. Za-<br />
mantzas, “DEVELOPMENT OF A BEAM LOSS MEASUREMENT SYSTEM WITH GIGABIT ETH-<br />
ERNET READOUT AT CERN”, Tsukuba, Japan, Oct 1-4, 2012.<br />
[11] Herbert Schildt, “Java the Complete Reference 8th Edition”, Oracle Press.<br />
[12] Oracle, http://docs.oracle.com/javase/tutorial, November 2012.<br />
[13] CERN, JDataViewer Charting Library, https://espace.cern.ch/be-dep/CO/ICALEPCS%202009/<br />
1398%20%20JDataViewer%20-%20Java-based%20Charting%20Library/THP093.pdf<br />
[14] CERN, Christos Zamantzas, Marcel Alsdorf, William Vigano, “NOTES ON THE BEAM LOSS ACQUI-<br />
SITION CRATE”<br />
[15] CERN, Christos Zamantzas, “BLM FOR THE INJECTORS PROJECT”, Linac4 Coordination Com-<br />
mittee, May 2012.<br />
[16] CERN, Maciej Kwiatkowski, “BLEDP CARD COMMUNICATION PROTOCOL OVER GIGABIT ETH-<br />
ERNET”, May 2012.<br />
[17] W. Vigano, B. Dehning, E. Effinger, G. G. Venturini, C. Zamantzas, “COMPARISON OF THREE DIF-<br />
FERENT CONCEPTS OF HIGH DYNAMIC RANGE AND DEPENDABILITY OPTIMISED CURRENT<br />
MEASUREMENT DIGITISERS FOR BEAM LOSS SYSTEMS”, Tsukuba, Japan, Oct 1-4, 2012.<br />
[18] M. Kwiatkowski, C. Zamantzas, M. Alsdorf, B. Dehning, W. Vigano, “A REAL-TIME FPGA BASED<br />
ALGORITHM FOR THE COMBINATION OF BEAM LOSS ACQUISITION METHODS USED FOR<br />
MEASUREMENT DYNAMIC RANGE EXPANSION”, Tsukuba, Japan, Oct 1-4, 2012.<br />
[19] M. Kwiatkowski, C. Zamantzas, M. Alsdorf, B. Dehning, W. Vigano, S. Jackson, “SYSTEM ARCHI-<br />
TECTURE FOR MEASURING AND MONITORING BEAM LOSSES IN THE INJECTOR COMPLEX<br />
AT CERN”, Tsukuba, Japan, Oct 1-4, 2012.<br />
[20] Alex<strong>and</strong>er Schwinn, Solveigh Matthies, Dorothea Pfeiffer(GSI, Darmstadt) , Michel Arruat, Le<strong>and</strong>ro<br />
Fern<strong>and</strong>ez, Frank Locci, David Gomez Saavedra (CERN, Geneva), “FESA 3, THE NEW FRONT-END<br />
SOFTWARE FRAMEWORK AT CERN AND THE FAIR FACILITY”, Proceedings <strong>of</strong> PCaPAC 2010,<br />
Saskatoon, Saskatchewan.<br />
[21] AFCT-57J5APZ Data Sheet, http://www.avagotech.com/docs/AV02-0680EN<br />
Emmanouil I. Angelogiannopoulos 62