2007 Annual Report - Sun Life Financial
2007 Annual Report - Sun Life Financial
2007 Annual Report - Sun Life Financial

Create successful ePaper yourself
Turn your PDF publications into a flip-book with our unique Google optimized e-Paper software.
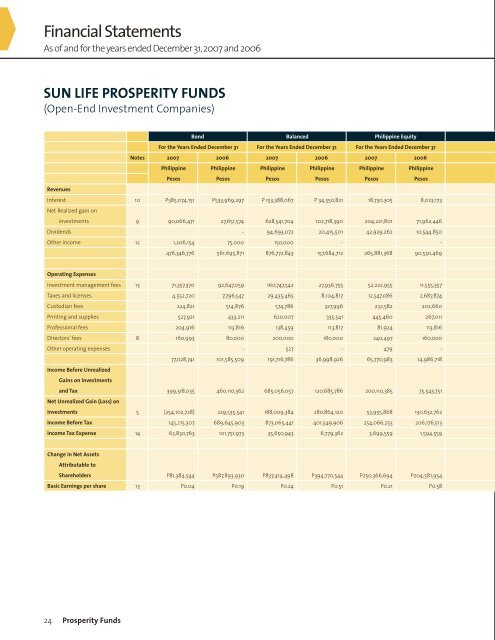
<strong>Financial</strong> Statements<br />
As of and for the years ended December 31, <strong>2007</strong> and 2006<br />
SUN LIFE PROSPERIty FUNDS<br />
(Open-End Investment Companies)<br />
Revenues<br />
24 Prosperity Funds<br />
Bond Balanced Philippine Equity<br />
For the years Ended December 31 For the years Ended December 31 For the years Ended December 31<br />
Notes <strong>2007</strong> 2006 <strong>2007</strong> 2006 <strong>2007</strong> 2006<br />
Philippine<br />
Pesos<br />
Philippine<br />
Pesos<br />
Philippine<br />
Pesos<br />
Philippine<br />
Pesos<br />
Philippine<br />
Pesos<br />
Philippine<br />
Interest 10 P385,074,151 P533,969,297 P 153,388,067 P 34,550,821 18,730,305 8,023,173<br />
Net Realized gain on<br />
investments 9 90,066,471 27,651,574 628,541,704<br />
Pesos<br />
102,718,390 204,221,801 71,962,446<br />
Dividends - 94,693,072 20,415,501 42,929,262 10,544,850<br />
Other income 12 1,206,154 75,000 150,000 - -<br />
Operating Expenses<br />
476,346,776 561,695,871 876,772,843 157,684,712 265,881,368 90,530,469<br />
Investment management fees 13 71,357,370 92,647,059 160,747,542 27,936,755 52,222,955 11,555,357<br />
Taxes and licenses 4,552,720 7,796,547 29,435,465 8,104,817 12,547,086 2,687,874<br />
Custodian fees 224,821 514,876 574,786 327,996 232,582 202,660<br />
Printing and supplies 527,921 433,211 620,007 335,541 445,460 267,011<br />
Professional fees 204,916 113,816 138,459 113,817 81,924 113,816<br />
Directors' fees 8 160,993 80,000 200,000 180,000 240,497 160,000<br />
Other operating expenses - 527 - 479 -<br />
Income Before Unrealized<br />
77,028,741 101,585,509 191,716,786 36,998,926 65,770,983 14,986,718<br />
Gains on Investments<br />
and tax<br />
Net Unrealized Gain (Loss) on<br />
399,318,035 460,110,362 685,056,057 120,685,786 200,110,385 75,543,751<br />
Investments 5 (254,102,728) 229,535,541 188,009,384 280,864,120 53,955,868 130,632,762<br />
Income Before tax 145,215,307 689,645,903 873,065,441 401,549,906 254,066,253 206,176,513<br />
Income tax Expense 14 63,830,763 101,751,973 35,650,943 6,779,362 3,699,559 1,594,559<br />
Change in Net Assets<br />
Attributable to<br />
Shareholders P81,384,544 P587,893,930 P837,414,498 P394,770,544 P250,366,694 P204,581,954<br />
Basic Earnings per share 13 P0.04 P0.19 P0.24 P0.51 P0.21 P0.58