Building Web Applications with SVG - Cdn.oreilly.com
Building Web Applications with SVG - Cdn.oreilly.com
Building Web Applications with SVG - Cdn.oreilly.com

Create successful ePaper yourself
Turn your PDF publications into a flip-book with our unique Google optimized e-Paper software.
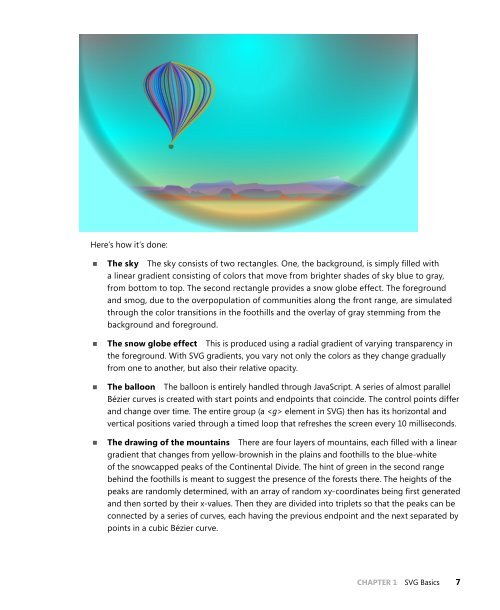
Here’s how it’s done:<br />
■■ The sky The sky consists of two rectangles. One, the background, is simply filled <strong>with</strong><br />
a linear gradient consisting of colors that move from brighter shades of sky blue to gray,<br />
from bottom to top. The second rectangle provides a snow globe effect. The foreground<br />
and smog, due to the overpopulation of <strong>com</strong>munities along the front range, are simulated<br />
through the color transitions in the foothills and the overlay of gray stemming from the<br />
background and foreground.<br />
■■ The snow globe effect This is produced using a radial gradient of varying transparency in<br />
the foreground. With <strong>SVG</strong> gradients, you vary not only the colors as they change gradually<br />
from one to another, but also their relative opacity.<br />
■■ The balloon The balloon is entirely handled through JavaScript. A series of almost parallel<br />
Bézier curves is created <strong>with</strong> start points and endpoints that coincide. The control points differ<br />
and change over time. The entire group (a element in <strong>SVG</strong>) then has its horizontal and<br />
vertical positions varied through a timed loop that refreshes the screen every 10 milliseconds.<br />
■<br />
■ The drawing of the mountains There are four layers of mountains, each filled <strong>with</strong> a linear<br />
gradient that changes from yellow-brownish in the plains and foothills to the blue-white<br />
of the snowcapped peaks of the Continental Divide. The hint of green in the second range<br />
behind the foothills is meant to suggest the presence of the forests there. The heights of the<br />
peaks are randomly determined, <strong>with</strong> an array of random xy-coordinates being first generated<br />
and then sorted by their x-values. Then they are divided into triplets so that the peaks can be<br />
connected by a series of curves, each having the previous endpoint and the next separated by<br />
points in a cubic Bézier curve.<br />
CHAPTER 1 <strong>SVG</strong> Basics 7