Primordial Black Holes and Cosmological Phase Transitions Report ...
Primordial Black Holes and Cosmological Phase Transitions Report ...
Primordial Black Holes and Cosmological Phase Transitions Report ...
Create successful ePaper yourself
Turn your PDF publications into a flip-book with our unique Google optimized e-Paper software.
PBHs <strong>and</strong> <strong>Cosmological</strong> <strong>Phase</strong> <strong>Transitions</strong> 183<br />
log 10Βtk<br />
-15<br />
-15.5<br />
-16<br />
-16.5<br />
-17<br />
-17.5<br />
n1.40, log 10t1s8<br />
-10.5 -10 -9.5 -9 -8.5 -8<br />
log10 tk<br />
<br />
1 s <br />
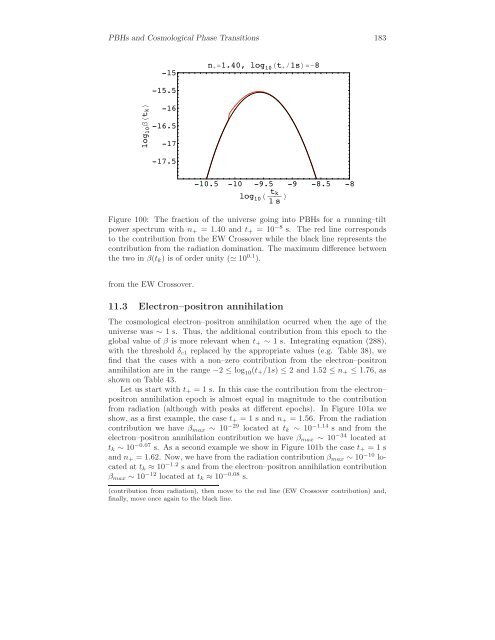
Figure 100: The fraction of the universe going into PBHs for a running–tilt<br />
power spectrum with n+ =1.40 <strong>and</strong> t+ = 10 −8 s. The red line corresponds<br />
to the contribution from the EW Crossover while the black line represents the<br />
contribution from the radiation domination. The maximum difference between<br />
the two in β(tk) is of order unity ( 10 0.1 ).<br />
from the EW Crossover.<br />
11.3 Electron–positron annihilation<br />
The cosmological electron–positron annihilation ocurred when the age of the<br />
universe was ∼ 1 s. Thus, the additional contribution from this epoch to the<br />
global value of β is more relevant when t+ ∼ 1 s. Integrating equation (288),<br />
with the threshold δc1 replaced by the appropriate values (e.g. Table 38), we<br />
find that the cases with a non–zero contribution from the electron–positron<br />
annihilation are in the range −2 ≤ log 10(t+/1s) ≤ 2 <strong>and</strong> 1.52 ≤ n+ ≤ 1.76, as<br />
shown on Table 43.<br />
Let us start with t+ = 1 s. In this case the contribution from the electron–<br />
positron annihilation epoch is almost equal in magnitude to the contribution<br />
from radiation (although with peaks at different epochs). In Figure 101a we<br />
show, as a first example, the case t+ = 1 s <strong>and</strong> n+ =1.56. From the radiation<br />
contribution we have βmax ∼ 10 −29 located at tk ∼ 10 −1.14 s <strong>and</strong> from the<br />
electron–positron annihilation contribution we have βmax ∼ 10 −34 located at<br />
tk ∼ 10 −0.07 s. As a second example we show in Figure 101b the case t+ = 1 s<br />
<strong>and</strong> n+ =1.62. Now, we have from the radiation contribution βmax ∼ 10 −10 located<br />
at tk ≈ 10 −1.2 s <strong>and</strong> from the electron–positron annihilation contribution<br />
βmax ∼ 10 −12 located at tk ≈ 10 −0.08 s.<br />
(contribution from radiation), then move to the red line (EW Crossover contribution) <strong>and</strong>,<br />
finally, move once again to the black line.


