Primordial Black Holes and Cosmological Phase Transitions Report ...
Primordial Black Holes and Cosmological Phase Transitions Report ... Primordial Black Holes and Cosmological Phase Transitions Report ...
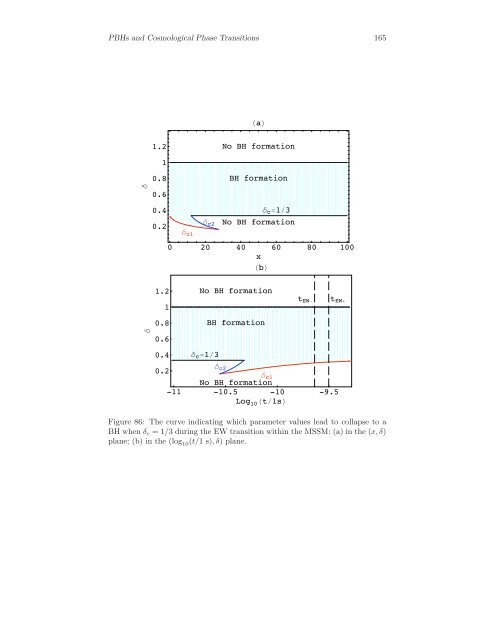
PBHs and Cosmological Phase Transitions 164 Table 36: The evolution of δc1 as a function of time for a EW Crossover with ∆T =0.013Tc when δc =1/3. log 10(tk/1 s) δc1 log 10(tk/1 s) δc1 -10.2 0.33333 -10.1 0.33205 -10.0 0.33221 -9.9 0.33254 -9.8 0.33277 -9.7 0.33293 -9.6 0.33305 -9.5 0.33313 -9.4 0.33319 -9.3 0.33323 -9.2 0.33326 -9.1 0.33328 -9.0 0.33330 -8.9 0.33331 -8.8 0.33332 -8.7 0.33332 -8.6 0.33332 -8.5 0.33333 fraction of the overdense region spent in the dust–like phase, will be given, once again, by expressions (254) to (258), in accordance with the class of fluctuation we are dealing with. For the QCD Bag Model case we have studied with some detail fluctuations crossing the horizon before the mixed phase (Section 7.1.1), during the mixed phase (Section 7.1.2) and after the mixed phase (Section 7.1.3). Here, in the EW Bag Model case, we just point out that one obtains similar results. For example, one should obtain situations similar to the ones represented on Figure 51 (naturally with different values for x, δc1, δc2,...). On Figure 86a we show the region in the (x, δ) plane for which BH formation is allowed in the case δc =1/3. Without the phase transition this would be a straight horizontal line at δ =1/3. On Figure 86b we show the same situation but now represented on the (log 10(t),δ). We have represented also, for reference, the values tEW− and tEW+. On Figure 87 we show the region in the (log 10 (t),δ) plane for which BH formation is allowed in the case δc =0.7. Without the phase transition this would be a straight horizontal line at δ =0.7. On Table 37 we present the new values for the threshold of PBH formation during a EW first–order phase transition within the MSSM according to the Bag Model for the case δc =1/3.
PBHs and Cosmological Phase Transitions 165 ∆ ∆ 1.2 1 0.8 0.6 0.4 0.2 1.2 0.8 0.6 0.4 ∆c1 ∆c2 a No BH formation BH formation ∆c13 No BH formation 0 20 40 60 80 100 x b 1 No BH formation ∆c13 BH formation ∆c2 tEW tEW 0.2 ∆c1 No BH formation -11 -10.5 -10 -9.5 Log10t1s Figure 86: The curve indicating which parameter values lead to collapse to a BH when δc =1/3 during the EW transition within the MSSM: (a) in the (x, δ) plane; (b) in the (log 10(t/1 s),δ) plane.
- Page 131 and 132: PBHs and Cosmological Phase Transit
- Page 133 and 134: PBHs and Cosmological Phase Transit
- Page 135 and 136: PBHs and Cosmological Phase Transit
- Page 137 and 138: PBHs and Cosmological Phase Transit
- Page 139 and 140: PBHs and Cosmological Phase Transit
- Page 141 and 142: PBHs and Cosmological Phase Transit
- Page 143 and 144: PBHs and Cosmological Phase Transit
- Page 145 and 146: PBHs and Cosmological Phase Transit
- Page 147 and 148: PBHs and Cosmological Phase Transit
- Page 149 and 150: PBHs and Cosmological Phase Transit
- Page 151 and 152: PBHs and Cosmological Phase Transit
- Page 153 and 154: PBHs and Cosmological Phase Transit
- Page 155 and 156: PBHs and Cosmological Phase Transit
- Page 157 and 158: PBHs and Cosmological Phase Transit
- Page 159 and 160: PBHs and Cosmological Phase Transit
- Page 161 and 162: PBHs and Cosmological Phase Transit
- Page 163 and 164: PBHs and Cosmological Phase Transit
- Page 165 and 166: PBHs and Cosmological Phase Transit
- Page 167 and 168: PBHs and Cosmological Phase Transit
- Page 169 and 170: PBHs and Cosmological Phase Transit
- Page 171 and 172: PBHs and Cosmological Phase Transit
- Page 173 and 174: PBHs and Cosmological Phase Transit
- Page 175 and 176: PBHs and Cosmological Phase Transit
- Page 177 and 178: PBHs and Cosmological Phase Transit
- Page 179 and 180: PBHs and Cosmological Phase Transit
- Page 181: PBHs and Cosmological Phase Transit
- Page 185 and 186: PBHs and Cosmological Phase Transit
- Page 187 and 188: PBHs and Cosmological Phase Transit
- Page 189 and 190: PBHs and Cosmological Phase Transit
- Page 191 and 192: PBHs and Cosmological Phase Transit
- Page 193 and 194: PBHs and Cosmological Phase Transit
- Page 195 and 196: PBHs and Cosmological Phase Transit
- Page 197 and 198: PBHs and Cosmological Phase Transit
- Page 199 and 200: PBHs and Cosmological Phase Transit
- Page 201 and 202: PBHs and Cosmological Phase Transit
- Page 203 and 204: PBHs and Cosmological Phase Transit
- Page 205 and 206: PBHs and Cosmological Phase Transit
- Page 207 and 208: PBHs and Cosmological Phase Transit
- Page 209 and 210: PBHs and Cosmological Phase Transit
- Page 211 and 212: PBHs and Cosmological Phase Transit
- Page 213 and 214: PBHs and Cosmological Phase Transit
- Page 215 and 216: PBHs and Cosmological Phase Transit
- Page 217 and 218: PBHs and Cosmological Phase Transit
- Page 219 and 220: PBHs and Cosmological Phase Transit
- Page 221 and 222: Table 49 (continued). PBHs and Cosm
- Page 223 and 224: Table 49 (continued). Radiation EW
- Page 225 and 226: PBHs and Cosmological Phase Transit
- Page 227 and 228: PBHs and Cosmological Phase Transit
- Page 229 and 230: PBHs and Cosmological Phase Transit
- Page 231 and 232: PBHs and Cosmological Phase Transit
PBHs <strong>and</strong> <strong>Cosmological</strong> <strong>Phase</strong> <strong>Transitions</strong> 165<br />
∆<br />
∆<br />
1.2<br />
1<br />
0.8<br />
0.6<br />
0.4<br />
0.2<br />
1.2<br />
0.8<br />
0.6<br />
0.4<br />
∆c1<br />
∆c2<br />
a<br />
No BH formation<br />
BH formation<br />
∆c13<br />
No BH formation<br />
0 20 40 60 80 100<br />
x<br />
b<br />
1<br />
No BH formation<br />
∆c13<br />
BH formation<br />
∆c2<br />
tEW<br />
tEW<br />
0.2<br />
∆c1<br />
No BH formation<br />
-11 -10.5 -10 -9.5<br />
Log10t1s Figure 86: The curve indicating which parameter values lead to collapse to a<br />
BH when δc =1/3 during the EW transition within the MSSM: (a) in the (x, δ)<br />
plane; (b) in the (log 10(t/1 s),δ) plane.


