Primordial Black Holes and Cosmological Phase Transitions Report ...
Primordial Black Holes and Cosmological Phase Transitions Report ...
Primordial Black Holes and Cosmological Phase Transitions Report ...

Create successful ePaper yourself
Turn your PDF publications into a flip-book with our unique Google optimized e-Paper software.
PBHs <strong>and</strong> <strong>Cosmological</strong> <strong>Phase</strong> <strong>Transitions</strong> 155<br />
∆<br />
1.4<br />
1.2<br />
1<br />
0.8<br />
0.6<br />
0.4<br />
0.2<br />
0<br />
F<br />
E<br />
a<br />
0 0.2 0.4 0.6 0.8 1 1.2 1.4<br />
∆<br />
C<br />
∆1<br />
∆<br />
1.4<br />
1.2<br />
1<br />
0.8<br />
0.6<br />
0.4<br />
0.2<br />
0<br />
b<br />
0 0.2 0.4 0.6 0.8 1 1.2 1.4<br />
∆<br />
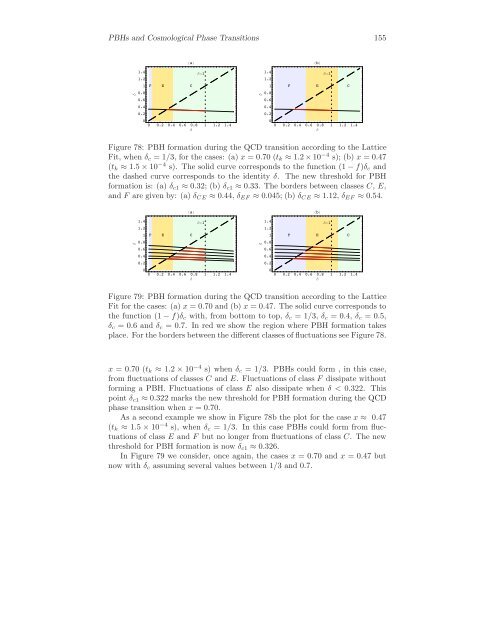
Figure 78: PBH formation during the QCD transition according to the Lattice<br />
Fit, when δc =1/3, for the cases: (a) x =0.70 (tk ≈ 1.2 × 10 −4 s); (b) x =0.47<br />
(tk ≈ 1.5 × 10 −4 s). The solid curve corresponds to the function (1 − f)δc <strong>and</strong><br />
the dashed curve corresponds to the identity δ. The new threshold for PBH<br />
formation is: (a) δc1 ≈ 0.32; (b) δc1 ≈ 0.33. The borders between classes C, E,<br />
<strong>and</strong> F are given by: (a) δCE ≈ 0.44, δEF ≈ 0.045; (b) δCE ≈ 1.12, δEF ≈ 0.54.<br />
∆<br />
1.4<br />
1.2<br />
1<br />
0.8<br />
0.6<br />
0.4<br />
0.2<br />
0<br />
F<br />
E<br />
a<br />
0 0.2 0.4 0.6 0.8 1 1.2 1.4<br />
∆<br />
C<br />
∆1<br />
F<br />
E<br />
∆1<br />
0 0.2 0.4 0.6 0.8 1 1.2 1.4<br />
∆<br />
Figure 79: PBH formation during the QCD transition according to the Lattice<br />
Fit for the cases: (a) x =0.70 <strong>and</strong> (b) x =0.47. The solid curve corresponds to<br />
the function (1 − f)δc with, from bottom to top, δc =1/3, δc =0.4, δc =0.5,<br />
δc =0.6 <strong>and</strong> δc =0.7. In red we show the region where PBH formation takes<br />
place. For the borders between the different classes of fluctuations see Figure 78.<br />
x =0.70 (tk ≈ 1.2 × 10 −4 s) when δc =1/3. PBHs could form , in this case,<br />
from fluctuations of classes C <strong>and</strong> E. Fluctuations of class F dissipate without<br />
forming a PBH. Fluctuations of class E also dissipate when δ< 0.322. This<br />
point δc1 ≈ 0.322 marks the new threshold for PBH formation during the QCD<br />
phase transition when x =0.70.<br />
As a second example we show in Figure 78b the plot for the case x ≈ 0.47<br />
(tk ≈ 1.5 × 10 −4 s), when δc =1/3. In this case PBHs could form from fluctuations<br />
of class E <strong>and</strong> F but no longer from fluctuations of class C. The new<br />
threshold for PBH formation is now δc1 ≈ 0.326.<br />
In Figure 79 we consider, once again, the cases x =0.70 <strong>and</strong> x =0.47 but<br />
now with δc assuming several values between 1/3 <strong>and</strong> 0.7.<br />
∆<br />
1.4<br />
1.2<br />
1<br />
0.8<br />
0.6<br />
0.4<br />
0.2<br />
0<br />
F<br />
b<br />
E<br />
∆1<br />
C<br />
C