Primordial Black Holes and Cosmological Phase Transitions Report ...
Primordial Black Holes and Cosmological Phase Transitions Report ...
Primordial Black Holes and Cosmological Phase Transitions Report ...

Create successful ePaper yourself
Turn your PDF publications into a flip-book with our unique Google optimized e-Paper software.
PBHs <strong>and</strong> <strong>Cosmological</strong> <strong>Phase</strong> <strong>Transitions</strong> 153<br />
∆<br />
1.4<br />
1.2<br />
1<br />
0.8<br />
0.6<br />
0.4<br />
0.2<br />
0<br />
C<br />
B<br />
A<br />
a<br />
∆1<br />
0 0.2 0.4 0.6 0.8 1 1.2 1.4<br />
∆<br />
∆<br />
1.4<br />
1.2<br />
1<br />
0.8<br />
0.6<br />
0.4<br />
0.2<br />
0<br />
C B<br />
A<br />
b<br />
∆1<br />
0 0.2 0.4 0.6 0.8 1 1.2 1.4<br />
∆<br />
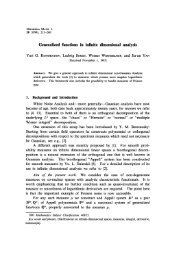
Figure 74: PBH formation during the QCD transition according to the Lattice<br />
Fit for the cases: (a) x = 25, <strong>and</strong> (b) x = 50; with δc = 1/3. The solid<br />
curve corresponds to the function (1 − f)δc <strong>and</strong> the dashed curve corresponds<br />
to the identity δ. The borders between the different classes are given by: (a)<br />
δAB ≈ 0.19, δBC ≈ 0.16; (b) δAB ≈ 0.20, δBC ≈ 0.13. Collapse to a BH occurs<br />
for values of δ for which the dashed line is above the solid curve (while δ< 1).<br />
In the case x = 25 we have three intersections points: δc1 ≈ 0.15, δc2 ≈ 0.17<br />
<strong>and</strong> δc =0.25. This means that, in this case, there are two regions for PBH<br />
formation: 0.15 ≤ δ ≤ 0.17 <strong>and</strong> 0.25 ≤ δ< 1. In the case x = 50 PBHs form if<br />
0.27 ≤ δ< 1.<br />
∆<br />
∆<br />
1.4<br />
1.2<br />
1<br />
0.8<br />
0.6<br />
0.4<br />
0.2<br />
0<br />
1.4<br />
1.2<br />
1<br />
0.8<br />
0.6<br />
0.4<br />
0.2<br />
0<br />
C<br />
a<br />
∆1<br />
0 0.2 0.4 0.6 0.8 1 1.2 1.4<br />
∆<br />
C<br />
B<br />
A<br />
c<br />
∆1<br />
0 0.2 0.4 0.6 0.8 1 1.2 1.4<br />
∆<br />
A<br />
∆<br />
∆<br />
1.4<br />
1.2<br />
1<br />
0.8<br />
0.6<br />
0.4<br />
0.2<br />
0<br />
1.4<br />
1.2<br />
1<br />
0.8<br />
0.6<br />
0.4<br />
0.2<br />
0<br />
C<br />
B<br />
b<br />
A<br />
∆1<br />
0 0.2 0.4 0.6 0.8 1 1.2 1.4<br />
∆<br />
C B<br />
A<br />
d<br />
∆1<br />
0 0.2 0.4 0.6 0.8 1 1.2 1.4<br />
∆<br />
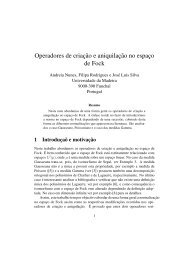
Figure 75: PBH formation during the QCD transition according to the Lattice<br />
Fit for the cases: (a) x = 2, (b) x = 15, (c) x = 25, <strong>and</strong> (d) x = 50. The solid<br />
curve corresponds to the function (1 − f)δc with, from bottom to top, δc =1/3,<br />
δc =0.4, δc =0.5, δc =0.6 <strong>and</strong> δc =0.7. In red we show the region where<br />
PBH formation takes place. The borders between the different classes (which<br />
do not depend on the value of δc) are given by: (a) δAC =0.95; (b) δAB ≈ 0.25,<br />
δBC ≈ 0.21; (c) δAB ≈ 0.19, δBC ≈ 0.16; <strong>and</strong> (d) δAB ≈ 0.14, δBC ≈ 0.10.