Primordial Black Holes and Cosmological Phase Transitions Report ...
Primordial Black Holes and Cosmological Phase Transitions Report ...
Primordial Black Holes and Cosmological Phase Transitions Report ...

Create successful ePaper yourself
Turn your PDF publications into a flip-book with our unique Google optimized e-Paper software.
PBHs <strong>and</strong> <strong>Cosmological</strong> <strong>Phase</strong> <strong>Transitions</strong> 125<br />
∆<br />
1.4<br />
1.2<br />
1<br />
0.8<br />
0.6<br />
0.4<br />
0.2<br />
0<br />
C<br />
0 0.2 0.4 0.6 0.8 1 1.2 1.4<br />
∆<br />
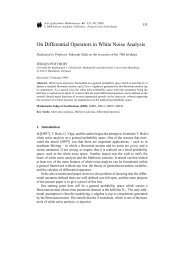
Figure 50: PBH formation during the QCD transition according to the Bag<br />
Model for the case x = 2 <strong>and</strong> δc =1/3. The solid curve corresponds to the<br />
function (1 − f)δc <strong>and</strong> the dashed curve to the identity δ. The pink region<br />
corresponds to fluctuations of class B (see text). To the left of this region we<br />
have fluctuations of class C (green) <strong>and</strong> to the right fluctuations of class A<br />
(yellow). The borders between the different classes are given by δAB = 1 <strong>and</strong><br />
δBC ≈ 0.58. Collapse to a BH occurs for values of δ for which the dashed line is<br />
above the solid curve (while δ< 1). The intersection point at δ ≈ 0.25 marks a<br />
new threshold δc1 for PBH formation (adapted from Cardall & Fuller, 1998).<br />
overdensity will be of class C if 0 < δ < 0.58, of class B if 0.58 < δ < 1 <strong>and</strong> of<br />
class A if δ> 1.<br />
In order to identify the values of δ for which collapse to a BH occurs (when<br />
x = 2 <strong>and</strong> δc =1/3), we plot in Figure 50 both (1−f)δc <strong>and</strong> δ itself as functions<br />
of δ. Notice that one should use the function f appropriate to each class (i.e.<br />
fA – equation 254; fB – equation 255; fC – equation 256). We can, then, have<br />
PBHs formed from fluctuations of classes B <strong>and</strong> C only, since fluctuations of<br />
class A would lead to the formation of a separate Universe (since for them we<br />
always have δ> 1)–Section 6.1.<br />
Fluctuations of class C with δ< 0.25 dissipate before forming a PBH. This<br />
point δc1 ≈ 0.25 marks a new <strong>and</strong> lower threshold for PBH formation during<br />
the QCD phase transition when x = 2.<br />
In Figure 51 we plot the cases: (a) x = 15, (b) x = 30, <strong>and</strong> (c) x = 90 with<br />
δc =1/3 for all the three cases. In the case x = 15 there are two regions for<br />
which PBH formation is allowed: i) a region for δ ≥ 1/3, which corresponds<br />
to PBH formation from fluctuations of class A during the radiation–dominated<br />
Universe; ii) a region between δc1 ≈ 0.15 <strong>and</strong> δc2 ≈ 0.27 corresponding to the<br />
formation of PBHs from fluctuations of classes B <strong>and</strong> C. The gap between<br />
δ =0.27 <strong>and</strong> δ =1/3 corresponds to: i) fluctuations of class A which dissipate<br />
because they have δ< 1/3; ii) fluctuations of class B which dissipate because<br />
they do not spend enough time on the dust–like phase, allowing collapse to<br />
begin.<br />
The case x = 30 is similar to the case x = 15. Notice, however, that now the<br />
B<br />
∆1<br />
A