the effect of the particle size distribution on non-newtonian turbulent ...
the effect of the particle size distribution on non-newtonian turbulent ...
the effect of the particle size distribution on non-newtonian turbulent ...
You also want an ePaper? Increase the reach of your titles
YUMPU automatically turns print PDFs into web optimized ePapers that Google loves.
Chapter 5 Discussi<strong>on</strong> Page 5.9<br />
5.7 THEORETICAL MODELS<br />
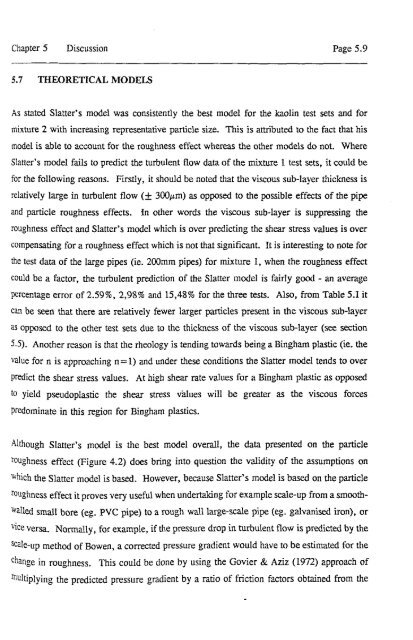
As stated Slatter's model was c<strong>on</strong>sistently <str<strong>on</strong>g>the</str<strong>on</strong>g> best model for <str<strong>on</strong>g>the</str<strong>on</strong>g> kaolin test sets and for<br />
mixture 2 with increasing representative <str<strong>on</strong>g>particle</str<strong>on</strong>g> <str<strong>on</strong>g>size</str<strong>on</strong>g>. This is attributed to <str<strong>on</strong>g>the</str<strong>on</strong>g> fact that his<br />
model is able to account for <str<strong>on</strong>g>the</str<strong>on</strong>g> roughness <str<strong>on</strong>g>effect</str<strong>on</strong>g> whereas <str<strong>on</strong>g>the</str<strong>on</strong>g> o<str<strong>on</strong>g>the</str<strong>on</strong>g>r models do not. Where<br />
Slarter's model fails to predict <str<strong>on</strong>g>the</str<strong>on</strong>g> <strong>turbulent</strong> flow data <str<strong>on</strong>g>of</str<strong>on</strong>g> <str<strong>on</strong>g>the</str<strong>on</strong>g> mixture 1 test sets, it could be<br />
for <str<strong>on</strong>g>the</str<strong>on</strong>g> following reas<strong>on</strong>s. Firstly, it should be noted that <str<strong>on</strong>g>the</str<strong>on</strong>g> viscous sub-layer thickness is<br />
relatively large in <strong>turbulent</strong> flow (± 300JLm) as opposed to <str<strong>on</strong>g>the</str<strong>on</strong>g> possible <str<strong>on</strong>g>effect</str<strong>on</strong>g>s <str<strong>on</strong>g>of</str<strong>on</strong>g> <str<strong>on</strong>g>the</str<strong>on</strong>g> pipe<br />
and <str<strong>on</strong>g>particle</str<strong>on</strong>g> roughness <str<strong>on</strong>g>effect</str<strong>on</strong>g>s. In o<str<strong>on</strong>g>the</str<strong>on</strong>g>r words <str<strong>on</strong>g>the</str<strong>on</strong>g> viscous sub-layer is suppressing <str<strong>on</strong>g>the</str<strong>on</strong>g><br />
roughness <str<strong>on</strong>g>effect</str<strong>on</strong>g> and Slatter's model which is over predicting <str<strong>on</strong>g>the</str<strong>on</strong>g> shear stress values is over<br />
compensating for a roughness <str<strong>on</strong>g>effect</str<strong>on</strong>g> which is not that significant. It is interesting to note for<br />
<str<strong>on</strong>g>the</str<strong>on</strong>g> test data <str<strong>on</strong>g>of</str<strong>on</strong>g> <str<strong>on</strong>g>the</str<strong>on</strong>g> large pipes (ie. 200mm pipes) for mixture 1, when <str<strong>on</strong>g>the</str<strong>on</strong>g> roughness <str<strong>on</strong>g>effect</str<strong>on</strong>g><br />
could be a factor, <str<strong>on</strong>g>the</str<strong>on</strong>g> <strong>turbulent</strong> predicti<strong>on</strong> <str<strong>on</strong>g>of</str<strong>on</strong>g> <str<strong>on</strong>g>the</str<strong>on</strong>g> Slatter model is fairly good - an average<br />
percentage error <str<strong>on</strong>g>of</str<strong>on</strong>g>2.59%, 2,98% and 15,48% for <str<strong>on</strong>g>the</str<strong>on</strong>g> three tests. Also, from Table 5.1 it<br />
can be seen that <str<strong>on</strong>g>the</str<strong>on</strong>g>re are relatively fewer larger <str<strong>on</strong>g>particle</str<strong>on</strong>g>s present in <str<strong>on</strong>g>the</str<strong>on</strong>g> viscous sub-layer<br />
as opposed to <str<strong>on</strong>g>the</str<strong>on</strong>g> o<str<strong>on</strong>g>the</str<strong>on</strong>g>r test sets due to <str<strong>on</strong>g>the</str<strong>on</strong>g> thickness <str<strong>on</strong>g>of</str<strong>on</strong>g> <str<strong>on</strong>g>the</str<strong>on</strong>g> viscous sub-layer (see secti<strong>on</strong><br />
5.5). Ano<str<strong>on</strong>g>the</str<strong>on</strong>g>r reas<strong>on</strong> is that <str<strong>on</strong>g>the</str<strong>on</strong>g> rheology is tending towards being a Bingham plastic (ie. <str<strong>on</strong>g>the</str<strong>on</strong>g><br />
value for n is approaching n=l) and under <str<strong>on</strong>g>the</str<strong>on</strong>g>se c<strong>on</strong>diti<strong>on</strong>s <str<strong>on</strong>g>the</str<strong>on</strong>g> Slatter model tends to over<br />
predict <str<strong>on</strong>g>the</str<strong>on</strong>g> shear stress values. At high shear rate values for a Bingham plastic as opposed<br />
to yield pseudoplastic <str<strong>on</strong>g>the</str<strong>on</strong>g> shear stress values will be greater as <str<strong>on</strong>g>the</str<strong>on</strong>g> viscous forces<br />
predominate in this regi<strong>on</strong> for Bingham plastics.<br />
Although Slatter's model is <str<strong>on</strong>g>the</str<strong>on</strong>g> best model overall. <str<strong>on</strong>g>the</str<strong>on</strong>g> data presented <strong>on</strong> <str<strong>on</strong>g>the</str<strong>on</strong>g> <str<strong>on</strong>g>particle</str<strong>on</strong>g><br />
rOughness <str<strong>on</strong>g>effect</str<strong>on</strong>g> (Figure 4.2) does bring into questi<strong>on</strong> <str<strong>on</strong>g>the</str<strong>on</strong>g> validity <str<strong>on</strong>g>of</str<strong>on</strong>g> <str<strong>on</strong>g>the</str<strong>on</strong>g> assumpti<strong>on</strong>s <strong>on</strong><br />
Which <str<strong>on</strong>g>the</str<strong>on</strong>g> Slatter model is based. However, because Slatter's model is based <strong>on</strong> <str<strong>on</strong>g>the</str<strong>on</strong>g> <str<strong>on</strong>g>particle</str<strong>on</strong>g><br />
roughness <str<strong>on</strong>g>effect</str<strong>on</strong>g> it proves very useful when undertaking for example scale-up from a smooth<br />
Walled small bore (eg. PVC pipe) to a rough wall large-scale pipe (eg. galvanised ir<strong>on</strong>), or<br />
Vice versa. Normally, for example, if <str<strong>on</strong>g>the</str<strong>on</strong>g> pressure drop in <strong>turbulent</strong> flow is predicted by <str<strong>on</strong>g>the</str<strong>on</strong>g><br />
sCale-up method <str<strong>on</strong>g>of</str<strong>on</strong>g> Bowen, a corrected pressure gradient would have to be estimated for <str<strong>on</strong>g>the</str<strong>on</strong>g><br />
change in roughness. This could be d<strong>on</strong>e by using <str<strong>on</strong>g>the</str<strong>on</strong>g> Govier & Aziz (1972) approach <str<strong>on</strong>g>of</str<strong>on</strong>g><br />
mUltiplying <str<strong>on</strong>g>the</str<strong>on</strong>g> predicted pressure gradient by a ratio <str<strong>on</strong>g>of</str<strong>on</strong>g> fricti<strong>on</strong> factors obtained from <str<strong>on</strong>g>the</str<strong>on</strong>g>


