PDF (3.400 MB) - Oil & Gas Science and Technology - IFP Energies ...
PDF (3.400 MB) - Oil & Gas Science and Technology - IFP Energies ...
PDF (3.400 MB) - Oil & Gas Science and Technology - IFP Energies ...

You also want an ePaper? Increase the reach of your titles
YUMPU automatically turns print PDFs into web optimized ePapers that Google loves.
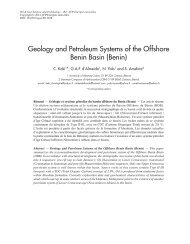
<strong>Oil</strong> & <strong>Gas</strong> <strong>Science</strong> <strong>and</strong> <strong>Technology</strong> – Rev. <strong>IFP</strong> <strong>Energies</strong> nouvelles, Vol. 66 (2011), No. 1, pp. 47-65<br />
Copyright © 2011, <strong>IFP</strong> <strong>Energies</strong> nouvelles<br />
DOI: 10.2516/ogst/2010016<br />
Reservoir Characterization for CO 2 Sequestration:<br />
Assessing the Potential of the Devonian Carbonate<br />
Nisku Formation of Central Alberta<br />
C. Eisinger 1* <strong>and</strong> J. Jensen 2<br />
1 University of Calgary, Energy <strong>and</strong> Environmental Systems Group, 2500 University Drive NW, Calgary, AB T2N 1N4 - Canada<br />
2 University of Calgary, Department of Chemical <strong>and</strong> Petroleum Engineering, 2500 University Drive NW, Calgary, AB T2N 1N4 - Canada<br />
e-mail: chris.eisinger@ucalgary.ca - jjensen@ucalgary.ca<br />
<strong>IFP</strong> <strong>Energies</strong> nouvelles International Conference<br />
Rencontres Scientifiques d’<strong>IFP</strong> <strong>Energies</strong> nouvelles<br />
Deep Saline Aquifers for Geological Storage of CO 2 <strong>and</strong> Energy<br />
Stockage géologique du CO 2 et de l'énergie en aquifères salins profonds<br />
* Current Address: Colorado Geological Survey, 1313 Sherman Street, Rm. 715, Denver, CO, 80203 - USA<br />
e-mail: chris.eisinger@state.co.us<br />
Résumé – Caractérisation de réservoir en vue du stockage géologique de CO 2 : évaluation du<br />
potentiel offert par les carbonates dévoniens de la formation de Nisku, en Alberta central –<br />
Plusieurs gros émetteurs de CO 2 , totalisant 30 Mt annuels, sont localisés dans la région du Lac<br />
Wabamun, au centre de l’Alberta (Canada). Des études antérieures ont montré le potentiel offert par les<br />
aquifères salins profonds de la région pour le stockage géologique de ce gaz et le présent article rend<br />
compte d’une caractérisation des carbonates dévoniens de la formation Nisku, en vue de réaliser un<br />
stockage de CO 2 .<br />
Une telle caractérisation doit surmonter plusieurs h<strong>and</strong>icaps : données de puits et de sismique réflexion<br />
assez rares et dispersées, tests en forage de qualité médiocre et rareté des mesures modernes. Des<br />
diagraphies de porosité ne sont disponibles que pour un tiers des puits, de sorte qu’on a utilisé les<br />
diagraphies de résistivité pour évaluer la porosité et la transmissivité (perméabilité × épaisseur). Le<br />
facteur de cimentation d’Archie vaut entre 2 et 3, ce qui maintient une incertitude quant à l’estimation de<br />
la porosité ainsi obtenue ; toutefois, on peut identifier les intervalles de forte porosité. En ce qui concerne<br />
la transmissivité, les valeurs déduites des logs sont mieux corrélées à celles provenant des mesures sur<br />
carotte qu’à celles obtenues par DST ou test de production. Un tel comportement n’est pas surprenant, car<br />
les tests sont moins sensibles à l’occurrence très locale de bancs rendus extrêmement perméables par une<br />
porosité vacuolaire (vuggy ou moldic).<br />
La distribution des faciès sédimentaires a été modélisée à l’aide de deux approches, de type “pixel” ou de<br />
type “objet”. La seconde, qui utilise des dimensions obtenues par imagerie satellitaire sur des<br />
environnements actuels, fournit des résultats plus cohérents avec la compréhension géologique que l’on a<br />
de la formation de Nisku, et se traduit par une connectivité à large échelle supérieure à celle obtenue par<br />
la méthode “pixel”. Les volumes obtenus indiquent une capacité potentielle de stockage considérable<br />
dans cette formation, toutefois les simulations hydrauliques laissent penser que l’injectivité initiale<br />
resterait inférieure à 20 Mt/an (objectif souhaité), pour les puits verticaux. Un design plus élaboré des<br />
puits d’injection, avec la prise en compte de stimulation par fracturation et/ou de puits latéraux multiples,<br />
pourrait permettre d’atteindre l’objectif d’injection indiqué.
48<br />
INTRODUCTION<br />
<strong>Oil</strong> & <strong>Gas</strong> <strong>Science</strong> <strong>and</strong> <strong>Technology</strong> – Rev. <strong>IFP</strong> <strong>Energies</strong> nouvelles, Vol. 66 (2011), No. 1<br />
Abstract — Reservoir Characterization for CO 2 Sequestration: Assessing the Potential of the<br />
Devonian Carbonate Nisku Formation of Central Alberta — The Wabamun Lake area of Central<br />
Alberta, Canada includes several large CO 2 point source emitters, collectively producing more than<br />
30 Mt annually. Previous studies established that deep saline aquifers beneath the Wabamun Lake area<br />
have good potential for the large-scale injection <strong>and</strong> storage of CO 2 . This study reports on the<br />
characterization of the Devonian carbonate Nisku Formation for evaluation as a CO 2 repository.<br />
Major challenges for characterization included sparse well <strong>and</strong> seismic data, poor quality flow tests, <strong>and</strong><br />
few modern measurements. Wireline porosity measurements were present in only one-third of the wells,<br />
so porosity <strong>and</strong> flow capacity (permeability-thickness) were estimated using wireline electrical<br />
measurements. The Archie cementation factor appears to vary between 2 <strong>and</strong> 3, creating uncertainty<br />
when predicting porosity using the electrical measurements; however, high-porosity zones could be<br />
identified. The electrically-based flow capacity predictions showed more favorable values using a<br />
correlation with core than the relation based on drill stem <strong>and</strong> production tests. This behavior is<br />
expected, since the flow test flow capacities are less influenced by local occurrences of very permeable<br />
vuggy <strong>and</strong> moldic rocks.<br />
Facies distributions were modeled using both pixel <strong>and</strong> object methods. The object models, using<br />
dimensions obtained from satellite imaging of modern day environments, gave results that were more<br />
consistent with the geological underst<strong>and</strong>ing of the Nisku <strong>and</strong> showed greater large-scale connectivity<br />
than the pixel model. Predicted volumes show considerable storage capacity in the Nisku, but flow<br />
simulations suggest injection capacities are below an initial 20 Mt/year target using vertical wells. More<br />
elaborate well designs, including fracture stimulation or multi-lateral wells may allow this goal to be<br />
reached or surpassed.<br />
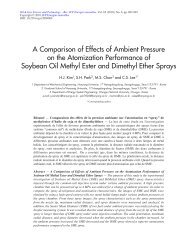
The Wabamun Lake area of Central Alberta, Canada<br />
includes several large CO 2 point source emitters, with<br />
combined annual production exceeding 30 Mt (Environment<br />
Canada, 2009). The largest sources are four coal-fired power<br />
plants with more than 4000 MW total generating capacity<br />
between them (Fig. 1). Geological sequestration of these<br />
emissions will play a role in helping Alberta reduce its > 230<br />
Mt total output of greenhouse gases (GHG) (Environment<br />
Canada, 2009), <strong>and</strong> allow Canada to decrease its overall<br />
atmospheric contributions significantly.<br />
Deep saline aquifers provide an attractive target for GHG<br />
injection <strong>and</strong> sequestration for a number of reasons, including:<br />
– the high potential storage capacity (> 4000 Gt CO 2 ) <strong>and</strong><br />
accessibility on a regional scale;<br />
– a minimal likelihood for interference with existing<br />
hydrocarbon producing fields <strong>and</strong> plays;<br />
– the limited or non-existent utility of saline water;<br />
– an aquifer abundance at a variety of stratigraphic intervals<br />
<strong>and</strong> lithologies allowing for flexibility in drilling <strong>and</strong><br />
storage.<br />
Characterization of these reservoirs is critical, especially<br />
underst<strong>and</strong>ing the lithologies, trapping <strong>and</strong> sealing mechanisms,<br />
<strong>and</strong> the regional geomechanics. Geomechanics <strong>and</strong><br />
brine geochemistry also have important roles in underst<strong>and</strong>ing<br />
potential injection <strong>and</strong> storage.<br />
In selecting aquifers most suitable for CO 2 injection, some<br />
key criteria are:<br />
– aquifer depth; the aquifer needs to be sufficiently deep to<br />
allow pressures <strong>and</strong> temperatures necessary for CO 2 to<br />
exist as a super critical fluid (i.e. 31.1 C <strong>and</strong> 7.8 MPa) but<br />
not so deep as to have little permeability (reservoir<br />
quality);<br />
– proximal barriers; there should exist multiple impermeable<br />
<strong>and</strong> low-permeability horizons (i.e. aquitards <strong>and</strong><br />
aquicludes) between the target aquifer <strong>and</strong> the surface to<br />
minimize leakage risk;<br />
– interference with existing activities; there should be no<br />
impact on existing hydrocarbon production.<br />
Using these simple criteria, the best aquifer targets in the<br />
Wabamun Lake area are the Paleozoic passive-margin<br />
carbonates <strong>and</strong> basal Cambrian s<strong>and</strong>stones. A saline aquifer,<br />
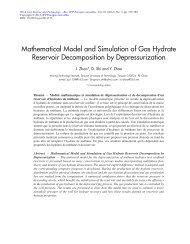
the Devonian Nisku (Fig. 2), is of particular interest as its<br />
depth, thickness, <strong>and</strong> stratigraphic configuration appear to be<br />
well suited for CO 2 injection <strong>and</strong> storage.<br />
The goal of this study was to generate cell-based,<br />
heterogeneous static geological models using all available<br />
data. Modeling was geared towards producing suitable inputs<br />
for flow simulations of CO 2 injection <strong>and</strong> storage over 100<br />
years. The methods for data integration, analysis, <strong>and</strong><br />
workflow in reservoir characterization of CO 2 sequestration<br />
are key aspects. The study emphasis is as much on the<br />
process steps as the results.
1 PREVIOUS WORK<br />
Previous studies established that deep saline aquifers beneath<br />
the Wabamun Lake area have good potential for the largescale<br />
injection <strong>and</strong> storage of CO 2 (Michael et al., 2009;<br />
Hitchon, 1996). Geological characterization <strong>and</strong> modeling<br />
results from the study by Michael <strong>and</strong> co-workers laid the<br />
foundation for our work. Their comprehensive characterization<br />
identified the Nisku as a prime aquifer target, assessing<br />
the sedimentary succession, hydrogeological conditions, rock<br />
characteristics, <strong>and</strong> in-situ fluid properties. Preliminary fluid<br />
flow models for homogeneous conditions predict the Nisku<br />
injection capacity to be > 10 Mt/year for 30 years (Michael et<br />
al., 2009). Results from heterogeneous models in this study<br />
suggest a much lower potential capacity.<br />
Figure 1<br />
C Eisinger <strong>and</strong> J. Jensen / Reservoir Characterization for CO 2 Sequestration:<br />
Assessing the Potential of the Devonian Carbonate Nisku Formation of Central Alberta<br />
The geological setting for subsurface Paleozoic sediments<br />
in the Wabamun region is described extensively in the<br />
Western Canada Sedimentary Basin Atlas (Ch. 7-15, Mossop<br />
<strong>and</strong> Shetson, 1994). Descriptions of geology <strong>and</strong> sedimentary<br />
succession for the Upper Devonian Nisku Formation are<br />
provided by Watts (1987), Stoakes (1987, 1992), Switzer et<br />
al. (1994), <strong>and</strong> Michael et al. (2009). Available pre-existing<br />
mineralogical <strong>and</strong> geochemical data are limited (Simpson,<br />
1999; Michael et al., 2009), <strong>and</strong> thus samples were collected<br />
<strong>and</strong> analyzed for this project.<br />
2 WABAMUN AREA SEQUESTRATION PROJECT<br />
The Wabamun Area Sequestration Project (WASP) is a<br />
feasibility study centered on a region southwest of Edmonton,<br />
The WASP study area (red outline) <strong>and</strong> locations of four large coal-fired power plants. Black circles show wells that penetrate the Nisku<br />
Formation. Purple lines mark important depositional boundaries of the Upper Devonian. The study area has an areal extent of approximately<br />
5000 km 2 .<br />
49
50<br />
Period<br />
series<br />
Miss.<br />
Upper Devonian<br />
Middle Devonian<br />
<strong>Oil</strong> & <strong>Gas</strong> <strong>Science</strong> <strong>and</strong> <strong>Technology</strong> – Rev. <strong>IFP</strong> <strong>Energies</strong> nouvelles, Vol. 66 (2011), No. 1<br />
Epoch<br />
stage<br />
Eifelian to Givetian Frasnian Famenne<br />
Group<br />
Wabamun group<br />
Winterburn group<br />
Woodbend group<br />
Beaverhill<br />
lake group<br />
ELK point<br />
group<br />
Precambrian<br />
Lithology<br />
Limestone<br />
Limestone<br />
Shale<br />
Limestone<br />
& Shale<br />
Evaporites<br />
Shale<br />
Limestone<br />
Alberta (Fig. 1) with a total areal extent in excess of<br />
5130 km 2 . The Area of Interest (AOI) encompasses 60<br />
townships (57.96 km × 96.6 km) of predominantly agricultural<br />
<strong>and</strong> recreational l<strong>and</strong> use. This broad area of investigation<br />
provides several saline aquifer targets in the subsurface,<br />
stratigraphic configurations optimal for storage <strong>and</strong> trapping<br />
Hydro-stratigraphy<br />
Banff/Exshaw<br />
aquitard<br />
Wabamun<br />
aquifer<br />
Winterburn aquitard<br />
Nisku aquifer<br />
Upper Devonian<br />
aquitard<br />
Cooking Lake aquifer<br />
Middle Devonian<br />
aquitar/aquiclude<br />
Middle Devonian aquifer<br />
Chinchaga aquitard<br />
Finnegan aquifer<br />
Deadwood<br />
aquitard<br />
Pika aquifer<br />
Pika/Eldon/Cathedral<br />
aquitard<br />
Mount Whyte aquitard<br />
Basal s<strong>and</strong>stone aquifer<br />
Aquiclude<br />
Banff/Exshaw ~1505 m<br />
Wabamun ~1555 m<br />
Calmar ~1725 m<br />
Nisku ~1729 m<br />
Ireton ~1828 m<br />
Legend<br />
Basal s<strong>and</strong>stone ~2868 m<br />
S<strong>and</strong>stone<br />
Carbonate<br />
Shale<br />
Evaporites<br />
Crystalline<br />
Aquifer<br />
Aquitard<br />
Aquitard/Aquiclude<br />
Figure 2<br />
Paleozoic stratigraphy for WASP region (modified after Fig. 2 in Bachu <strong>and</strong> Bennion, 2008). Depth, absence of hydrocarbons, <strong>and</strong> aquiferaquitard<br />
configuration supports Upper Devonian Nisku Fm. as prime CO2 injection c<strong>and</strong>idate. Another possible storage aquifer is the basal<br />
Cambrian s<strong>and</strong>stone.<br />
of CO 2 , <strong>and</strong> sufficient areal extent for placing wells at<br />
optimal injection spacings. Additionally, the distance to CO 2<br />
point source emitters is reasonable for pipeline <strong>and</strong> other<br />
surface infrastructure considerations.<br />
The WASP project targeted the sub-Cretaceous aquifers in<br />
the region (Fig. 2) to allow for depths below 900 m that
would provide suitable pressure <strong>and</strong> temperature conditions<br />
for CO 2 injection <strong>and</strong> storage. Potential injection targets<br />
originally included a basal Cambrian s<strong>and</strong>, 30 m thick on<br />
average; several thin carbonate aquifers (< 25 m) in the<br />
Cambrian <strong>and</strong> Middle Devonian; <strong>and</strong> the Nisku <strong>and</strong> Wabamun<br />
aquifers (both > 60 m thick) in the Upper Devonian. As<br />
recognized in previous studies (e.g., Michael et al., 2009),<br />
data <strong>and</strong> drilling considerations limit possible targets to the<br />
Upper Devonian (i.e. the Nisku <strong>and</strong> Wabamun Formations)<br />
at the present. Of the two sequestration c<strong>and</strong>idates, the Nisku<br />
Fm. is more suitable due to its having the extra Winterburn<br />
aquitard above it, <strong>and</strong> less likelihood of interference with<br />
current or future hydrocarbon production in the area.<br />
3 GEOLOGICAL SETTING<br />
The Paleozoic sedimentary sequence for the WASP study<br />
area begins with passive margin s<strong>and</strong>stones of Cambrian age,<br />
before a long depositional period of marine carbonates,<br />
shales, <strong>and</strong> occasional evaporites throughout the Devonian<br />
<strong>and</strong> Mississippian (Fig. 2). The overlying Cretaceous<br />
formations are predominantly siliciclastics – s<strong>and</strong>stones,<br />
siltstones, <strong>and</strong> shales. The combined Cretaceous <strong>and</strong> pre-<br />
Cretaceous section is greater than 2000 m thick in the study<br />
area, with the depth to the top of the Nisku Formation<br />
between 1000 m in the NE <strong>and</strong> 2000 m in the SW. The entire<br />
sedimentary package dips gently from NE to SW<br />
approximately 0.5 degrees on average through the study area.<br />
Being part of the Western Canadian Sedimentary Basin<br />
(WCSB), the stratigraphic continuity of the targeted layers<br />
extends to the east <strong>and</strong> northeast by > 200 km (Mossop <strong>and</strong><br />
Shetson, 1994).<br />
NW<br />
ZETA<br />
PINNACLE<br />
TREND<br />
ISOLATE PENNACLE<br />
REEFS<br />
ZETA<br />
LAKE<br />
<strong>MB</strong>R<br />
WOLF LAKE <strong>MB</strong>R<br />
Nisku porosity Well cores<br />
Figure 3<br />
CYNTHIA<br />
SHALE<br />
C Eisinger <strong>and</strong> J. Jensen / Reservoir Characterization for CO 2 Sequestration:<br />
Assessing the Potential of the Devonian Carbonate Nisku Formation of Central Alberta<br />
CYNTHIA<br />
SHELF<br />
GRAMMA SILT<br />
BLUE RIDGE <strong>MB</strong>R<br />
BIGORAY <strong>MB</strong>R<br />
UPPER LOBSTICK <strong>MB</strong>R<br />
MOON<br />
LAKE<br />
BUILD-UPS<br />
LOWER LOBSTICK <strong>MB</strong>R<br />
Structurally, the area of interest is regionally stable with<br />
minimal faulting (Frank Stoakes, personal communication,<br />
2009). From both regional <strong>and</strong> focused seismic data analysis,<br />
displacements within the Nisku or surrounding strata were<br />
absent (Alsuhail et al., 2009). Integrity of the caprock (the<br />
Calmar Fm.) appears to be very good with few points of<br />
potential upward flow. A source of concern is possible<br />
karsting in an overlying carbonate formation (the Wabamun<br />
Fm.) that may weaken the compentency of layers directly<br />
above the Nisku. Small, isolated features (< 1 km in diameter)<br />
interpreted from seismic data may influence the choices for<br />
injection well locations.<br />
Nisku deposition occurs as the earliest part of the Winterburn<br />
Group, subsequent to shales <strong>and</strong> carbonates nearly filling the<br />
WCSB. The Nisku interval represents a strong marine transgression<br />
with carbonate ramp deposition dominant (Switzer<br />
et al., 1994). Indications suggest a late stage regressive<br />
episode as well, but deposition diminished during this time in<br />
the area of interest (Switzer et al., 1994).<br />
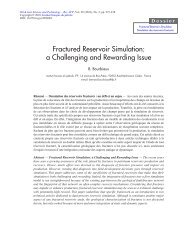
For the WASP region, the Nisku interval includes open<br />
marine ramp carbonates, shallower platform carbonates, <strong>and</strong><br />
peritidal hypersaline facies (Fig. 3). Thickness of the Nisku<br />
carbonate accumulation ranges from 40 m near the eastern<br />
boundary of the study area to over 100 m closer to the shelf<br />
margin. Basinward are hydrocarbon bearing pinnacle reefs<br />
(Zeta Pinnacle Trend) <strong>and</strong> shelf margin reefs (Moon Lake<br />
Build-Ups). These mark the western boundary of the potential<br />
injection aquifer. The transition from open marine carbonate<br />
facies to the low permeability hypersaline rocks of a paleoevaporite<br />
basin delineates the eastern boundary (Fig. 3).<br />
For the WASP study, two facies assemblages were<br />
identified from the limited core available: an undifferentiated<br />
INBOARD<br />
SHELF EDGE<br />
GRAMMA FORMATION<br />
CALMAR FORMATION<br />
RI<strong>MB</strong>EY-MEADOWBROOK<br />
TREND<br />
NISKU HYPERSALINE<br />
RI<strong>MB</strong>EY<br />
MEADOWBROOK<br />
LEDUC FM<br />
(SCG, 2008)<br />
A conceptual NE-SW cross-section (see blue-yellow line in Fig. 1) through the Nisku formation for WASP (used with permission from SCG<br />
Ltd). Red shading indicates regions of enhanced porosity <strong>and</strong> vertical blue columns represent stratigraphic position of well cores. Most cores<br />
sample the upper portion of the Nisku, where porosity is typically poorer than the lower parts.<br />
SE<br />
51
52<br />
a)<br />
<strong>Oil</strong> & <strong>Gas</strong> <strong>Science</strong> <strong>and</strong> <strong>Technology</strong> – Rev. <strong>IFP</strong> <strong>Energies</strong> nouvelles, Vol. 66 (2011), No. 1<br />
b)<br />
Figure 4<br />
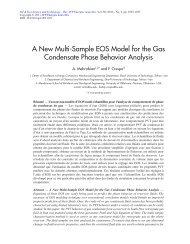
a) Hypersaline facies core sample: dolomitic mudstone to grainstone with anhydrite plugging; porosity = 1.7% <strong>and</strong> kmax = 3 mD.<br />
b) Open marine facies core samples: upper photo – common dolomitic mudstone to grainstone; porosity = 3-5% <strong>and</strong> kmax = 5-15 mD.<br />
Lower photo – rare dolimitic grainstone to boundstone with Amphipora derived vugs; porosity = 14% <strong>and</strong> kmax > 10 000 mD.<br />
open marine facies (including shallower platform carbonates)<br />
<strong>and</strong> a hypersaline carbonate mudstone. The hypersaline<br />
facies (Fig. 4a) consists of dolomitic mudstone to grainstone<br />
with occasional moldic porosity <strong>and</strong> limited Amphipora.<br />
Abundant anhydrite <strong>and</strong> fine-grained silt <strong>and</strong> shale stringers<br />
reduce the permeability significantly. Core permeabilities are<br />
less than 5 mD (5 × 10 -3 μm 2 ) <strong>and</strong> porosity is typically less<br />
than 2%. The open marine facies (Fig. 4b) includes dolomitic<br />
mudstone to boundstone. Vuggy <strong>and</strong> moldic porosity are<br />
observed in some intervals, while anhydrite plugging is<br />
limited. Stromatoporoids <strong>and</strong> Amphipora are common, with<br />
less frequent corals <strong>and</strong> brachiopods also present. Core<br />
porosities are typically between 3 to 5%, <strong>and</strong> permeabilities<br />
between 5 to 15 mD. In exceptional cases, porosity exceeds<br />
12%, with permeabilities of several Darcys.<br />
The Nisku shelf is underlain by Ireton Fm. shales <strong>and</strong><br />
overlain by fine-grained clastics of the Calmar Fm. – a<br />
persistent, low-permeability shale unit typically between
C Eisinger <strong>and</strong> J. Jensen / Reservoir Characterization for CO 2 Sequestration:<br />
Assessing the Potential of the Devonian Carbonate Nisku Formation of Central Alberta<br />
5 <strong>and</strong> 12 m thick. Above, the Calmar Fm. is the Graminia Fm.<br />
(including the Blue Ridge Member), which collectively<br />
comprise the Winterburn aquitard (Fig. 2).<br />
4 CHARACTERIZATION OF THE NISKU FORMATION<br />
4.1 Data<br />
With an area of more than 5000 km2 for the WASP AOI,<br />
Nisku formation data are clearly sparse. As is likely to be the<br />
case for other deep saline aquifers, Nisku characterization is<br />
hampered by infrequent penetrating wells, limited core, <strong>and</strong><br />
often patchy wireline log coverage. For building static <strong>and</strong><br />
dynamic models, the available information includes:<br />
– data from 96 wells that penetrate the Nisku within the<br />
AOI, including paper tour (drilling) reports;<br />
– wireline geophysical logs of varying vintage, from the<br />
1950’s to recent suites;<br />
– routine core analyses <strong>and</strong> lithological descriptions for 13<br />
wells in the study area, with special core analyses for select<br />
samples;<br />
– processed <strong>and</strong> raw geophysical data;<br />
– Drill Stem Tests (DSTs) of generally poor quality;<br />
– petrographic studies, both publicly available <strong>and</strong> newly<br />
acquired.<br />
The distribution of data presents a challenge for accurate<br />
modeling in the inter-well zones (Fig. 5). Inter-well distances<br />
range from 0.5 km to more than 20 km.<br />
For each well, information is available for the location <strong>and</strong><br />
depth, the historical status of operation (e.g., drilling rig tour<br />
sheets), <strong>and</strong> in some cases, well casing <strong>and</strong> completion.<br />
Production data are scarce for the Nisku interval as very few<br />
wells have produced. One notable exception is a waterproduction<br />
well (1F1/11-29-045-02W5/00) that has recorded<br />
data since January, 2003. Core from thirteen wells was also<br />
logged. Cores are 2.5 cm, 7.5 cm, or 10 cm diameter, represent<br />
a small portion of the Nisku interval (usually < 20 m), <strong>and</strong><br />
sample only the uppermost section. Prior to this study, six<br />
wells with core already had routine (either whole-core or<br />
core plug) core analysis performed. For this project, cores<br />
from eight additional wells were sent for routine analyses.<br />
Core plugs provided measurements of porosity, permeability,<br />
<strong>and</strong> in most cases grain density. Two of these wells were<br />
outside the study area (Fig. 5). Special core analyses<br />
(directional permeability <strong>and</strong> compressibility measurements)<br />
were obtained for a subset of collected cores.<br />
Wireline geophysical logs exist for 93 of the 96 wells in<br />
the study area. Log type <strong>and</strong> quality largely depend on the<br />
vintage (Tab. 1). Of these 93 wells, digitized logs for 79<br />
wells were used in the analysis <strong>and</strong> interpretation. An<br />
additional two wells that penetrate the Nisku Formation<br />
outside the study area were included for modeling as they<br />
provided core data in lower Nisku intervals. Digital log depth<br />
sampling intervals varied between 0.1 m, 0.15 m, 0.2 m,<br />
0.5 m, <strong>and</strong> 0.6 m. All digitized logs were re-sampled at 0.5 m<br />
or 0.6 m. A critical step before petrophysical analysis is<br />
quality control of the digitized data, involving checks for unit<br />
consistency <strong>and</strong> accuracy, depth shifting (where possible),<br />
<strong>and</strong> general comparisons with the raster logs for errors in<br />
scaling <strong>and</strong>/or digitization. Stratigraphic picks were primarily<br />
based on geophysical logs with Nisku facies distinctions<br />
influenced by core observations <strong>and</strong> facies isopach mapping.<br />
Formation tops were individually verified to assure<br />
consistency in mapped surfaces.<br />
TABLE 1<br />
Well log availability for the WASP AOI<br />
No. of wells Age of logs Log types<br />
35 Pre-1960 SP, resistivity<br />
34 1960-1980 resistivity, porosity<br />
24 Post-1980 full suite<br />
53<br />
Seismic data were obtained from pre-existing surveys made<br />
to evaluate shallower horizons. The available data consist of<br />
199 2D lines, <strong>and</strong> seven 3D volumes acquired between 1980<br />
<strong>and</strong> 2003. Data processing <strong>and</strong> interpretation was focused on<br />
a subset region (Fig. 5), selected on the basis of available<br />
seismic data, proximity to potential point source emitters, <strong>and</strong><br />
a general underst<strong>and</strong>ing of the area geology. Seismic 3D<br />
volumes processed for time structure <strong>and</strong> impedance of the<br />
Nisku Fm. were incorporated into the geomodeling process,<br />
<strong>and</strong> provided more detailed information where coverage<br />
exists.<br />
Horner plot analysis of 22 DSTs was useful for estimating<br />
reservoir pressures, the average pressure behavior over time,<br />
<strong>and</strong> providing estimates of flow capacity (i.e. the product of<br />
permeability <strong>and</strong> thickness). The DSTs were generally poor in<br />
quality <strong>and</strong> targeted only limited intervals of the Nisku Fm.<br />
4.2 Petrophysics<br />
Core porosities, obtained for 13 wells, ranged from 1% to<br />
greater than 20%, <strong>and</strong> maximum permeabilities, kmax , were<br />
highly variable, between 0.01 mD <strong>and</strong> > 10 D. The median<br />
kmax is approximately 10 mD <strong>and</strong> anisotropy, as measured by<br />
the vertical-to-horizontal ratio, kv /kmax ≥ 0.1 for 68% <strong>and</strong><br />
kv /kmax ≥ 0.01 for 88% of the 285 whole-core samples. Core<br />
flow capacity (kh) for 7 wells from the uppermost Nisku<br />
suggest potential aquitard qualities; more than 75% of the<br />
measurements are below 10 mD-m. The core data are mostly<br />
from the less porous, uppermost parts of the open marine<br />
facies. Statistically, there is not a significant difference in<br />
measured porosities or permeabilities relative to position in<br />
the carbonate ramp sequence.
54<br />
Figure 5<br />
<strong>Oil</strong> & <strong>Gas</strong> <strong>Science</strong> <strong>and</strong> <strong>Technology</strong> – Rev. <strong>IFP</strong> <strong>Energies</strong> nouvelles, Vol. 66 (2011), No. 1<br />
R8 R7 R6 R5 R4 R3 R2 R1W5<br />
Distribution of available well core data (red circles) for the Nisku Formation. Core analyses (blue circles) from existing (6 wells) <strong>and</strong> newly<br />
acquired (8 wells) data sets. Orange line delineates focus area for seismic data processing <strong>and</strong> interpretation.<br />
Wireline geophysical well logs for the Nisku aquifer, once<br />
properly calibrated to core, quality controlled, <strong>and</strong> resampled<br />
to ensure consistent sampling intervals, provide the basis for<br />
much of the static geological modeling. A resolution of 0.3 m<br />
or less is desirable for capturing large porosity <strong>and</strong> permeability<br />
occurrences in the open marine Nisku facies. The<br />
resolution of many of the older log measurements, however,<br />
is poorer than 0.3 m.<br />
T53<br />
T52<br />
T51<br />
T50<br />
T49<br />
T48<br />
T47<br />
T46<br />
T45<br />
T44<br />
T43<br />
Interpretation of porosity measurements in carbonate<br />
lithologies is not straight forward, although it is generally<br />
assumed that acoustic methods are more sensitive to<br />
interparticle porosity, whereas neutron <strong>and</strong> density logs<br />
estimate total porosity (Lucia, 2007). For the WASP AOI,<br />
there exist 32 wells with sonic logs available. Porosity was<br />
estimated using the relationship of Wyllie et al. (1956):<br />
φ s = (Δt – Δt ma )/(Δt L – Δt ma ) (1)
C Eisinger <strong>and</strong> J. Jensen / Reservoir Characterization for CO 2 Sequestration:<br />
Assessing the Potential of the Devonian Carbonate Nisku Formation of Central Alberta<br />
where φ s = porosity; Δt = tool measured interval transit time;<br />
Δt ma = transit time of matrix material; <strong>and</strong> Δt L = transit time<br />
of interstitial fluid. The assumed values for the Nisku<br />
carbonate are Δt ma = 143 μs/m (suitable for a dolomite) <strong>and</strong><br />
Δt L = 623 μs/m for the Nisku Fm. fluid. In the cored<br />
intervals, the vast majority of samples included mostly<br />
interparticle porosity with occasional moldic porous zones.<br />
The separate-vug porosity was generally less than a few<br />
percent of the total porosity, suggesting that the Wyllie timeaverage<br />
could provide useful estimates (Lucia, 2007). The<br />
sonic porosity tends to overestimate core porosity (Fig. 6).<br />
This may be caused by anhydrite in the cored intervals,<br />
which has a larger transit time (164 μs/m) than that used<br />
assuming dolomite in Equation (1). The 13 wells containing<br />
coincident density <strong>and</strong> neutron logs suggest most of the<br />
Nisku Fm. samples are dolostone. There are also occasional<br />
indications of dolomitic limestone <strong>and</strong> silty-mudstones in the<br />
wireline logs.<br />
There are just over 50 wells that have deep resistivity or<br />
conductivity logs, distributed over an extensive portion of the<br />
WASP study region. Given the lack of porosity logs in most<br />
wells <strong>and</strong> the water-saturated conditions, we assessed the use<br />
of the more abundant resistivity logs to estimate porosity.<br />
Archie (1942) proposed that, in 100% water-saturated rocks,<br />
porosity depends on rock resistivity (R o ), water resistivity<br />
(R w ), <strong>and</strong> the pore geometry/cementation factor (m):<br />
Sonic porosity (%)<br />
14<br />
12<br />
10<br />
8<br />
6<br />
4<br />
2<br />
0<br />
0<br />
Figure 6<br />
2<br />
φ = (R w /R o ) 1/m (2)<br />
4 6 8<br />
Core porosity (%)<br />
Cross-plot of core porosity estimates versus acoustic log<br />
estimates for 4 wells (07-08-045-04W5; 07-31-044-04W5;<br />
06-02-047-02W5; 11-24-045-08W5). Larger circles represent<br />
average values for each well (shown in different colors) with<br />
coincident data available.<br />
10<br />
12<br />
14<br />
R w = 0.029 ohm-m, based on direct measurement of<br />
samples from a water source well in the Nisku <strong>and</strong> other R w<br />
measurements collected during drilling. R o was estimated<br />
using the deepest resistivity measurement available in the log<br />
suite, e.g., deep induction. No environmental corrections<br />
were applied to the resistivity log values <strong>and</strong> R w is sufficiently<br />
small that surface conduction effects could be<br />
neglected (Attia et al., 2008).<br />
To use Equation (2) requires a value for m. Using wireline<br />
measurements from deep induction <strong>and</strong> density-neutron logs,<br />
2 < m < 3 (Fig. 7). We observe a similar range for m using<br />
core porosities. This range is consistent with values of m<br />
obtained in other carbonate formations (Lucia, 2007). The<br />
variation in porosity values predicted using Equation (2)<br />
arising from the uncertainty in m limits the utility of the<br />
resistivity measurements for predicting the actual value of<br />
porosity. However, Figure 7 suggests that, if we assume<br />
m = 2, the resistivity is a useful indicator of minimum<br />
porosity, with R o < 10 ohm-m corresponding with φ > 5%,<br />
<strong>and</strong> R o < 5 ohm-m corresponding with φ > 8%. Analysis of<br />
the resistivity logs assuming m = 2 indicates that areas<br />
located in the central portion of the Nisku ramp sequence<br />
have potentially good porosity, <strong>and</strong> porosity is larger towards<br />
the base of the Nisku Fm. These observations of good<br />
porosity, however, may be pessimistic because the poor<br />
vertical resolution of the older resistivity logs causes the<br />
apparent minimum R o value for the Nisku interval in a well<br />
(R o,min ) to be overestimated.<br />
Since electrical flow <strong>and</strong> fluid flow share the same<br />
governing equations, we assessed the use of electrical conductivity<br />
measurements from wireline to predict hydraulic<br />
conductivity. The length of the current path through the formation<br />
is directly related to the shape, diameter, <strong>and</strong> sorting<br />
of the grains, geometric packing arrangement, <strong>and</strong> degree of<br />
matrix cementation. All of these factors also affect the formation<br />
permeability. Several studies have confirmed the use of<br />
electrical measurements to predict permeability where saline<br />
water is present (e.g., Archie, 1950; Jackson et al., 1998; Ball<br />
et al., 1997). Most of the reports concern core-scale relationships,<br />
where sample heterogeneity may be less than typically<br />
exists at larger scales. Reports of successful use of resistivity<br />
measurements to predict permeability at larger scales exist in<br />
the case of fresh or nearly-fresh water aquifers (e.g., Croft,<br />
1971; Kwader, 1985).<br />
On this basis, the maximum electrical conductivity<br />
(C max = 1/R o,min ) observed in a well was used to predict that<br />
well’s flow capacity, measured as the product of permeability<br />
<strong>and</strong> vertical thickness (kh). Core, DST, <strong>and</strong> production well<br />
kh values compared to wireline C max suggest that a useful<br />
relationship may exist for the Nisku open marine facies<br />
(Fig. 8). Core-based kh values are larger than the DST <strong>and</strong><br />
production values by about a factor of 20. This is reasonable<br />
since locally enhanced permeability will be limited in lateral<br />
extent for core, whereas the DST <strong>and</strong> production values are<br />
55
56<br />
<strong>Oil</strong> & <strong>Gas</strong> <strong>Science</strong> <strong>and</strong> <strong>Technology</strong> – Rev. <strong>IFP</strong> <strong>Energies</strong> nouvelles, Vol. 66 (2011), No. 1<br />
5.3%<br />
18.0%<br />
0.01 0.1<br />
Density-neutron porosity (fraction)<br />
affected by connectivity beyond the near-wellbore region. In<br />
addition to the core- <strong>and</strong> DST-based flow capacities, a kh<br />
estimate based on reported water well production<br />
capabilities of 1000 m 3 per day, is shown in Figure 8.<br />
(Assuming a 10 cm radius wellbore <strong>and</strong> 10% pressure drop<br />
to produce a flow of 1000 m 3 /day, an estimate of the<br />
formation flow capacity is approximately 3000 mD-m.).<br />
From the C max —(kh) prod relationship (lower line of Fig. 8),<br />
flow capacity values which represent the volumes<br />
investigated by DSTs <strong>and</strong> the production well can be<br />
estimated. The C max —(kh) prod relationship suggests that a<br />
minimum electrical conductivity of 150 mhos/m is needed<br />
for one Darcy-meter flow capacity to exist. A cumulative<br />
distribution function of C max over the AOI (not shown)<br />
indicates approximately 25% of wells have C max > 150<br />
mmhos/m, suggesting that there are regions with Darcymeter<br />
flow capacity within the Nisku Fm. The location of<br />
these wells may prove to be preferable for CO 2 injection.<br />
m = 2<br />
m = 3<br />
R w = 0.029<br />
To test the ability of using C max values to predict flow<br />
capacity, we used drilling data. During drilling of nine wells<br />
in the WASP area, problems were reported with lost<br />
circulation of the drilling mud. For four of these wells,<br />
electrical resistivity logs were also available. While there can<br />
be a number of reasons why mud losses occur, one such<br />
reason is that the well has encountered a large flow capacity<br />
interval. The C max values for these four wells exceed<br />
280 mmho/m (Fig. 9), suggesting that electrical conductivity<br />
may indeed be responding to the formation flow capacity<br />
beyond the wellbore.<br />
4.3 Permeability Estimates<br />
A three-dimensional model of permeability is critical for<br />
reservoir characterization <strong>and</strong> flow simulation. For CO 2<br />
injection, permeability is a very significant variable for<br />
controlling total injectivity (e.g., Cinar et al., 2009). Data<br />
1<br />
100<br />
10<br />
1<br />
0.1<br />
0.01<br />
Resistivity (ohm-m)<br />
10 ohm-m<br />
5 ohm-m<br />
10 29 048 05W5<br />
07-31-044-04W5<br />
08-17-048-02W5<br />
14-32-045-02W5<br />
14-12-048-06W5<br />
Core porosity<br />
Figure 7<br />
Relationship between deep resistivity wireline data <strong>and</strong> both core <strong>and</strong> wireline porosity. Lines are based on Archie’s Law. The cementation<br />
factor (m) value is between 2 <strong>and</strong> 3 for resistivities below 10 ohm-m. 10 <strong>and</strong> 5 ohm-m thresholds illustrate range of uncertainty in porosity<br />
estimates using this method.
Flow capacity (mD-m)<br />
100 000<br />
C Eisinger <strong>and</strong> J. Jensen / Reservoir Characterization for CO 2 Sequestration:<br />
Assessing the Potential of the Devonian Carbonate Nisku Formation of Central Alberta<br />
10 000<br />
1000<br />
100<br />
10<br />
1<br />
0.1<br />
10 100 1000<br />
from cores are a typical source of permeability information,<br />
however the Nisku core data suggest much better flow<br />
capacities than larger-scale flow tests (Fig. 8). We used the<br />
C max vs kh relations from core data (Fig. 8) to provide an<br />
optimistic scenario:<br />
kh = 0.33 ⋅ C max 2.2 (3)<br />
<strong>and</strong> a pessimistic scenario, based on DST <strong>and</strong> production tests:<br />
kh = 0.02 ⋅ C max 2.2 (4)<br />
Max. conductivity (mmhos/m)<br />
DST<br />
Core<br />
Water well<br />
Figure 8<br />
Relationship between maximum conductivity (from wireline logs) <strong>and</strong> permeability thickness from core (green circles) <strong>and</strong> DSTs (pink<br />
circles). Reasons for the two wells with (kh) DST = 0.3 mD-m to have behaviour different from other wells could not be determined. Open red<br />
circle shows water production well (11-29-045-02W5) based on max. conductivity measurement from wireline <strong>and</strong> estimate of flow capacity<br />
based on flow rate.<br />
C max was evaluated at the same interval as the vertical grid<br />
spacing (h) in order to determine an appropriate permeability<br />
value to populate the model grid. These values were then<br />
used in a conditional simulation to create a three-dimensional<br />
model of permeability. Porosity was used as the secondary<br />
variable in a colocated co-kriging process. Results for both<br />
permeability estimation scenarios were used in the<br />
geostatistical modeling, although time constraints limited the<br />
flow simulations to be conducted only for the pessimistic<br />
case.<br />
57
58<br />
Max. elec. cond. (mmho/m)<br />
800<br />
600<br />
400<br />
200<br />
0<br />
4.4 Geomodeling<br />
<strong>Oil</strong> & <strong>Gas</strong> <strong>Science</strong> <strong>and</strong> <strong>Technology</strong> – Rev. <strong>IFP</strong> <strong>Energies</strong> nouvelles, Vol. 66 (2011), No. 1<br />
0 1<br />
Lost circulation (Y/N)<br />
Figure 9<br />
Maximum values of wireline conductivity measurements (Cmax ) suggest that wells with no reported kicks or lost circulation (0’s) tend to<br />
have smaller Cmax values than those with such events (1’s).<br />
We applied two modeling approaches for the Nisku aquifer<br />
characterization: traditional pixel-based methods <strong>and</strong> objectbased<br />
(Boolean) modeling. For the Nisku reservoir model<br />
framework, formation tops associated with the Nisku open<br />
marine facies were constructed using a convergent interpolation<br />
method (Taylor series projection with minimum curvature<br />
used for smoothing). As no major faults or other structural<br />
displacement features have been identified during the geological<br />
analysis, a simple reservoir geometry was sufficient.<br />
From the stratigraphic grid, a cartesian-based model was<br />
generated. This model provides the geostatistical framework<br />
for subsequent property <strong>and</strong> petrophysical modeling. The x<br />
<strong>and</strong> y cell dimensions were fixed at 500 m each direction to<br />
satisfy computational constraints of simulating fluid flow for<br />
the large region of WASP, while at the same time providing<br />
a reasonable level of geological continuity. All data – well<br />
paths, well logs, <strong>and</strong> seismic data were conditioned to the<br />
cartesian grid. The vertical layering of the grid was set at<br />
30 layers divided unevenly between the 3 zones (Tab. 2)<br />
based upon geological interpretations of vertical correlations<br />
using the wireline logs. As enhanced porosity <strong>and</strong><br />
permeability zones appear to exist more frequently in the<br />
upper <strong>and</strong> lower thirds of the reservoir, these vertical<br />
intervals benefit from a finer vertical resolution during flow<br />
simulation. Wireline logs were upscaled using an arithmetic<br />
average for porosity determination <strong>and</strong> using a harmonic<br />
average for vertical permeability (when appropriate). Logs<br />
were treated as lines where each sample value is weighted by<br />
a factor proportional to its interval.<br />
TABLE 2<br />
Vertical grid spacing for Nisku open marine facies<br />
Vertical layer Avg thickness (m) Zone<br />
1-13 1.72 Upper<br />
14-18 4.46 Middle<br />
19-30 1.86 Lower<br />
The variogram analysis established the geological<br />
continuity in porosity <strong>and</strong> permeability for the Nisku reservoir.<br />
An assumption is made, however, that the nature of these<br />
petrophysical properties is homogeneous at some scale. Both<br />
laterally isotropic <strong>and</strong> anisotropic semivariograms were used,<br />
depending on the modeling objective. Spherical variograms<br />
were used for lateral correlation, while gaussian variograms<br />
were used in the vertical direction. Semivariogram properties<br />
were modeled to be anisotropic with a major range of 8 km<br />
<strong>and</strong> minor range of 5 km. Semivariogram ranges on the order<br />
of a few kilometers are consistent with depositional patterns<br />
found on shallow carbonate platforms (e.g. Grant et al.,<br />
1994). A trend (N 30 E) was included to reflect alignment of<br />
enhanced porosity regions parallel to the paleo-shoreline<br />
during upper Devonian deposition. The vertical range was<br />
found to be 22 m.<br />
Kriging, as is often observed, produced results that were<br />
too smooth to accurately reflect a viable geologic scenario.<br />
Therefore, a stochastic (probablistic) method which better<br />
recognizes uncertainty <strong>and</strong> incorporates a factor of<br />
r<strong>and</strong>omness (Srivastava, 1994) was applied. Specifically,<br />
Sequential Gaussian Simulation (SGS) provided a more
C Eisinger <strong>and</strong> J. Jensen / Reservoir Characterization for CO 2 Sequestration:<br />
Assessing the Potential of the Devonian Carbonate Nisku Formation of Central Alberta<br />
Porosity (Top layer) Scale: 0 to 15%<br />
a) Permeability (Top layer)<br />
1 2 3 4 5<br />
b) Upper Zone (Porosity) Upper Zone (Permeability)<br />
Scale: 1 to 1000 mD<br />
Figure 10<br />
a) Five SGS realizations for Nisku open marine facies porosity (top) <strong>and</strong> permeability (bottom).<br />
b) Examples of poro-perm distributions based on object-models. Porosity (left) scaled 0 to 15% <strong>and</strong> permeability (right) scaled 1 to 1000 mD.<br />
59
60<br />
<strong>Oil</strong> & <strong>Gas</strong> <strong>Science</strong> <strong>and</strong> <strong>Technology</strong> – Rev. <strong>IFP</strong> <strong>Energies</strong> nouvelles, Vol. 66 (2011), No. 1<br />
realistic distribution of porosities <strong>and</strong> permeablities<br />
(Fig. 10a). As part of this modeling approach, seismic<br />
estimates of acoustic impedance were included as a secondary<br />
variable for collocated cokriging. (Correlations between<br />
seismic attributes <strong>and</strong> porosity <strong>and</strong> permeability are widely<br />
discussed in the literature. See, for example, Abbaszadeh et<br />
al. (2004) <strong>and</strong> Jenkins et al. (2008)). Of the fifty realizations<br />
generated, five were selected for fluid simulation (Fig. 10a).<br />
The realizations developed through SGS methods were<br />
qualitatively useful for illustrating potential porosity <strong>and</strong><br />
permeability distributions in the Nisku open marine facies.<br />
Quantitatively, however, the definition of flow pathways over<br />
the entire studied region using SGS are poor – again a<br />
consequence of limited data. Injectivity volumes (as<br />
determined through simulation) provided a useable order-ofmagnitude<br />
calculation, but there is still a large degree of<br />
uncertainty regarding the overall flow connectivity within <strong>and</strong><br />
between model layers using this method.<br />
Object-modeling (also known as ‘Boolean’ modeling)<br />
provides a method for incorporating plausible <strong>and</strong> quantifiable<br />
three-dimensional facies geometries into the static earth<br />
model. This method can provide more plausible geological<br />
shapes than cell-based methods, but it is also more difficult to<br />
constrain the models to the actual wireline log <strong>and</strong>/or seismic<br />
data sets (Caers, 2005). Already in common use for clasticsystems<br />
such as fluvial <strong>and</strong> submarine channels (e.g. Holden<br />
et al., 1998; North, 1996; Seifert <strong>and</strong> Jensen, 2000), an object<br />
approach to geomodeling may also have application to<br />
carbonate systems – especially in cases where larger<br />
reservoir areas are being characterized. The dimensions of<br />
facies elements (e.g. reefs, aprons, <strong>and</strong> shoals), however,<br />
need to be quantified in terms of distribution <strong>and</strong> geometry –<br />
thickness, width, aspect ratio, sinuosity, etc. To our<br />
knowledge, studies that include these types of measurements<br />
from outcrops or wireline data are very rare (e.g. Atchley et<br />
al., 2002), <strong>and</strong> thus the application of this method has seen<br />
limited use with carbonate systems.<br />
As an alternative source of geometrical data, faciesclassified<br />
satellite imagery of modern carbonate systems can<br />
provide useful quantitative constraints (Harris <strong>and</strong> Kolwalik,<br />
1994; Andrefouet et al., 2001; Andrefouet et al., 2003;<br />
Bachtel, 2005). For this Nisku study, work by Harris <strong>and</strong><br />
Vlaswinkel (2008) was especially useful in selecting<br />
reasonable parameter values for carbonate-object geometry<br />
<strong>and</strong> scale in the facies being modeled. Dimensions for<br />
partially aggraded reef <strong>and</strong> apron facies (see Harris <strong>and</strong><br />
Vlaswinkel (2008) for method of facies classification) were<br />
chosen as appropriate Nisku open marine facies analogs<br />
(Tab. 3a). We assumed that:<br />
– the platform comprises shallow reef systems with an<br />
elongated elliptical shape oriented parallel or sub-parallel<br />
to the paleo-shore line (approximately N 30 E);<br />
– the reefal buildups were small to intermediate in size<br />
(< 200 km 2 ).<br />
TABLE 3<br />
a) Geometry of enhanced porosity <strong>and</strong> permeability objects.<br />
All distributions are triangular between min., mean, <strong>and</strong> max.<br />
b) Division of objects based on vertical interval, enhanced regions,<br />
<strong>and</strong> classes. The percent of total volume objects occupy is a controlled<br />
parameter subjectively estimated.<br />
IBM = inboard margin, OM = open marine<br />
Enhanced<br />
porosity class<br />
Orientation<br />
(azimuth)<br />
(a)<br />
Min. (m) Mean (m) Max. (m)<br />
25 35 45<br />
Better Major width 50 500 1200<br />
Maj./Min. ratio 1 5 7<br />
Thickness 0.5 5 10<br />
Orientation<br />
(azimuth)<br />
25 35 45<br />
Best Major width 20 300 800<br />
Maj./Min. ratio 1 5 7<br />
Thickness 0.1 2 6<br />
(b)<br />
Vertical Enhanced porosity % of total<br />
Enhanced porosity class<br />
zone object fairways model volume<br />
IBM Better 3%<br />
Upper IBM Best 0.5%<br />
Middle<br />
Lower<br />
OM Better 7%<br />
OM Best 1%<br />
IBM Better 1%<br />
IBM Best 0.1%<br />
OM Better 4%<br />
OM Best 0.5%<br />
IBM Better 1%<br />
IBM Best 0.1%<br />
OM Better 25%<br />
OM Best 11%<br />
Vertically, the modeled formation was divided into three<br />
roughly proportional zones with distributions of objects<br />
variable (Fig. 11). The upper <strong>and</strong> especially lower zones<br />
have the highest propensity for enhanced porosity <strong>and</strong><br />
permeability objects. Wireline geophysical logs (Fig. 11) <strong>and</strong><br />
the conceptual geology model (Fig. 3) provided constraints.<br />
Lateral distribution of these objects was subjective, based<br />
upon conceptual underst<strong>and</strong>ings of the Nisku carbonate<br />
platform in the WASP study area (Fig. 3).
Nisku<br />
Open<br />
Marine<br />
Figure 11<br />
C Eisinger <strong>and</strong> J. Jensen / Reservoir Characterization for CO 2 Sequestration:<br />
Assessing the Potential of the Devonian Carbonate Nisku Formation of Central Alberta<br />
Nisku<br />
Nisku Open<br />
Electrical resistivity (ILD) log for 04-14-051-03W5 (left). Vertical distribution of low resistivity zones used to condition the vertical<br />
distribution of enhanced porosity <strong>and</strong> permeability objects in the model (right). ILD log values below 5 ohm-m are marked by blue <strong>and</strong> those<br />
values below 10 ohm-m are marked by red lines.<br />
61
62<br />
Relative production to homogeneous<br />
1.5<br />
1.4<br />
1.3<br />
1.2<br />
1.1<br />
1.0<br />
0.9<br />
0.8<br />
0.7<br />
0.6<br />
0.5<br />
0<br />
Figure 12<br />
<strong>Oil</strong> & <strong>Gas</strong> <strong>Science</strong> <strong>and</strong> <strong>Technology</strong> – Rev. <strong>IFP</strong> <strong>Energies</strong> nouvelles, Vol. 66 (2011), No. 1<br />
2 4<br />
Time (y)<br />
6<br />
Two zones, or fairways, were imposed on the model to<br />
reflect a greater likelihood of greater porosity <strong>and</strong> permeability<br />
with better connectivity in these areas. There is some<br />
uncertainty, however, as to the existence of better porosity<br />
<strong>and</strong> permeability along the inboard platform margin. The<br />
high-capacity water production well suggests the presence of<br />
such a zone. Log analysis, however, shows no evidence of<br />
improved porosity in the area.<br />
The distribution of objects varied according to the Nisku<br />
zone interval being modeled (Tab. 3). All objects were<br />
populated stochastically in the system while being<br />
conditioned to existing wireline log data. Porosities <strong>and</strong><br />
permeabilities for objects were determined based on the<br />
distribution as determined from wireline conductivity<br />
measurements. Two object classes were established:<br />
– better – 8% mean porosity (normal distribution) <strong>and</strong><br />
30 mD mean permeability (log-normal distribution);<br />
8<br />
SGS<br />
Object Model A<br />
Object Model B<br />
Water production simulation for various model scenarios. Location for water production well (11-29-045-02W5) was used in simulations.<br />
SGS – Sequential Gaussian Simulation; Object Model A – one single enhanced poro-perm fairway; Object Model B – two enhanced<br />
poro-perm fairways (see inset figure).<br />
– best – 14% mean porosity (normal distribution) <strong>and</strong><br />
200 mD mean permeability (log-normal distribution);<br />
– SGS was used to populate the non-object filled grid cells.<br />
Several iterations of object distributions were generated<br />
<strong>and</strong> each was then geostatistically populated with flow<br />
properties (Fig. 10b). The final model was a combination of<br />
geologic interpretation <strong>and</strong> traditional geostatistical methods<br />
constrained to available data.<br />
5 MODEL RESULTS<br />
For the Nisku aquifer, the object-based method appears to<br />
provide the best order-of-magnitude volume approximations<br />
(Tab. 4). The model results suggest pore volumes for the<br />
Nisku AOI will be between 15 <strong>and</strong> 17 km3 , however the real<br />
storage potential will be much larger as the aquifer extends<br />
far to the northeast <strong>and</strong> southwest of the study area.
C Eisinger <strong>and</strong> J. Jensen / Reservoir Characterization for CO 2 Sequestration:<br />
Assessing the Potential of the Devonian Carbonate Nisku Formation of Central Alberta<br />
TABLE 4<br />
Minimum potential storage capacity for Nisku reservoir<br />
using WASP boundary. Actual volumes will be larger as aquifer<br />
extends to the northwest <strong>and</strong> southeast of study area. Mean permeability<br />
(k) is significantly larger for the object model as isolated grid cells<br />
containing high values affect the result.<br />
Bulk volume Pore volume Mean φ Mean kh<br />
(10 6 m 3 ) (10 6 m 3 ) (%) (mD-m)<br />
Homogeneous 305 348 15 267 5.0 2 100<br />
SGS (50 realizations) 305 348 15 258 4.9 70<br />
Object model 305 348 16 924 4.4 46 550<br />
Qualitatively, the potential flow pathways appear most<br />
realistic in an object-based model that allows more geologic<br />
interpretation of connectivity to be included. The best<br />
connected regions are in the lowest third of the Nisku Fm.<br />
While qualitative inspection suggests a more accurate<br />
portrayal of mid-to large-scale reservoir heterogeneity using<br />
object-based versus pixel methods, the models should also be<br />
assessed on the basis of their flow performance. Given the<br />
limited amount <strong>and</strong> quality of flow-related data, validation of<br />
model behavior is difficult. For example, flow simulations of<br />
some DST’s could be compared to the field DST’s to assess<br />
whether permeability <strong>and</strong> larger-scale connectivity are adequately<br />
captured in the models if longer duration <strong>and</strong> better<br />
quality pressure measurements were available. Flow simulations<br />
of the water production well, however, are helpful in<br />
revealing differences between the models regarding deliverability<br />
(up to a maximum of 1000 m 3 /day) along the inboard<br />
margin region (Fig. 12). All the models tested had sufficient<br />
connectivity to deliver water at rates which match actual production<br />
for more than 7 years, but the pixel model shows<br />
about 25% less connectivity than the object models. This difference<br />
could have economically important consequences for<br />
development of a sequestration project in the Nisku Fm.<br />
Since a development plan will need a model to assess project<br />
feasibility <strong>and</strong> well locations, one or more long-term production<br />
tests with proper pressure <strong>and</strong> flow monitoring are<br />
needed to help decide which model is more appropriate.<br />
Other studies have investigated geomechanical (Goodarzi<br />
et al., 2010), geochemical (Hutcheon, 1999), <strong>and</strong> fluid flow<br />
aspects of the Nisku Fm. Fluid flow simulations of CO 2<br />
injection were made using the heterogeneous models<br />
produced for this project (see Ghaderi et al., 2008). Results<br />
indicate total capacity will be below the original target<br />
volume of 20 Mt/yr (Fig. 13). From the available data, higher<br />
permeabilities (> 100 mD) are not modeled to have the<br />
connectivity necessary to accommodate such large injection<br />
volumes. The locations of injection wells in the flow<br />
simulations can affect injectivity, by only the order of +/– 5%<br />
at most. Horizontal drilling <strong>and</strong> hydro-fracturing, however,<br />
may double the total injection capacity (Ghaderi et al., 2009).<br />
Injected CO 2 after 50 y (GT)<br />
1.2<br />
1.0<br />
0.8<br />
0.6<br />
0.4<br />
0.2<br />
0<br />
0<br />
CONCLUSIONS<br />
5<br />
10<br />
Number of vertical injectors<br />
Target – 1.0 Gt<br />
40 MPa<br />
30 MPa<br />
Figure 13<br />
For homogeneous reservoir case (k = 30 mD, φ = 8%)<br />
showing injection potential as a function of reservoir fracture<br />
pressure. A minimum of 10 injectors is necessary to achieve<br />
0.2 Gt after 50 years. Only a slight increase is obtained using<br />
20 injectors.<br />
The available core analyses <strong>and</strong> petrophysical evaluation of<br />
wireline logs indicate average porosities for the Nisku<br />
interval to between 3 <strong>and</strong> 5%, with localized zones in excess<br />
of 10%. Permeability from core measurements shows the<br />
median to be 10 mD, but with some values in excess of<br />
several Darcys. In trying to map the distribution, size, <strong>and</strong><br />
connectivity of these better porosity-permeability intervals,<br />
wireline logs were used.<br />
Wireline log resistivity measurements provided a useful<br />
tool to estimate both the minimum porosity <strong>and</strong> permeability.<br />
Log <strong>and</strong> core data indicate that the Archie cementation factor<br />
m is between 2 <strong>and</strong> 3. This variability causes resistivity-based<br />
porosity estimates to be quite variable, but assuming m = 2<br />
provides a useful estimator of minimum porosity. Using this<br />
method, zones with porosity greater than 8% were more<br />
often in the lower third of the reservoir interval. Formation<br />
flow capacities, estimated using a relationship between<br />
maximum wireline conductivity <strong>and</strong> permeability thickness<br />
from core <strong>and</strong> DST data, were up to several Darcy-meters in<br />
the best cases. The flow capacity is greater than 1 D-m for<br />
25% of the wells using the conductivity—flow capacity<br />
relationship. Wells with mud losses during drilling correlated<br />
with wells having larger electrical conductivities, supporting<br />
the existence of a relationship between the electrical <strong>and</strong><br />
hydraulic characteristics.<br />
For characterization of the Nisku Fm. in the Wabamun<br />
study, object methods may have advantages for integration of<br />
conceptual geologic information over traditional pixel-based<br />
15<br />
20<br />
63
64<br />
<strong>Oil</strong> & <strong>Gas</strong> <strong>Science</strong> <strong>and</strong> <strong>Technology</strong> – Rev. <strong>IFP</strong> <strong>Energies</strong> nouvelles, Vol. 66 (2011), No. 1<br />
methods using semivariograms. Variogram based methods<br />
struggle to accurately model reservoirs where depositional<br />
bodies <strong>and</strong> geologic shapes (which are typically curvilinear)<br />
control the distribution of flow properties (i.e. porosity <strong>and</strong><br />
permeability). For carbonate systems, the application of<br />
object-based models has seen limited application, primarily<br />
due to the problem of defining carbonate depositional<br />
geometries <strong>and</strong> distributions <strong>and</strong> the impression that r<strong>and</strong>om,<br />
diagenetic influences are more important than depositional<br />
characteristics. Some of these challenges were addressed in<br />
this study using satellite-based facies mapping of modern<br />
analogues <strong>and</strong> inferences based on existing knowledge of the<br />
Nisku Fm. While many limitations remain, object -based<br />
geomodeling for large regional-scale carbonates with sparse<br />
data shows promise.<br />
The static-earth models were exported for use in fluid-flow<br />
simulations. The petrophysical analysis <strong>and</strong> geomodeling<br />
suggests potentially good injection volume <strong>and</strong> flow capacity<br />
in the Nisku assuming the best interval <strong>and</strong> laterally<br />
extensive zones are targeted. Seismic data will be invaluable<br />
in this process. Another concern is the fracture pressure of<br />
the reservoir, which requires detailed geomechanical<br />
underst<strong>and</strong>ing <strong>and</strong> a well integrated model of the caprock –<br />
in this case the formations of the Winterburn aquitard. The<br />
geological model created here can be used as part of this<br />
process. Finally, it is necessary to validate the static models<br />
for accuracy. This can be done using simulated DSTs <strong>and</strong> by<br />
regenerating models when new data become available.<br />
Simulations of the one water production well along the<br />
inboard margin suggest there can be important differences in<br />
connectivity between models.<br />
Reservoir rock properties <strong>and</strong> configuration suggest the<br />
Nisku formation may be a potentially valuable CO 2 injection<br />
<strong>and</strong> storage target for the Wabamun region. As previous<br />
investigators concluded (Michael et al., 2009), the Devonian<br />
strata provide a suitable c<strong>and</strong>idate for sequestration presently.<br />
The regional characterizations, however, also suggests the<br />
need for more detailed site-specific information, especially<br />
seismic data acquisition, in order to assess potential injection<br />
targets properly.<br />
ACKNOWLEDGMENTS<br />
We thank the numerous sponsors of the WASP project for<br />
financial support, which include Alberta Energy Research<br />
Institute (AERI), Natural <strong>Science</strong>s <strong>and</strong> Engineering Research<br />
Council (NSERC), TransAlta, TransCanada, ARC Energy<br />
Trust, Penn West Energy Trust, Epcor, Enbridge, ConocoPhillips<br />
Canada, Encana, Stat<strong>Oil</strong>Hydro Canada, Total Canada,<br />
Computer Modeling Group, <strong>and</strong> Golder Associates. The editorial<br />
<strong>and</strong> review comments greatly improved this manuscript.<br />
Jerry L. Jensen holds the Schulich Chair in Geostatistics at the<br />
University of Calgary.<br />
REFERENCES<br />
Abbaszadeh M., Takahashi I., Suzuki K. (2004) Integrated Seismic-<br />
Guided Characterization of a Carbonate Reservoir in Abu Dahbi,<br />
U.A.E., SPE 90533 presented at the SPE Annual Technical<br />
Conference <strong>and</strong> Exhibition in Houston, TX, Sept. 26-29.<br />
Alshuhail A., Lawton D., Isaac H. (2009) Acoustic Impedance<br />
Inversion of Vintage Seismic Data Over a Proposed CO2 Sequestration Site in the Lake Wabamun Area, Alberta, CREWES<br />
Research Report 20, 1-20.<br />
Andrefouet S., Claereboudt M., Matsakis P., Pages J., Dufour P.<br />
(2001) Typology of Atoll Rims in Tuamotu Archipelago (French<br />
Polynesia) at L<strong>and</strong>scape Scale Using SPOT HRV Images, Int.<br />
J. Remote Sens. 22, 6, 987-1004.<br />
Andrefouet S., Kramer P., Torres-Pulliza D., Joyce K.E., Hochberg<br />
E.J., Garza-Perez R., Mumby P.J., Riegl B., Yamano H., White<br />
W.H., Zubia M., Brock J.C., Phinn S.R., Naseer A., Hatcher B.G.,<br />
Muller-Karger F.E. (2003) Multi-site Evaluation of IKONOS Data<br />
for Classification of Tropical Coral Reef Environments, Remote<br />
Sens. Environ. 88, 1-2, 128-143.<br />
Archie G.E. (1942) The Electrical Resistivity Log as an Aid in<br />
Determining Some Reservoir Characteristics, Am. Inst. Min. Met.<br />
Eng. T. 146, 54-62.<br />
Archie G.E. (1950) Introduction to Petrophysics of Reservoir<br />
Rocks, B. Am. Ass. Petrol. Geol. 34, 943-961.<br />
Atchley S., McMurray M. (2002) Devonian (Frasnian) Leduc- <strong>and</strong><br />
Nisku-equivalent Outcrops Near Canmore, Alberta: 1-D Outcrops<br />
as a Guide to Subsurface Stratal Architecture, Am. Ass. Petrol. Geol.<br />
Annual Conv., Houston, Texas.<br />
Attia A.M., Fratta D., Bassiouni Z. (2008) Irreducible Water<br />
Saturation from Capillary Pressure <strong>and</strong> Electrical Resistivity<br />
Measurements, <strong>Oil</strong> <strong>Gas</strong> Sci. Technol. 63, 2, 203-217.<br />
Bachtel S.L. (2005) Platform-scale Facies Distributions Using<br />
L<strong>and</strong>sat Data from Isolated Carbonate Platforms: Methods to<br />
Constrain Lateral Facies Continuity for Geologic Modeling, Am.<br />
Ass. Petrol. Geol. Annual Conv., Calgary, Alberta.<br />
Bachu S., Bennion B. (2008) Effects of In-situ Conditions on Relative<br />
Permeability Characteristics of CO2-brine Systems, Environ. Geol.<br />
54, 8, 1707-1722.<br />
Ball L.D., Corbett P.W.M., Jensen J.L., Lewis J.J.M. (1997) The<br />
Role of Geology in the Behavior <strong>and</strong> Choice of Permeability<br />
Predictors, SPE Formation Evaluation 12, 1, 32-39.<br />
Caers J. (2005) Petroleum Geostatistics, Soc. for Petro. Eng.,<br />
Richardson, Texas.<br />
Cinar Y., Neal P.R., Allinson W.G., Sayers J. (2009) Geoengineering<br />
<strong>and</strong> Economic Assessment of a Potential Carbon<br />
Capture <strong>and</strong> Storage Site in Southeast Queensl<strong>and</strong>, Australia, SPE<br />
Reserv. Eval. Eng. 12, 5, 660-670.<br />
Croft M.G. (1971) A Method of Calculating Permeability from<br />
Electric Logs, U. S. Geol. Survey. Prof. Paper 750-B, 265-269.<br />
Environment Canada (2009) National Inventory Report 1990-2007:<br />
Greenhouse <strong>Gas</strong> Sources <strong>and</strong> Sinks in Canada, Greenhouse <strong>Gas</strong><br />
Division, Gatineau. http://www.ec.gc.ca/pdb/ghg/inventory_report/<br />
2007/som-sum_eng.pdf.<br />
Ghaderi S.M., Keith D.W., Leonenko Y. (2009) Feasibility of<br />
Injecting Large Volumes of CO2 in Aquifers, 9th International<br />
Conference on Greenhouse <strong>Gas</strong> Control Technologies (GHGT-9),<br />
Washington DC, November 16-20.<br />
Goodarzi S., Settari A., Keith D.W. (2010) Geomechanical<br />
Modeling for CO2 Storage in Wabamun Lake Area of Alberta,<br />
Canada, 10th International Conference on Greenhouse <strong>Gas</strong> Control<br />
Technologies (GHGT-10), Amsterdam, September 19-23.
C Eisinger <strong>and</strong> J. Jensen / Reservoir Characterization for CO 2 Sequestration:<br />
Assessing the Potential of the Devonian Carbonate Nisku Formation of Central Alberta<br />
Grant C.W., Goggin D.J., Harris P.M. (1994) Outcrop Analog for<br />
Cyclic-Shelf Reservoirs, San Andreas Formation of Permian Basin:<br />
Stratigraphic Framework, Permeability Distribution, Geostatistics,<br />
<strong>and</strong> Fluid-Flow Modeling, B. Am. Ass. Petrol. Geol. 78, 23-54.<br />
Harris P.M., Kolwalik W.S. (1994) Satellite Images of Carbonate<br />
Depositional Settings: Examples of Reservoir- <strong>and</strong> Explorationscale<br />
Geologic Facies Variation, Am. Ass. Petrol. Geol., Methods in<br />
Exploration Series 11, 1-147.<br />
Harris P.M., Vlaswinkel B. (2008) Modern Isolated Carbonate<br />
Platforms: Templates for Quantifying Facies Attributes of<br />
Hydrocarbon Reservoirs, Soc. Sed. Geol. Special Pub. 89, 323-341.<br />
Hitchon B. (1996) Aquifer Disposal of Carbon Dioxide, Geoscience<br />
Publishing Ltd., Sherwood Park, Alberta.<br />
Holden L., Hauge R., Skare O., Skorstad A. (1998) Modeling Fluid<br />
Reservoirs with Object Models, Math. Geol. 30, 5, 473-496.<br />
Hutcheon I. (1999) Controls on the Distribution of Non-<br />
Hydrocarbon <strong>Gas</strong>es in the Alberta Basin, B. Can. Ass. Petrol. Geol.<br />
47, 573-593.<br />
Jackson P.D., Harvey P.K., Lovell M.A., Gunn D.A., Williams<br />
C.G., Flint R.C. (1998) Measurement Scale <strong>and</strong> Formation<br />
Heterogeneity: Effects on the Integration of Resistivity Data, Geol.<br />
Soc. Special Publication 136, 261-272.<br />
Jenkins C.C., Chiquito P.N., Mills A.A., McPherson J.G., Schapper<br />
M.C., Williams M.A. (2008) Reservoir Definition at the Jansz/Io<br />
<strong>Gas</strong> Field, NW Shelf, Australia: A Case Study of an Integrated<br />
Project From Exploration to Development, IPTC 12461 presented at<br />
the Int. Petroleum Tech. Conference, Kuala Lumpur, Malaysia,<br />
Dec. 3-5.<br />
Kwader T. (1985) Estimating Aquifer Permeability from Formation<br />
Resistivity Factors, Ground Water 23, 6, 762-766.<br />
Lucia J.F. (2007) Carbonate Reservoir Characterization: An<br />
Integrated Approach, Springer, Berlin.<br />
Machel H.G. (1985) Facies <strong>and</strong> Diagenesis of the Upper Devonian<br />
Nisku Formation in the Subsurface of Central Alberta, PhD Thesis,<br />
McGill University.<br />
Michael K., Bachu S., Buschkuehle B.E., Haug K., Grobe M.,<br />
Lytviak A.T. (2006) Comprehensive Characterization of a Potential<br />
Site for CO2 Geological Storage in Central Alberta, Canada,<br />
CO2SC Symposium, Berkeley, California.<br />
Michael K., Bachu S., Buschkuehle B.E., Haug K., Talman S.<br />
(2009) Comprehensive Characterization of a Potential Site for CO2 Geological Storage in Central Alberta, Canada in Carbon Dioxide<br />
Sequestration in Geological Media – State of the Art, Grobe M.,<br />
Pashin J., Dodge R. (eds), AAPG Studies in Geology 59, Tulsa,<br />
Oklahoma.<br />
Mossop G.D., Shetsen I. (comps.) (1994) Geological Atlas of the<br />
Western Canada Sedimentary Basin, Canadian Society of<br />
Petroleum Geologists <strong>and</strong> Alberta Research Council, Special Report<br />
4, Calgary, Alberta.<br />
North C.P. (1996) The Prediction <strong>and</strong> Modeling of Subsurface<br />
Fluvial Stratigraphy in Advances in Fluvial Dynamics <strong>and</strong><br />
Stratigraphy, Carling P.A., Dawson M.R. (eds), John Wiley <strong>and</strong><br />
Sons, New York.<br />
SCG Ltd., Stoakes Consulting Group (2009) Personal communication.<br />
Seifert D., Jensen J.L. (2000) Object <strong>and</strong> Pixel-based Reservoir<br />
Modeling of a Braided Fluvial Reservoir, Math. Geol. 32, 5, 581-603.<br />
Simpson G.P. (1999) Sulfate Reduction <strong>and</strong> Fluid Chemistry of the<br />
Devonian Leduc <strong>and</strong> Nisku Formations in South-central Alberta,<br />
PhD Thesis, University of Calgary.<br />
Srivastava R.M. (1994) An Overview of Stochastic Methods for<br />
Reservoir Characterization in AAPG Computer Applications in<br />
Geology No. 3, Stochastic Modeling <strong>and</strong> Geostatistics: Principles,<br />
Methods <strong>and</strong> Case Studies, Yarus J.M., Chambers R.L. (eds),<br />
American Association of Petroleum Geologists, Tulsa, Oklahoma.<br />
Stoakes F.A. (1987) Evolution of the Upper Devonian of Western<br />
Canada in Principles <strong>and</strong> Concepts for Exploration <strong>and</strong><br />
Exploitation of Reefs in the Western Canada Basin: Short Course<br />
Notes, Canadian Reef Inventory Project, Canadian Society of<br />
Petroleum Geologists, Calgary, Alberta.<br />
Stoakes F.A. (1992) Winterburn Megasequence in Devonian - Early<br />
Mississippian Carbonates of the Western Canada Sedimentary<br />
Basin: A Sequence Stratigraphic Framework, Wendte J.C., Stoakes<br />
F.A., Campbell C.V. (eds), Society of Economic Paleontologists<br />
<strong>and</strong> Mineralogists Short Course No. 28, Calgary, Alberta.<br />
Switzer S.B., Holl<strong>and</strong> W.G., Christie D.S., Graf G.C., Hedinger<br />
A.S., McAuley R.J., Wierzbicki R.A., Packard J.J. (1994) Devonian<br />
Woodbend - Winterburn Strata of the Western Canada Sedimentary<br />
Basin in Geological Atlas of the Western Canada Sedimentary<br />
Basin, Mossop G.D., Shetsen I. (comps.), Canadian Society of<br />
Petroleum Geologists <strong>and</strong> Alberta Research Council, Special Report<br />
4, Calgary, Alberta.<br />
Watts N.R. (1987) Carbonate Sedimentology <strong>and</strong> Depositional<br />
History of the Nisku Formation in South-central Alberta in<br />
Devonian Lithofacies <strong>and</strong> Reservoir Styles in Alberta, Krause F.F.,<br />
Burrows O.G. (eds), 2nd International Symposium of the Devonian<br />
System, 13th CSPG Core Conference, Calgary, Alberta.<br />
Wylie M.R., Gregory A.R., Gardner L.W. (1956) Elastic Wave<br />
Velocities in Heterogeneous <strong>and</strong> Porous Media, Geophysics 21, 41-70.<br />
65<br />
Final manuscript received in July 2009<br />
Published online in February 2011<br />
Copyright © 2011 <strong>IFP</strong> <strong>Energies</strong> nouvelles<br />
Permission to make digital or hard copies of part or all of this work for personal or classroom use is granted without fee provided that copies are not made<br />
or distributed for profit or commercial advantage <strong>and</strong> that copies bear this notice <strong>and</strong> the full citation on the first page. Copyrights for components of this<br />
work owned by others than <strong>IFP</strong> <strong>Energies</strong> nouvelles must be honored. Abstracting with credit is permitted. To copy otherwise, to republish, to post on<br />
servers, or to redistribute to lists, requires prior specific permission <strong>and</strong>/or a fee: Request permission from Information Mission, <strong>IFP</strong> <strong>Energies</strong> nouvelles,<br />
fax. +33 1 47 52 70 96, or revueogst@ifpen.fr.