Part I.pdf
Part I.pdf
Part I.pdf

You also want an ePaper? Increase the reach of your titles
YUMPU automatically turns print PDFs into web optimized ePapers that Google loves.
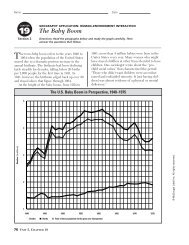
(b) A regression line added to 8: plot of the days against year shows, on average, that the number<br />
of da s since A ril 20 that the tri od falls is decreasing as the years go by.<br />
(c) According to R-Sq in the fitted line plot above, 10.0% of the variation in ice breakup time is<br />
accounted for by the time trend.<br />
1.7 Grouping the data into year groups (1 = 1917-to 1939,2 = 1940 to 1959,3 = 1960 to 1979,4<br />
= 1980 to 2005), we can see that the median time to tripod drop is generally decreasing over<br />
time. The median is approximately equal for the time periods 1940 to 1959 and 1960 to 1979.<br />
However, the median looks noticeably higher for the time period 1917 to 1939 and noticeably<br />
lower for the time period 1980 to 2005.