Physiologic and Supraphysiologic Increases in Lipoprotein Lipids ...
Physiologic and Supraphysiologic Increases in Lipoprotein Lipids ...
Physiologic and Supraphysiologic Increases in Lipoprotein Lipids ...

You also want an ePaper? Increase the reach of your titles
YUMPU automatically turns print PDFs into web optimized ePapers that Google loves.
PREGNANCY HYPERLIPIDEMIA AND PRELIPEMIA Montes et al. 411<br />
Table 3. LIpoprote<strong>in</strong> Lipid <strong>and</strong> Apoproteln Ratios In 23 Women <strong>in</strong> Late Pregnancy <strong>and</strong> Postpartum <strong>and</strong> In 23<br />
Age- <strong>and</strong> Body-Mass-Matched Nonpregnant Controls<br />
VLDL<br />
TG/chol<br />
TG/apo B<br />
Chol/apo B<br />
LDL<br />
TG/chol<br />
TG/apo B<br />
Chol/apo B<br />
HDL<br />
TG/chol<br />
TG/apo A-1<br />
Chol/apo A-1<br />
Pregnant<br />
Weeks 34-38<br />
Mean±SD Median Mean<br />
5.10±1.10 5.00*<br />
7.79 ±5.07 5.21<br />
1.57 ±0.98 0.99<br />
0.46±0.10<br />
0.91 ±0.30<br />
2.02 + 0.65<br />
0.44*<br />
0.87*<br />
1.93<br />
0.46 ±0.15 0.50*<br />
0.18±0.05 0.16*<br />
0.39 ±0.07 0.40*<br />
Week 6 Week 20<br />
±SD<br />
4.88 ±2.40 4.00*<br />
9.30±9.08 7.00<br />
2.31+3.07 1.60<br />
0.23 ±0.08<br />
0.26 + 0.08<br />
1.21 ±0.25<br />
0.14±0.06<br />
0.07 ±0.03<br />
0.51 ±0.11<br />
Postpartum<br />
Median Mean±sD<br />
0.22*t<br />
0.25f<br />
1.14*t<br />
0.13*t<br />
0.07t<br />
0.48*t<br />
'Significantly different from controls at p s 0.05.<br />
tSignificantly different from antepartum at p == 0.05.<br />
^Significantly different from 6 weeks postpartum at p ^ 0.05.<br />
80-<br />
60-<br />
I6O-<br />
80-<br />
mg/dl<br />
240-<br />
I6O<br />
80-<br />
O- 1<br />
Glucose<br />
Triglycerkje<br />
Cholesterol<br />
8 16 24<br />
Pregnancy<br />
6.14±3.76<br />
7.56 ±4.01<br />
1.50 ±1.02<br />
0.20 ±0.07<br />
0.26 ±0.08<br />
1.38 ±0.29<br />
0.15 ±0.08<br />
0.07 + 0.03<br />
0.42 ±0.08<br />
32 40<br />
Weeks<br />
Median<br />
5.67*<br />
6.18<br />
1.15<br />
0.20*t<br />
0.25f<br />
1.43*t<br />
0.16*t<br />
0.07*t<br />
-VLDL<br />
Nonpregnant controls<br />
Mean±sD<br />
3.69 ±3.48<br />
10.88± 14.86<br />
3.06 ±3.32<br />
0.14 + 0.08<br />
0.23±0.17<br />
1.72 ±0.28<br />
0.21 ±0.09<br />
0.09 ±0.04<br />
0.44 + 0.06<br />
LDL<br />
6 20<br />
Posfpartum<br />
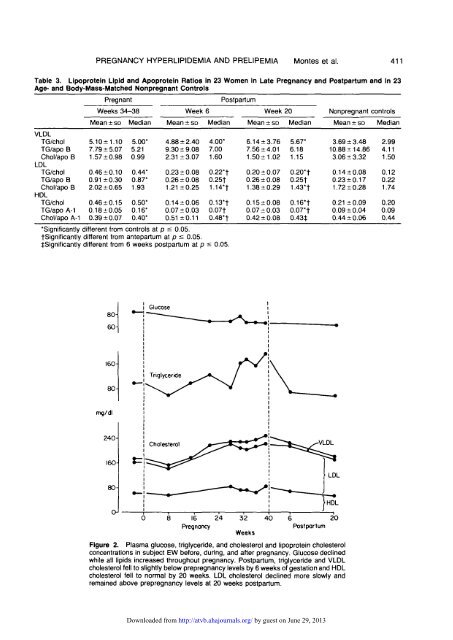
Figure 2. Plasma glucose, triglyceride, <strong>and</strong> cholesterol <strong>and</strong> lipoprote<strong>in</strong> cholesterol<br />
concentrations <strong>in</strong> subject EW before, dur<strong>in</strong>g, <strong>and</strong> after pregnancy. Glucose decl<strong>in</strong>ed<br />
while all lipids <strong>in</strong>creased throughout pregnancy. Postpartum, triglyceride <strong>and</strong> VLDL<br />
cholesterol fell to slightly below prepregnancy levels by 6 weeks of gestation <strong>and</strong> HDL<br />
cholesterol fell to normal by 20 weeks. LDL cholesterol decl<strong>in</strong>ed more slowly <strong>and</strong><br />
rema<strong>in</strong>ed above prepregnancy levels at 20 weeks postpartum.<br />
Downloaded from<br />
http://atvb.ahajournals.org/ by guest on June 29, 2013<br />
Median<br />
2.99<br />
4.11<br />
1.50<br />
0.12<br />
0.22<br />
1.74<br />
0.20<br />
0.09<br />
0.44