X-ray nature of the LINER nuclear sources
X-ray nature of the LINER nuclear sources
X-ray nature of the LINER nuclear sources

Create successful ePaper yourself
Turn your PDF publications into a flip-book with our unique Google optimized e-Paper software.
A&A 460, 45–57 (2006)<br />
DOI: 10.1051/0004-6361:20054756<br />
c○ ESO 2006<br />
X-<strong>ray</strong> <strong>nature</strong> <strong>of</strong> <strong>the</strong> <strong>LINER</strong> <strong>nuclear</strong> <strong>sources</strong> ⋆<br />
O. González-Martín 1 , J. Masegosa 1 , I. Márquez 1 , M. A. Guerrero 1 , and D. Dultzin-Hacyan 2<br />
1 Instituto de Astr<strong>of</strong>ísica de Andalucía, CSIC, Apartado Postal 3004, 18080 Granada, Spain<br />
e-mail: omaira@iaa.es<br />
2 Instituto de Astronomía, UNAM, Apartado Postal 70-264, 04510 México D.F., México<br />
Received 22 December 2005 / Accepted 17 May 2006<br />
ABSTRACT<br />
Astronomy<br />
&<br />
Astrophysics<br />
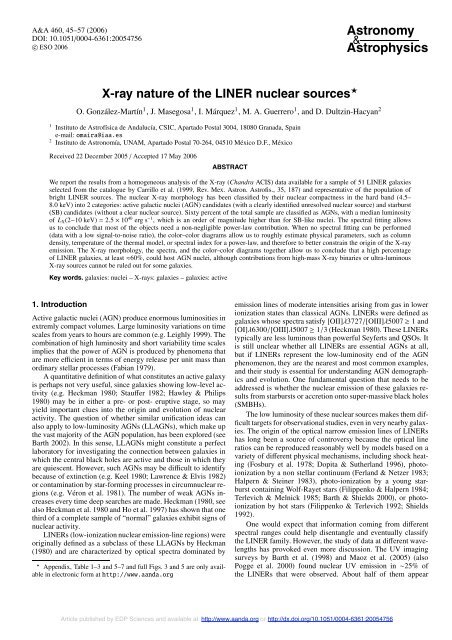
We report <strong>the</strong> results from a homogeneous analysis <strong>of</strong> <strong>the</strong> X-<strong>ray</strong> (Chandra ACIS) data available for a sample <strong>of</strong> 51 <strong>LINER</strong> galaxies<br />
selected from <strong>the</strong> catalogue by Carrillo et al. (1999, Rev. Mex. Astron. Astr<strong>of</strong>is., 35, 187) and representative <strong>of</strong> <strong>the</strong> population <strong>of</strong><br />
bright <strong>LINER</strong> <strong>sources</strong>. The <strong>nuclear</strong> X-<strong>ray</strong> morphology has been classified by <strong>the</strong>ir <strong>nuclear</strong> compactness in <strong>the</strong> hard band (4.5–<br />
8.0 keV) into 2 categories: active galactic nuclei (AGN) candidates (with a clearly identified unresolved <strong>nuclear</strong> source) and starburst<br />
(SB) candidates (without a clear <strong>nuclear</strong> source). Sixty percent <strong>of</strong> <strong>the</strong> total sample are classified as AGNs, with a median luminosity<br />
<strong>of</strong> LX(2−10 keV) = 2.5 × 10 40 erg s −1 , which is an order <strong>of</strong> magnitude higher than for SB-like nuclei. The spectral fitting allows<br />
us to conclude that most <strong>of</strong> <strong>the</strong> objects need a non-negligible power-law contribution. When no spectral fitting can be performed<br />
(data with a low signal-to-noise ratio), <strong>the</strong> color–color diagrams allow us to roughly estimate physical parameters, such as column<br />
density, temperature <strong>of</strong> <strong>the</strong> <strong>the</strong>rmal model, or spectral index for a power-law, and <strong>the</strong>refore to better constrain <strong>the</strong> origin <strong>of</strong> <strong>the</strong> X-<strong>ray</strong><br />
emission. The X-<strong>ray</strong> morphology, <strong>the</strong> spectra, and <strong>the</strong> color–color diagrams toge<strong>the</strong>r allow us to conclude that a high percentage<br />
<strong>of</strong> <strong>LINER</strong> galaxies, at least ≈60%, could host AGN nuclei, although contributions from high-mass X-<strong>ray</strong> binaries or ultra-luminous<br />
X-<strong>ray</strong> <strong>sources</strong> cannot be ruled out for some galaxies.<br />
Key words. galaxies: nuclei – X-<strong>ray</strong>s: galaxies – galaxies: active<br />
1. Introduction<br />
Active galactic nuclei (AGN) produce enormous luminosities in<br />
extremly compact volumes. Large luminosity variations on time<br />
scales from years to hours are common (e.g. Leighly 1999). The<br />
combination <strong>of</strong> high luminosity and short variability time scales<br />
implies that <strong>the</strong> power <strong>of</strong> AGN is produced by phenomena that<br />
are more efficient in terms <strong>of</strong> energy release per unit mass than<br />
ordinary stellar processes (Fabian 1979).<br />
A quantitative definition <strong>of</strong> what constitutes an active galaxy<br />
is perhaps not very useful, since galaxies showing low-level activity<br />
(e.g. Heckman 1980; Stauffer 1982; Hawley & Philips<br />
1980) may be in ei<strong>the</strong>r a pre- or post- eruptive stage, so may<br />
yield important clues into <strong>the</strong> origin and evolution <strong>of</strong> <strong>nuclear</strong><br />
activity. The question <strong>of</strong> whe<strong>the</strong>r similar unification ideas can<br />
also apply to low-luminosity AGNs (LLAGNs), which make up<br />
<strong>the</strong> vast majority <strong>of</strong> <strong>the</strong> AGN population, has been explored (see<br />
Barth 2002). In this sense, LLAGNs might constitute a perfect<br />
laboratory for investigating <strong>the</strong> connection between galaxies in<br />
which <strong>the</strong> central black holes are active and those in which <strong>the</strong>y<br />
are quiescent. However, such AGNs may be difficult to identify<br />
because <strong>of</strong> extinction (e.g. Keel 1980; Lawrence & Elvis 1982)<br />
or contamination by star-forming processes in circum<strong>nuclear</strong> regions<br />
(e.g. Véron et al. 1981). The number <strong>of</strong> weak AGNs increases<br />
every time deep searches are made. Heckman (1980, see<br />
also Heckman et al. 1980 and Ho et al. 1997) has shown that one<br />
third <strong>of</strong> a complete sample <strong>of</strong> “normal” galaxies exhibit signs <strong>of</strong><br />
<strong>nuclear</strong> activity.<br />
<strong>LINER</strong>s (low-ionization <strong>nuclear</strong> emission-line regions) were<br />
originally defined as a subclass <strong>of</strong> <strong>the</strong>se LLAGNs by Heckman<br />
(1980) and are characterized by optical spectra dominated by<br />
⋆ Appendix, Table 1–3 and 5–7 and full Figs. 3 and 5 are only available<br />
in electronic form at http://www.aanda.org<br />
emission lines <strong>of</strong> moderate intensities arising from gas in lower<br />
ionization states than classical AGNs. <strong>LINER</strong>s were defined as<br />
galaxies whose spectra satisfy [OII]λ3727/[OIII]λ5007 ≥ 1 and<br />
[OI]λ6300/[OIII]λ5007 ≥ 1/3 (Heckman 1980). These <strong>LINER</strong>s<br />
typically are less luminous than powerful Seyferts and QSOs. It<br />
is still unclear whe<strong>the</strong>r all <strong>LINER</strong>s are essential AGNs at all,<br />
but if <strong>LINER</strong>s represent <strong>the</strong> low-luminosity end <strong>of</strong> <strong>the</strong> AGN<br />
phenomenon, <strong>the</strong>y are <strong>the</strong> nearest and most common examples,<br />
and <strong>the</strong>ir study is essential for understanding AGN demographics<br />
and evolution. One fundamental question that needs to be<br />
addressed is whe<strong>the</strong>r <strong>the</strong> <strong>nuclear</strong> emission <strong>of</strong> <strong>the</strong>se galaxies results<br />
from starbursts or accretion onto super-massive black holes<br />
(SMBHs).<br />
The low luminosity <strong>of</strong> <strong>the</strong>se <strong>nuclear</strong> <strong>sources</strong> makes <strong>the</strong>m difficult<br />
targets for observational studies, even in very nearby galaxies.<br />
The origin <strong>of</strong> <strong>the</strong> optical narrow emission lines <strong>of</strong> <strong>LINER</strong>s<br />
has long been a source <strong>of</strong> controversy because <strong>the</strong> optical line<br />
ratios can be reproduced reasonably well by models based on a<br />
variety <strong>of</strong> different physical mechanisms, including shock heating<br />
(Fosbury et al. 1978; Dopita & Su<strong>the</strong>rland 1996), photoionization<br />
by a non stellar continuum (Ferland & Netzer 1983;<br />
Halpern & Steiner 1983), photo-ionization by a young starburst<br />
containing Wolf-Rayet stars (Filippenko & Halpern 1984;<br />
Terlevich & Melnick 1985; Barth & Shields 2000), or photoionization<br />
by hot stars (Filippenko & Terlevich 1992; Shields<br />
1992).<br />
One would expect that information coming from different<br />
spectral ranges could help disentangle and eventually classify<br />
<strong>the</strong> <strong>LINER</strong> family. However, <strong>the</strong> study <strong>of</strong> data at different wavelengths<br />
has provoked even more discussion. The UV imaging<br />
surveys by Barth et al. (1998) and Maoz et al. (2005) (also<br />
Pogge et al. 2000) found <strong>nuclear</strong> UV emission in ∼25% <strong>of</strong><br />
<strong>the</strong> <strong>LINER</strong>s that were observed. About half <strong>of</strong> <strong>the</strong>m appear<br />
Article published by EDP Sciences and available at http://www.aanda.org or http://dx.doi.org/10.1051/0004-6361:20054756
46 O. González-Martín et al.: X-<strong>ray</strong> <strong>nature</strong> <strong>of</strong> <strong>LINER</strong>s<br />
point-like at <strong>the</strong> resolution <strong>of</strong> HST and thus are good candidates<br />
for being genuine LLAGNs with non-stellar continua. Barth<br />
et al. (1998) show that <strong>the</strong> low UV detection rate is primarily due<br />
to dust obscuration <strong>of</strong> <strong>the</strong> nuclei. Thus, <strong>the</strong> majority <strong>of</strong> <strong>LINER</strong>s<br />
probably have UV <strong>sources</strong> in <strong>the</strong>ir nuclei (which could be ei<strong>the</strong>r<br />
AGNs or young-star clusters), but in most cases <strong>the</strong> UV <strong>sources</strong><br />
lie behind large amount <strong>of</strong> dust to render it visible. Therefore, <strong>the</strong><br />
foreground dust plays an important role in blocking our view <strong>of</strong><br />
<strong>the</strong> central engines. A UV-variability campaign that monitored<br />
17 known UV-bright <strong>LINER</strong>s by Maoz et al. (2005) found that<br />
almost all objects varied on ei<strong>the</strong>r short or long timescales, indicative<br />
<strong>of</strong> an AGN component.<br />
Since <strong>the</strong> nuclei <strong>of</strong> <strong>LINER</strong>s may be very heavily obscured,<br />
observations in UV, optical, near-infrared, and even <strong>the</strong> farinfrared<br />
may not penetrate <strong>the</strong> dust to reach <strong>the</strong> nucleus. The<br />
most important recent data constraining <strong>the</strong> <strong>nature</strong> <strong>of</strong> <strong>LINER</strong><br />
nuclei have come from radio and X-<strong>ray</strong>s surveys because it is<br />
possible in <strong>the</strong>se spectral regions to detect central engines that<br />
are completely obscured in <strong>the</strong> optical and UV. In a VLA survey,<br />
Nagar et al. (2000) found that 64% <strong>of</strong> <strong>LINER</strong> 1 and 36% <strong>of</strong><br />
<strong>LINER</strong> 2 have compact radio cores (Nagar et al. 2005). The objects<br />
bright enough for VLBI observations at 5 GHz were studied<br />
by Falcke et al. (2000, see also Filho et al. 2004); all showed<br />
compact, high-brightness-temperature cores, suggesting that an<br />
AGN, ra<strong>the</strong>r than a starburst, is responsible for <strong>the</strong> radio emission.<br />
Moreover, <strong>the</strong> core radio fluxes have been found to be variable<br />
by a factor <strong>of</strong> up to a few in about half <strong>of</strong> <strong>the</strong> ∼10 <strong>LINER</strong>s<br />
observed several different times over 3 years (Nagar et al. 2002).<br />
A radio survey looking for 1.3 cm water mega-maser emission,<br />
an indicator <strong>of</strong> dense circun<strong>nuclear</strong> molecular gas, detected<br />
<strong>LINER</strong> nuclei at <strong>the</strong> same rate as type 2 Seyfert nuclei (Braatz<br />
et al. 1997). Such mega-maser emission is seen only in AGNs.<br />
Some <strong>LINER</strong>s have indications <strong>of</strong> a Seyfert-like ionization cone<br />
oriented along <strong>the</strong>ir radio axis (Pogge et al. 2000).<br />
X-<strong>ray</strong> observations provide ano<strong>the</strong>r direct probe <strong>of</strong> <strong>the</strong> central<br />
engines. Pure starburst galaxies, at low redshift, do not<br />
exhibit unresolved hard X-<strong>ray</strong> (2.0–8.0 keV) nuclei. In contrast,<br />
starbursts such as M82 have extended hard X-<strong>ray</strong> emission<br />
from both diffuse gas and unresolved X-<strong>ray</strong> binaries (Griffiths<br />
et al. 2000). The detection <strong>of</strong> a hard X-<strong>ray</strong> continuum, as<br />
well as Fe K emission (Iyomoto et al. 1996; Ishisaki et al.<br />
1996; Terashima et al. 1998, 1999, 2000; Roberts et al. 1999;<br />
Jimenez-Bailon et al. 2005; Streblyanska et al. 2005), indicate<br />
AGN activity. Only a reduced number <strong>of</strong> X-<strong>ray</strong> observations <strong>of</strong><br />
<strong>LINER</strong> 2s have been performed so far. X-<strong>ray</strong> observations with<br />
Einstein and ROSAT were limited to s<strong>of</strong>t energies, where heavily<br />
obscured AGNs are difficult to detect. The ROSAT HRI images<br />
show compact s<strong>of</strong>t X-<strong>ray</strong> (≤2 keV) emission in 70% <strong>of</strong><br />
<strong>the</strong> <strong>LINER</strong>s and Seyfert galaxies (Roberts & Warwick 2000).<br />
Never<strong>the</strong>less, <strong>the</strong> lack <strong>of</strong> spectral information, low spatial resolution,<br />
and inadequate bandpass <strong>of</strong> <strong>the</strong>se observations cannot<br />
distinguish <strong>the</strong> <strong>the</strong>rmal emission <strong>of</strong> <strong>the</strong> host galaxy from<br />
<strong>the</strong> emission from <strong>the</strong> AGN. These problems are overcome by<br />
Chandra, whose spatial resolution is 10 times superior to that<br />
<strong>of</strong> <strong>the</strong> ROSAT HRI, thus allowing us to resolve <strong>the</strong> emission at<br />
lower physical sizes.<br />
In this paper we present a homogeneous analysis <strong>of</strong> a sample<br />
<strong>of</strong> <strong>LINER</strong>s observed by Chandra and examine <strong>the</strong> probable<br />
ionization mechanism in <strong>LINER</strong>s. The paper is organized as follows.<br />
In Sect. 2 we summarize <strong>the</strong> Chandra and HST observations<br />
and describe <strong>the</strong> galaxy sample. Image and spectral reduction<br />
and analysis <strong>of</strong> X-<strong>ray</strong> data and HST imaging are reported<br />
in Sect. 3. We discuss <strong>the</strong> origin <strong>of</strong> <strong>the</strong> X-<strong>ray</strong> emission in our<br />
sample in Sect. 4. Finally, a summary <strong>of</strong> our findings is presented<br />
in Sect. 5.<br />
2. The sample and <strong>the</strong> data<br />
The starting list for <strong>the</strong> sample selection has been <strong>the</strong> multiwavelength<br />
catalogue <strong>of</strong> <strong>LINER</strong>s (MCL) compiled by Carrillo<br />
et al. (1999). The MCL includes most <strong>of</strong> <strong>the</strong> <strong>LINER</strong> galaxies<br />
known until 1999, providing information on broad-band and<br />
monochromatic emission from radio frequencies to X-<strong>ray</strong>s for<br />
476 objects classified as <strong>LINER</strong>s. The initial galaxy sample was<br />
constructed by using <strong>the</strong> Chandra archive to select all <strong>the</strong> galaxies<br />
in MCL with Advanced CCD Imaging Spectrometer (ACIS 1 )<br />
observations already public in November 2004, which yielded a<br />
set <strong>of</strong> 137 out <strong>of</strong> <strong>the</strong> 476 galaxies.<br />
The optical classification was reanalyzed (by using<br />
<strong>the</strong> line-ratio diagrams by Veilleux & Osterbrock 1987),<br />
and 15 objects were eliminated from <strong>the</strong> sample due<br />
to misclassification in MCL; 5 <strong>of</strong> <strong>the</strong>m appear to be<br />
Starburst systems (NGC 1808, NGC 3077, ESO 148-IG002N,<br />
ESO 148-IG002S, and NGC 253), 6 are Seyfert-like galaxies<br />
(NGC 4258, MRK 0266SW, 3C452, NGC 4565, NGC 4501, and<br />
NGC 3079), and 4 are transition objects (NGC 0224, NGC 0404,<br />
AN 0248+43B, and NGC 4303). For <strong>the</strong> selected sample, we<br />
noticed that data with exposure times shorter than 10 ksec<br />
had less than 25 counts in <strong>the</strong> 0.5–10.0 keV energy range.<br />
Therefore, only data with longer exposure times were taken<br />
into account. The final sample, with high-quality data and optical<br />
re-identification as <strong>LINER</strong> nuclei, amounts to 51 objects.<br />
Almost all objects (except NGC 3607, NGC 3608, NGC 3690B,<br />
NGC 4636, NGC 5746, and NGC 6251) were observed with<br />
ACIS-S mode. The 51 galaxies were observed between August<br />
2000 and April 2004. A list <strong>of</strong> <strong>the</strong> objects, including <strong>the</strong> details<br />
<strong>of</strong> <strong>the</strong>ir observations, is provided in Table 1 in which<br />
name (Col. 1), X-<strong>ray</strong> position in right ascension and declination<br />
(Cols. 2 and 3), X-<strong>ray</strong> radii selected for <strong>the</strong> <strong>nuclear</strong> <strong>sources</strong><br />
(Col. 4) and <strong>of</strong>fset with respect to <strong>the</strong> 2MASS coordinates<br />
(Col. 5), Chandra Observational Identifier (Col. 6), and exposure<br />
time after removal <strong>of</strong> background flares (Col. 7) are given.<br />
The data provided in Table 2 were extracted from Carrillo<br />
et al. (1999) and include properties <strong>of</strong> <strong>the</strong> host galaxies such<br />
as: source name (Col. 1), redshift z (Col. 2), distances (Col. 3),<br />
spatial scale at <strong>the</strong> distance <strong>of</strong> <strong>the</strong> galaxy (Col. 4), source radii <strong>of</strong><br />
<strong>the</strong> selected X-<strong>ray</strong> <strong>nuclear</strong> source regions (Col. 5), B magnitude<br />
(Col. 6), E(B−V) (Col. 7), and morphological type (Col. 8). The<br />
codes for <strong>the</strong> assumed distances correspond to those extracted<br />
from (a) Ferrarese et al. (2000), (b) from assuming a cosmology<br />
with Ho = 75 km s −1 Mpc −1 and qo = 0, (c) Tonry et al. (2001),<br />
(d) Tully (1998), and (e) Karachentsev & Drodovsky (1998).<br />
In Fig. 1, from top to bottom, <strong>the</strong> normalized redshifts, morphological<br />
types and absolute and apparent magnitudes distributions<br />
are shown for <strong>the</strong> MCL catalogue (empty histogram)<br />
and <strong>the</strong> X-<strong>ray</strong> sample (filled histogram). In <strong>the</strong> MCL catalogue,<br />
<strong>the</strong> z distribution shows that most <strong>of</strong> <strong>the</strong> <strong>LINER</strong>s are hosted<br />
in nearby galaxies (Fig. 1a); <strong>the</strong> Hubble-type histogram shows<br />
that host galaxies <strong>of</strong> <strong>LINER</strong>s are mainly normal spirals (Fig. 1b)<br />
with a median B magnitude <strong>of</strong> MB = −20.0 ± 1.5 (Fig. 1c). It<br />
has to be noticed that, whereas <strong>the</strong> redshift and absolute magnitude<br />
distributions are very similar to those <strong>of</strong> <strong>the</strong> total sample,<br />
<strong>the</strong> X-<strong>ray</strong> selected sample resides mostly in <strong>the</strong> earliest<br />
1 Comprising two back-illuminated CCD chips and eight frontilluminated<br />
CCD chips <strong>of</strong> 1024 pixels square, with a plate scale <strong>of</strong><br />
0. ′′ 492 pixel −1 .
Nr.Gal./N_total<br />
Nr.Gal./N_total<br />
Nr.Gal./N_total<br />
Nr.Gal./N_total<br />
0.5<br />
0.4<br />
0.3<br />
0.2<br />
0.1<br />
0.0<br />
0.20<br />
0.15<br />
0.10<br />
0.05<br />
0.00<br />
0.05 0.10 0.15 0.20<br />
z<br />
-4 -2 0 2 4 6 8 10<br />
Morph. Type<br />
0.10<br />
0.08<br />
0.06<br />
0.04<br />
0.02<br />
0.00<br />
(c)<br />
-14 -16 -18 -20<br />
M_B<br />
-22 -24 -26<br />
0.15<br />
0.10<br />
0.05<br />
0.00<br />
8 9 10 11 12 13 14 15<br />
m_b<br />
Fig. 1. a) Redshift, b) morphological types (from <strong>the</strong> RC3 catalog: t < 0<br />
are for ellipticals, t = 0 for S0, t = 1 for Sa, t = 3 for Sb, t = 5 for<br />
Sc, t = 7 for Sd, and t > 8 for Irregulars), c) absolute magnitudes,<br />
and d) apparent magnitudes distribution for <strong>the</strong> total sample <strong>of</strong> <strong>LINER</strong>s<br />
in MCL (empty histogram) and for our X-<strong>ray</strong> sample (full histogram),<br />
normalized to <strong>the</strong> number <strong>of</strong> objects in each sample.<br />
Hubble-type galaxies. This bias might be produced by <strong>the</strong> way<br />
in which <strong>the</strong>se galaxies have been selected for observations: <strong>the</strong>y<br />
are part <strong>of</strong> guaranteed and open-time programs with differing<br />
scientific goals. In Fig. 1d <strong>the</strong> bias produced by <strong>the</strong> apparent<br />
magnitude selection can be seen. Most <strong>of</strong> <strong>the</strong> galaxies in <strong>the</strong> X<strong>ray</strong><br />
sample come from <strong>the</strong> bright <strong>LINER</strong> sample catalogued by<br />
Ho et al. (1997), but for some particular and peculiar cases that<br />
were observed because <strong>of</strong> <strong>the</strong>ir interest: NGC 6240, UGC 08696,<br />
and UGC 05101 belong to <strong>the</strong> class <strong>of</strong> ultra-luminous infrared<br />
galaxies (ULIRGs); CGCG 162-010 is <strong>the</strong> central cluster galaxy<br />
in Abell 1795; and NGC 0833 (Arp 318B) lies in a Hickson compact<br />
group, HCG 16. Therefore we believe that this sample can<br />
be considered representative only <strong>of</strong> <strong>the</strong> bright galaxy population<br />
but not for all <strong>the</strong> <strong>LINER</strong> population. It should be noticed,<br />
for instance, that <strong>the</strong> sample does not include <strong>the</strong> strong IR emitters,<br />
which seem to be a large percentage <strong>of</strong> all known <strong>LINER</strong>s<br />
(Veilleux et al. 1999; Masegosa & Márquez 2003); in fact, <strong>the</strong><br />
<strong>LINER</strong> galaxies in our X-<strong>ray</strong> sample with far IR data from <strong>the</strong><br />
IRAS Point Source Catalogue appear to be ra<strong>the</strong>r faint IR emitters<br />
with an average IR luminosity <strong>of</strong> 10 10 erg s −1 .<br />
Toge<strong>the</strong>r with Chandra X-<strong>ray</strong> data, we make use <strong>of</strong> <strong>the</strong> highresolution,<br />
optical information provided by HST imaging for our<br />
sample galaxies. Out <strong>of</strong> <strong>the</strong> total 51, 45 galaxies have been<br />
O. González-Martín et al.: X-<strong>ray</strong> <strong>nature</strong> <strong>of</strong> <strong>LINER</strong>s 47<br />
(a)<br />
(b)<br />
(d)<br />
observed with WFPC2 in several different programs, so with<br />
different filters and exposure times. The observations in <strong>the</strong> red<br />
broad filter F814W were selected (31 galaxies), but observations<br />
in o<strong>the</strong>r broad filters (mainly F606W and F702W) were used<br />
o<strong>the</strong>rwise. The summary <strong>of</strong> <strong>the</strong> selected data is given in Cols. 8,<br />
9, and 10 in Table 1, including filter, proposal identifier and exposure<br />
time <strong>of</strong> <strong>the</strong> archival data. In Sect. 3.2 <strong>the</strong> analysis <strong>of</strong> HST<br />
data is described.<br />
3. Data reduction and analysis<br />
3.1. X-<strong>ray</strong> data<br />
Level 2 event data from ACIS instrument were extracted from<br />
Chandra archive. The data products were analyzed in a uniform,<br />
self-consistent manner using <strong>the</strong> CXC Chandra Interactive<br />
Analysis <strong>of</strong> Observations (CIAO 2 ) s<strong>of</strong>tware version 3.1. The<br />
spectral analysis was performed with XSPEC 3 (version 11.3.2).<br />
Background “flares” (periods <strong>of</strong> enhanced count rate) can seriously<br />
affect <strong>the</strong> scientific value <strong>of</strong> an observation, increasing <strong>the</strong><br />
count rate by a factor <strong>of</strong> up to 100. These “flares” are due to lowenergy<br />
protons interacting with <strong>the</strong> detector. Such flares were<br />
observed everywhere in <strong>the</strong> orbit, including near <strong>the</strong> apogee, so<br />
<strong>the</strong>re cannot be due to <strong>the</strong> Van Allen belt effect. Images could be<br />
dominated by <strong>the</strong> background if time intervals affected by flares<br />
are not excluded. The exposure time was <strong>the</strong>refore processed<br />
to exclude background flares, using <strong>the</strong> task lc_clean.sl 4 in<br />
source-free sky regions <strong>of</strong> <strong>the</strong> same observation. For all observations<br />
(except NGC 4486, excluded in <strong>the</strong> spectral analysis),<br />
<strong>the</strong> <strong>nuclear</strong> counts were insufficient for photon pile-up to be<br />
significant.<br />
3.1.1. Spectral analysis<br />
To distinguish which emission mechanisms are involved in <strong>the</strong>se<br />
objects and to estimate <strong>the</strong> X-<strong>ray</strong> luminosity, a careful analysis<br />
<strong>of</strong> <strong>the</strong> spectra based on model fittings was performed. X-<strong>ray</strong><br />
luminosities in <strong>the</strong> hard band (2.0–10.0 keV) can o<strong>the</strong>rwise be<br />
estimated following Ho et al. (2001), who assume a power law<br />
with a spectral index <strong>of</strong> 1.8 for <strong>the</strong> SED. Since most <strong>of</strong> our objects<br />
show a clear compact <strong>nuclear</strong> source, suggestive <strong>of</strong> an AGN<br />
<strong>nature</strong>, large departures from a power-law index 1.8 are not expected<br />
(see Terashima 1999). Never<strong>the</strong>less, this approach has<br />
been shown to be too simplistic in some cases (i.e. NGC 3077,<br />
Ott et al. 2003), hence our attempt to calculate luminosities via<br />
<strong>the</strong> spectral fitting.<br />
To extract <strong>the</strong> <strong>nuclear</strong> spectra, we first determined <strong>the</strong> position<br />
<strong>of</strong> <strong>the</strong> <strong>nuclear</strong> <strong>sources</strong> as catalogued by near-IR observations<br />
from <strong>the</strong> Two Micron All Sky Survey (2MASS) (see Fig. 2).<br />
NGC 4636 and NGC 4676B were not found in <strong>the</strong> near-IR catalog,<br />
so <strong>the</strong>ir positions from NED were taken as reference.<br />
Nuclear spectra were extracted from a circular region centered<br />
in <strong>the</strong> object using regions defined to include as many <strong>of</strong><br />
<strong>the</strong> source photons as possible, but at <strong>the</strong> same time minimizing<br />
contamination from nearby <strong>sources</strong> and background. In order<br />
to determine appropriate source extraction, <strong>the</strong> radius <strong>of</strong> each<br />
source aperture on <strong>the</strong> detector was estimated as follows: (1)<br />
4–6 pixels for a single source, (2) 3–4 pixels for objects with<br />
few knots close to <strong>the</strong> nucleus to exclude nearby <strong>sources</strong>, and<br />
2 See http://asc.harvard.edu/ciao<br />
3 See http://cxc.heasarc.gsfc.nasa.gov/docs/<br />
xanadu/xspec/<br />
4 See http://cxc.harvard.edu/ciao/download/scripts/
48 O. González-Martín et al.: X-<strong>ray</strong> <strong>nature</strong> <strong>of</strong> <strong>LINER</strong>s<br />
Fig. 2. NGC 3379. (left): Smoo<strong>the</strong>d X-<strong>ray</strong> image from 0.9 to 1.2 keV<br />
and (right): <strong>the</strong> same image with K-band contours from 2MASS overplotted.<br />
(3) ≥6 pixels for <strong>sources</strong> dominated by diffuse emission, since a<br />
good signal-to-noise (S/N) is required for extracting <strong>the</strong> spectra.<br />
Positions from near-IR in 48 out <strong>of</strong> <strong>the</strong> 49 objects with 2MASS<br />
coordinates have been found to agree with <strong>the</strong> X-<strong>ray</strong> <strong>nuclear</strong><br />
position within <strong>the</strong> X-<strong>ray</strong> radii <strong>of</strong> <strong>the</strong> <strong>sources</strong>, consistent with<br />
<strong>the</strong> astrometry accuracy provided by <strong>the</strong>se data. The <strong>of</strong>fset for<br />
NGC 4696 is 7.5 ′′ , about double <strong>the</strong> size <strong>of</strong> <strong>the</strong> <strong>nuclear</strong> extraction,<br />
but NGC 4696 presents a complex morphology with a number<br />
<strong>of</strong> knots embedded in strong diffuse emission in <strong>the</strong> hard and<br />
s<strong>of</strong>t X-<strong>ray</strong> energies, making identification <strong>of</strong> <strong>the</strong> <strong>nuclear</strong> source<br />
ambiguous. X-<strong>ray</strong> radii and <strong>of</strong>fsets are included in Cols. 4 and 5<br />
in Table 1. The spatial regions sampled by <strong>the</strong> <strong>nuclear</strong> extractions<br />
generally cover <strong>the</strong> innermost 500 pc, but in a few cases (7)<br />
<strong>the</strong>y are larger than 1 kpc (see Col. 5 in Table 2). Never<strong>the</strong>less,<br />
<strong>the</strong> number <strong>of</strong> <strong>the</strong>se more distant objects is evenly distributed<br />
between AGN and SB candidates (see below,) and <strong>the</strong>refore no<br />
bias in <strong>the</strong> results is expected due to this effect.<br />
The background region is defined ei<strong>the</strong>r by a source-free circular<br />
annulus close to <strong>the</strong> nuclei (cases (1) and (3)) or by several<br />
circles around <strong>the</strong> <strong>sources</strong> (case (2)), in order both to take<br />
<strong>the</strong> spatial variations <strong>of</strong> <strong>the</strong> diffuse emission into account and to<br />
minimize effects related to <strong>the</strong> spatial variation <strong>of</strong> <strong>the</strong> CCD response.<br />
For each source, we extracted spectra from each <strong>of</strong> <strong>the</strong><br />
datasets. Response and ancillary response files were created using<br />
<strong>the</strong> CIAO mkacisrmf and mkwarf tools.<br />
The spectra were fitted using XSPEC v.11.3.2. To be able to<br />
use <strong>the</strong> χ 2 as <strong>the</strong> fit statistics, <strong>the</strong> spectra were binned to give a<br />
minimum <strong>of</strong> 20 counts per spectral bin before background subtraction.<br />
The task grppha included in FTOOLS s<strong>of</strong>tware has<br />
been used for this purpose. Of <strong>the</strong> 51 objects in our sample,<br />
23 fulfill this criterion (hereafter <strong>the</strong> spectral fitting (SF) subsample).<br />
In <strong>the</strong> SF we excluded any events with energies above<br />
10 keV or below 0.5 keV.<br />
Since our aim is to try to disentangle whe<strong>the</strong>r <strong>the</strong> emission<br />
mechanism might be due to an AGN or to star formation, two<br />
models were used: a single power-law and a single-temperature<br />
optically-thin plasma emission (MEKAL or Raymond Smith<br />
(Raymond & Smith 1977) model. For each object, five models<br />
were attempted: (1) power-law (PL), (2) Raymond-Smith (RS),<br />
(3) MEKAL (ME), (4) PL+RS, and (5) PL+ME. The power-law<br />
plus <strong>the</strong>rmal combinations (models 4 and 5) have been taken<br />
into account to include <strong>the</strong> possibility that <strong>the</strong> two emission<br />
mechanisms are relevant. We did not expect large differences<br />
between MEKAL and Raymond-Smith models. Fur<strong>the</strong>rmore,<br />
we included a photoelectric absorption law (called “phabs”<br />
in XSPEC s<strong>of</strong>tware) to fit <strong>the</strong> absorbers in <strong>the</strong> line <strong>of</strong> sight<br />
Fig. 3. The ACIS-S spectrum <strong>of</strong> NGC 6240 is shown in <strong>the</strong> top panel.<br />
The solid line corresponds to a power-law plus Raymond-Smith model.<br />
Residuals from <strong>the</strong> fitting are presented in <strong>the</strong> bottom panel.The spectral<br />
fitting for all <strong>the</strong> galaxies in <strong>the</strong> SF subsample are shown in <strong>the</strong><br />
electronic edition.<br />
with a cross section called “bcmc” by Balucinska-Church &<br />
McCammon (1992). To decide which is <strong>the</strong> best-fit model for<br />
each <strong>nuclear</strong> source, we selected <strong>the</strong> model that gives χ 2 reduced<br />
closer to 1. The results from <strong>the</strong> spectral fittings for <strong>the</strong> five models<br />
are given in Table 3, where Col. 1 indicates <strong>the</strong> name, Col. 2<br />
gives <strong>the</strong> model, and Cols. 3, 4, and 5 include <strong>the</strong> column density,<br />
spectral index and temperature, and <strong>the</strong> χ 2 over <strong>the</strong> degrees<br />
<strong>of</strong> freedom (d.o.f.) is indicated in Col. 6. The best model was<br />
chosen as that with <strong>the</strong> best χ 2 -reduced statistic. When a combination<br />
<strong>of</strong> power-law plus <strong>the</strong>rmal model is <strong>the</strong> best model, we<br />
used <strong>the</strong> ftest task to determine whe<strong>the</strong>r <strong>the</strong> inclusion <strong>of</strong> an additional<br />
component is needed or a single <strong>the</strong>rmal or power-law<br />
model could be a good fit for <strong>the</strong> spectrum. The selected model<br />
for each case is indicated by an asterisk in Col. 2.<br />
NGC 6240 was selected as a model example <strong>of</strong> <strong>the</strong> process<br />
since <strong>the</strong> number counts for this source guarantee that <strong>the</strong> errors<br />
in <strong>the</strong> fitting due to S/N are minimal. The resulting parameters<br />
for <strong>the</strong> different fittings <strong>of</strong> NGC 6240 are shown in Table 3. The<br />
best-fit model is a combination PL+RS (Fig. 3, top) with <strong>the</strong><br />
best χ 2 -reduced statistic (Fig. 3, bottom). The s<strong>of</strong>t X-<strong>ray</strong> spectrum<br />
(below 2 keV) shows clear sig<strong>nature</strong>s <strong>of</strong> <strong>the</strong>rmal emission<br />
well-described by a optically thin plasma, which probably originates<br />
in a powerful starburst. Strong, hard X-<strong>ray</strong> emission is also<br />
detected, and its spectrum above 3 keV is extremely flat.<br />
NGC 4261 was not included in <strong>the</strong> SF subsample due to <strong>the</strong><br />
spectral complexity that results in unphysical parameters for any<br />
<strong>of</strong> our five models. The fits are statistically acceptable for all <strong>the</strong><br />
remaining objects (χ2 ν ∼ 1), except in NGC 2681 (χ2ν = 0.54)<br />
= 1.43). The resulting fittings are plotted in<br />
and NGC 7130 (χ2 ν<br />
Fig. 3 in <strong>the</strong> electronic edition for <strong>the</strong> whole SF subsample.<br />
Only for NGC 6482 did <strong>the</strong> single <strong>the</strong>rmal model provide a<br />
statistically acceptable fit (χ2 ν ∼ 1). Therefore, in 22 <strong>of</strong> 23 objects<br />
<strong>the</strong> power-law component is needed to describe <strong>the</strong> hardenergy<br />
spectrum observed, indicating a non-negligible non<strong>the</strong>rmal<br />
contribution in our sample. Seven objects are described<br />
with a single power-law (NGC 3690B, NGC 4374, NGC 4395,<br />
NGC 4410A, NGC 5494, NGC 4696, NGC 5746). Although a<br />
combination <strong>of</strong> <strong>the</strong>rmal plus power law model gives smaller<br />
χ2 for NGC 3690B, NGC 4410B and NGC 5746, <strong>the</strong> <strong>the</strong>rmal<br />
component is not needed to describe <strong>the</strong>ir spectrum according<br />
to <strong>the</strong> ftest tool. Fur<strong>the</strong>rmore, <strong>the</strong> same spectral indices are<br />
found, including error bars, assuming a single power-law or a
Table 4. Result <strong>of</strong> <strong>the</strong> model fitting to <strong>the</strong> spectra <strong>of</strong> <strong>the</strong> SF subsample.<br />
The top line in each parameter corresponds to <strong>the</strong> whole sample<br />
<strong>of</strong> 24 objects, bottom-left shows <strong>the</strong> result in <strong>the</strong> AGN-like nuclei<br />
(19 objects), and bottom-right shows <strong>the</strong> result in <strong>the</strong> SB-like objects<br />
(5 objects).<br />
Mean (1) Median (2) Mean Std Dev. (3)<br />
AGN/SB AGN/SB AGN/SB<br />
Log(LX) 40.16 39.78 0.96<br />
40.22/39.93 40.07/39.54 1.03/0.64<br />
NH 0.35 0.12 0.35<br />
(10 22 cm −2 ) 0.40/0.15 0.14/0.12 0.41/0.06<br />
kT 0.64 0.66 0.17<br />
(keV) 0.59/0.77 0.66/0.78 0.17/0.18<br />
Γ 1.89 1.75 0.45<br />
1.73/2.62 1.74/2.44 0.32/0.82<br />
combination with a <strong>the</strong>rmal model (see Table 3). Never<strong>the</strong>less,<br />
in 15 out <strong>of</strong> 22 objects strong residuals remained at low energies<br />
indicating that a single power-law model was not completely satisfactory.<br />
In <strong>the</strong>se cases, a significant improvement was achieved<br />
when a power-law plus optically thin emission was considered,<br />
according to <strong>the</strong> ftest tool. It has to be noted that ME+PL and<br />
RS+PL with solar metallicity give <strong>the</strong> same fitted parameters<br />
within <strong>the</strong> error.<br />
Table 4 gives <strong>the</strong> mean (Col. 1), median (Col. 2), and mean<br />
standard deviation (Col. 3) for <strong>the</strong> logarithm <strong>of</strong> <strong>the</strong> 2–10 keV<br />
band luminosity, column density, temperature, and spectral index<br />
(<strong>the</strong> first row for each entry). Galactic absorptions can be<br />
derived from <strong>the</strong> HI map (Dickey & Lockman 1990) using <strong>the</strong><br />
nh tool provided by <strong>the</strong> HEASARC. The SF sample <strong>of</strong> <strong>LINER</strong>s<br />
with enough counts to constrain absorption, showed column densities<br />
exceeding <strong>the</strong> expected NH from HI map, ranging between<br />
(0.01–2.87)× 10 22 cm −2 , with a mean value <strong>of</strong> 3.5 × 10 20 cm −2 .<br />
Therefore it is very likely that <strong>LINER</strong>s generally are much more<br />
absorbed than <strong>the</strong> Galactic value indicated. The mean temperature<br />
from <strong>the</strong> SF subsample is kT = 0.64 ± 0.17 keV, while <strong>the</strong><br />
mean spectral index is Γ = 1.89 ± 0.45. The spectral fits provide<br />
2.0–10.0 keV unabsorbed luminosities for <strong>the</strong> SF subsample,<br />
<strong>the</strong>reby expanding a wide range between 1.4 × 10 38 erg s −1<br />
and 1.5 × 10 42 erg s −1 with a mean value <strong>of</strong> 1.4 × 10 40 erg s −1 .<br />
In order to get a luminosity estimation <strong>of</strong> <strong>the</strong> whole sample,<br />
we obtained a count rate to flux conversion factor between<br />
2.0–10.0 keV, assuming a power-law model with a spectral index<br />
<strong>of</strong> 1.8 and <strong>the</strong> Galactic interstellar absorption (3 × 10 20 cm −2 ).<br />
In Fig. 4, <strong>the</strong> estimated 2.0–10.0 keV luminosity <strong>of</strong> <strong>the</strong> SF subsample<br />
is plotted (Lestimated) against <strong>the</strong> value obtained from <strong>the</strong><br />
direct integration <strong>of</strong> <strong>the</strong> spectrum (Lfitted). The luminosities are<br />
correlated well, always less than a factor <strong>of</strong> 3 within <strong>the</strong> real luminosity.<br />
Monte Carlo simulations have granted confidence <strong>of</strong><br />
<strong>the</strong> proposed calibration at 95% level. We <strong>the</strong>refore inferred a<br />
self-consistent estimate <strong>of</strong> <strong>the</strong> 2.0–10.0 keV luminosities for <strong>the</strong><br />
whole sample, using <strong>the</strong> SED fitting for <strong>the</strong> SF subsample and<br />
from this calibration o<strong>the</strong>rwise. In Table 5 we list <strong>the</strong> 2–10 keV<br />
fluxes (Col. 2) and unabsorbed luminosities (Col. 3) <strong>of</strong> <strong>the</strong> <strong>nuclear</strong><br />
<strong>sources</strong> for <strong>the</strong> whole sample, using <strong>the</strong> empirical calibration<br />
(denoted by “e” in Col. 4) or <strong>the</strong> spectral fitting (denoted<br />
by “f” in Col. 4). In those cases where <strong>the</strong> flux and luminosity<br />
were obtained from <strong>the</strong> spectral fitting <strong>the</strong> estimated errors are<br />
also included.<br />
O. González-Martín et al.: X-<strong>ray</strong> <strong>nature</strong> <strong>of</strong> <strong>LINER</strong>s 49<br />
Log(L fitted (2-10 keV))<br />
42<br />
40<br />
38<br />
38 40 42<br />
Log(L estimated (2-10 keV))<br />
Fig. 4. Luminosities estimated assuming a power law with an spectral<br />
index <strong>of</strong> 1.8 (Log(Lx_estimated)) versus luminosities computed<br />
through <strong>the</strong> spectral fittings (Log(Lx_fitted)). Objects with <strong>the</strong> same results<br />
with both methods are shown with <strong>the</strong> continuous line; dashed<br />
lines are luminosities from our estimate, which are 3 times higher<br />
and lower than <strong>the</strong> luminosities from spectral fitting, respectively<br />
(Log(Lx_estimated) = Log(Lx_fitted) ± 0.48). SF subsample.<br />
3.1.2. Image analysis<br />
In order to gain insight into <strong>the</strong> emission mechanisms in <strong>the</strong><br />
whole sample, we studied <strong>the</strong> X-<strong>ray</strong> morphology <strong>of</strong> <strong>the</strong> <strong>sources</strong><br />
in six energy bands: 0.6–0.9, 0.9–1.2, 1.2–1.6, 1.6–2.0, 2.0–4.5,<br />
and 4.5–8.0 keV. The bands were chosen to maximize <strong>the</strong> detection,<br />
as well as to obtain a good characterization <strong>of</strong> <strong>the</strong> spectra,<br />
as is illustrated in <strong>the</strong> next section. In <strong>the</strong> last energy band<br />
(4.5–8.0 keV), <strong>the</strong> range from 6.0 to 7.0 keV was excluded to<br />
avoid possible contamination due to <strong>the</strong> FeK emission line (<strong>the</strong><br />
corresponding band will be called (4.5–8.0) ∗ hereafter). The<br />
most common emission features in <strong>the</strong> 2-10 keV band <strong>of</strong> AGN<br />
spectra are those <strong>of</strong> iron between 6.4–6.97 keV (depending on<br />
<strong>the</strong> ionization state <strong>of</strong> Fe), related to <strong>the</strong> reflexion in <strong>the</strong> accretion<br />
disk. Only 5 objects (NGC 5194, UGC 08696, NGC 6240,<br />
NGC 7130, and UGC 05101) have a point-like source after continuum<br />
extraction. Although UGC 08696 shows a compact <strong>nuclear</strong><br />
source in this energy band, it cannot be directly associated<br />
with an FeK line because it has a broad high-energy component<br />
(see Appendix <strong>of</strong> UGC 08696 for details).<br />
The images were adaptively smoo<strong>the</strong>d (<strong>the</strong> smoothing depends<br />
on <strong>the</strong> count rate <strong>of</strong> <strong>the</strong> pixel vicinity) with <strong>the</strong> CIAO task<br />
csmooth, using a fast Fourier transform algorithm and a minimum<br />
and maximum significance S/N level <strong>of</strong> 3 and 5, respectively.<br />
Smoothing algorithms are useful when <strong>the</strong> count-rate <strong>of</strong><br />
<strong>the</strong> diffuse emission is close to <strong>the</strong> background level. Adaptively<br />
smoo<strong>the</strong>d images were not used for any quantitative analysis, but<br />
only for a morphological classification. The images in <strong>the</strong> four<br />
bands 0.6–0.9, 1.6–2.0, 4.5–8.0 ∗ , and 6–7 keV are given in Fig. 5<br />
(for all <strong>the</strong> galaxies, see <strong>the</strong> electronic edition).<br />
Since we focus our attention on <strong>the</strong> <strong>nuclear</strong> <strong>sources</strong>, no<br />
attempt has been made to fully characterize <strong>the</strong> flux and <strong>the</strong><br />
spectral properties (when possible) <strong>of</strong> <strong>the</strong> extra-<strong>nuclear</strong> <strong>sources</strong>,<br />
whose study is beyond <strong>the</strong> scope <strong>of</strong> <strong>the</strong> paper. As a first insight<br />
into <strong>the</strong> <strong>nature</strong> <strong>of</strong> <strong>LINER</strong>s, we have taken <strong>the</strong> existence <strong>of</strong> an unresolved<br />
compact <strong>nuclear</strong> source in <strong>the</strong> hard band (4.5–8.0 keV)<br />
as evidence <strong>of</strong> an AGN. Of course, detection <strong>of</strong> broad emission
50 O. González-Martín et al.: X-<strong>ray</strong> <strong>nature</strong> <strong>of</strong> <strong>LINER</strong>s<br />
(a) NGC 4594<br />
(b) CGCG 162-010<br />
Fig. 5. Images a) for <strong>the</strong> AGN candidate NGC 4594 and b) for <strong>the</strong><br />
SB candidate CGCG 162-010. The top image corresponds to <strong>the</strong><br />
0.6–8.0 keV band without smoothing. The following 4 images correspond<br />
to <strong>the</strong> X-<strong>ray</strong> bands 0.6–0.9 (center-left), 1.6–2.0 (center-center),<br />
4.5–8.0* (centre-right) and 6.0–7.0 keV (bottom-left). The 2MASS image<br />
in Ks band is plotted in <strong>the</strong> center-bottom box. The enlarged view<br />
<strong>of</strong> <strong>the</strong> region marked as a rectangle in <strong>the</strong> top image is <strong>the</strong> sharp-divided<br />
HST optical image in <strong>the</strong> filter F814W (bottom-right). All <strong>the</strong> galaxies<br />
are presented in <strong>the</strong> electronic edition.<br />
lines at multi-wavelength observations will be needed to assess<br />
<strong>the</strong>ir <strong>nature</strong>. The sample has been grouped into 2 categories:<br />
– AGN candidates: We include all <strong>the</strong> galaxies with a<br />
clearly identified, unresolved <strong>nuclear</strong> source in <strong>the</strong> hard<br />
band (4.5–8.0)* keV. In Fig. 5a we show NGC 4594,<br />
Number <strong>of</strong> objects<br />
15<br />
10<br />
5<br />
median Log(Lx) = 39.6<br />
median Log(Lx(SB)) = 39.2<br />
median Log(Lx(AGN))= 40.1<br />
0<br />
34 36 38 40 42 44<br />
Log(Lx)<br />
Fig. 6. Luminosity (2–10 keV) histogram for our whole sample (empty<br />
histogram), objects classified as AGN candidates (grey histogram), and<br />
for SB candidates (dashed histogram). Median values are included.<br />
as an example <strong>of</strong> AGN candidate, where a clear pointlike<br />
source exists in <strong>the</strong> hardest band (center-left).<br />
Fifty nine percent (30/51) <strong>of</strong> our sample galaxies have<br />
been classified as AGN-like nuclei; <strong>the</strong> median luminosity<br />
is LX(2−10 keV) = 1.2 × 10 40 erg s −1 , whereas it is<br />
LX(2−10 keV) = 3.8 × 10 39 erg s −1 for <strong>the</strong> whole sample<br />
(Fig. 6).<br />
– Starburst candidates: Here we include all <strong>the</strong> objects without<br />
a clearly identifiable <strong>nuclear</strong> source in <strong>the</strong> hard band. In<br />
Fig. 5b we show <strong>the</strong> images <strong>of</strong> CGCG 162-010 as an example<br />
<strong>of</strong> <strong>the</strong>se systems. Note that <strong>the</strong>re does not appear to be a <strong>nuclear</strong><br />
source in <strong>the</strong> hardest energy band (center-left). Fourty<br />
one percent (21/51) <strong>of</strong> <strong>the</strong> sample <strong>of</strong> <strong>LINER</strong>s falls into<br />
this category. The median luminosity is LX(2−10 keV) =<br />
1.7 × 10 39 erg s −1 (Fig. 6).<br />
The classification <strong>of</strong> each object is included in Col. 6 in Table 5.<br />
The histogram <strong>of</strong> <strong>the</strong> derived X-<strong>ray</strong> luminosities for <strong>the</strong> two<br />
groups is presented in Fig. 6. The median luminosity is higher<br />
for AGN like nuclei (∼10 times), but a clear overlap exists in <strong>the</strong><br />
range ([10 37 −10 42 ] erg s −1 ). We do not find clearcut differences<br />
in luminosities between AGN and SB candidates.<br />
With respect to <strong>the</strong> SF subsample (see Table 4), <strong>the</strong> spectral<br />
index and its standard deviation in AGN-like (18/23) is<br />
Γ = 1.7 ± 0.3, and <strong>the</strong> temperature is kT = 0.6 ± 0.2 keV. In <strong>the</strong><br />
SF subsample, 5 objects have been classified as SB-like nuclei<br />
(namely, NGC 4438, NGC 4696, CGCG 162-010, NGC 5846,<br />
and NGC 6482). Excepting NGC 6482, fitted with a single <strong>the</strong>rmal<br />
model, all <strong>the</strong> objects were fitted by including a power-law<br />
component. The origin <strong>of</strong> this power-law contribution from <strong>the</strong><br />
presence <strong>of</strong> an AGN remains <strong>the</strong>refore an open possibility for<br />
our sample objects. A full discussion is made in Sect. 4 and in<br />
<strong>the</strong> Appendix for individual <strong>sources</strong>.<br />
3.1.3. Color–color diagrams<br />
We explored <strong>the</strong> possibility <strong>of</strong> using X-<strong>ray</strong> colors to obtain<br />
information about <strong>the</strong> emission mechanism in <strong>the</strong>se objects.<br />
Previous works have explored this possibility in an AGN sample<br />
(Ceballos & Barcons 1996), X-<strong>ray</strong> surveys <strong>of</strong> galaxies<br />
(Hasinger et al. 2001), X-<strong>ray</strong> source populations in galaxies<br />
(Grimm et al. 2005; Heinke et al. 2005), or diffuse emission<br />
in star-forming galaxies (Strickland et al. 2004). We built<br />
color–color diagrams, using different hardness ratios <strong>of</strong> <strong>the</strong> form<br />
Qi = (Hi − S i)/(Hi + S i) (i = A, B, C), with <strong>the</strong> same bands used
for imaging classification: S A = 0.6–0.9 keV, HA = 0.9–1.2 keV<br />
(QA), S B = 1.2–1.6 keV, HB = 1.6–2.0 keV (QB), and S C = 2.0–<br />
4.5 keV, HC = (4.5−8.0)* keV (QC). These six bands defining<br />
three hardness ratios were selected after verifying that <strong>the</strong>y are<br />
specially well-suited to maximize <strong>the</strong> differences between a <strong>the</strong>rmal<br />
plasma model and emission in <strong>the</strong> form <strong>of</strong> a power law;<br />
while at <strong>the</strong> low energy range (below 2 keV), <strong>the</strong> <strong>the</strong>rmal contribution<br />
becomes more significant, at higher energy ranges a larger<br />
flux is expected whenever <strong>the</strong> power law contribution is needed.<br />
The use <strong>of</strong> <strong>the</strong> same bands as for <strong>the</strong> imaging analysis allows direct<br />
quantification <strong>of</strong> <strong>the</strong> properties <strong>of</strong> <strong>the</strong> <strong>nuclear</strong> <strong>sources</strong> used<br />
for morphological classification.<br />
Counts were extracted directly from <strong>the</strong> source, and background<br />
event files described for <strong>the</strong> spectral extraction. Error<br />
bars were computed as one standard deviation in <strong>the</strong> count rates.<br />
Hardness ratios were calculated for all <strong>the</strong> bands in which <strong>the</strong><br />
measured error in <strong>the</strong> count rates were less than 80%.<br />
In Fig. 7 we plot QA versus QB (top), QB versus QC (centre),<br />
and QA versus QC (bottom). To compare <strong>the</strong> observed X-<strong>ray</strong><br />
colors <strong>of</strong> <strong>the</strong> <strong>sources</strong> with different spectral shapes, we computed<br />
<strong>the</strong> colors <strong>of</strong> pure power law, Raymond Smith model, and<br />
a combination <strong>of</strong> both models. In both models, photoelectric<br />
absorption by cold gas was included. For each column density<br />
(NH) and model parameter (Γ or kT) pair, XSPEC generated a<br />
model spectrum that was <strong>the</strong>n multiplied by <strong>the</strong> effective area<br />
at each energy (obtained from <strong>the</strong> response matrices for <strong>the</strong><br />
actual data) and sampled appropriately. The output was thus a<br />
model <strong>of</strong> <strong>the</strong> number <strong>of</strong> photons detected per second as a function<br />
<strong>of</strong> energy, which could be compared with <strong>the</strong> observations.<br />
These simulated data were <strong>the</strong>n used to calculate <strong>the</strong> hardness<br />
ratio <strong>of</strong> ACIS-S observations as a function <strong>of</strong> NH, Γ, and/or<br />
kT. Grids <strong>of</strong> points were determined for parameters Γ = 0.4−2.6<br />
and kT = 0.1–4.0 keV for <strong>the</strong> power law (Fig. 7 dark grey<br />
grid) and Raymond-Smith (Fig. 7 light grey grid) models, respectively,<br />
and for NH = [1−30] × 10 20 cm −2 in <strong>the</strong> single models.<br />
Several grids were computed in <strong>the</strong> combination model<br />
with NH = [10 20 , 10 21 , 10 22 , 10 23 ] cm −2 , with 50% <strong>of</strong> contribution<br />
from both models at 1 keV. Note that variation in <strong>the</strong> column<br />
density in <strong>the</strong> combination model result in a shifting <strong>of</strong> <strong>the</strong> grid<br />
up and right, with higher values at low energies (Fig. 7). This<br />
effect is smaller for low NH, but it is quite noticeable for higher<br />
column densities (NH > 10 22 cm −2 ). In Fig. 7, two combination<br />
models are given for NH = 10 20 cm −2 (left) and 10 22 cm −2<br />
respectively. Therefore, <strong>the</strong>se grids could help to distinguish<br />
whe<strong>the</strong>r <strong>the</strong>se objects are strongly obscured. For less energetic<br />
colors, both absorption effects and <strong>the</strong>rmal contribution become<br />
more important, thus both column density and temperature could<br />
be better estimated. The highest energetic color (QC) is better<br />
suited to estimate <strong>the</strong> power law contribution. Note that <strong>the</strong> grid<br />
<strong>of</strong> models were computed for ACIS-S observations, but for <strong>the</strong><br />
objects observed with ACIS-I (namely, NGC 3608, NGC 3690B,<br />
NGC 4636, NGC 5746, and NGC 6251) an arrow was included<br />
to represent <strong>the</strong> correction to be done to take <strong>the</strong> different sensitivities<br />
into account. This correction is important at low energies<br />
(i.e. QA) where <strong>the</strong> different sensitivity <strong>of</strong> both instruments become<br />
more important. The parameters were estimated with this<br />
correction. Although our grid <strong>of</strong> models has been computed for<br />
solar abundances, <strong>the</strong> variation between solar abundance and 0.2<br />
below solar abundance is always smaller than o<strong>the</strong>r effects (see<br />
Fig. 7).<br />
In Fig. 7 we plot QA versus QB (top), QB versus QC (center)<br />
and QA versus QC (bottom) for <strong>the</strong> subset <strong>of</strong> 42 <strong>sources</strong> for<br />
which <strong>the</strong> three Qi values are available. The resulting QA, QB,<br />
and QC values are given in Table 7.<br />
O. González-Martín et al.: X-<strong>ray</strong> <strong>nature</strong> <strong>of</strong> <strong>LINER</strong>s 51<br />
QB<br />
QC<br />
QC<br />
0.4<br />
0.2<br />
0.0<br />
-0.2<br />
-0.4<br />
-0.6<br />
AGN<br />
SB<br />
RS<br />
PL<br />
PL-RS<br />
0.2 Solar Abund<br />
1. Solar Abund<br />
-0.8<br />
-0.6 -0.4 -0.2 0.0 0.2 0.4 0.6 0.8<br />
QA<br />
-0.3<br />
-0.4<br />
-0.5<br />
-0.6<br />
-0.7<br />
-0.8<br />
AGN<br />
SB<br />
RS<br />
PL<br />
PL-RS<br />
0.2 Solar Abund<br />
-0.9<br />
1. Solar Abund<br />
-0.8 -0.6 -0.4 -0.2<br />
QB<br />
0.0 0.2 0.4<br />
-0.2<br />
-0.4<br />
-0.6<br />
-0.8<br />
0.4<br />
0.5<br />
0.4<br />
0.8<br />
1.2<br />
1.6<br />
2.0<br />
2.4<br />
2.6<br />
AGN<br />
SB<br />
0.6<br />
0.7<br />
0.2 Solar Abund<br />
1. Solar Abund<br />
0.8<br />
-0.6 -0.4 -0.2 0.0 0.2 0.4 0.6 0.8<br />
QA<br />
4.0<br />
1.0<br />
RS<br />
PL<br />
PL-RS<br />
Fig. 7. Color–color diagrams for an RS model (light-grey filled grid),<br />
PL model (dark-grey filled grid), and combination model (empty<br />
grid) for NH = 10 20 cm −2 (continuum line) and NH = 10 22 cm −2 (dashed<br />
line). Light-grey triangles are AGN-like objects and dark-grey circles<br />
are SB-like objects. NGC 6240 is plotted as a black star. The grids<br />
were calculated for Γ = 0.4 to 2.6 (from up to down) for PL model,<br />
for kT = 0.4 to 4.0 keV (from down to up in <strong>the</strong> <strong>the</strong>rmal model and<br />
from left to right in <strong>the</strong> combination model) for <strong>the</strong> RS model and<br />
NH = (0.5−30.) × 10 20 cm −2 (from left to right) in <strong>the</strong> single-model<br />
case.<br />
The reliability <strong>of</strong> hardness ratio diagrams can be tested by<br />
comparing <strong>the</strong>ir results with those given by <strong>the</strong> more conventional<br />
method <strong>of</strong> fitting models to <strong>the</strong> observed spectrum. For<br />
this comparison, we used first <strong>the</strong> bright source NGC 6240
52 O. González-Martín et al.: X-<strong>ray</strong> <strong>nature</strong> <strong>of</strong> <strong>LINER</strong>s<br />
(Fig. 7), since we determined <strong>the</strong> spectral parameters from<br />
<strong>the</strong> spectral fitting with high reliability. Considering <strong>the</strong> error<br />
bars, <strong>the</strong> spectral index estimated from color diagrams is Γ =<br />
[0.8−1.0], <strong>the</strong> temperature is kT = 0.7−0.8 keV, and <strong>the</strong> column<br />
density may be high (NH ∼ 10 22 cm −2 ). From <strong>the</strong> spectral fitting<br />
parameters we have obtained Γ = 1.03 +0.14<br />
−0.15 , kT = 0.76+0.06<br />
−0.06 keV,<br />
and NH = 1.1 +0.1<br />
−0.1 × 1022 cm−2 , well within <strong>the</strong> range <strong>of</strong> values<br />
provided by <strong>the</strong> estimation from <strong>the</strong> color–color diagrams.<br />
The method has <strong>the</strong>n been tested with <strong>the</strong> SF subsample. The<br />
parameters estimated from color–color diagrams are included in<br />
Table 6, where <strong>the</strong> name is shown in Col. 1; SB/AGN classification<br />
is shown in Col. 2; <strong>the</strong> chosen model is included in Col. 3<br />
for <strong>the</strong> objects in <strong>the</strong> SF subsample, <strong>the</strong> absorbed column density<br />
from <strong>the</strong> fitted spectra (Col. 4) or color–color diagram estimation<br />
(Col. 5); as well as power law index (Cols. 6 and 7); and temperature<br />
(Cols. 8 and 9). Note that <strong>the</strong> column density estimation<br />
from color–color diagrams has been included as “∼1022 ” only<br />
those cases where color–color diagrams provide a clear indication<br />
<strong>of</strong> high obscuration.<br />
Seventeen objects (12 SB-like and 5 AGN candidates) do not<br />
have any estimation from <strong>the</strong> color–color diagrams. 9 <strong>of</strong> <strong>the</strong>m<br />
have large errors in <strong>the</strong> highest energy band, and consequently<br />
QC is not reliable enough. The remaining 8 objects (ARP 318B,<br />
NGC 1052, NGC 4395, NGC 4494, MRK 266NE, UGC 08696,<br />
NGC 5866 and NGC 6482) fall out from at least two <strong>of</strong><br />
<strong>the</strong> three color–color diagrams: NGC 1052, MRK 0266NE and<br />
UGC 08696 have a too high value for QC (>0.3), most probably<br />
due to <strong>the</strong> contamination <strong>of</strong> jet-related X-<strong>ray</strong> emission (see<br />
Appendix on <strong>the</strong> individual <strong>sources</strong>). ARP 318B, NGC 4494 and<br />
NGC 6482 are out <strong>of</strong> <strong>the</strong> grid because <strong>of</strong> low values <strong>of</strong> QC;<br />
NGC 6482 is <strong>the</strong> only galaxy resulting to be best fitted by a single<br />
<strong>the</strong>rmal component, and its position in <strong>the</strong> color–color diagrams<br />
is indeed closer to <strong>the</strong> <strong>the</strong>rmal model. The situation for<br />
<strong>the</strong> o<strong>the</strong>r two galaxies, NGC 4395 and NGC 5866, is however<br />
less clear.<br />
Figure 8 (top) shows <strong>the</strong> comparison <strong>of</strong> <strong>the</strong> temperature obtained<br />
from <strong>the</strong> spectral fitting with that estimated from color–<br />
color diagrams. Excepting NGC 0315, NGC 6251 and IC 1459<br />
that show temperatures estimated from color–color diagrams<br />
much higher than <strong>the</strong> fitted ones, it can be concluded that<br />
color–color diagrams provide a good temperature estimation.<br />
NGC 0315 has been fitted by Donato et al. (2004) with kT =<br />
0.51 keV, much closer to our estimated temperature. Considering<br />
<strong>the</strong> extended structure and <strong>the</strong> jet-like emission in this galaxy,<br />
differences in <strong>the</strong> background subtraction methods may explain<br />
such a discrepancy. Note that NGC 6251 and IC 1459 are <strong>the</strong><br />
only galaxies for which PL+RS and PL+MEKAL fitting provide<br />
very different values <strong>of</strong> kT; even if PL+MEKAL model is<br />
selected in <strong>the</strong>se cases, <strong>the</strong> statistical estimator is not so sharp<br />
and, if a PL+RS is considered, <strong>the</strong> resulting temperatures are in<br />
good agreement with <strong>the</strong> estimated ones.<br />
Figure 8 (bottom) shows <strong>the</strong> spectral index correlation between<br />
<strong>the</strong> values from <strong>the</strong> spectral fitting versus those estimated<br />
from color–color diagrams. The spectral indices estimated from<br />
<strong>the</strong> color–color diagrams result to be somewhat underestimated,<br />
but within less than 40% <strong>of</strong> <strong>the</strong> fitted values, excepting for<br />
NGC 5194 and NGC 7130, for which <strong>the</strong> fitted values are ra<strong>the</strong>r<br />
unrealistic.<br />
All <strong>the</strong> estimated column densities corresponds with <strong>the</strong><br />
fitted ones.<br />
Therefore, it seems reasonable to conclude that <strong>the</strong> information<br />
provided by color–color diagrams can be used as a rough<br />
estimate <strong>of</strong> <strong>the</strong> physical parameters describing <strong>the</strong> X-<strong>ray</strong> SED <strong>of</strong><br />
Temp estimated (keV)<br />
Index estimated<br />
1.0<br />
0.8<br />
0.6<br />
0.4<br />
2<br />
1<br />
NGC0315<br />
NGC6251<br />
IC1459<br />
0.2 0.4 0.6 0.8 1.0<br />
Temp fitted (keV)<br />
NGC7130<br />
NGC5194<br />
1 2 3<br />
Index fitted<br />
Fig. 8. Temperature (top) and spectral index (bottom) comparison between<br />
estimated from color–color diagram values and fitted values.<br />
Objects with large departures from <strong>the</strong> fitted value have been included<br />
with <strong>the</strong> names. Details are given in <strong>the</strong> text.<br />
our targets, this method being specially valuable for <strong>the</strong> objects<br />
where no spectral fitting can be made.<br />
For <strong>the</strong> whole sample, <strong>the</strong> main general conclusion from <strong>the</strong><br />
diagrams in Fig. 7 is that <strong>the</strong> spectra <strong>of</strong> <strong>LINER</strong>s cannot be described<br />
in general by a single power law. At least two components<br />
are needed: a hard power law and a s<strong>of</strong>t component represented<br />
by a <strong>the</strong>rmal model. We find that <strong>the</strong> best fit MEKAL<br />
model for a s<strong>of</strong>t component in most <strong>of</strong> <strong>LINER</strong> galaxies has kT<br />
between 0.6–0.8 keV and it appears quite clearly that an AGN<br />
power law component may be needed for most <strong>of</strong> <strong>the</strong>m, since<br />
QC values are in general too high for a <strong>the</strong>rmal emission. In particular,<br />
AGN-like nuclei show systematically high QC values;<br />
SB-like nuclei mostly fall in <strong>the</strong> power law region as well. This<br />
result fur<strong>the</strong>r emphasizes that <strong>the</strong> AGN contribution in our sample<br />
<strong>of</strong> <strong>LINER</strong> galaxies might be ra<strong>the</strong>r important.<br />
3.2. HST-imaging analysis<br />
To gain some insight into <strong>the</strong> <strong>nature</strong> <strong>of</strong> <strong>the</strong> X-<strong>ray</strong> emission, especially<br />
for <strong>the</strong> <strong>LINER</strong>s without a detected compact component,<br />
we have searched for <strong>the</strong> optical counterpart <strong>of</strong> <strong>the</strong> X-<strong>ray</strong> compact<br />
<strong>sources</strong>. The high spatial resolution provided by HST observations<br />
is needed for our purposes. In order not to make our
analysis dependent on <strong>the</strong> model used for describing <strong>the</strong> underlying<br />
host galaxy, we have decided to remove such a contribution<br />
by applying <strong>the</strong> sharp-dividing method to <strong>the</strong> original HST images.<br />
This technique has been proved to be very well suited to<br />
remove large-scale galactic components and <strong>the</strong>refore is a very<br />
convenient way to look for subtle, small-scale variations and discuss<br />
<strong>the</strong> possible presence <strong>of</strong> both dust extinguished and more<br />
luminous regions (S<strong>of</strong>ue et al. 1994; Márquez & Moles 1996;<br />
Márquez et al. 2003 and references <strong>the</strong>rein; Erwin & Sparke<br />
1999; Laine et al. 1999). It consists on applying a filtering to<br />
<strong>the</strong> original image, with a box size several times that <strong>of</strong> <strong>the</strong><br />
PSF FWHM, and <strong>the</strong>n dividing <strong>the</strong> original image by <strong>the</strong> filtered<br />
one. The resulting so-called sharp-divided images are plotted in<br />
Fig. 5 (bottom-right). We note that absolute astrometry has been<br />
performed by using <strong>the</strong> position <strong>of</strong> <strong>the</strong> coordinates <strong>of</strong> those objects<br />
in <strong>the</strong> images cataloged by USNO, excepting NGC 4410,<br />
NGC 4596 and NGC 4696 for with <strong>the</strong> position <strong>of</strong> <strong>the</strong> central<br />
galaxy had to be taken from <strong>the</strong> RC3 catalogue due to <strong>the</strong> lack<br />
<strong>of</strong> reference stars.<br />
According to <strong>the</strong> appearance <strong>of</strong> <strong>the</strong> central regions, two main<br />
groups can be distinguished: (a) galaxies with compact <strong>nuclear</strong><br />
<strong>sources</strong>, when a knot coincident with <strong>the</strong> central X-<strong>ray</strong> source is<br />
detected in <strong>the</strong> sharp-divided image (see for instance Fig. 5 for<br />
NGC4552) (C in Col. 7, Table 5); 35 objects fall into this category;<br />
and (b) galaxies with dusty <strong>nuclear</strong> regions, when dustlanes<br />
like features are seen but no central knot is detected (see<br />
for instance Fig. 5 for NGC 4438) (D in Col. 7, in Table 5)<br />
with 8 objects belonging to this class. Two galaxies, namely<br />
NGC 3608 and NGC 4636, cannot be classified because <strong>of</strong> saturation<br />
or ra<strong>the</strong>r low S/N.<br />
4. Discussion<br />
According to <strong>the</strong>ir X-<strong>ray</strong> morphologies in <strong>the</strong> hard band<br />
(4.5–8 ∗ keV), <strong>the</strong> <strong>LINER</strong> galaxies in our sample were classified<br />
into two broad main categories. We defined AGN-like nuclei as<br />
those objects displaying a hard <strong>nuclear</strong> point source, coincident<br />
with a 2MASS position <strong>of</strong> <strong>the</strong> nucleus. Of <strong>the</strong> 51 galaxies in <strong>the</strong><br />
<strong>LINER</strong> sample, 30 meet this criterion (59%). We called SB candidates<br />
those lacking a hard <strong>nuclear</strong> source because <strong>the</strong>y ei<strong>the</strong>r<br />
1) lack an energetically significant AGN or 2) contain highly obscured<br />
AGN with column densities higher than ∼10 23 cm −2 . Ho<br />
et al. (2001) classify <strong>the</strong> X <strong>ray</strong> morphology into four categories:<br />
class (I) objects exhibit a dominant hard <strong>nuclear</strong> point source<br />
(2–10 keV), class (II) objects exhibit multiple hard <strong>of</strong>f-<strong>nuclear</strong><br />
point <strong>sources</strong> <strong>of</strong> comparable brightness to <strong>the</strong> <strong>nuclear</strong> source,<br />
class (III) objects reveal a hard <strong>nuclear</strong> point source embedded<br />
in s<strong>of</strong>t diffuse emission, and class (IV) objects display no <strong>nuclear</strong><br />
source. Dudik et al. (2005) analyzed a sample <strong>of</strong> IR-Bright<br />
<strong>LINER</strong>s and classified <strong>the</strong> objects following <strong>the</strong> same scheme.<br />
Because we can assimilate classes (I) and (III) into our group<br />
<strong>of</strong> AGN-candidates and that <strong>the</strong>ir class (II) is equivalent to our<br />
SB candidates, <strong>the</strong>y obtained similar percentages <strong>of</strong> AGN-like<br />
objects since 51% (28/55) <strong>of</strong> <strong>the</strong>ir <strong>LINER</strong>s fall into classes (I)<br />
and (III), and 13% (7/55) were classified as belonging to class<br />
(IV). A detailed comparison <strong>of</strong> <strong>the</strong> 18 galaxies in common shows<br />
that 15 objects share <strong>the</strong> same classification. The odd classification<br />
for <strong>the</strong> remaining three nuclei (NGC 3628, NGC 4696, and<br />
CGCG 162-010) can be attributed to our use <strong>of</strong> a harder X-<strong>ray</strong><br />
band for <strong>the</strong> detection <strong>of</strong> unresolved <strong>nuclear</strong> <strong>sources</strong>.<br />
As seen in Fig. 6, <strong>the</strong> 2–10 keV luminosities <strong>of</strong> <strong>the</strong><br />
AGN-like in our <strong>LINER</strong> sample range from 10 37 erg s −1 to<br />
10 43 erg s −1 , while SB-like luminosities range from 10 37 erg s −1<br />
to 10 42 erg s −1 and both classifications overlap in <strong>the</strong> range<br />
O. González-Martín et al.: X-<strong>ray</strong> <strong>nature</strong> <strong>of</strong> <strong>LINER</strong>s 53<br />
10 37 erg s −1 to 10 42 erg s −1 . The 2–10 keV X-<strong>ray</strong> luminosities<br />
were calculated by fitting <strong>the</strong> SED between 0.5–10 keV in <strong>the</strong><br />
SF subsample and assuming a generic power-law model with<br />
photon index Γ = 1.8 and <strong>the</strong> Galactic absorption o<strong>the</strong>rwise. A<br />
similar method is proposed by Ho et al. (2001) who used an empirical<br />
estimate from <strong>the</strong> count rates. Satyapal et al. (2005), by<br />
using Ho estimate <strong>of</strong> <strong>the</strong> luminosity, have found a range in luminosities<br />
from ∼2×10 38 to ∼1×10 44 erg s −1 for <strong>the</strong> AGN <strong>LINER</strong>s.<br />
For <strong>the</strong> 31 objects in common, <strong>the</strong> resulting luminosities agree<br />
within <strong>the</strong> errors but only for 3 objects. The differences can be<br />
attributed to <strong>the</strong> presence <strong>of</strong> bright FeK lines in <strong>the</strong> spectra <strong>of</strong><br />
NGC 5194 and NGC 6240; this is clearly <strong>the</strong> case for NGC 6240,<br />
with <strong>the</strong> highest luminosity <strong>the</strong>y derive (Vignati et al. 1999 obtain<br />
∼1 × 10 44 erg s −1 once <strong>the</strong> FeK line contribution is included<br />
in <strong>the</strong> fit as a Gaussian component). For NGC 3245 <strong>the</strong> luminosity<br />
we estimate is much fainter than <strong>the</strong> one given by <strong>the</strong>m; we<br />
stress however that our estimation agrees very well with that <strong>of</strong><br />
Filho et al. (2004) (see Appendix).<br />
We found that <strong>LINER</strong> X-<strong>ray</strong> SED can be interpreted as a<br />
combination <strong>of</strong> a s<strong>of</strong>t <strong>the</strong>rmal component with temperatures <strong>of</strong><br />
about 0.6–0.8 keV, maybe due to circum<strong>nuclear</strong> star formation<br />
and a hard power law produced by an obscured AGN. Regarding<br />
<strong>the</strong> s<strong>of</strong>t component, Ptak et al. (1999) based on ASCA data<br />
found that similar models apply to starbursts that usually show<br />
a temperature higher than 0.6 keV. This result is confirmed with<br />
Chandra observations for starburst galaxies by Ott et al. (2005)<br />
and Grimes et al. (2005), while Teng et al. (2005) find that<br />
<strong>the</strong> best-fit MEKAL model for <strong>the</strong> s<strong>of</strong>t component in Seyfert<br />
1 galaxies has kT ∼ 0.25 keV and that <strong>the</strong> low temperatures <strong>of</strong><br />
<strong>the</strong> Seyfert 1 galaxies suggest that starburst activity may not be<br />
<strong>the</strong> dominant energy source <strong>of</strong> <strong>the</strong> s<strong>of</strong>t component. The same<br />
conclusion was made by Boller et al. (2002) for F01572+0009.<br />
<strong>LINER</strong> nuclei have similar values to what we expect in starbursts,<br />
indicating that star formation activity may be <strong>the</strong> dominant<br />
energy source <strong>of</strong> <strong>the</strong> s<strong>of</strong>t component. Except in 2 objects<br />
(NGC 0315 and IC 1459), <strong>the</strong> temperature obtained from <strong>the</strong><br />
spectral fit is about 0.6 keV, <strong>the</strong>refore hinting that a starburst<br />
component can be inferred in most cases. The spectral index<br />
in <strong>the</strong> sample galaxies for which <strong>the</strong> power-law component is<br />
needed to fit spectra (22 objects) range from ∼1.0 till 4.3 with a<br />
mean value <strong>of</strong> 1.9 (see Table 4 for a detailed analysis). In 3 out<br />
<strong>of</strong> 22 objects (NGC 4494, NGC 5746, and NGC 6240), <strong>the</strong> slope<br />
tends to be significantly flatter (Γ < 1.4) than what is typically<br />
observed in AGNs. Ptak et al. (2003) explain this flattening in<br />
a Compton-thick scenario as due to a combination <strong>of</strong> reflection<br />
from optically thick central material, scattering from opticallythin<br />
(unlikely to be highly ionized) material and leakage <strong>of</strong> X-<strong>ray</strong><br />
through patches in <strong>the</strong> obscuring material. Never<strong>the</strong>less, we recall<br />
that simple models have been used to test <strong>the</strong> need <strong>of</strong> powerlaw<br />
and/or <strong>the</strong>rmal components to fit <strong>the</strong>se spectra, and some<br />
artifacts may be consequently produced for more complex situations<br />
where <strong>the</strong> presence <strong>of</strong> several components is absolutely<br />
needed to explain <strong>the</strong> spectral features.<br />
Our sample can be compared to X-<strong>ray</strong> observations <strong>of</strong> nearby<br />
Seyfert 2 galaxies. In <strong>the</strong>ir recent survey <strong>of</strong> nearby Seyfert galaxies<br />
taken from <strong>the</strong> compilation by Ho et al. (1997), Cappi et al.<br />
(2006) analyze Chandra data for 27 Seyfert 1 and 2 galaxies<br />
(mainly Seyfert 2), obtaining values for <strong>the</strong> power-law index<br />
<strong>of</strong> 1.56 for type 1 Seyfert and 1.61 for type 2, which are not<br />
too far from our quoted median value for <strong>LINER</strong>s (1.75 ± 0.45).<br />
Their most remarkable result is that <strong>the</strong> range <strong>of</strong> column densities<br />
<strong>the</strong>y find for Seyferts is quite similar to what we find for<br />
<strong>LINER</strong>s, with NH between 10 20 and 10 22 cm −2 . Finally, when a<br />
<strong>the</strong>rmal component is needed (in 15 out <strong>of</strong> <strong>the</strong> 27 galaxies), kT
54 O. González-Martín et al.: X-<strong>ray</strong> <strong>nature</strong> <strong>of</strong> <strong>LINER</strong>s<br />
is found in <strong>the</strong> range between 0.2–0.8 keV, as is <strong>the</strong> case for our<br />
<strong>LINER</strong>s, although <strong>the</strong>ir spectral fitting technique is quite different<br />
from ours: <strong>the</strong>y fit <strong>the</strong> spectra between 2–10 keV by a single<br />
power law, and <strong>the</strong>n a <strong>the</strong>rmal component is added to <strong>the</strong><br />
cases where <strong>the</strong> extrapolation from <strong>the</strong> power law to lower energies<br />
(below 2 keV) results in a s<strong>of</strong>t excess. The mean value<br />
for <strong>the</strong>ir (2–10 keV) luminosities (10 39.8 ergs s −1 for Seyfert 2<br />
and 10 41 ergs s −1 for Seyfert 1) is also in good agreement with<br />
our estimated mean value (10 40.16 erg s −1 ). These results are at<br />
variance with those by Guainazzi et al. (2005), with luminosities<br />
higher than 10 41 ergs s −1 for a sample <strong>of</strong> 49 Seyfert 2. Note, however,<br />
that <strong>the</strong>ir galaxies are more heavily obscured than those in<br />
<strong>the</strong> analysis by Cappi et al. On <strong>the</strong> o<strong>the</strong>r hand, <strong>the</strong> comparison <strong>of</strong><br />
our data with those reported by Mateos et al. (2005) and Gallo<br />
et al. (2006) for galaxies at higher redshifts, results in powerlaw<br />
spectral indices fully consistent with ours: note that, even if<br />
<strong>the</strong>ir galaxies are more luminous, more obscured objects, <strong>the</strong>y<br />
obtain Γ values varying between 1.7 for AGN type 1 and 1.9 for<br />
type 2 AGNs. Hence this comparison leads to <strong>the</strong> conclusion that<br />
it is not clear whe<strong>the</strong>r <strong>LINER</strong>s in <strong>the</strong> X-<strong>ray</strong> represent a lower<br />
scaled version <strong>of</strong> AGN activity. For a more definitive conclusion,<br />
a full, homogeneous analysis using <strong>the</strong> same methodology<br />
and similar selection criteria is <strong>the</strong>refore needed. In this respect,<br />
we have collected archival X-<strong>ray</strong> data for a sample <strong>of</strong> Seyfert<br />
galaxies that will be studied with <strong>the</strong> same methods we used for<br />
<strong>LINER</strong>s, and <strong>the</strong>ir analysis will be <strong>the</strong> subject <strong>of</strong> a forthcoming<br />
paper.<br />
To gain some insight into <strong>the</strong> <strong>nature</strong> <strong>of</strong> <strong>the</strong> X-<strong>ray</strong> emission,<br />
especially for <strong>the</strong> <strong>LINER</strong>s without a detected compact component,<br />
we searched for <strong>the</strong> optical counterpart <strong>of</strong> <strong>the</strong> X-<strong>ray</strong><br />
compact <strong>sources</strong>. We note that all <strong>the</strong> galaxies classified as<br />
AGN by <strong>the</strong>ir X-<strong>ray</strong> imaging show compact nuclei (28 galaxies).<br />
Among those showing SB X-<strong>ray</strong> morphology (17 objects),<br />
8 galaxies (NGC 3507, NGC 3607, NGC 4438, NGC 4676A,<br />
NGC 4676B, NGC 4698, CGCG 162-010, and NGC 5846) show<br />
dusty <strong>nuclear</strong> <strong>sources</strong>; 5 out <strong>of</strong> 8 showing low column densities<br />
and 3 (NGC 3507, NGC 3607, NGC 4676B) without any estimated<br />
column density. The remaining 7 galaxies classified as<br />
SB candidates never<strong>the</strong>less host compact <strong>nuclear</strong> <strong>sources</strong> in <strong>the</strong><br />
optical (namely NGC 3245, NGC 3379, NGC 4314, NGC 4459,<br />
NGC 4596, NGC 4696, and NGC 7331). Both NGC 3608 and<br />
NGC 4636 remain unclassified. We stress that NGC 4696 is obscured<br />
at X-<strong>ray</strong>s (like some <strong>of</strong> <strong>the</strong> objects in Chiaberge et al.<br />
2005), so in this case <strong>the</strong> AGN would only be visible in <strong>the</strong> optical;<br />
i.e., a low optical extinction has to be coupled with a relatively<br />
high X-<strong>ray</strong> column density. This kind <strong>of</strong> situation might<br />
be explained by, e.g., unusual dust-to-gas ratios (Granato et al.<br />
1997) or by <strong>the</strong> properties <strong>of</strong> <strong>the</strong> dust grains (Maiolino 2001).<br />
Moreover, in NGC 4696 a broad balmer Hα line was detected by<br />
Ho et al. (1997). NGC 3245 also shows evidence <strong>of</strong> its AGN <strong>nature</strong><br />
from <strong>the</strong> optical, with double-peaked Hα and [NII] pr<strong>of</strong>iles<br />
indicative <strong>of</strong> <strong>the</strong> presence <strong>of</strong> spatially unresolved rapid rotation<br />
near <strong>the</strong> nucleus (Barth et al. 2001) and <strong>the</strong> radio frequencies,<br />
where an unresolved <strong>nuclear</strong> radio source is detected (Wrobel<br />
& Heeschen 1991). Unresolved <strong>nuclear</strong> radio cores have also<br />
been found for NGC 7331 (Cowan et al. 1994) and NGC 4314<br />
(Chiaberge et al. 2005). For NGC 4596, Sarzi et al. (2001) have<br />
determined a black hole mass <strong>of</strong> 7.8 × 10 7 M⊙ from an STIS<br />
kinematic analysis <strong>of</strong> <strong>the</strong> source. Thus it appears that even in<br />
<strong>the</strong> cases we called SB candidates, <strong>the</strong> existence <strong>of</strong> a mini or<br />
an obscured AGN cannot be completely ruled out, since <strong>the</strong> region<br />
mapped by <strong>the</strong>se observations may correspond to distances<br />
from <strong>the</strong> center that are not as close to <strong>the</strong> AGN, which may<br />
be much more obscured; <strong>the</strong>y would map regions much far<strong>the</strong>r<br />
out instead, which would explain that <strong>the</strong>rmal mechanisms most<br />
probably due to star-forming processes seem to be <strong>the</strong> dominant<br />
energy source in <strong>the</strong>se systems (Rinn et al. 2005).<br />
The unambiguous determination <strong>of</strong> <strong>the</strong> presence <strong>of</strong> an AGN,<br />
however needs a detailed study <strong>of</strong> <strong>the</strong> individual <strong>sources</strong> to<br />
discard <strong>the</strong> eventual mechanisms producing unresolved hard<br />
X-<strong>ray</strong> <strong>nuclear</strong> morphologies originating in star-forming processes.<br />
Eracleous et al. (2002) argue in favor <strong>of</strong> <strong>the</strong> SB <strong>nature</strong><br />
<strong>of</strong> NGC 4736 (see Apendix). In particular, <strong>the</strong> contribution <strong>of</strong><br />
high mass X-<strong>ray</strong> binaries (HMXBs) and ultra-luminous X-<strong>ray</strong><br />
<strong>sources</strong> (ULXs) 5 needs to be estimated, since <strong>the</strong>y are expected<br />
to dominate <strong>the</strong> emission <strong>of</strong> star-forming galaxies (see for instance<br />
<strong>the</strong> data for <strong>the</strong> Antennae by Zezas & Fabbiano 2002).<br />
The high X-<strong>ray</strong> luminosity found for a ULX in <strong>the</strong> star-forming<br />
galaxy NGC 7714 (Soria & Motch 2004), amounting to 6 ×<br />
10 40 erg s −1 , proves how important <strong>the</strong> contamination produced<br />
by such objects can be if <strong>the</strong>y are found at <strong>nuclear</strong> positions,<br />
making this analysis extremely difficult and implying that only<br />
indirect pro<strong>of</strong>s can be invoked. Hence, we should keep in mind<br />
that contribution from ULXs cannot be discarded.<br />
Stellar population syn<strong>the</strong>sis will help investigating <strong>the</strong> relevance<br />
<strong>of</strong> <strong>the</strong> contribution from HMXBs since <strong>the</strong>y are shortlived<br />
(10 6−7 years). Data on population syn<strong>the</strong>sis exist for 14 out<br />
<strong>of</strong> <strong>the</strong> 51 galaxies <strong>of</strong> Cid Fernandes et al. (2004) and González-<br />
Delgado et al. (2004). Only in one galaxy, NGC 3507, a large<br />
contribution <strong>of</strong> a young population with age
Additional evidence <strong>of</strong> an AGN <strong>nature</strong> comes from variability<br />
studies. Maoz et al. (2005) use HST UV data for a sample <strong>of</strong><br />
17 galaxies showing <strong>LINER</strong> emission in <strong>the</strong>ir nuclei and compact<br />
<strong>nuclear</strong> UV <strong>sources</strong>, and find significant variability in all but<br />
four objects with peak-to-peak amplitudes up to 50%. For <strong>the</strong><br />
7 objects in common with <strong>the</strong>ir sample (NGC 1052, NGC 4486,<br />
NGC 4552, NGC 4579, NGC 4594, NGC 4736, and NGC 5055),<br />
five (excepting NGC 1052 and NGC 5055) show time variability<br />
that hints at <strong>the</strong>ir AGN <strong>nature</strong>. We note that all <strong>of</strong> <strong>the</strong>m belong<br />
to our class <strong>of</strong> AGN candidates.<br />
It is clear from <strong>the</strong> preceding analysis that a multi-frequency<br />
approach is needed to gain insight into <strong>the</strong> AGN <strong>nature</strong> <strong>of</strong> <strong>the</strong>se<br />
galaxies, but since most <strong>of</strong> <strong>the</strong> hard emission between 4.5–8 keV<br />
is coming from an unresolved <strong>nuclear</strong> source, <strong>the</strong> natural explanation<br />
seems to be that <strong>the</strong> X-<strong>ray</strong> unresolved <strong>nuclear</strong> source is<br />
due to a low-luminosity AGN. Low-luminosity AGNs in <strong>the</strong> nucleus<br />
<strong>of</strong> early type galaxies being quiescent at optical or UV<br />
frequencies have been invoked by Soria et al. (2006a,b) due to<br />
<strong>the</strong> existence <strong>of</strong> SMBHs in <strong>the</strong> nucleus <strong>of</strong> <strong>the</strong>se galaxies and in<br />
<strong>the</strong>ir X-<strong>ray</strong> properties. Therefore, since a SMBH has been detected<br />
for most <strong>of</strong> <strong>the</strong> <strong>LINER</strong>s (Satyapal et al. 2005), <strong>the</strong> AGN<br />
<strong>nature</strong> <strong>of</strong> <strong>the</strong> X-<strong>ray</strong> emission seems to be appropriate.<br />
5. Conclusions<br />
The primary goal <strong>of</strong> our study was to determine <strong>the</strong> X-<strong>ray</strong><br />
<strong>nuclear</strong> characteristics <strong>of</strong> a statistically significant sample <strong>of</strong><br />
<strong>LINER</strong>s that were selected based on <strong>the</strong>ir optical emission properties<br />
(Veilleux & Osterbrock 1987). Archival Chandra ACIS<br />
data were used to study <strong>the</strong> <strong>nature</strong> <strong>of</strong> our sample, with <strong>the</strong> aim<br />
<strong>of</strong> analyzing whe<strong>the</strong>r <strong>the</strong> observed X-<strong>ray</strong> emission is consistent<br />
with AGN-powered emission and whe<strong>the</strong>r star-forming emission<br />
can be ruled out in our sample or not. We first classified <strong>the</strong><br />
<strong>nuclear</strong> morphology, according to <strong>the</strong> compactness in <strong>the</strong> hard<br />
band, as AGN candidates whenever a clearly identified unresolved<br />
<strong>nuclear</strong> source is found in <strong>the</strong> 4.5 to 8.0 keV band and<br />
as SB candidates o<strong>the</strong>rwise. Color–color diagrams for <strong>the</strong> whole<br />
sample and <strong>the</strong> spectral analysis for <strong>the</strong> SF subsample lead to <strong>the</strong><br />
following conclusions:<br />
1. Morphologically, 30 out <strong>of</strong> 51 <strong>of</strong> <strong>LINER</strong>s can be classified as<br />
AGN-like candidates.<br />
2. A <strong>the</strong>rmal plus power-law model with a median temperature<br />
<strong>of</strong> ∼0.6 keV (0.6–0.9 keV from color–color diagrams) and<br />
median spectral index <strong>of</strong> ∼1.9 (1.4–1.7 from color–color diagrams)<br />
reproduces <strong>the</strong> X-<strong>ray</strong> energy distribution better. This<br />
indicates a non-negligible contribution <strong>of</strong> a non-<strong>the</strong>rmal component<br />
in our sample.<br />
3. Luminosities in <strong>the</strong> energy band 2–10 keV span a wide<br />
range between 1.4 × 10 38 erg s −1 and 1.5 × 10 42 erg s −1 with<br />
a mean value <strong>of</strong> 1.4 × 10 40 erg s −1 . For <strong>the</strong> two groups separately,<br />
AGN candidates range between 7.8 × 10 37 erg s −1<br />
and 1.5 × 10 42 erg s −1 , while SB candidates range between<br />
8.7 × 10 37 erg s −1 and 5.3 × 10 41 erg s −1 . The broad overlap<br />
in X-<strong>ray</strong> luminosities indicates that this parameter cannot<br />
be used to distinguish between AGN and SB candidates in<br />
<strong>LINER</strong>s.<br />
4. We stress that color–color diagrams are a valid tool for<br />
roughly estimating <strong>the</strong> values <strong>of</strong> <strong>the</strong> physical parameters used<br />
in <strong>the</strong> models for <strong>the</strong> spectral fitting by providing important<br />
clues to <strong>the</strong> amount <strong>of</strong> <strong>nuclear</strong> absorption. Their use is especially<br />
interesting when spectral fitting is not possible.<br />
O. González-Martín et al.: X-<strong>ray</strong> <strong>nature</strong> <strong>of</strong> <strong>LINER</strong>s 55<br />
5. The estimated column densities from ei<strong>the</strong>r <strong>the</strong> spectral analysis<br />
or color–color diagrams show that it is very likely that<br />
<strong>LINER</strong>s are generally significantly obscured, especially in<br />
SB candidates. This result is consistent with <strong>the</strong> hypo<strong>the</strong>sis<br />
that <strong>the</strong>y may host an obscured AGN.<br />
6. All <strong>the</strong> galaxies classified as AGN by <strong>the</strong> X-<strong>ray</strong> imaging show<br />
compact nuclei at <strong>the</strong> resolution <strong>of</strong> HST images. Eight out<br />
<strong>of</strong> 14 galaxies showing SB X-<strong>ray</strong> morphology have dusty<br />
<strong>nuclear</strong> <strong>sources</strong>, indicating that <strong>the</strong> objects can be dustobscured,<br />
in agreement with <strong>the</strong> X-<strong>ray</strong> analysis.<br />
These new data <strong>of</strong>fer some insight into <strong>the</strong> long-standing dispute<br />
about <strong>the</strong> <strong>nature</strong> <strong>of</strong> <strong>the</strong> ionizing source in <strong>LINER</strong>. Although<br />
contributions from HMXBs and ULXs cannot be ruled out for<br />
some galaxies, we can conclude that for a high percentage <strong>of</strong><br />
<strong>LINER</strong>s, 59% at most, an AGN does exist in <strong>the</strong>ir nuclei. For<br />
<strong>the</strong> remaining 41%, <strong>the</strong>ir existence cannot be discarded based<br />
on <strong>the</strong> available data. Diagnostics at o<strong>the</strong>r wavelengths have to<br />
be explored to determine <strong>the</strong> possible contribution <strong>of</strong> an embedded<br />
AGN. Future papers will be devoted to studying whe<strong>the</strong>r a<br />
link exists in objects with higher activity levels by comparing <strong>the</strong><br />
properties <strong>of</strong> our AGN-like <strong>LINER</strong> nuclei with those <strong>of</strong> a sample<br />
<strong>of</strong> Seyfert nuclei.<br />
After submission <strong>of</strong> <strong>the</strong> current paper, Flohic et al. (2006)<br />
published an X-<strong>ray</strong> analysis <strong>of</strong> a sample <strong>of</strong> 19 <strong>LINER</strong>s observed<br />
with Chandra, 18 <strong>of</strong> which are also in our sample. They fitted<br />
<strong>the</strong> spectra for 8 objects and <strong>the</strong> spectral parameters, and luminosities<br />
derived from <strong>the</strong> spectral fitting are in good agreement<br />
with ours for <strong>the</strong> objects in common. They also conclude that in<br />
about 60% <strong>of</strong> <strong>the</strong> <strong>nuclear</strong> <strong>sources</strong> an AGN is present.<br />
Acknowledgements. This work was financed by DGICyT grants<br />
AYA2003-00128 and <strong>the</strong> Junta de Andalucía TIC114. OGM acknowledges<br />
financial support by <strong>the</strong> Ministerio de Educación y Ciencia through<br />
<strong>the</strong> Spanish grant FPI BES-2004-5044. MAG is supported by <strong>the</strong> Spanish<br />
National program Ramón y Cajal. We thank X. Barcons and E. Jimenez-Bailon<br />
for helpful comments, D.W. Kim for useful advice in data reduction, and<br />
J. Cabrera for providing us with <strong>the</strong> Monte Carlo simulations. This work<br />
benefited from fruitful previous work with A.C. Fabian and J.S. Sanders. We<br />
acknowledge D. Maoz for his valuable comments. This research made use <strong>of</strong><br />
<strong>the</strong> NASA/IPAC extragalactic database (NED), which is operated by <strong>the</strong> Jet<br />
Propulsion Laboratory under contract with <strong>the</strong> National Aeronautics and Space<br />
Administration. We acknowledge an anonymous referee for her/his comments<br />
and advice on our work, which resulted in great improvement <strong>of</strong> <strong>the</strong> manuscript.<br />
References<br />
Allen, S. W., Di Matteo, T., & Fabian, A. C. 2000, MNRAS, 311, 493<br />
Balestra, I., Boller, T., Gallo, L., Lutz, D., & Hess, S. 2005, A&A, 442, 469<br />
Ballo, L., Braito, V., Della Ceca, R., et al. 2004, ApJ, 600, 634<br />
Balucinska-Church, M., & McCammon, D. 1992, ApJ, 400, 699<br />
Barth, A. J. 2002, Issues in Unification <strong>of</strong> Active Galactic Nuclei, ASP<br />
Conf. Ser., 258, 147<br />
Barth, A. J., & Shields, J. C. 2000, PASP, 112, 753<br />
Barth, A. J., Ho, L. C., Filippenko, A. V., & Sargent, W. L. W. 1998, ApJ, 496,<br />
133<br />
Barth, A. J., Filippenko, A. V., & Moran, E. C. 1999, ApJ, 515, L61<br />
Barth, A. J., Sarzi, M., Rix, H.-W., et al. 2001, ApJ, 555, 685<br />
Birkinshaw, M., & Worrall, D. M. 1993, ApJ, 412, 568<br />
Boller, T., Gallo, L. C., Lutz, D., & Sturm, E. 2002, MNRAS, 336, 1143<br />
Boller, T., Keil, R., Hasinger, G., et al. 2003, A&A, 411, 63<br />
Braatz, J. A., Wilson, A. S., & Henkel, C. 1997, ApJS, 110, 321<br />
Carilli, C. L., & Taylor, G. B. 2000, ApJ, 532, L95<br />
Cappellari, M., Verolme, E. K., van der Marel, R. P., et al. 2002, ApJ, 578, 787<br />
Cappi, M., Panessa, F., Bassani, L., et al. 2006, A&A, 446, 459<br />
Carrillo, R., Masegosa, J., Dultzin-Hacyan, D., & Ordoñez, R. 1999, Rev. Mex.<br />
Astron. Astr<strong>of</strong>is., 35, 187
56 O. González-Martín et al.: X-<strong>ray</strong> <strong>nature</strong> <strong>of</strong> <strong>LINER</strong>s<br />
Ceballos, M. T., & Barcons, X. 1996, MNRAS, 282, 493<br />
Cid Fernandes, R., Gonzalez Delgado, R. M., Schmitt, H., et al. 2004, ApJ, 605,<br />
105<br />
Chiaberge, M., Gilli, R., Macchetto, F. D., Sparks, W. B., & Capetti, A. 2003a,<br />
ApJ, 582, 645<br />
Chiaberge, M., Gilli, R., Capetti, A., & Macchetto, F. D. 2003b, ApJ, 597, 166<br />
Chiaberge, M., Capetti, A., & Macchetto, F. D. 2005, ApJ, 625, 716<br />
Colbert, E. J. M., & Mushotzky, R. F. 1999, ApJ, 519, 89<br />
Cole, G. H. J., Pedlar, A., Holloway, A. J., & Mundell, C. G. 1999, MNRAS,<br />
310, 1033<br />
Cowan, J. J., Romanishin, W., & Branch, D. 1994, ApJ, 436, L139<br />
Crawford, C. S., Sanders, J. S., & Fabian, A. C. 2005, MNRAS, 361, 17<br />
David, L. P., Jones, C., Forman, W., & Mur<strong>ray</strong>, S. S. 2005, ApJ, 635, 1053<br />
Dewangan, G. C., Griffiths, R. E., Di Matteo, T., & Schurch, N. J. 2004, ApJ,<br />
607, 788<br />
Dewangan, G. C., Griffiths, R. E., Choudhury, M., Miyaji, T., & Schurch, N. J.<br />
2005, ApJ, 635, 198<br />
Dickey, J. M., & Lockman, F. J. 1990, ARA&A, 28, 215<br />
Di Matteo, T., Quataert, E., Allen, S. W., Na<strong>ray</strong>an, R., & Fabian, A. C. 2000,<br />
MNRAS, 311, 507<br />
Donato, D., Sambruna, R. M., & Gliozzi, M. 2004, ApJ, 617, 915<br />
Donato, D., Sambruna, R. M., & Gliozzi, M. 2005, A&A, 433, 1163<br />
Dopita, M. A., & Su<strong>the</strong>rland, R. S. 1996, ApJS, 102, 161<br />
Drinkwater, M. J., Francis, P. J., & Webster, R. L. 1997, IAU Coll. 159,<br />
Emission Lines in Active Galaxies: New Methods and Techniques, ASP<br />
Conf. Ser., 113, 437<br />
Dudik, R. P., Satyapal, S., Gliozzi, M., & Sambruna, R. M. 2005, ApJ, 620, 113<br />
Eracleous, M., Shields, J. C., Chartas, G., & Moran, E. C. 2002, ApJ, 565, 108<br />
Erwin, P., & Sparke, L. S. 1999, ApJ, 521, L37<br />
Evans, D. A., Hardcastle, M. J., Croston, J. H., Worrall, D. M., & Birkinshaw,<br />
M. 2005, MNRAS, 359, 363<br />
Fabbiano, G. 2005, [arXiv:astro-ph/0511276]<br />
Fabbiano, G., Elvis, M., Mark<strong>of</strong>f, S., et al. 2003, ApJ, 588, 175<br />
Fabian, A. C. 1979, Royal Soc. London Proc. Ser. A, 366, 449<br />
Falcke, H., Nagar, N. M., Wilson, A. S., & Ulvestad, J. S. 2000, ApJ, 542, 197<br />
Ferland, G. J., & Netzer, H. 1983, ApJ, 264, 105<br />
Ferrarese, L., Ford, H. C., Huchra, J., et al. 2000, ApJS, 128, 431<br />
Filho, M. E., Bar<strong>the</strong>l, P. D., & Ho, L. C. 2000, ApJS, 129, 93<br />
Filho, M. E., Bar<strong>the</strong>l, P. D., & Ho, L. C. 2002, ApJS, 142, 223<br />
Filho, M. E., Fraternali, F., Mark<strong>of</strong>f, S., et al. 2004, A&A, 418, 429<br />
Filippenko, A. V., & Halpern, J. P. 1984, ApJ, 285, 458<br />
Filippenko, A. V., & Terlevich, R. 1992, ApJ, 397, L79<br />
Finoguenov, A., & Jones, C. 2001, ApJ, 547, L107<br />
Forman, W., Nulsen, P., Heinz, S., et al. 2005, ApJ, 635, 894<br />
Fosbury, R. A. E., Mebold, U., Goss, W. M., & Dopita, M. A. 1978, MNRAS,<br />
183, 549<br />
Franceschini, A., Braito, V., Persic, M., et al. 2003, MNRAS, 343, 1181<br />
Gallo, L. C., Lehmann, I., Pietsch, W., et al. 2006, MNRAS, 365, 688<br />
Georgantopoulos, I., & Zezas, A. 2003, ApJ, 594, 704<br />
Georgantopoulos, I., Panessa, F., Akylas, A., et al. 2002, A&A, 386, 60<br />
George, I. M., Mushotzky, R. F., Yaqoob, T., et al. 2001, ApJ, 559, 167<br />
Gliozzi, M., Sambruna, R. M., & Brandt, W. N. 2003, A&A, 408, 949<br />
Gliozzi, M., Sambruna, R. M., Brandt, W. N., Mushotzky, R., & Eracleous, M.<br />
2004, A&A, 413, 139<br />
Gondoin, P., Orr, A., & Siddiqui, H. 2004, A&A, 420, 905<br />
González Delgado, R. M., Heckman, T., Lei<strong>the</strong>rer, C., et al. 1998, ApJ, 505, 174<br />
González Delgado, R. M., Cid Fernandes, R., Pérez, E., et al. 2004, ApJ, 605,<br />
127<br />
Goudfrooij, P., Hansen, L., Jorgensen, H. E., et al. 1994, A&AS, 104, 179<br />
Granato, G. L., Danese, L., & Franceschini, A. 1997, Mem. Soc. Astron. Ital.,<br />
68, 39<br />
Griffiths, R. E., Ptak, A., Feigelson, E. D., et al. 2000, Science, 290, 1325<br />
Grimes, J. P., Heckman, T., Strickland, D., & Ptak, A. 2005, ApJ, 628, 187<br />
Grimm, H.-J., McDowell, J., Zezas, A., Kim, D.-W., & Fabbiano, G. 2005, ApJS,<br />
161, 271<br />
Guainazzi, M., Oosterbroek, T., Antonelli, L. A., & Matt, G. 2000, A&A, 364,<br />
L80<br />
Guainazzi, M., Grandi, P., Comastri, A., & Matt, G. 2003, A&A, 410, 131<br />
Guainazzi, M., Matt, G., & Perola, G. C. 2005, A&A, 444, 119<br />
Halpern, J. P., & Steiner, J. E. 1983, ApJ, 269, L37<br />
Hasinger, G., Altieri, B., Arnaud, M., et al. 2001, A&A, 365, L45<br />
Hawley, S. A., & Phillips, M. M. 1980, ApJ, 235, 783<br />
Heckman, T. M. 1980, A&A, 87, 152<br />
Heckman, T. M., Crane, P. C., & Balick, B. 1980, A&AS, 40, 295<br />
Heinke, C. O., Grindlay, J. E., Edmonds, P. D., et al. 2005, ApJ, 625, 796<br />
Ho, L. C., & Ulvestad, J. S. 2001, ApJS, 133, 77<br />
Ho, L. C., Filippenko, A. V., & Sargent, W. L. W. 1997, ApJS, 112, 315<br />
Ho, L. C., Feigelson, E. D., Townsley, L. K., et al. 2001, ApJ, 549, L51<br />
Imanishi, M., Terashima, Y., Anabuki, N., & Nakagawa, T. 2003, ApJ, 596, L167<br />
Ishisaki, Y., Makishima, K., Iyomoto, N., et al. 1996, PASJ, 48, 237<br />
Iyomoto, N., Makishima, K., Fukazawa, Y., et al. 1996, PASJ, 48, 231<br />
Iwasawa, K., Fabian, A. C., Almaini, O., et al. 2000, MNRAS, 318, 879<br />
Jiménez-Bailón, E., Piconcelli, E., Guainazzi, M., et al. 2005, A&A, 435, 449<br />
Jones, C., Forman, W., Vikhlinin, A., et al. 2002, ApJ, 567, L115<br />
Kadler, M., Kerp, J., Ros, E., et al. 2004, A&A, 420, 467<br />
Karachentsev, I. D., & Drozdovsky, I. O. 1998, A&AS, 131, 1<br />
Kataoka, J., & Stawarz, Ł. 2005, ApJ, 622, 797<br />
Keel, W. C. 1980, AJ, 85, 198<br />
Khosroshahi, H. G., Jones, L. R., & Ponman, T. J. 2004, MNRAS, 349, 1240<br />
Komossa, S., Burwitz, V., Hasinger, G., et al. 2003, ApJ, 582, L15<br />
Körding, E., Colbert, E., & Falcke, H. 2005, A&A, 436, 427<br />
Laine, S., Knapen, J. H., Perez-Ramirez, D., Doyon, R., & Nadeau, D. 1999,<br />
MNRAS, 302, L33<br />
Lawrence, A., & Elvis, M. 1982, ApJ, 256, 410<br />
Leighly, K. M. 1999, ApJS, 125, 297<br />
Levenson, N. A., Weaver, K. A., Heckman, T. M., Awaki, H., & Terashima, Y.<br />
2005, ApJ, 618, 167<br />
Liu, J.-F., & Bregman, J. N. 2005, ApJS, 157, 59<br />
Loewenstein, M., Mushotzky, R. F., Angelini, L., Arnaud, K. A., & Quataert, E.<br />
2001, ApJ, 555, L21<br />
Machacek, M. E., Jones, C., & Forman, W. R. 2004, ApJ, 610, 183<br />
Maiolino, R. 2001, X-<strong>ray</strong> Astronomy: Stellar Endpoints, AGN, and <strong>the</strong> Diffuse<br />
X-<strong>ray</strong> Background, AIP Conf. Proc., 599, 199<br />
Maoz, D., Nagar, N. M., Falcke, H., & Wilson, A. S. 2005, ApJ, 625, 699<br />
Marquez, I., & Moles, M. 1996, A&AS, 120, 1<br />
Márquez, I., Masegosa, J., Durret, F., et al. 2003, A&A, 409, 459<br />
Masegosa, J., & MÁrquez, I. 2003, APS Conf. Ser., 284, 483<br />
Moran, E. C., Eracleous, M., Leighly, K. M., et al. 2005, AJ, 129, 2108<br />
Mateos, S., Barcons, X., Carrera, F. J., et al. 2005, A&A, 444, 79<br />
Nagar, N. M., Falcke, H., Wilson, A. S., & Ho, L. C. 2000, ApJ, 542, 186<br />
Nagar, N. M., Falcke, H., Wilson, A. S., & Ulvestad, J. S. 2002, A&A, 392, 53<br />
Nagar, N. M., Falcke, H., & Wilson, A. S. 2005, A&A, 435, 521<br />
O’Neill, P. M., Kaspi, S., Laor, A., et al. 2006, ApJ, 645, 160<br />
O’Sullivan, E., & Ponman, T. J. 2004, MNRAS, 349, 535<br />
O’Sullivan, E., Forbes, D. A., & Ponman, T. J. 2001, MNRAS, 328, 461<br />
O’Sullivan, E., Vrtilek, J. M., & Kempner, J. C. 2005, ApJ, 624, L77<br />
Ott, J., Martin, C. L., & Walter, F. 2003, ApJ, 594, 776<br />
Ott, J., Walter, F., & Brinks, E. 2005, MNRAS, 358, 1453<br />
Pellegrini, S. 1994, A&A, 292, 395<br />
Pellegrini, S., Baldi, A., Fabbiano, G., & Kim, D.-W. 2003, ApJ, 597, 175<br />
Pogge, R. W., Maoz, D., Ho, L. C., & Eracleous, M. 2000, ApJ, 532, 323<br />
Ptak, A., Serlemitsos, P., Yaqoob, T., & Mushotzky, R. 1999, ApJS, 120, 179<br />
Ptak, A., Heckman, T., Levenson, N. A., Weaver, K., & Strickland, D. 2003, ApJ,<br />
592, 782<br />
Raymond, J. C., & Smith, B. W. 1977, ApJS, 35, 419<br />
Read, A. M. 2003, MNRAS, 342, 715<br />
Read, A. M., Ponman, T. J., & Strickland, D. K. 1997, MNRAS, 286, 626<br />
Rinn, A. S., Sambruna, R. M., & Gliozzi, M. 2005, ApJ, 621, 167<br />
Risaliti, G., Gilli, R., Maiolino, R., & Salvati, M. 2000, A&A, 357, 13<br />
Roberts, T. P., & Warwick, R. S. 2000, MNRAS, 315, 98<br />
Roberts, T. P., Warwick, R. S., & Ohashi, T. 1999, MNRAS, 304, 52<br />
Sambruna, R. M. 2003, New Astron. Rev., 47, 457<br />
Sarzi, M., Rix, H.-W., Shields, J. C., et al. 2001, ApJ, 550, 65<br />
Satyapal, S., Sambruna, R. M., & Dudik, R. P. 2004, A&A, 414, 825<br />
Satyapal, S., Dudik, R. P., O’Halloran, B., & Gliozzi, M. 2005, ApJ, 633, 86<br />
Shields, J. C. 1992, ApJ, 399, L27<br />
Shih, D. C., Iwasawa, K., & Fabian, A. C. 2003, MNRAS, 341, 973<br />
Smith, B. J., Nowak, M., Donahue, M., & Stocke, J. 2003, AJ, 126, 1763<br />
S<strong>of</strong>ue, Y., Yoshida, S., Aoki, T., et al. 1994, PASJ, 46, 1<br />
Soria, R., & Motch, C. 2004, A&A, 422, 915<br />
Soria, R., Fabbiano, G., Graham, A. W., et al. 2006a, ApJ, 640, 126<br />
Soria, R., Graham, A. W., Fabbiano, G., et al. 2006b, ApJ, 640, 143<br />
Stauffer, J. R. 1982, AJ, 87, 1507<br />
Stockdale, C. J., Romanishin, W., & Cowan, J. J. 1998, ApJ, 508, L33<br />
Streblyanska, A., Hasinger, G., Finoguenov, A., et al. 2005, A&A, 432, 395<br />
Strickland, D. K., Heckman, T. M., Colbert, E. J. M., Hoopes, C. G., & Weaver,<br />
K. A. 2004, ApJS, 151, 193<br />
Sudou, H., Taniguchi, Y., Kaburaki, O., et al. 2001, IAU Symp., 205, 144<br />
Taylor, G. B., Sanders, J. S., Fabian, A. C., & Allen, S. W. 2006, MNRAS, 365,<br />
705<br />
Teng, S. H., Wilson, A. S., Veilleux, S., et al. 2005, ApJ, 633, 664<br />
Terashima, Y. 1999, Adv. Space Res., 23, 851<br />
Terashima, Y., & Wilson, A. S. 2003, ApJ, 583, 145<br />
Terashima, Y., Kunieda, H., Serlemitsos, P. J., & Ptak, A. 1998, The Hot<br />
Universe, IAU Symp., 188, 444<br />
Terashima, Y., Ho, L. C., Ptak, A. F., et al. 2000, ApJ, 533, 729
Terashima, Y., Iyomoto, N., Ho, L. C., & Ptak, A. F. 2002, ApJS, 139, 1<br />
Terlevich, R., & Melnick, J. 1985, MNRAS, 213, 841<br />
Thuan, T. X. 1984, ApJ, 281, 126<br />
Tonry, J. L., Dressler, A., Blakeslee, J. P., et al. 2001, ApJ, 546, 681<br />
Trinchieri, G., & Goudfrooij, P. 2002, A&A, 386, 472<br />
Tschöke, D., Hensler, G., & Junkes, N. 1999, A&A, 343, 373<br />
Tully, R. B. 1998, Nearby Galaxies Catalog (Cambridge: Cambridge Univ. Press)<br />
Turner, T. J., George, I. M., Nandra, K., & Mushotzky, R. F. 1997, ApJS, 113,<br />
23<br />
Turner, M. J. L., Reeves, J. N., Ponman, T. J., et al. 2001, A&A, 365, L110<br />
Vaughan, S., Iwasawa, K., Fabian, A. C., & Hayashida, K. 2005, MNRAS, 356,<br />
524<br />
Veilleux, S., & Osterbrock, D. E. 1987, ApJS, 63, 295<br />
O. González-Martín et al.: X-<strong>ray</strong> <strong>nature</strong> <strong>of</strong> <strong>LINER</strong>s 57<br />
Veilleux, S., Sanders, D. B., & Kim, D.-C. 1999, ApJ, 522, 139<br />
Veron, P., Veron, M. P., Bergeron, J., & Zuidervijk, E. J. 1981, A&A, 97, 71<br />
Vignati, P., Molendi, S., Matt, G., et al. 1999, A&A, 349, L57<br />
Worrall, D. M., Birkinshaw, M., & Hardcastle, M. J. 2003, MNRAS, 343, L73<br />
Wrobel, J. M., & Heeschen, D. S. 1991, AJ, 101, 148<br />
Xia, X. Y., Xue, S. J., Mao, S., et al. 2002, ApJ, 564, 196<br />
Xu, H., Kahn, S. M., Peterson, J. R., et al. 2002, ApJ, 579, 600<br />
Xu, Y., Xu, H., Zhang, Z., Kundu, A., Wang, Y., & Wu, X.-P. 2005, ApJ, 631,<br />
809<br />
Zezas, A., & Fabbiano, G. 2002, ApJ, 577, 726<br />
Zezas, A., Birkinshaw, M., Worrall, D. M., Peters, A., & Fabbiano, G. 2005, ApJ,<br />
627, 711
O. González-Martín et al.: X-<strong>ray</strong> <strong>nature</strong> <strong>of</strong> <strong>LINER</strong>s, Online Material p 1<br />
Online Material
Table 1. Observational details.<br />
O. González-Martín et al.: X-<strong>ray</strong> <strong>nature</strong> <strong>of</strong> <strong>LINER</strong>s, Online Material p 2<br />
X-<strong>ray</strong> position X-<strong>ray</strong> Offset X-<strong>ray</strong> Obs. Optical/HST Obs.<br />
Name (1) α (2) δ (3) Radii (4) 2MASS (5) Obs.ID (6) Expt. (7) Filter (8) Prop. ID (9) Expt. (10)<br />
(2000) (2000) (arcsec) (arcsec) (ks) (s)<br />
NGC 0315 . . . . . . 00 57 48.9 +30 21 08.7 1.968 0.81 4156 52.3 F814W 6673 460<br />
ARP 318A . . . . . . 02 09 38.5 −10 08 45.4 4.920 1.26 923 12.5 ... ... ...<br />
ARP 318B . . . . . . 02 09 42.7 −10 11 02.2 2.952 0.54 923 12.5 ... ... ...<br />
NGC 1052 . . . . . . 02 41 04.8 −08 15 20.6 1.476 0.57 385 10.9 F555W 3639 1000<br />
NGC 2681 . . . . . . 08 53 32.8 +51 18 48.8 2.460 0.83 2060 78.3 F555W 4854 1000<br />
UGC 05101 . . . . . 09 35 51.7 +61 21 11.1 2.952 0.61 2033 48.2 F814W 6346 800<br />
NGC 3226 . . . . . . 10 23 27.0 +19 53 54.6 1.476 0.26 860 46.3 F702W 6357 1000<br />
NGC 3245 . . . . . . 10 27 18.3 +28 30 27.2 1.968 0.59 2926 9.6 F702W 7403 140<br />
NGC 3379 . . . . . . 10 47 49.6 +12 34 53.7 1.968 0.20 1587 31.3 F814W 5512 1340<br />
NGC 3507 . . . . . . 11 03 25.3 +18 08 07.3 2.460 1.27 3149 38.0 F606W 5446 160<br />
NGC 3607 . . . . . . 11 16 54.6 +18 03 04.4 2.952 2.22 2073 38.4 F814W 5999 320<br />
NGC 3608 . . . . . . 11 16 58.9 +18 08 53.7 1.968 1.53 2073 38.4 F814W 5454 460<br />
NGC 3628 . . . . . . 11 20 16.9 +13 35 22.8 2.952 1.60 2039 54.8 ... ... ...<br />
NGC 3690B . . . . . 11 28 30.9 +58 33 40.5 3.198 2.64 1641 24.3 F814W 8602 700<br />
NGC 4111 . . . . . . 12 07 03.1 +43 03 57.3 2.952 1.95 1578 14.8 F702W 6785 600<br />
NGC 4125 . . . . . . 12 08 06.0 +65 10 27.6 2.460 0.81 2071 61.9 F814W 6587 2100<br />
NGC 4261 . . . . . . 12 19 23.2 +05 49 30.4 3.444 1.49 834 31.3 F702W 5476 280<br />
NGC 4314 . . . . . . 12 22 32.1 +29 53 44.8 5.904 2.71 2062 14.5 F814W 6265 600<br />
NGC 4374 . . . . . . 12 25 03.7 +12 53 13.2 1.476 0.90 803 28.2 F814W 6094 520<br />
NGC 4395 . . . . . . 12 25 48.9 +33 32 48.4 1.476 0.78 5301 26.3 F814W 6464 2160<br />
NGC 4410A . . . . . 12 26 28.2 +09 01 10.8 1.968 1.00 2982 34.8 F606W 5479 500<br />
NGC 4438 . . . . . . 12 27 45.6 +13 00 33.0 2.952 2.26 2883 24.6 F814W 6791 1050<br />
NGC 4457 . . . . . . 12 28 59.0 +03 34 14.3 2.952 0.45 3150 35.6 ... ... ...<br />
NGC 4459 . . . . . . 12 29 00.0 +13 58 41.7 1.968 1.17 2927 9.8 F814W 5999 320<br />
NGC 4486 . . . . . . 12 30 49.4 +12 23 28.3 2.460 0.35 2707 98.7 F814W 6775 1480<br />
NGC 4494 . . . . . . 12 31 24.1 +25 46 29.8 1.968 0.94 2079 15.8 F814W 6554 1800<br />
NGC 4552 . . . . . . 12 35 39.8 +12 33 23.3 2.460 1.91 2072 54.3 F814W 6099 1500<br />
NGC 4579 . . . . . . 12 37 43.5 +11 49 05.5 1.968 1.53 807 30.6 F791W 6436 600<br />
NGC 4594 . . . . . . 12 39 59.4 −11 37 23.0 1.476 0.71 1586 18.5 F814W 5512 1470<br />
NGC 4596 . . . . . . 12 39 56.0 +10 10 35.3 3.690 1.61 2928 9.2 F606W 5446 160<br />
NGC 4636 . . . . . . 12 42 49.8 +02 41 15.9 2.214 ... 4415 74.1 F814W 8686 400<br />
NGC 4676A . . . . . 13 30 03.3 +47 12 41.4 3.936 1.31 2043 27.9 F814W 8669 320<br />
NGC 4676B . . . . . 13 30 04.6 +47 12 08.9 3.936 ... 2043 27.9 F814W 8669 320<br />
NGC 4696 . . . . . . 12 48 48.8 −41 18 43.3 3.936 7.51 1560 47.7 F814W 8683 1000<br />
NGC 4698 . . . . . . 12 48 22.9 +08 29 14.6 2.214 0.71 3008 29.4 F814W 9042 460<br />
NGC 4736 . . . . . . 12 50 53.1 +41 07 13.2 1.476 0.82 808 46.4 F814W 9042 460<br />
NGC 5055 . . . . . . 13 15 49.2 +42 01 45.9 1.476 1.33 2197 27.7 F814W 9042 460<br />
NGC 5194 . . . . . . 13 29 52.8 +47 11 40.4 3.444 2.87 3932 45.2 ... ... ...<br />
MRK 0266NE . . . 13 38 17.9 +48 16 41.1 1.968 0.84 2044 17.4 F606W 5479 500<br />
UGC 08696 . . . . . 13 44 42.1 +55 53 13.1 1.968 0.66 809 40.4 F814W 8645 800<br />
CGCG 162-010 . . 13 48 52.5 +26 35 36.3 3.936 1.59 493 19.6 F702W 5212 300<br />
NGC 5746 . . . . . . 14 44 56.0 +01 57 18.1 1.476 1.06 3929 36.8 F814W 9046 800<br />
NGC 5846 . . . . . . 15 06 29.2 +01 36 19.6 4.920 1.13 4009 24.0 F814W 5920 2300<br />
NGC 5866 . . . . . . 15 06 29.5 +55 45 46.1 4.428 2.22 2879 31.9 ... ... ...<br />
NGC 6251 . . . . . . 16 32 31.9 +82 32 15.7 1.968 1.68 847 25.4 F814W 6653 1000<br />
NGC 6240 . . . . . . 16 52 58.9 +02 24 02.6 1.680 0.99 1590 36.7 F814W 6430 1200<br />
IRAS 17208-0014 17 23 22.0 +00 17 00.6 2.460 1.04 2035 48.4 F814W 6346 800<br />
NGC 6482 . . . . . . 17 51 48.8 +23 04 18.9 2.460 0.46 3218 19.1 ... ... ...<br />
NGC 7130 . . . . . . 21 48 19.5 −34 57 05.0 1.968 0.73 2188 36.9 F606W 5479 1900<br />
NGC 7331 . . . . . . 22 37 04.0 +34 24 56.0 1.968 1.75 2198 29.5 F814W 7450 170<br />
IC 1459 . . . . . . . . . 22 57 10.6 −36 27 43.6 2.952 1.81 2196 51.8 F814W 5454 460
Table 2. Host-galaxy properties.<br />
O. González-Martín et al.: X-<strong>ray</strong> <strong>nature</strong> <strong>of</strong> <strong>LINER</strong>s, Online Material p 3<br />
Name (1) z (2) Dist. (3) Spatial scale (4) Source radii (5) B (6) E(B − V) (7) Morph. type (8)<br />
(pc/arcsec) (pc)<br />
NGC 0315 . . . . . . . . . . 0.016465 65.8 b 319.0 627.8 12.2 0.065 E<br />
ARP 318A . . . . . . . . . . 0.013586 54.3 b 263.3 1295.4 12.91 0.025 SAB(r)ab;pec<br />
ARP 318B . . . . . . . . . . 0.012889 54.3 b 263.3 777.3 13.69 0.025 (R’)Sa;pec<br />
NGC 1052 . . . . . . . . . . 0.004903 19.4 c 94.1 138.9 11.41 0.027 E4<br />
NGC 2681 . . . . . . . . . . 0.002308 17.2 c 83.4 205.2 11.09 0.023 (R’)SAB(rs)0/a<br />
UGC 05101 . . . . . . . . . 0.039390 157.3 b 762.6 2251.2 15.2 0.033 S?<br />
NGC 3226 . . . . . . . . . . 0.003839 23.6 c 114.4 168.9 12.3 0.023 E2;pec<br />
NGC 3245 . . . . . . . . . . 0.004530 20.9 c 101.3 199.4 11.7 0.025 SA(r)0<br />
NGC 3379 . . . . . . . . . . 0.003069 10.6 c 51.4 101.2 10.24 0.024 E1<br />
NGC 3507 . . . . . . . . . . 0.003266 19.8 d 96.0 236.2 11.73 0.024 SB(s)b<br />
NGC 3607 . . . . . . . . . . 0.003119 22.8 c 110.5 326.2 10.82 0.021 SA(s)0<br />
NGC 3608 . . . . . . . . . . 0.003696 22.9 c 111.0 218.4 11.7 0.021 E2<br />
NGC 3628 . . . . . . . . . . 0.002812 7.7 d 37.3 110.1 14.8 0.027 Sb;pec;sp<br />
NGC 3690B . . . . . . . . . 0.010411 41.6 b 201.7 645.0 ... 0.017 GPair<br />
NGC 4111 . . . . . . . . . . 0.002692 15.0 c 72.7 214.6 11.63 0.015 SA(r)0+:;sp<br />
NGC 4125 . . . . . . . . . . 0.004523 23.9 c 115.9 285.1 10.65 0.019 E6;pec<br />
NGC 4261 . . . . . . . . . . 0.007372 29.4 c 142.5 490.8 11.41 0.018 E2-3<br />
NGC 4314 . . . . . . . . . . 0.003212 9.7 d 47.0 277.5 11.43 0.025 SB(rs)a<br />
NGC 4374 . . . . . . . . . . 0.003336 18.4 c 89.2 131.7 12.1 0.040 I<br />
NGC 4395 . . . . . . . . . . 0.001064 4.2 e 20.4 30.1 10.64 0.017 SA(s)m<br />
NGC 4410A . . . . . . . . . 0.025174 100.5 b 487.2 958.8 14.92 0.024 S0;pec<br />
NGC 4438 . . . . . . . . . . 0.000237 16.8 d 81.4 240.3 11.02 0.028 SA(s)0/a;p:<br />
NGC 4457 . . . . . . . . . . 0.002942 17.4 d 84.4 249.1 11.76 0.022 (R)SAB(s)0/a<br />
NGC 4459 . . . . . . . . . . 0.004036 16.1 c 78.1 153.7 11.32 0.046 SA(r)0+<br />
NGC 4486 . . . . . . . . . . 0.004276 16.1 c 78.1 192.1 9.59 0.022 E+0-1;pec<br />
NGC 4494 . . . . . . . . . . 0.004416 17.1 c 82.9 163.1 10.71 0.021 E1-2<br />
NGC 4552 . . . . . . . . . . 0.001071 15.4 c 74.7 183.8 10.73 0.041 E<br />
NGC 4579 . . . . . . . . . . 0.005067 16.8 d 81.4 160.2 10.48 0.041 SAB(rs)b<br />
NGC 4594 . . . . . . . . . . 0.003639 9.8 c 47.5 70.1 8.98 0.051 SA(s)a<br />
NGC 4596 . . . . . . . . . . 0.006251 16.8 d 81.4 300.4 11.35 0.022 SB(r)0+<br />
NGC 4636 . . . . . . . . . . 0.003653 14.7 c 71.3 157.9 10.43 0.028 E/S0_1<br />
NGC 4676A . . . . . . . . . 0.022059 88.0 b 426.6 1679.1 14.7 0.017 Irr<br />
NGC 4676B . . . . . . . . . 0.022039 88.0 b 426.6 1679.1 14.4 0.017 SB(s)0/a;pec<br />
NGC 4696 . . . . . . . . . . 0.009867 35.5 c 172.1 677.4 11.39 0.113 E+1;pec<br />
NGC 4698 . . . . . . . . . . 0.003342 16.8 d 81.4 180.2 1.46 0.026 SA(s)ab<br />
NGC 4736 . . . . . . . . . . 0.001027 5.2 c 25.2 37.2 8.99 0.018 (R)SA(r)ab<br />
NGC 5055 . . . . . . . . . . 0.001681 7.2 d 34.9 51.5 9.31 0.018 SA(rs)bc<br />
NGC 5194 . . . . . . . . . . 0.001544 7.7 c 37.3 128.5 8.96 0.035 SA(s)bc;pec<br />
MRK 0266NE . . . . . . . 0.028053 112.0 b 543.0 1068.6 14.1 0.013 Compact;pec:<br />
UGC 08696 . . . . . . . . . 0.037780 150.9 b 731.6 1439.8 15.07 0.008 Ring galaxy<br />
CGCG 162-010. . . . . . 0.063260 252.6 b 1224.6 4820.0 15.2 0.013 cD;S0?<br />
NGC 5746 . . . . . . . . . . 0.005751 29.4 d 142.5 210.3 11.29 0.040 SAB(rs)b?;sp<br />
NGC 5846 . . . . . . . . . . 0.006078 24.9 c 120.7 593.8 11.05 0.055 E0-1<br />
NGC 5866 . . . . . . . . . . 0.002242 15.4 c 74.7 330.8 10.74 0.013 S0_3<br />
NGC 6251 . . . . . . . . . . 0.023016 91.9 b 445.5 876.7 13.64 0.087 E<br />
NGC 6240 . . . . . . . . . . 0.024480 97.8 b 474.1 796.5 13.8 0.076 I0:;pec<br />
IRAS 17208-0014 . . . 0.042810 171.0 b 829.0 2039.3 15.1 0.344 ...<br />
NGC 6482 . . . . . . . . . . 0.013176 52.6 b 255.0 627.3 12.35 0.099 E<br />
NGC 7130 . . . . . . . . . . 0.016151 64.5 b 312.7 615.4 12.98 0.029 Sa;pec<br />
NGC 7331 . . . . . . . . . . 0.002739 15.1 a 73.2 144.1 10.35 0.091 SA(s)b<br />
IC 1459 . . . . . . . . . . . . . 0.005641 22.0 d 106.7 315.0 10.97 0.016 E3<br />
Properties are extracted from <strong>the</strong> Carrillo et al. (1999) and references <strong>the</strong>rein. a Ferrarese et al. (2000); b from cosmology assuming Ho =<br />
75 Km Mpc −1 s −1 ; c Tonry et al. (2001); d Tully R.B. (1998), Nearby Galaxies Catalog (Cambridge: Cambridge Univ. Press); and e Karachentsev<br />
I.D. & Drodovsky I.O. (1998).
Table 3. Results from spectral fitting <strong>of</strong> <strong>the</strong> five models tested.<br />
O. González-Martín et al.: X-<strong>ray</strong> <strong>nature</strong> <strong>of</strong> <strong>LINER</strong>s, Online Material p 4<br />
Name (1) Model (2) NH (3) Γ (4) kT (5) χ 2 /d.o.f. (6)<br />
(10 22 cm −2 ) (keV)<br />
NGC 0315 . . RS 0.23 ... 63.99 285.15/163<br />
ME 0.22 ... 79.89 284.03/163<br />
PL 0.20 1.18 ... 282.77/163<br />
RS+PL(*) 0.71 1.48 0.22 188.77/161<br />
ME+PL 0.48 1.30 0.27 213.89/161<br />
NGC 2681 . . RS 0.51 ... 0.64 78.02/28<br />
ME 0.45 ... 0.58 77.75/28<br />
PL 0.28 3.68 ... 82.58/28<br />
RS+PL 0.04 1.68 0.76 9.40/26<br />
ME+PL(*) 0.08 1.74 0.66 13.94/26<br />
NGC 3690B . RS 0.79 ... 1.40 118.70/25<br />
ME 1.09 ... 1.10 112.04/25<br />
PL(*) 0.02 1.45 ... 21.81/25<br />
RS+PL 0.10 1.45 0.98 20.28/23<br />
ME+PL 0.07 1.43 1.08 20.13/23<br />
NGC 4374 . . RS 0.97 ... 0.64 168.94/33<br />
ME 0.93 ... 0.62 179.05/33<br />
PL(*) 0.14 2.07 ... 32.20/33<br />
RS+PL 0.12 1.80 0.77 18.76/31<br />
ME+PL 0.14 1.83 0.64 18.34/31<br />
NGC 4395 . . RS 2.73 ... 28.01 120.52/106<br />
ME 2.77 ... 24.01 119.41/106<br />
PL(*) 2.87 1.44 ... 123.68/106<br />
RS+PL 2.93 1.48 0.03 123.62/104<br />
ME+PL 2.97 1.51 0.08 123.69/104<br />
NGC 4410A . RS 0.92 ... 0.60 337.45/45<br />
ME 0.89 ... 0.58 353.98/45<br />
PL(*) 0.01 1.75 ... 33.11/45<br />
RS+PL 0.01 1.69 0.58 31.21/43<br />
ME+PL 0.01 1.68 0.50 30.32/43<br />
NGC 4438 . . RS 0.43 ... 0.66 68.13/36<br />
ME 0.41 ... 0.57 53.97/36<br />
PL 0.89 7.69 ... 148.92/36<br />
RS+PL(*) 0.11 2.13 0.78 32.27/34<br />
ME+PL 0.23 2.42 0.60 29.04/34<br />
NGC 4457 . . RS 0.51 ... 0.63 74.99/20<br />
ME 0.43 ... 0.52 78.02/20<br />
PL 0.32 4.08 ... 68.80/20<br />
RS+PL(*) 0.07 1.98 0.66 18.68/18<br />
ME+PL 0.13 1.96 0.53 19.23/18<br />
NGC 4494 . . RS 0.78 ... 0.61 27.90/7<br />
ME 0.73 ... 0.56 29.40/7<br />
PL 0.12 2.38 ... 16.47/7<br />
RS+PL 0.01 1.13 0.82 5.03/5<br />
ME+PL(*) 0.11 1.37 0.63 5.59/5<br />
NGC 4552 . . RS 0.75 ... 0.66 354.09/63<br />
ME 0.71 ... 0.61 368.32/63<br />
PL 0.12 2.39 ... 117.28/63<br />
RS+PL(*) 0.04 1.81 0.83 57.19/61<br />
ME+PL 0.05 1.82 0.79 70.58/61<br />
NGC 4594 . . RS 0.19 ... 18.77 115.89/87<br />
ME 0.19 ... 18.49 116.02/87<br />
PL(*) 0.20 1.41 ... 118.72/87<br />
RS+PL 0.22 1.41 0.45 117.65/85<br />
ME+PL 0.25 1.43 0.39 117.03/85<br />
NGC 4696 . . RS 0.37 ... 0.70 26.71/17<br />
ME 0.35 ... 0.62 24.47/17<br />
PL(*) 0.13 4.26 ... 21.98/17<br />
RS+PL 0.41 4.67 0.27 19.94/15<br />
ME+PL 0.62 2.33 0.18 5.80/15<br />
Name (1) Model (2) NH (3) Γ (4) kT (5) χ 2 /d.o.f. (6)<br />
(10 22 cm −2 ) (keV)<br />
NGC 4736 . . . . RS 0.82 ... 0.59 635.49/81<br />
ME 0.71 ... 0.56 673.96/81<br />
PL 0.12 2.38 ... 130.19/81<br />
RS+PL 0.08 2.02 0.66 71.96/79<br />
ME+PL(*) 0.08 2.00 0.60 72.90/79<br />
NGC 5194 . . . . RS 0.09 ... 0.68 185.59/50<br />
ME 0.09 ... 0.60 114.83/50<br />
PL 0.82 8.00 ... 340.52/50<br />
RS+PL 0.02 2.98 0.69 68.32/48<br />
ME+PL(*) 0.03 2.67 0.61 49.74/48<br />
UGC 08696 . . . RS 0.09 ... 8.72 88.79/42<br />
ME 0.09 ... 9.51 78.50/42<br />
PL 0.27 2.34 ... 72.20/42<br />
RS+PL(*) 0.39 1.74 0.75 55.63/40<br />
ME+PL 0.38 1.70 0.68 56.81/40<br />
CGCG 162-010 RS 0.51 ... 0.86 117.41/63<br />
ME 0.90 ... 0.35 118.54/63<br />
PL 0.39 3.99 ... 83.83/63<br />
RS+PL(*) 0.09 2.44 1.12 59.95/61<br />
ME+PL 0.12 2.71 1.33 58.43/61<br />
NGC 5746 . . . . RS 0.64 ... 63.97 15.91/17<br />
ME 0.62 ... 79.90 15.90/17<br />
PL(*) 0.60 1.22 ... 15.66/17<br />
RS+PL 1.13 1.51 0.11 14.81/15<br />
ME+PL 0.95 1.43 0.08 15.79/15<br />
NGC 5846 . . . . RS 0.16 ... 0.65 80.52/27<br />
ME 0.25 ... 0.48 45.59/27<br />
PL 0.79 7.20 ... 160.99/27<br />
RS+PL 0.10 2.56 0.63 38.16/25<br />
ME+PL(*) 0.12 1.65 0.50 21.91/25<br />
NGC 6251 . . . . RS 0.03 ... 32.62 74.98/64<br />
ME 0.03 ... 31.18 75.08/64<br />
PL 0.05 1.36 ... 73.08/64<br />
RS+PL 0.15 1.42 0.49 67.85/62<br />
ME+PL(*) 0.44 1.60 0.26 65.27/62<br />
NGC 6240 . . . . RS 0.29 ... 48.10 181.56/114<br />
ME 0.30 ... 37.87 181.24/114<br />
PL 0.31 1.31 ... 181.95/114<br />
RS+PL(*) 1.11 1.03 0.76 126.79/112<br />
ME+PL 1.17 1.08 0.75 133.10/112<br />
NGC 6482 . . . . RS 0.30 ... 0.78 15.90/18<br />
ME(*) 0.31 ... 0.68 16.41/18<br />
PL 1.02 9.24 ... 41.40/18<br />
RS+PL 0.02 2.42 0.87 13.21/16<br />
ME+PL 0.02 2.64 0.83 14.51/16<br />
NGC 7130 . . . . RS 0.57 ... 0.63 284.55/59<br />
ME 0.54 ... 0.51 266.72/59<br />
PL 0.32 4.23 ... 192.78/59<br />
RS+PL(*) 0.06 2.51 0.82 81.43/57<br />
ME+PL 0.12 2.74 0.67 90.75/57<br />
IC 1459. . . . . . . RS 0.06 ... 7.04 341.31/168<br />
ME 0.06 ... 7.16 335.79/168<br />
PL 0.16 1.89 ... 290.02/168<br />
RS+PL 0.18 1.80 0.61 193.27/166<br />
ME+PL(*) 0.28 1.89 0.30 189.47/166
Table 5. X-<strong>ray</strong> and HST results.<br />
O. González-Martín et al.: X-<strong>ray</strong> <strong>nature</strong> <strong>of</strong> <strong>LINER</strong>s, Online Material p 5<br />
Name (1) Flux (2) Log(LX(2.0–10.0) keV) (3) Ref. (4) Obscuration (5) Classif. (6) HST-classif. (7)<br />
erg cm −2 s −1 erg s −1<br />
NGC 0315. . . . . . . . . –12.08 +0.04<br />
−0.06<br />
41.64 +0.03<br />
−0.06 (f) SF+CD AGN C<br />
ARP 318A . . . . . . . . –13.24 39.48 (e) SB<br />
ARP 318B. . . . . . . . . –13.32 40.20 (e) CD SB<br />
NGC 1052. . . . . . . . . –11.95 40.78 (e) CD AGN C<br />
NGC 2681. . . . . . . . . –13.61 +0.09<br />
−0.20 38.94 +0.10<br />
UGC 05101 . . . . . . . –13.32<br />
−0.22<br />
41.24<br />
(f)<br />
(e)<br />
AGN<br />
AGN<br />
C<br />
C<br />
NGC 3226. . . . . . . . . –12.83 39.62 (e) CD AGN C<br />
NGC 3245. . . . . . . . . –13.48 39.08 (e) SB C<br />
NGC 3379. . . . . . . . . –14.36 37.89 (e) SB C<br />
NGC 3507. . . . . . . . . –14.37 38.31 (e) SB D<br />
NGC 3607. . . . . . . . . –14.05 38.45 (e) CD SB D<br />
NGC 3608. . . . . . . . . –13.97 38.64 (e) CD SB U<br />
NGC 3628. . . . . . . . . –13.61 38.24 (e) CD AGN C<br />
NGC 3690B . . . . . . . –12.64 +0.07<br />
−0.06 40.63 +0.07<br />
NGC 4111. . . . . . . . . –13.21<br />
−0.05<br />
39.33<br />
(f)<br />
(e)<br />
CD AGN<br />
AGN<br />
C<br />
C<br />
NGC 4125. . . . . . . . . –13.91 38.93 (e) AGN C<br />
NGC 4261. . . . . . . . . –12.58 40.65 (e) AGN C<br />
NGC 4314. . . . . . . . . –13.92 37.94 (e) SB C<br />
NGC 4374. . . . . . . . . –13.03 +0.06<br />
−0.12 39.58 +0.07<br />
NGC 4395. . . . . . . . . –11.61<br />
−0.10 (f) SF AGN C<br />
+0.06<br />
−0.25 39.71 +0.05<br />
NGC 4410A . . . . . . . –12.85<br />
−0.26 (f) SF AGN C<br />
+0.06<br />
−0.06 41.26 +0.06<br />
NGC 4438. . . . . . . . . –13.32<br />
−0.06 (f) AGN C<br />
+0.11<br />
−0.37 39.22 +0.16<br />
NGC 4457. . . . . . . . . –13.51<br />
−0.28 (f) SF SB D<br />
+0.14<br />
−0.24 39.05 +0.13<br />
NGC 4459. . . . . . . . . –13.66<br />
−0.25<br />
38.83<br />
(f)<br />
(e) CD<br />
AGN<br />
SB C<br />
NGC 4486. . . . . . . . . –11.75 40.75 (e) AGN C<br />
NGC 4494. . . . . . . . . –12.93 +0.19<br />
−−0.45 39.62 +0.17<br />
NGC 4552. . . . . . . . . –13.04<br />
−0.43 (f) SF AGN C<br />
+0.06<br />
−0.09 39.41 +0.06<br />
NGC 4579. . . . . . . . . –11.38<br />
−0.09<br />
41.15<br />
(f)<br />
(e)<br />
AGN<br />
AGN<br />
C<br />
C<br />
NGC 4594. . . . . . . . . –11.99 +0.04<br />
−0.05 40.07 +0.04<br />
NGC 4596. . . . . . . . . –13.88<br />
−0.06<br />
38.65<br />
(f)<br />
(e)<br />
SF AGN<br />
SB<br />
C<br />
C<br />
NGC 4636. . . . . . . . . –13.16 39.25 (e) SB U<br />
NGC 4676A . . . . . . . –13.93 40.06 (e) CD SB D<br />
NGC 4676B . . . . . . . –13.78 40.21 (e) CD SB D<br />
NGC 4696. . . . . . . . . –13.42 +0.13<br />
−0.23 39.78 +0.09<br />
NGC 4698. . . . . . . . . –13.84<br />
−0.27<br />
38.72<br />
(f)<br />
(e)<br />
SF<br />
CD<br />
SB<br />
SB<br />
C<br />
D<br />
NGC 4736. . . . . . . . . –12.86 +0.04<br />
−0.07 38.65 +0.05<br />
NGC 5055. . . . . . . . . –13.42<br />
−0.08<br />
38.37<br />
(f)<br />
(e)<br />
AGN<br />
AGN<br />
C<br />
C<br />
NGC 5194. . . . . . . . . –13.71 +0.15<br />
−0.19 38.14 +0.13<br />
MRK 0266NE . . . . . –13.22<br />
−0.21<br />
40.98<br />
(f)<br />
(e)<br />
AGN<br />
AGN C<br />
UGC 08696 . . . . . . . –12.28 +0.15<br />
−0.21 42.18 +0.14<br />
CGCG 162-010 . . . . –13.23<br />
−0.22 (f) SF AGN C<br />
+0.19<br />
−0.29 41.73 +0.23<br />
NGC 5746. . . . . . . . . –12.73<br />
−0.27 (f) CD SB D<br />
+0.11<br />
−0.56 40.07 +0.10<br />
NGC 5846. . . . . . . . . –13.34<br />
−0.54 (f) CD AGN C<br />
+0.35<br />
−0.59 39.54 +0.38<br />
NGC 5866. . . . . . . . . –13.85<br />
−0.59<br />
38.80<br />
(f)<br />
(e)<br />
SF SB<br />
SB<br />
D<br />
NGC 6251. . . . . . . . . –12.18 +0.07<br />
−0.04 41.84 +0.07<br />
NGC 6240. . . . . . . . . –12.04<br />
−0.05 (f) SF AGN C<br />
+0.06<br />
−0.23 42.04 +0.05<br />
IRAS 17208-0014 . . –13.45<br />
−0.24<br />
41.14<br />
(f)<br />
(e)<br />
CD<br />
CD<br />
AGN<br />
AGN<br />
C<br />
C<br />
NGC 6482. . . . . . . . . –14.16 +0.14<br />
−0.30 39.40 +0.15<br />
NGC 7130. . . . . . . . . –13.23<br />
−0.37 (f) SF+CD SB<br />
+0.07<br />
−0.11 40.49 +0.08<br />
NGC 7331. . . . . . . . . –13.73<br />
−0.13<br />
38.72<br />
(f)<br />
(e)<br />
AGN<br />
SB<br />
C<br />
C<br />
IC 1459 . . . . . . . . . . . –12.20 +0.02<br />
−0.02<br />
40.56 +0.02<br />
−0.03 (f) SF AGN C<br />
Column (4): (f) Indicates flux and unabsorbed luminosity from spectral fitting and (e) indicates flux and luminosity estimated from empirical<br />
calibration. Column (5) gives those objects with obscuration indicators from spectral fitting (SF) <strong>of</strong> color–color diagrams (CD); Col. (6) gives our<br />
morphological classification attending to <strong>the</strong> 4.5–8.0 keV band; and Col. (7) gives <strong>the</strong> classification from <strong>the</strong> HST images, (C) compact, (D) dusty<br />
and (U) unclassified.
O. González-Martín et al.: X-<strong>ray</strong> <strong>nature</strong> <strong>of</strong> <strong>LINER</strong>s, Online Material p 6<br />
Table 6. Results from spectral fitting and estimate from color–color diagrams.<br />
Name Classif. Model NH NH(estim) Γ Γ(estim) kT kT(estim) χ 2 /d.o.f.<br />
(10 22 cm −2 ) (keV) (keV)<br />
NGC 0315 . . . . . . . AGN RS+PL 0.71 +0.07<br />
−0.16 ∼1022 1.48 +0.07<br />
ARP 318A . . . . . . . SB ... ... ...<br />
−0.19<br />
...<br />
[1.2–1.4] 0.22+0.08<br />
−0.01<br />
[1.8–2.0] ...<br />
[0.7–0.8] 188.77/161<br />
[0.6–0.8] ...<br />
ARP 318B . . . . . . . SB ... ... ... ... ... ... ... ...<br />
NGC 1052 . . . . . . . AGN ... ... ... ... ... ... ... ...<br />
NGC 2681 . . . . . . . AGN ME+PL 0.08 +0.07<br />
−0.08 ... 1.74 +0.52<br />
UGC 05101 . . . . . . AGN ... ... ...<br />
−0.47<br />
...<br />
[1.4–1.8] 0.66+0.09<br />
−0.08<br />
[0.4–0.6] ...<br />
[0.7–0.8]<br />
...<br />
13.94/26<br />
...<br />
NGC 3226 . . . . . . . AGN ... ... ∼1022 ... [0.8–1.2] ... [0.7–0.8] ...<br />
NGC 3245 . . . . . . . SB ... ... ... ... [2.0–2.4] ... [0.6–0.8] ...<br />
NGC 3379 . . . . . . . SB ... ... ... ... ... ... ... ...<br />
NGC 3507 . . . . . . . SB ... ... ... ... ... ... ... ...<br />
NGC 3607 . . . . . . . SB ... ... ... ... ... ... ... ...<br />
NGC 3608 . . . . . . . SB ... ... ... ... ... ... [1.0–4.0] ...<br />
NGC 3628 . . . . . . . AGN ... ... ∼1022 ... [1.2–1.6] ... [0.6–0.8] ...<br />
NGC 3690B . . . . . AGN PL 0.02 +0.15<br />
−0.02 ... 1.45 +0.33<br />
NGC 4111 . . . . . . . AGN ... ... ...<br />
−0.25<br />
...<br />
[1.4-1.8]<br />
[0.4–0.6]<br />
...<br />
...<br />
[0.6–0.7]<br />
[0.6–0.7]<br />
21.81/25<br />
...<br />
NGC 4125 . . . . . . . AGN ... ... ... ... [1.4–1.8] ... [0.6–0.8] ...<br />
NGC 4261 . . . . . . . AGN ... ... ... ... [1.5–1.6] ... ... ...<br />
NGC 4314 . . . . . . . SB ... ... ... ... ... ... ... ...<br />
NGC 4374 . . . . . . . AGN PL 0.14 +0.06<br />
−0.05 ... 2.07 +0.24<br />
NGC 4395 . . . . . . . AGN PL 2.87<br />
−0.20 [2.0–2.2] ... [0.7–0.8] 32.20/33<br />
+0.53<br />
−0.38 ... 1.44 +0.26<br />
NGC 4410A . . . . . AGN PL 0.01<br />
−0.19 ... ... ... 123.68/106<br />
+0.04<br />
−0.01 ... 1.75 +0.19<br />
NGC 4438 . . . . . . . SB RS+PL 0.11<br />
−0.12 [1.4–1.8] ... [0.7–0.8] 33.11/45<br />
+0.07<br />
−0.04 ... 2.13 +0.67<br />
NGC 4457 . . . . . . . AGN RS+PL 0.07<br />
−0.62 [1.8–2.0] 0.78+0.04<br />
−0.06 [0.7–0.9] 32.27/34<br />
+0.08<br />
−0.07 ... 1.98 +0.66<br />
NGC 4459 . . . . . . . SB ... ... ...<br />
−0.54<br />
...<br />
[1.6–1.8] 0.66+0.11<br />
−0.08<br />
... ...<br />
[0.6–0.8]<br />
...<br />
18.68/18<br />
...<br />
NGC 4486 . . . . . . . AGN ... ... ... ... [1.2–1.6] ... [0.7–0.8] ...<br />
NGC 4494 . . . . . . . AGN ME+PL 0.11 +0.15<br />
−0.01 ... 1.37 +0.91<br />
−0.88 ... 0.63 +0.20<br />
NGC 4552 . . . . . . . AGN RS+PL 0.04<br />
−0.13 ... 5.59/5<br />
+0.02<br />
−0.04 ... 1.81 +0.24<br />
NGC 4579 . . . . . . . AGN ... ... ...<br />
−0.10<br />
...<br />
[1.8–2.0] 0.83+0.05<br />
−0.07<br />
[1.2–1.6] ...<br />
[0.7–0.9]<br />
...<br />
57.19/61<br />
...<br />
NGC 4594 . . . . . . AGN PL 0.20 +0.02<br />
−0.04 ∼1022 1.41 +0.11<br />
NGC 4596 . . . . . . . SB ... ... ...<br />
−0.10<br />
...<br />
[1.6–2.0]<br />
...<br />
...<br />
...<br />
[0.4–0.6]<br />
...<br />
118.72/87<br />
...<br />
NGC 4636 . . . . . . . SB ... ... ... ... [2.0–2.2] ... [0.7–0.8] ...<br />
NGC 4676A . . . . . SB ... ... ... ... [0.8–1.2] ... ... ...<br />
NGC 4676B . . . . . SB ... ... ... ... ... ... ... ...<br />
NGC 4696 . . . . . . . SB PL 0.13 +0.18<br />
−0.13 ... 4.26 +0.96<br />
NGC 4698 . . . . . . . SB ... ... ...<br />
−0.62<br />
...<br />
...<br />
[1.2–1.6]<br />
...<br />
...<br />
...<br />
[0.7–0.8]<br />
21.98/17<br />
...<br />
NGC 4736 . . . . . . . AGN ME+PL 0.08 +0.04<br />
−0.04 ... 2.00 +0.23<br />
NGC 5055 . . . . . . . AGN ... ... ...<br />
−0.06<br />
...<br />
[1.4–1.8] 0.60+0.05<br />
−0.09<br />
[1.6–2.0] ...<br />
[0.6–0.8]<br />
[0.7–0.9]<br />
72.90/79<br />
...<br />
NGC 5194 . . . . . . . AGN ME+PL 0.03 +0.06<br />
−0.03 ... 2.67 +0.71<br />
MRK 266NE . . . . . AGN ... ... ...<br />
−0.47<br />
...<br />
[0.4-0.6] 0.61+0.03<br />
−0.04<br />
... ...<br />
[0.6–0.7]<br />
...<br />
49.74/48<br />
...<br />
UGC 08696 . . . . . . AGN RS+PL 0.39 +0.06<br />
−0.06 ... 1.74 +0.81<br />
−0.61 ... 0.75 +0.12<br />
CGCG 162-010 . . SB RS+PL 0.09<br />
−0.12 ... 55.63/40<br />
+0.21<br />
−0.09 ... 2.44 +1.51<br />
−0.43 ... 1.12 +0.18<br />
NGC 5746 . . . . . . . AGN PL 0.60<br />
−0.21 ... 59.95/61<br />
+0.36<br />
−0.52 ∼1022 1.22 +0.14<br />
NGC 5846 . . . . . . . SB ME+PL 0.12<br />
−0.39 [1.0–1.2] ... [0.7–0.8] 15.66/17<br />
+0.35<br />
−0.12 ... 1.65 +0.95<br />
NGC 5866 . . . . . . . SB ... ... ...<br />
−0.67<br />
...<br />
[0.8–1.2] 0.50+0.11<br />
−0.21<br />
... ...<br />
[0.5–0.7]<br />
...<br />
21.91/25<br />
...<br />
NGC 6251 . . . . . . . AGN ME+PL 0.44 +0.43<br />
−0.26 ∼1022 1.60 +0.29<br />
NGC 6240 . . . . . . . AGN RS+PL 1.11<br />
−0.22 [1.0–1.4] 0.26+0.34<br />
−0.09 [0.4–0.6] 65.27/62<br />
+0.10<br />
−0.10 ∼1022 1.03 +0.14<br />
IRAS 17208-0014 AGN ... ... ∼10<br />
−0.15 [0.8–1.0] 0.76+0.06<br />
−0.06 [0.7–0.8] 126.79/112<br />
22 ... [1.6–2.0] ... [0.6–0.8] ...<br />
NGC 6482 . . . . . . . SB ME 0.31 +0.10<br />
−0.18 ... ... ... 0.68 +0.13<br />
NGC 7130 . . . . . . . AGN RS+PL 0.06<br />
−0.07 ... 16.41/18<br />
+0.04<br />
−0.04 ... 2.51 +0.41<br />
NGC 7331 . . . . . . . SB ... ... ...<br />
−0.22<br />
...<br />
[1.2–1.4] 0.82+0.03<br />
−0.05<br />
[2.2–2.6] ...<br />
[0.7–0.8]<br />
[0.6-0.8]<br />
81.43/57<br />
...<br />
[0.7–0.9] 189.47/166<br />
IC 1459 . . . . . . . . . AGN ME+PL 0.28 +0.15<br />
−0.02 ... 1.89 +0.10<br />
−0.11<br />
[1.8–2.0] 0.30+0.25<br />
−0.06<br />
(*) Off <strong>of</strong> any grid. UGC 08696 has been fitted including a Gaussian model where <strong>the</strong> best fit is centered on 5.93 keV with a weight <strong>of</strong> 1.22 keV.
O. González-Martín et al.: X-<strong>ray</strong> <strong>nature</strong> <strong>of</strong> <strong>LINER</strong>s, Online Material p 7<br />
Table 7. S<strong>of</strong>t (QA), medium (QB) and hard (QC) hardness ratios for <strong>the</strong> whole sample.<br />
Name QA QB QC<br />
NGC 0315 . . . . . . . . –0.06 ± 0.05 –0.05 ± 0.04 –0.59 ± 0.03<br />
ARP 318A . . . . . . . . –0.20 ± 0.11 –0.45 ± 0.14 –0.74 ± 0.17<br />
ARP 318B . . . . . . . . 0.04 ± 0.18 –0.09 ± 0.22 –0.88 ± 0.10<br />
NGC 1052 . . . . . . . . –0.13 ± 0.21 0.03 ± 0.23 –0.37 ± 0.13<br />
NGC 2681 . . . . . . . . –0.09 ± 0.06 –0.27 ± 0.11 -0.67 ± 0.13<br />
UG-C 05101 . . . . . . –0.03 ± 0.13 –0.05 ± 0.14 –0.41 ± 0.14<br />
NGC 3226 . . . . . . . . 0.58 ± 0.13 0.09 ± 0.14 –0.49 ± 0.08<br />
NGC 3245 . . . . . . . . –0.19 ± 0.26 –0.35 ± 0.29 –0.78 ± 0.20<br />
NGC 3379 . . . . . . . . 0.18 ± 0.22 –0.34 ± 0.28 ... ...<br />
NGC 3507 . . . . . . . . –0.36 ± 0.08 –0.40 ± 0.20 ... ...<br />
NGC 3607 . . . . . . . . 0.25 ± 0.17 –0.38 ± 0.24 ... ...<br />
NGC 3608 . . . . . . . . 0.47 ± 0.22 –0.69 ± 0.17 –0.75 ± 0.23<br />
NGC 3628 . . . . . . . . 0.46 ± 0.26 0.10 ± 0.17 –0.60 ± 0.17<br />
NGC 3690B. . . . . . . 0.39 ± 0.12 –0.25 ± 0.09 –0.48 ± 0.10<br />
NGC 4111 . . . . . . . . –0.26 ± 0.08 –0.38 ± 0.18 –0.45 ± 0.17<br />
NGC 4125 . . . . . . . . –0.18 ± 0.16 –0.32 ± 0.19 –0.68 ± 0.21<br />
NGC 4261 . . . . . . . . –0.37 ± 0.03 –0.36 ± 0.07 –0.33 ± 0.06<br />
NGC 4314 . . . . . . . . –0.22 ± 0.16 –0.35 ± 0.29 ... ...<br />
NGC 4374 . . . . . . . . –0.07 ± 0.08 –0.22 ± 0.09 –0.75 ± 0.08<br />
NGC 4395 . . . . . . . . –0.20 ± 0.12 0.34 ± 0.06 –0.52 ± 0.03<br />
NGC 4410A . . . . . . –0.07 ± 0.06 –0.27 ± 0.08 –0.67 ± 0.07<br />
NGC 4438 . . . . . . . . –0.05 ± 0.05 –0.41 ± 0.09 –0.75 ± 0.13<br />
NGC 4457 . . . . . . . . –0.17 ± 0.07 –0.25 ± 0.12 –0.70 ± 0.14<br />
NGC 4459 . . . . . . . . –0.13 ± 0.25 0.00 ± 0.43 ... ...<br />
NGC 4486 . . . . . . . . –0.04 ± 0.01 –0.21 ± 0.02 –0.64 ± 0.01<br />
NGC 4494 . . . . . . . . –0.02 ± 0.12 –0.16 ± 0.16 –0.87 ± 0.08<br />
NGC 4552 . . . . . . . . –0.01 ± 0.05 –0.20 ± 0.07 –0.69 ± 0.07<br />
NGC 4579 . . . . . . . . –0.08 ± 0.02 –0.15 ± 0.02 –0.61 ± 0.02<br />
NGC 4594 . . . . . . . . 0.15 ± 0.05 –0.14 ± 0.05 –0.65 ± 0.04<br />
NGC 4596 . . . . . . . . –0.42 ± 0.37 –0.35 ± 0.56 ... ...<br />
NGC 4636 . . . . . . . . –0.12 ± 0.03 –0.50 ± 0.06 –0.73 ± 0.11<br />
NGC 4676A . . . . . . 0.07 ± 0.25 –0.10 ± 0.29 –0.53 ± 0.40<br />
NGC 4676B. . . . . . . –0.21 ± 0.18 –0.16 ± 0.25 ... ...<br />
NGC 4696 . . . . . . . . –0.17 ± 0.11 0.00 ± 0.33 ... ...<br />
NGC 4698 . . . . . . . . –0.06 ± 0.17 –0.20 ± 0.22 –0.63 ± 0.25<br />
NGC 4736 . . . . . . . . –0.15 ± 0.04 –0.23 ± 0.05 –0.68 ± 0.06<br />
NGC 5055 . . . . . . . . 0.03 ± 0.14 –0.28 ± 0.15 –0.73 ± 0.13<br />
NGC 5194 . . . . . . . . –0.25 ± 0.03 –0.42 ± 0.07 –0.45 ± 0.17<br />
MRK 0266NE . . . . . –0.01 ± 0.13 0.13 ± 0.19 –0.34 ± 0.14<br />
UGC 08696 . . . . . . . 0.00 ± 0.10 –0.14 ± 0.11 0.12 ± 0.08<br />
CGCG 162-010. . . . 0.09 ± 0.07 –0.22 ± 0.12 ... ...<br />
NGC 5746 . . . . . . . . 0.58 ± 0.18 –0.01 ± 0.12 –0.51 ± 0.08<br />
NGC 5846 . . . . . . . . –0.35 ± 0.05 –0.35 ± 0.12 –0.57 ± 0.26<br />
NGC 5866 . . . . . . . . –0.23 ± 0.21 –0.63 ± 0.29 –0.52 ± 0.24<br />
NGC 6251 . . . . . . . . 0.19 ± 0.07 –0.21 ± 0.06 –0.55 ± 0.05<br />
NGC 6240 . . . . . . . . 0.52 ± 0.05 0.01 ± 0.05 –0.48 ± 0.05<br />
IRAS 17208-0014 . 0.44 ± 0.18 0.01 ± 0.15 –0.67 ± 0.12<br />
NGC 6482 . . . . . . . . 0.10 ± 0.08 –0.38 ± 0.14 –0.83 ± 0.15<br />
NGC 7130 . . . . . . . . –0.12 ± 0.04 –0.33 ± 0.06 –0.61 ± 0.09<br />
NGC 7331 . . . . . . . . –0.16 ± 0.21 –0.35 ± 0.22 –0.81 ± 0.14<br />
IC 1459. . . . . . . . . . . 0.00 ± 0.03 –0.19 ± 0.03 –0.72 ± 0.03
O. González-Martín et al.: X-<strong>ray</strong> <strong>nature</strong> <strong>of</strong> <strong>LINER</strong>s, Online Material p 8
O. González-Martín et al.: X-<strong>ray</strong> <strong>nature</strong> <strong>of</strong> <strong>LINER</strong>s, Online Material p 9<br />
Fig. 3. ACIS-S spectra <strong>of</strong> <strong>the</strong> SF subsample. The solid line corresponds to <strong>the</strong> best fit model. Residuals from <strong>the</strong> fitting are presented in <strong>the</strong> bottom<br />
panel.
80<br />
60<br />
40<br />
20<br />
00<br />
20 40 60 80<br />
80<br />
60<br />
40<br />
20<br />
10 arcsec<br />
10 arcsec<br />
00<br />
20 40 60 80<br />
O. González-Martín et al.: X-<strong>ray</strong> <strong>nature</strong> <strong>of</strong> <strong>LINER</strong>s, Online Material p 10<br />
80<br />
60<br />
40<br />
20<br />
DEC=30.352430<br />
10 arcsec<br />
RA=14.453630<br />
00<br />
20 40 60 80<br />
80<br />
60<br />
40<br />
20<br />
10 arcsec<br />
00<br />
20 40 60 80<br />
80<br />
60<br />
40<br />
20<br />
10 arcsec<br />
00<br />
20 40 60 80<br />
80<br />
60<br />
40<br />
20<br />
10 arcsec<br />
00<br />
20 40 60 80<br />
0 2<br />
0 4<br />
0 6<br />
Fig. 5. Top image corresponds to <strong>the</strong> 0.6-8.0 keV band without smooth. The following 4 images correspond to <strong>the</strong> X-<strong>ray</strong> bands 0.6–0.9 (centre-left),<br />
1.6–2.0 (centre-centre), 4.5–8.0 ∗ (centre-right) and 6.0–7.0 keV (bottom-left). The 2MASS image in Ks band is plotted in <strong>the</strong> bottom-centre box.<br />
The enlarged view <strong>of</strong> <strong>the</strong> region marked as a rectangle in <strong>the</strong> top image is <strong>the</strong> HST optical image in <strong>the</strong> filter F814W (bottom-right). NGC 0315.<br />
60<br />
40<br />
20<br />
0<br />
0
250<br />
200<br />
150<br />
100<br />
50<br />
10 arcsec<br />
00<br />
50 100 150 200 250<br />
Fig. 5. ARP 318A.<br />
250<br />
200<br />
150<br />
100<br />
50<br />
10 arcsec<br />
O. González-Martín et al.: X-<strong>ray</strong> <strong>nature</strong> <strong>of</strong> <strong>LINER</strong>s, Online Material p 11<br />
250<br />
200<br />
150DEC=-10.145940<br />
100<br />
50<br />
10 arcsec<br />
RA=32.410511<br />
00<br />
50 100 150 200 250<br />
250<br />
200<br />
150<br />
100<br />
50<br />
10 arcsec<br />
00<br />
50 100 150 200 250<br />
00<br />
50 100 150 200 250<br />
250<br />
200<br />
150<br />
100<br />
50<br />
10 arcsec<br />
250<br />
200<br />
150<br />
100<br />
50<br />
10 arcsec<br />
00<br />
50 100 150 200 250<br />
00<br />
50 100 15 0 20 0 250
150<br />
100<br />
50<br />
10 arcsec<br />
00<br />
50 100 150<br />
Fig. 5. ARP 318B.<br />
150<br />
100<br />
50<br />
10 arcsec<br />
O. González-Martín et al.: X-<strong>ray</strong> <strong>nature</strong> <strong>of</strong> <strong>LINER</strong>s, Online Material p 12<br />
150<br />
100DEC=-10.183930<br />
50<br />
10 arcsec<br />
RA=32.428009<br />
00<br />
50 100 150<br />
150<br />
100<br />
50<br />
10 arcsec<br />
00<br />
50 100 150<br />
00<br />
50 100 150<br />
150<br />
100<br />
50<br />
10 arcsec<br />
150<br />
100<br />
50<br />
10 arcsec<br />
00<br />
50 100 150<br />
00<br />
50 1 00 15 0
80<br />
60<br />
40<br />
20<br />
00<br />
20 40 60 80<br />
80<br />
60<br />
40<br />
20<br />
10 arcsec<br />
10 arcsec<br />
00<br />
20 40 60 80<br />
Fig. 5. NGC 1052.<br />
O. González-Martín et al.: X-<strong>ray</strong> <strong>nature</strong> <strong>of</strong> <strong>LINER</strong>s, Online Material p 13<br />
80<br />
60<br />
40<br />
20<br />
DEC=-8.2557135<br />
10 arcsec<br />
RA=40.270142<br />
00<br />
20 40 60 80<br />
80<br />
60<br />
40<br />
20<br />
10 arcsec<br />
00<br />
20 40 60 80<br />
80<br />
60<br />
40<br />
20<br />
10 arcsec<br />
00<br />
20 40 60 80<br />
80<br />
60<br />
40<br />
20<br />
10 arcsec<br />
00<br />
20 40 60 80<br />
150<br />
100<br />
50<br />
0 5<br />
0<br />
0 1<br />
0<br />
0 1<br />
50
80<br />
60<br />
40<br />
20<br />
00<br />
20 40 60 80<br />
80<br />
60<br />
40<br />
20<br />
10 arcsec<br />
10 arcsec<br />
00<br />
20 40 60 80<br />
Fig. 5. NGC 2681.<br />
O. González-Martín et al.: X-<strong>ray</strong> <strong>nature</strong> <strong>of</strong> <strong>LINER</strong>s, Online Material p 14<br />
80<br />
60<br />
40<br />
20<br />
DEC=51.313568<br />
10 arcsec<br />
RA=133.38660<br />
00<br />
20 40 60 80<br />
80<br />
60<br />
40<br />
20<br />
10 arcsec<br />
00<br />
20 40 60 80<br />
80<br />
60<br />
40<br />
20<br />
10 arcsec<br />
00<br />
20 40 60 80<br />
80<br />
60<br />
40<br />
20<br />
10 arcsec<br />
00<br />
20 40 60 80<br />
200<br />
150<br />
100<br />
50<br />
0 5<br />
0<br />
0 1<br />
00<br />
15<br />
0 2<br />
00
60<br />
40<br />
20<br />
00<br />
20 40 60<br />
60<br />
40<br />
20<br />
10 arcsec<br />
10 arcsec<br />
00<br />
20 40 60<br />
Fig. 5. UGC 05101.<br />
O. González-Martín et al.: X-<strong>ray</strong> <strong>nature</strong> <strong>of</strong> <strong>LINER</strong>s, Online Material p 15<br />
60<br />
40DEC=61.353069<br />
20<br />
10 arcsec<br />
RA=143.96530<br />
00<br />
20 40 60<br />
60<br />
40<br />
20<br />
10 arcsec<br />
00<br />
20 40 60<br />
60<br />
40<br />
20<br />
10 arcsec<br />
00<br />
20 40 60<br />
60<br />
40<br />
20<br />
10 arcsec<br />
00<br />
20 40 60<br />
80<br />
60<br />
40<br />
20<br />
0 2<br />
0<br />
0 4<br />
0 6<br />
0 8<br />
0
100<br />
80<br />
60<br />
40<br />
20<br />
00<br />
20 40 60 80 100<br />
100<br />
80<br />
60<br />
40<br />
20<br />
10 arcsec<br />
10 arcsec<br />
00<br />
20 40 60 80 100<br />
Fig. 5. NGC 3226.<br />
O. González-Martín et al.: X-<strong>ray</strong> <strong>nature</strong> <strong>of</strong> <strong>LINER</strong>s, Online Material p 16<br />
100<br />
80<br />
60DEC=19.898491<br />
40<br />
20<br />
10 arcsec<br />
RA=155.86259<br />
00<br />
20 40 60 80 100<br />
100<br />
80<br />
60<br />
40<br />
20<br />
10 arcsec<br />
00<br />
20 40 60 80 100<br />
100<br />
80<br />
60<br />
40<br />
20<br />
10 arcsec<br />
00<br />
20 40 60 80 100<br />
100<br />
80<br />
60<br />
40<br />
20<br />
10 arcsec<br />
00<br />
20 4 0 6 0 80 100<br />
60<br />
40<br />
20<br />
0 2<br />
0<br />
0 4<br />
0 6<br />
0
60<br />
40<br />
20<br />
00<br />
20 40 60<br />
60<br />
40<br />
20<br />
10 arcsec<br />
10 arcsec<br />
00<br />
20 40 60<br />
Fig. 5. NGC 3245.<br />
O. González-Martín et al.: X-<strong>ray</strong> <strong>nature</strong> <strong>of</strong> <strong>LINER</strong>s, Online Material p 17<br />
60<br />
40DEC=28.507561<br />
20<br />
10 arcsec<br />
RA=156.82640<br />
00<br />
20 40 60<br />
60<br />
40<br />
20<br />
10 arcsec<br />
00<br />
20 40 60<br />
60<br />
40<br />
20<br />
10 arcsec<br />
00<br />
20 40 60<br />
60<br />
40<br />
20<br />
10 arcsec<br />
00<br />
20 40 60<br />
150<br />
100<br />
50<br />
0 5<br />
0<br />
0 1<br />
0<br />
0 1<br />
50
80<br />
60<br />
40<br />
20<br />
00<br />
20 40 60 80<br />
80<br />
60<br />
40<br />
20<br />
10 arcsec<br />
10 arcsec<br />
00<br />
20 40 60 80<br />
Fig. 5. NGC 3379.<br />
O. González-Martín et al.: X-<strong>ray</strong> <strong>nature</strong> <strong>of</strong> <strong>LINER</strong>s, Online Material p 18<br />
80<br />
60<br />
40<br />
20<br />
DEC=12.581597<br />
10 arcsec<br />
RA=161.95671<br />
00<br />
20 40 60 80<br />
80<br />
60<br />
40<br />
20<br />
10 arcsec<br />
00<br />
20 40 60 80<br />
80<br />
60<br />
40<br />
20<br />
10 arcsec<br />
00<br />
20 40 60 80<br />
80<br />
60<br />
40<br />
20<br />
10 arcsec<br />
00<br />
20 40 60 80<br />
100<br />
80<br />
60<br />
40<br />
20<br />
0 2<br />
0<br />
0 4<br />
0 6<br />
0 8<br />
0 1<br />
00
80<br />
60<br />
40<br />
20<br />
00<br />
20 40 60 80<br />
80<br />
60<br />
40<br />
20<br />
10 arcsec<br />
10 arcsec<br />
00<br />
20 40 60 80<br />
Fig. 5. NGC 3507.<br />
O. González-Martín et al.: X-<strong>ray</strong> <strong>nature</strong> <strong>of</strong> <strong>LINER</strong>s, Online Material p 19<br />
80<br />
60<br />
40<br />
20<br />
DEC=18.135370<br />
10 arcsec<br />
RA=165.85550<br />
00<br />
20 40 60 80<br />
80<br />
60<br />
40<br />
20<br />
10 arcsec<br />
00<br />
20 40 60 80<br />
80<br />
60<br />
40<br />
20<br />
10 arcsec<br />
00<br />
20 40 60 80<br />
80<br />
60<br />
40<br />
20<br />
10 arcsec<br />
00<br />
20 40 60 80<br />
100<br />
80<br />
60<br />
40<br />
20<br />
0 2<br />
0<br />
0 4<br />
0 6<br />
0 8<br />
0 1<br />
00
100<br />
80<br />
60<br />
40<br />
20<br />
00<br />
20 40 60 80 100<br />
100<br />
80<br />
60<br />
40<br />
20<br />
10 arcsec<br />
10 arcsec<br />
00<br />
20 40 60 80 100<br />
Fig. 5. NGC 3607.<br />
O. González-Martín et al.: X-<strong>ray</strong> <strong>nature</strong> <strong>of</strong> <strong>LINER</strong>s, Online Material p 20<br />
100<br />
80<br />
60DEC=18.051220<br />
40<br />
20<br />
10 arcsec<br />
RA=169.22760<br />
00<br />
20 40 60 80 100<br />
100<br />
80<br />
60<br />
40<br />
20<br />
10 arcsec<br />
00<br />
20 40 60 80 100<br />
100<br />
80<br />
60<br />
40<br />
20<br />
10 arcsec<br />
00<br />
20 40 60 80 100<br />
100<br />
80<br />
60<br />
40<br />
20<br />
10 arcsec<br />
00<br />
20 4 0 6 0 80 100<br />
100<br />
80<br />
60<br />
40<br />
20<br />
0 2<br />
0<br />
0 4<br />
0 6<br />
0 8<br />
0 1<br />
00
100<br />
80<br />
60<br />
40<br />
20<br />
00<br />
20 40 60 80 100<br />
100<br />
80<br />
60<br />
40<br />
20<br />
10 arcsec<br />
10 arcsec<br />
00<br />
20 40 60 80 100<br />
Fig. 5. NGC 3608.<br />
O. González-Martín et al.: X-<strong>ray</strong> <strong>nature</strong> <strong>of</strong> <strong>LINER</strong>s, Online Material p 21<br />
100<br />
80<br />
60DEC=18.148251<br />
40<br />
20<br />
10 arcsec<br />
RA=169.24541<br />
00<br />
20 40 60 80 100<br />
100<br />
80<br />
60<br />
40<br />
20<br />
10 arcsec<br />
00<br />
20 40 60 80 100<br />
100<br />
80<br />
60<br />
40<br />
20<br />
10 arcsec<br />
00<br />
20 40 60 80 100<br />
100<br />
80<br />
60<br />
40<br />
20<br />
10 arcsec<br />
00<br />
20 4 0 6 0 80 100<br />
100<br />
80<br />
60<br />
40<br />
20<br />
0 2<br />
0<br />
0 4<br />
0 6<br />
0 8<br />
0 1<br />
00
150<br />
100<br />
50<br />
00<br />
50 100 150<br />
150<br />
100<br />
50<br />
10 arcsec<br />
10 arcsec<br />
00<br />
50 100 150<br />
Fig. 5. NGC 3628.<br />
O. González-Martín et al.: X-<strong>ray</strong> <strong>nature</strong> <strong>of</strong> <strong>LINER</strong>s, Online Material p 22<br />
150<br />
100<br />
50<br />
DEC=13.589653<br />
10 arcsec<br />
RA=170.07050<br />
00<br />
50 100 150<br />
150<br />
100<br />
50<br />
10 arcsec<br />
00<br />
50 100 150<br />
150<br />
100<br />
50<br />
10 arcsec<br />
00<br />
50 100 150<br />
150<br />
100<br />
50<br />
10 arcsec<br />
00<br />
50 100 1 50<br />
150<br />
100<br />
50<br />
0 5<br />
0<br />
0 1<br />
0<br />
0 1<br />
50
150<br />
100<br />
50<br />
00<br />
50 100 150<br />
150<br />
100<br />
50<br />
10 arcsec<br />
10 arcsec<br />
00<br />
50 100 150<br />
Fig. 5. NGC 3690.<br />
O. González-Martín et al.: X-<strong>ray</strong> <strong>nature</strong> <strong>of</strong> <strong>LINER</strong>s, Online Material p 23<br />
150<br />
100<br />
50<br />
DEC=58.561241<br />
10 arcsec<br />
RA=172.12891<br />
00<br />
50 100 150<br />
150<br />
100<br />
50<br />
10 arcsec<br />
00<br />
50 100 150<br />
150<br />
100<br />
50<br />
10 arcsec<br />
00<br />
50 100 150<br />
150<br />
100<br />
50<br />
10 arcsec<br />
00<br />
50 100 1 50<br />
200<br />
150<br />
100<br />
50<br />
0 5<br />
0<br />
0 1<br />
00<br />
15<br />
0 2<br />
00
50<br />
40<br />
30<br />
20<br />
10<br />
00<br />
10 20 30 40 50<br />
50<br />
40<br />
30<br />
20<br />
10<br />
10 arcsec<br />
10 arcsec<br />
00<br />
10 20 30 40 50<br />
Fig. 5. NGC 4111.<br />
O. González-Martín et al.: X-<strong>ray</strong> <strong>nature</strong> <strong>of</strong> <strong>LINER</strong>s, Online Material p 24<br />
50<br />
40<br />
30DEC=43.065929<br />
20<br />
10<br />
10 arcsec<br />
RA=181.76311<br />
00<br />
10 20 30 40 50<br />
50<br />
40<br />
30<br />
20<br />
10<br />
10 arcsec<br />
00<br />
10 20 30 40 50<br />
50<br />
40<br />
30<br />
20<br />
10<br />
10 arcsec<br />
00<br />
10 20 30 40 50<br />
50<br />
40<br />
30<br />
20<br />
10<br />
10 arcsec<br />
00<br />
10 20 30 40 5 0<br />
150<br />
100<br />
50<br />
0 5<br />
0<br />
0 1<br />
0<br />
0 1<br />
50
80<br />
60<br />
40<br />
20<br />
00<br />
20 40 60 80<br />
80<br />
60<br />
40<br />
20<br />
10 arcsec<br />
10 arcsec<br />
00<br />
20 40 60 80<br />
Fig. 5. NGC 4125.<br />
O. González-Martín et al.: X-<strong>ray</strong> <strong>nature</strong> <strong>of</strong> <strong>LINER</strong>s, Online Material p 25<br />
80<br />
60<br />
40<br />
20<br />
DEC=65.174332<br />
10 arcsec<br />
RA=182.02499<br />
00<br />
20 40 60 80<br />
80<br />
60<br />
40<br />
20<br />
10 arcsec<br />
00<br />
20 40 60 80<br />
80<br />
60<br />
40<br />
20<br />
10 arcsec<br />
00<br />
20 40 60 80<br />
80<br />
60<br />
40<br />
20<br />
10 arcsec<br />
00<br />
20 40 60 80<br />
80<br />
60<br />
40<br />
20<br />
0 2<br />
0<br />
0 4<br />
0 6<br />
0 8<br />
0
120<br />
100<br />
80<br />
60<br />
40<br />
20<br />
00<br />
20 40 60 80 100 120<br />
120<br />
100<br />
80<br />
60<br />
40<br />
20<br />
10 arcsec<br />
10 arcsec<br />
00<br />
20 40 60 80 100 120<br />
Fig. 5. NGC 4261.<br />
O. González-Martín et al.: X-<strong>ray</strong> <strong>nature</strong> <strong>of</strong> <strong>LINER</strong>s, Online Material p 26<br />
120<br />
100<br />
80<br />
60<br />
40<br />
20<br />
DEC=5.8251090<br />
10 arcsec<br />
RA=184.84680<br />
00<br />
20 40 60 80 100 120<br />
120<br />
100<br />
80<br />
60<br />
40<br />
20<br />
10 arcsec<br />
00<br />
20 40 60 80 100 120<br />
120<br />
100<br />
80<br />
60<br />
40<br />
20<br />
10 arcsec<br />
00<br />
20 40 60 80 100 120<br />
120<br />
100<br />
80<br />
60<br />
40<br />
20<br />
10 arcsec<br />
00<br />
20 4 0 6 0 8 0 100 12 0<br />
80<br />
60<br />
40<br />
20<br />
0 2<br />
0<br />
0 4<br />
0 6<br />
0 8<br />
0
150<br />
100<br />
50<br />
00<br />
50 100 150<br />
150<br />
100<br />
50<br />
10 arcsec<br />
10 arcsec<br />
00<br />
50 100 150<br />
Fig. 5. NGC 4314.<br />
O. González-Martín et al.: X-<strong>ray</strong> <strong>nature</strong> <strong>of</strong> <strong>LINER</strong>s, Online Material p 27<br />
150<br />
100DEC=29.895769<br />
50<br />
10 arcsec<br />
RA=185.63380<br />
00<br />
50 100 150<br />
150<br />
100<br />
50<br />
10 arcsec<br />
00<br />
50 100 150<br />
150<br />
100<br />
50<br />
10 arcsec<br />
00<br />
50 100 150<br />
150<br />
100<br />
50<br />
10 arcsec<br />
00<br />
50 1 00 15 0<br />
150<br />
100<br />
50<br />
0 5<br />
0<br />
0 1<br />
0<br />
0 1<br />
50
150<br />
100<br />
50<br />
00<br />
50 100 150<br />
150<br />
100<br />
50<br />
10 arcsec<br />
10 arcsec<br />
00<br />
50 100 150<br />
Fig. 5. NGC 4374.<br />
O. González-Martín et al.: X-<strong>ray</strong> <strong>nature</strong> <strong>of</strong> <strong>LINER</strong>s, Online Material p 28<br />
150<br />
100<br />
50<br />
DEC=12.887010<br />
10 arcsec<br />
RA=186.26550<br />
00<br />
50 100 150<br />
150<br />
100<br />
50<br />
10 arcsec<br />
00<br />
50 100 150<br />
150<br />
100<br />
50<br />
10 arcsec<br />
00<br />
50 100 150<br />
150<br />
100<br />
50<br />
10 arcsec<br />
00<br />
50 100 1 50<br />
150<br />
100<br />
50<br />
0 5<br />
0<br />
0 1<br />
0<br />
0 1<br />
50
150<br />
100<br />
50<br />
00<br />
50 100 150<br />
150<br />
100<br />
50<br />
10 arcsec<br />
10 arcsec<br />
00<br />
50 100 150<br />
Fig. 5. NGC 4395.<br />
O. González-Martín et al.: X-<strong>ray</strong> <strong>nature</strong> <strong>of</strong> <strong>LINER</strong>s, Online Material p 29<br />
150<br />
100<br />
50<br />
DEC=33.546791<br />
10 arcsec<br />
RA=186.45360<br />
00<br />
50 100 150<br />
150<br />
100<br />
50<br />
10 arcsec<br />
00<br />
50 100 150<br />
150<br />
100<br />
50<br />
10 arcsec<br />
00<br />
50 100 150<br />
150<br />
100<br />
50<br />
10 arcsec<br />
00<br />
50 100 1 50<br />
150<br />
100<br />
50<br />
0 5<br />
0<br />
0 1<br />
0<br />
0 1<br />
50
100<br />
80<br />
60<br />
40<br />
20<br />
00<br />
20 40 60 80 100<br />
100<br />
80<br />
60<br />
40<br />
20<br />
10 arcsec<br />
10 arcsec<br />
00<br />
20 40 60 80 100<br />
Fig. 5. NGC 4410A.<br />
O. González-Martín et al.: X-<strong>ray</strong> <strong>nature</strong> <strong>of</strong> <strong>LINER</strong>s, Online Material p 30<br />
100<br />
80<br />
60DEC=9.0196695<br />
40<br />
20<br />
10 arcsec<br />
RA=186.61760<br />
00<br />
20 40 60 80 100<br />
100<br />
80<br />
60<br />
40<br />
20<br />
10 arcsec<br />
00<br />
20 40 60 80 100<br />
100<br />
80<br />
60<br />
40<br />
20<br />
10 arcsec<br />
00<br />
20 40 60 80 100<br />
100<br />
80<br />
60<br />
40<br />
20<br />
10 arcsec<br />
00<br />
20 4 0 6 0 80 100<br />
150<br />
100<br />
50<br />
0 5<br />
0<br />
0 1<br />
0<br />
0 1<br />
50
80<br />
60<br />
40<br />
20<br />
00<br />
20 40 60 80<br />
80<br />
60<br />
40<br />
20<br />
10 arcsec<br />
10 arcsec<br />
00<br />
20 40 60 80<br />
Fig. 5. NGC 4438.<br />
O. González-Martín et al.: X-<strong>ray</strong> <strong>nature</strong> <strong>of</strong> <strong>LINER</strong>s, Online Material p 31<br />
80<br />
60<br />
40<br />
20<br />
DEC=13.009170<br />
10 arcsec<br />
RA=186.94000<br />
00<br />
20 40 60 80<br />
80<br />
60<br />
40<br />
20<br />
10 arcsec<br />
00<br />
20 40 60 80<br />
80<br />
60<br />
40<br />
20<br />
10 arcsec<br />
00<br />
20 40 60 80<br />
80<br />
60<br />
40<br />
20<br />
10 arcsec<br />
00<br />
20 40 60 80<br />
150<br />
100<br />
50<br />
0 5<br />
0<br />
0 1<br />
0<br />
0 1<br />
50
120<br />
100<br />
80<br />
60<br />
40<br />
20<br />
10 arcsec<br />
00<br />
20 40 60 80 100 120<br />
Fig. 5. NGC 4457.<br />
120<br />
100<br />
80<br />
60<br />
40<br />
20<br />
10 arcsec<br />
O. González-Martín et al.: X-<strong>ray</strong> <strong>nature</strong> <strong>of</strong> <strong>LINER</strong>s, Online Material p 32<br />
120<br />
100<br />
80<br />
60<br />
40<br />
20<br />
DEC=3.5706370<br />
10 arcsec<br />
RA=187.24600<br />
00<br />
20 40 60 80 100 120<br />
120<br />
100<br />
80<br />
60<br />
40<br />
20<br />
10 arcsec<br />
00<br />
20 40 60 80 100 120<br />
00<br />
20 40 60 80 100 120<br />
120<br />
100<br />
80<br />
60<br />
40<br />
20<br />
10 arcsec<br />
120<br />
100<br />
80<br />
60<br />
40<br />
20<br />
10 arcsec<br />
00<br />
20 40 6 0 80 100 120<br />
00<br />
20 4 0 6 0 8 0 100 12 0
150<br />
100<br />
50<br />
00<br />
50 100 150<br />
150<br />
100<br />
50<br />
10 arcsec<br />
10 arcsec<br />
00<br />
50 100 150<br />
Fig. 5. NGC 4459.<br />
O. González-Martín et al.: X-<strong>ray</strong> <strong>nature</strong> <strong>of</strong> <strong>LINER</strong>s, Online Material p 33<br />
150<br />
100DEC=13.978260<br />
50<br />
10 arcsec<br />
RA=187.25020<br />
00<br />
50 100 150<br />
150<br />
100<br />
50<br />
10 arcsec<br />
00<br />
50 100 150<br />
150<br />
100<br />
50<br />
10 arcsec<br />
00<br />
50 100 150<br />
150<br />
100<br />
50<br />
10 arcsec<br />
00<br />
50 1 00 15 0<br />
120<br />
100<br />
80<br />
60<br />
40<br />
20<br />
0 2<br />
0<br />
0 4<br />
0 6<br />
0 8<br />
0 1<br />
0<br />
0 1<br />
20
200<br />
150<br />
100<br />
50<br />
00<br />
50 100 150 200<br />
200<br />
150<br />
100<br />
50<br />
10 arcsec<br />
10 arcsec<br />
00<br />
50 100 150 200<br />
Fig. 5. NGC 4486.<br />
O. González-Martín et al.: X-<strong>ray</strong> <strong>nature</strong> <strong>of</strong> <strong>LINER</strong>s, Online Material p 34<br />
200<br />
150<br />
100<br />
50<br />
DEC=12.391200<br />
10 arcsec<br />
RA=187.70590<br />
00<br />
50 100 150 200<br />
200<br />
150<br />
100<br />
50<br />
10 arcsec<br />
00<br />
50 100 150 200<br />
200<br />
150<br />
100<br />
50<br />
10 arcsec<br />
00<br />
50 100 150 200<br />
200<br />
150<br />
100<br />
50<br />
10 arcsec<br />
00<br />
5 0 100 150 2 00<br />
200<br />
150<br />
100<br />
50<br />
0 5<br />
0<br />
0 1<br />
00<br />
15<br />
0 2<br />
00
80<br />
60<br />
40<br />
20<br />
00<br />
20 40 60 80<br />
80<br />
60<br />
40<br />
20<br />
10 arcsec<br />
10 arcsec<br />
00<br />
20 40 60 80<br />
Fig. 5. NGC 4494.<br />
O. González-Martín et al.: X-<strong>ray</strong> <strong>nature</strong> <strong>of</strong> <strong>LINER</strong>s, Online Material p 35<br />
80<br />
60<br />
40<br />
20<br />
DEC=25.774940<br />
10 arcsec<br />
RA=187.85040<br />
00<br />
20 40 60 80<br />
80<br />
60<br />
40<br />
20<br />
10 arcsec<br />
00<br />
20 40 60 80<br />
80<br />
60<br />
40<br />
20<br />
10 arcsec<br />
00<br />
20 40 60 80<br />
80<br />
60<br />
40<br />
20<br />
10 arcsec<br />
00<br />
20 40 60 80<br />
50<br />
40<br />
30<br />
20<br />
10<br />
0 1<br />
0<br />
0 2<br />
0 3<br />
0 4<br />
0 5<br />
0
120<br />
100<br />
80<br />
60<br />
40<br />
20<br />
00<br />
20 40 60 80 100 120<br />
120<br />
100<br />
80<br />
60<br />
40<br />
20<br />
10 arcsec<br />
10 arcsec<br />
00<br />
20 40 60 80 100 120<br />
Fig. 5. NGC 4552.<br />
O. González-Martín et al.: X-<strong>ray</strong> <strong>nature</strong> <strong>of</strong> <strong>LINER</strong>s, Online Material p 36<br />
120<br />
100<br />
80<br />
60<br />
40<br />
20<br />
DEC=12.556490<br />
10 arcsec<br />
RA=188.91589<br />
00<br />
20 40 60 80 100 120<br />
120<br />
100<br />
80<br />
60<br />
40<br />
20<br />
10 arcsec<br />
00<br />
20 40 60 80 100 120<br />
120<br />
100<br />
80<br />
60<br />
40<br />
20<br />
10 arcsec<br />
00<br />
20 40 60 80 100 120<br />
120<br />
100<br />
80<br />
60<br />
40<br />
20<br />
10 arcsec<br />
00<br />
20 4 0 6 0 8 0 100 12 0<br />
60<br />
40<br />
20<br />
0 2<br />
0<br />
0 4<br />
0 6<br />
0
100<br />
80<br />
60<br />
40<br />
20<br />
00<br />
20 40 60 80 100<br />
100<br />
80<br />
60<br />
40<br />
20<br />
10 arcsec<br />
10 arcsec<br />
00<br />
20 40 60 80 100<br />
Fig. 5. NGC 4579.<br />
O. González-Martín et al.: X-<strong>ray</strong> <strong>nature</strong> <strong>of</strong> <strong>LINER</strong>s, Online Material p 37<br />
100<br />
80<br />
60DEC=11.818190<br />
40<br />
20<br />
10 arcsec<br />
RA=189.43120<br />
00<br />
20 40 60 80 100<br />
100<br />
80<br />
60<br />
40<br />
20<br />
10 arcsec<br />
00<br />
20 40 60 80 100<br />
100<br />
80<br />
60<br />
40<br />
20<br />
10 arcsec<br />
00<br />
20 40 60 80 100<br />
100<br />
80<br />
60<br />
40<br />
20<br />
10 arcsec<br />
00<br />
20 4 0 6 0 80 100<br />
120<br />
100<br />
80<br />
60<br />
40<br />
20<br />
0 2<br />
0<br />
0 4<br />
0 6<br />
0 8<br />
0 1<br />
0<br />
0 1<br />
20
150<br />
100<br />
50<br />
00<br />
50 100 150<br />
150<br />
100<br />
50<br />
10 arcsec<br />
10 arcsec<br />
00<br />
50 100 150<br />
Fig. 5. NGC 4594.<br />
O. González-Martín et al.: X-<strong>ray</strong> <strong>nature</strong> <strong>of</strong> <strong>LINER</strong>s, Online Material p 38<br />
150<br />
100<br />
50<br />
DEC=-11.623070<br />
10 arcsec<br />
RA=189.99770<br />
00<br />
50 100 150<br />
150<br />
100<br />
50<br />
10 arcsec<br />
00<br />
50 100 150<br />
150<br />
100<br />
50<br />
10 arcsec<br />
00<br />
50 100 150<br />
150<br />
100<br />
50<br />
10 arcsec<br />
00<br />
50 100 150<br />
150<br />
100<br />
50<br />
0 5<br />
0<br />
0 1<br />
0<br />
0 1<br />
50
150<br />
100<br />
50<br />
00<br />
50 100 150<br />
150<br />
100<br />
50<br />
10 arcsec<br />
10 arcsec<br />
00<br />
50 100 150<br />
Fig. 5. NGC 4596.<br />
O. González-Martín et al.: X-<strong>ray</strong> <strong>nature</strong> <strong>of</strong> <strong>LINER</strong>s, Online Material p 39<br />
150<br />
100<br />
50<br />
DEC=10.176470<br />
10 arcsec<br />
RA=189.98320<br />
00<br />
50 100 150<br />
150<br />
100<br />
50<br />
10 arcsec<br />
00<br />
50 100 150<br />
150<br />
100<br />
50<br />
10 arcsec<br />
00<br />
50 100 150<br />
150<br />
100<br />
50<br />
10 arcsec<br />
00<br />
50 100 150<br />
150<br />
100<br />
50<br />
0 5<br />
0<br />
0 1<br />
0<br />
0 1<br />
50
150<br />
100<br />
50<br />
00<br />
50 100 150<br />
150<br />
100<br />
50<br />
10 arcsec<br />
10 arcsec<br />
00<br />
50 100 150<br />
Fig. 5. NGC 4636.<br />
O. González-Martín et al.: X-<strong>ray</strong> <strong>nature</strong> <strong>of</strong> <strong>LINER</strong>s, Online Material p 40<br />
150<br />
100DEC=2.6877408<br />
50<br />
10 arcsec<br />
RA=190.70760<br />
00<br />
50 100 150<br />
150<br />
100<br />
50<br />
10 arcsec<br />
00<br />
50 100 150<br />
150<br />
100<br />
50<br />
10 arcsec<br />
00<br />
50 100 150<br />
150<br />
100<br />
50<br />
10 arcsec<br />
00<br />
50 1 00 15 0<br />
150<br />
100<br />
50<br />
0 5<br />
0<br />
0 1<br />
0<br />
0 1<br />
50
150<br />
100<br />
50<br />
00<br />
50 100 150<br />
150<br />
100<br />
50<br />
10 arcsec<br />
10 arcsec<br />
00<br />
50 100 150<br />
Fig. 5. NGC 4676A.<br />
O. González-Martín et al.: X-<strong>ray</strong> <strong>nature</strong> <strong>of</strong> <strong>LINER</strong>s, Online Material p 41<br />
150<br />
100<br />
50<br />
DEC=30.732109<br />
10 arcsec<br />
RA=191.54221<br />
00<br />
50 100 150<br />
150<br />
100<br />
50<br />
10 arcsec<br />
00<br />
50 100 150<br />
150<br />
100<br />
50<br />
10 arcsec<br />
00<br />
50 100 150<br />
150<br />
100<br />
50<br />
10 arcsec<br />
00<br />
50 100 150<br />
150<br />
100<br />
50<br />
0 5<br />
0<br />
0 1<br />
0<br />
0 1<br />
50
60<br />
40<br />
20<br />
00<br />
20 40 60<br />
60<br />
40<br />
20<br />
10 arcsec<br />
10 arcsec<br />
00<br />
20 40 60<br />
Fig. 5. NGC 4676B.<br />
O. González-Martín et al.: X-<strong>ray</strong> <strong>nature</strong> <strong>of</strong> <strong>LINER</strong>s, Online Material p 42<br />
60<br />
40<br />
DEC=30.723091<br />
20<br />
10 arcsec<br />
RA=191.54645<br />
00<br />
20 40 60<br />
60<br />
40<br />
20<br />
10 arcsec<br />
00<br />
20 40 60<br />
60<br />
40<br />
20<br />
10 arcsec<br />
00<br />
20 40 60<br />
60<br />
40<br />
20<br />
10 arcsec<br />
00<br />
2 0 40 60<br />
120<br />
100<br />
80<br />
60<br />
40<br />
20<br />
0 2<br />
0<br />
0 4<br />
0 6<br />
0 8<br />
0 1<br />
0<br />
0 1<br />
20
250<br />
200<br />
150<br />
100<br />
50<br />
00<br />
50 100 150 200 250<br />
250<br />
200<br />
150<br />
100<br />
50<br />
10 arcsec<br />
10 arcsec<br />
00<br />
50 100 150 200 250<br />
Fig. 5. NGC 4696.<br />
O. González-Martín et al.: X-<strong>ray</strong> <strong>nature</strong> <strong>of</strong> <strong>LINER</strong>s, Online Material p 43<br />
250<br />
200<br />
150<br />
100<br />
50<br />
DEC=-41.312031<br />
10 arcsec<br />
RA=192.20351<br />
00<br />
50 100 150 200 250<br />
250<br />
200<br />
150<br />
100<br />
50<br />
10 arcsec<br />
00<br />
50 100 150 200 250<br />
250<br />
200<br />
150<br />
100<br />
50<br />
10 arcsec<br />
00<br />
50 100 150 200 250<br />
250<br />
200<br />
150<br />
100<br />
50<br />
10 arcsec<br />
00<br />
5 0 100 1 50 200 25 0<br />
250<br />
200<br />
150<br />
100<br />
50<br />
0 5<br />
0<br />
0 1<br />
00<br />
15<br />
0 2<br />
0<br />
0 2<br />
50
200<br />
150<br />
100<br />
50<br />
00<br />
50 100 150 200<br />
200<br />
150<br />
100<br />
50<br />
10 arcsec<br />
10 arcsec<br />
00<br />
50 100 150 200<br />
Fig. 5. NGC 4698.<br />
O. González-Martín et al.: X-<strong>ray</strong> <strong>nature</strong> <strong>of</strong> <strong>LINER</strong>s, Online Material p 44<br />
200<br />
150<br />
100<br />
50<br />
DEC=8.4873972<br />
10 arcsec<br />
RA=192.09540<br />
00<br />
50 100 150 200<br />
200<br />
150<br />
100<br />
50<br />
10 arcsec<br />
00<br />
50 100 150 200<br />
200<br />
150<br />
100<br />
50<br />
10 arcsec<br />
00<br />
50 100 150 200<br />
200<br />
150<br />
100<br />
50<br />
10 arcsec<br />
00<br />
5 0 100 150 2 00<br />
80<br />
60<br />
40<br />
20<br />
0 2<br />
0<br />
0 4<br />
0 6<br />
0 8<br />
0
150<br />
100<br />
50<br />
00<br />
50 100 150<br />
150<br />
100<br />
50<br />
10 arcsec<br />
10 arcsec<br />
00<br />
50 100 150<br />
Fig. 5. NGC 4736.<br />
O. González-Martín et al.: X-<strong>ray</strong> <strong>nature</strong> <strong>of</strong> <strong>LINER</strong>s, Online Material p 45<br />
150<br />
100<br />
50<br />
DEC=41.120338<br />
10 arcsec<br />
RA=192.72130<br />
00<br />
50 100 150<br />
150<br />
100<br />
50<br />
10 arcsec<br />
00<br />
50 100 150<br />
150<br />
100<br />
50<br />
10 arcsec<br />
00<br />
50 100 150<br />
150<br />
100<br />
50<br />
10 arcsec<br />
00<br />
50 100 1 50<br />
150<br />
100<br />
50<br />
0 5<br />
0<br />
0 1<br />
0<br />
0 1<br />
50
150<br />
100<br />
50<br />
00<br />
50 100 150<br />
150<br />
100<br />
50<br />
10 arcsec<br />
10 arcsec<br />
00<br />
50 100 150<br />
Fig. 5. NGC 5055.<br />
O. González-Martín et al.: X-<strong>ray</strong> <strong>nature</strong> <strong>of</strong> <strong>LINER</strong>s, Online Material p 46<br />
150<br />
100DEC=42.029400<br />
50<br />
10 arcsec<br />
RA=198.95520<br />
00<br />
50 100 150<br />
150<br />
100<br />
50<br />
10 arcsec<br />
00<br />
50 100 150<br />
150<br />
100<br />
50<br />
10 arcsec<br />
00<br />
50 100 150<br />
150<br />
100<br />
50<br />
10 arcsec<br />
00<br />
50 1 00 15 0<br />
200<br />
150<br />
100<br />
50<br />
0 5<br />
0<br />
0 1<br />
00<br />
15<br />
0 2<br />
00
200<br />
150<br />
100<br />
50<br />
10 arcsec<br />
00<br />
50 100 150 200<br />
Fig. 5. NGC 5194.<br />
200<br />
150<br />
100<br />
50<br />
10 arcsec<br />
O. González-Martín et al.: X-<strong>ray</strong> <strong>nature</strong> <strong>of</strong> <strong>LINER</strong>s, Online Material p 47<br />
200<br />
150<br />
100<br />
50<br />
DEC=47.194538<br />
10 arcsec<br />
RA=202.46989<br />
00<br />
50 100 150 200<br />
200<br />
150<br />
100<br />
50<br />
10 arcsec<br />
00<br />
50 100 150 200<br />
00<br />
50 100 150 200<br />
200<br />
150<br />
100<br />
50<br />
10 arcsec<br />
200<br />
150<br />
100<br />
50<br />
10 arcsec<br />
00<br />
50 100 150 200<br />
00<br />
50 100 150 20 0
120<br />
100<br />
80<br />
60<br />
40<br />
20<br />
00<br />
20 40 60 80 100 120<br />
120<br />
100<br />
80<br />
60<br />
40<br />
20<br />
10 arcsec<br />
10 arcsec<br />
00<br />
20 40 60 80 100 120<br />
Fig. 5. MRK 266NE.<br />
O. González-Martín et al.: X-<strong>ray</strong> <strong>nature</strong> <strong>of</strong> <strong>LINER</strong>s, Online Material p 48<br />
120<br />
100<br />
80<br />
60<br />
40<br />
20<br />
DEC=48.278069<br />
10 arcsec<br />
RA=204.57440<br />
00<br />
20 40 60 80 100 120<br />
120<br />
100<br />
80<br />
60<br />
40<br />
20<br />
10 arcsec<br />
00<br />
20 40 60 80 100 120<br />
120<br />
100<br />
80<br />
60<br />
40<br />
20<br />
10 arcsec<br />
00<br />
20 40 60 80 100 120<br />
120<br />
100<br />
80<br />
60<br />
40<br />
20<br />
10 arcsec<br />
00<br />
20 4 0 6 0 8 0 100 12 0<br />
150<br />
100<br />
50<br />
0 5<br />
0<br />
0 1<br />
0<br />
0 1<br />
50
150<br />
100<br />
50<br />
00<br />
50 100 150<br />
150<br />
100<br />
50<br />
10 arcsec<br />
10 arcsec<br />
00<br />
50 100 150<br />
Fig. 5. UGC 08696.<br />
O. González-Martín et al.: X-<strong>ray</strong> <strong>nature</strong> <strong>of</strong> <strong>LINER</strong>s, Online Material p 49<br />
150<br />
100DEC=55.886978<br />
50<br />
10 arcsec<br />
RA=206.17551<br />
00<br />
50 100 150<br />
150<br />
100<br />
50<br />
10 arcsec<br />
00<br />
50 100 150<br />
150<br />
100<br />
50<br />
10 arcsec<br />
00<br />
50 100 150<br />
150<br />
100<br />
50<br />
10 arcsec<br />
00<br />
50 1 00 15 0<br />
250<br />
200<br />
150<br />
100<br />
50<br />
0 5<br />
0<br />
0 1<br />
00<br />
15<br />
0 2<br />
0<br />
0 2<br />
50
150<br />
100<br />
50<br />
00<br />
50 100 150<br />
150<br />
100<br />
50<br />
10 arcsec<br />
10 arcsec<br />
00<br />
50 100 150<br />
Fig. 5. CGCG 162-010.<br />
O. González-Martín et al.: X-<strong>ray</strong> <strong>nature</strong> <strong>of</strong> <strong>LINER</strong>s, Online Material p 50<br />
150<br />
100DEC=26.593399<br />
50<br />
10 arcsec<br />
RA=207.21860<br />
00<br />
50 100 150<br />
150<br />
100<br />
50<br />
10 arcsec<br />
00<br />
50 100 150<br />
150<br />
100<br />
50<br />
10 arcsec<br />
00<br />
50 100 150<br />
150<br />
100<br />
50<br />
10 arcsec<br />
00<br />
50 1 00 15 0<br />
200<br />
150<br />
100<br />
50<br />
0 5<br />
0<br />
0 1<br />
00<br />
15<br />
0 2<br />
00
120<br />
100<br />
80<br />
60<br />
40<br />
20<br />
00<br />
20 40 60 80 100 120<br />
120<br />
100<br />
80<br />
60<br />
40<br />
20<br />
10 arcsec<br />
10 arcsec<br />
00<br />
20 40 60 80 100 120<br />
Fig. 5. NGC 5746.<br />
O. González-Martín et al.: X-<strong>ray</strong> <strong>nature</strong> <strong>of</strong> <strong>LINER</strong>s, Online Material p 51<br />
120<br />
100<br />
80<br />
60<br />
40<br />
20<br />
DEC=1.9550300<br />
10 arcsec<br />
RA=221.23331<br />
00<br />
20 40 60 80 100 120<br />
120<br />
100<br />
80<br />
60<br />
40<br />
20<br />
10 arcsec<br />
00<br />
20 40 60 80 100 120<br />
120<br />
100<br />
80<br />
60<br />
40<br />
20<br />
10 arcsec<br />
00<br />
20 40 60 80 100 120<br />
120<br />
100<br />
80<br />
60<br />
40<br />
20<br />
10 arcsec<br />
00<br />
20 4 0 6 0 8 0 100 12 0<br />
150<br />
100<br />
50<br />
0 5<br />
0<br />
0 1<br />
0<br />
0 1<br />
50
120<br />
100<br />
80<br />
60<br />
40<br />
20<br />
00<br />
20 40 60 80 100 120<br />
120<br />
100<br />
80<br />
60<br />
40<br />
20<br />
10 arcsec<br />
10 arcsec<br />
00<br />
20 40 60 80 100 120<br />
Fig. 5. NGC 5846.<br />
O. González-Martín et al.: X-<strong>ray</strong> <strong>nature</strong> <strong>of</strong> <strong>LINER</strong>s, Online Material p 52<br />
120<br />
100<br />
80<br />
60<br />
40<br />
20<br />
DEC=1.6054580<br />
10 arcsec<br />
RA=226.62160<br />
00<br />
20 40 60 80 100 120<br />
120<br />
100<br />
80<br />
60<br />
40<br />
20<br />
10 arcsec<br />
00<br />
20 40 60 80 100 120<br />
120<br />
100<br />
80<br />
60<br />
40<br />
20<br />
10 arcsec<br />
00<br />
20 40 60 80 100 120<br />
120<br />
100<br />
80<br />
60<br />
40<br />
20<br />
10 arcsec<br />
00<br />
20 4 0 6 0 8 0 100 12 0<br />
150<br />
100<br />
50<br />
0 5<br />
0<br />
0 1<br />
0<br />
0 1<br />
50
150<br />
100<br />
50<br />
10 arcsec<br />
00<br />
50 100 150<br />
Fig. 5. NGC 5866.<br />
150<br />
100<br />
50<br />
10 arcsec<br />
O. González-Martín et al.: X-<strong>ray</strong> <strong>nature</strong> <strong>of</strong> <strong>LINER</strong>s, Online Material p 53<br />
150<br />
100<br />
50<br />
DEC=55.762798<br />
10 arcsec<br />
RA=226.62280<br />
00<br />
50 100 150<br />
150<br />
100<br />
50<br />
10 arcsec<br />
00<br />
50 100 150<br />
00<br />
50 100 150<br />
150<br />
100<br />
50<br />
10 arcsec<br />
150<br />
100<br />
50<br />
10 arcsec<br />
00<br />
50 100 150<br />
00<br />
50 100 150
150<br />
100<br />
50<br />
00<br />
50 100 150<br />
150<br />
100<br />
50<br />
10 arcsec<br />
10 arcsec<br />
00<br />
50 100 150<br />
Fig. 5. NGC 6251.<br />
O. González-Martín et al.: X-<strong>ray</strong> <strong>nature</strong> <strong>of</strong> <strong>LINER</strong>s, Online Material p 54<br />
150<br />
100<br />
50<br />
DEC=82.537689<br />
10 arcsec<br />
RA=248.13271<br />
00<br />
50 100 150<br />
150<br />
100<br />
50<br />
10 arcsec<br />
00<br />
50 100 150<br />
150<br />
100<br />
50<br />
10 arcsec<br />
00<br />
50 100 150<br />
150<br />
100<br />
50<br />
10 arcsec<br />
00<br />
50 100 150<br />
120<br />
100<br />
80<br />
60<br />
40<br />
20<br />
0 2<br />
0<br />
0 4<br />
0 6<br />
0 8<br />
0 1<br />
0<br />
0 1<br />
20
80<br />
60<br />
40<br />
20<br />
00<br />
20 40 60 80<br />
80<br />
60<br />
40<br />
20<br />
10 arcsec<br />
10 arcsec<br />
00<br />
20 40 60 80<br />
Fig. 5. NGC 6240.<br />
O. González-Martín et al.: X-<strong>ray</strong> <strong>nature</strong> <strong>of</strong> <strong>LINER</strong>s, Online Material p 55<br />
80<br />
60<br />
40<br />
20<br />
DEC=2.4007161<br />
10 arcsec<br />
RA=253.24519<br />
00<br />
20 40 60 80<br />
80<br />
60<br />
40<br />
20<br />
10 arcsec<br />
00<br />
20 40 60 80<br />
80<br />
60<br />
40<br />
20<br />
10 arcsec<br />
00<br />
20 40 60 80<br />
80<br />
60<br />
40<br />
20<br />
10 arcsec<br />
00<br />
20 40 60 80<br />
60<br />
40<br />
20<br />
0 2<br />
0<br />
0 4<br />
0 6<br />
0
150<br />
100<br />
50<br />
00<br />
50 100 150<br />
150<br />
100<br />
50<br />
10 arcsec<br />
10 arcsec<br />
00<br />
50 100 150<br />
Fig. 5. IRAS 17208-0014.<br />
O. González-Martín et al.: X-<strong>ray</strong> <strong>nature</strong> <strong>of</strong> <strong>LINER</strong>s, Online Material p 56<br />
150<br />
100DEC=-0.28350991<br />
50<br />
10 arcsec<br />
RA=260.84171<br />
00<br />
50 100 150<br />
150<br />
100<br />
50<br />
10 arcsec<br />
00<br />
50 100 150<br />
150<br />
100<br />
50<br />
10 arcsec<br />
00<br />
50 100 150<br />
150<br />
100<br />
50<br />
10 arcsec<br />
00<br />
50 1 00 15 0<br />
100<br />
80<br />
60<br />
40<br />
20<br />
0 2<br />
0<br />
0 4<br />
0 6<br />
0 8<br />
0 1<br />
00
150<br />
100<br />
50<br />
10 arcsec<br />
00<br />
50 100 150<br />
Fig. 5. NGC 6482.<br />
150<br />
100<br />
50<br />
10 arcsec<br />
O. González-Martín et al.: X-<strong>ray</strong> <strong>nature</strong> <strong>of</strong> <strong>LINER</strong>s, Online Material p 57<br />
150<br />
100<br />
50<br />
DEC=23.071920<br />
10 arcsec<br />
RA=267.95349<br />
00<br />
50 100 150<br />
150<br />
100<br />
50<br />
10 arcsec<br />
00<br />
50 100 150<br />
00<br />
50 100 150<br />
150<br />
100<br />
50<br />
10 arcsec<br />
150<br />
100<br />
50<br />
10 arcsec<br />
00<br />
50 100 1 50<br />
00<br />
50 100 1 50
100<br />
80<br />
60<br />
40<br />
20<br />
00<br />
20 40 60 80 100<br />
100<br />
80<br />
60<br />
40<br />
20<br />
10 arcsec<br />
10 arcsec<br />
00<br />
20 40 60 80 100<br />
Fig. 5. NGC 7130.<br />
O. González-Martín et al.: X-<strong>ray</strong> <strong>nature</strong> <strong>of</strong> <strong>LINER</strong>s, Online Material p 58<br />
100<br />
80<br />
60DEC=-34.951401<br />
40<br />
20<br />
10 arcsec<br />
RA=327.08139<br />
00<br />
20 40 60 80 100<br />
100<br />
80<br />
60<br />
40<br />
20<br />
10 arcsec<br />
00<br />
20 40 60 80 100<br />
100<br />
80<br />
60<br />
40<br />
20<br />
10 arcsec<br />
00<br />
20 40 60 80 100<br />
100<br />
80<br />
60<br />
40<br />
20<br />
10 arcsec<br />
00<br />
20 4 0 6 0 80 100<br />
200<br />
150<br />
100<br />
50<br />
0 5<br />
0<br />
0 1<br />
00<br />
15<br />
0 2<br />
00
150<br />
100<br />
50<br />
00<br />
50 100 150<br />
150<br />
100<br />
50<br />
10 arcsec<br />
10 arcsec<br />
00<br />
50 100 150<br />
Fig. 5. NGC 7331.<br />
O. González-Martín et al.: X-<strong>ray</strong> <strong>nature</strong> <strong>of</strong> <strong>LINER</strong>s, Online Material p 59<br />
150<br />
100DEC=34.415539<br />
50<br />
10 arcsec<br />
RA=339.26682<br />
00<br />
50 100 150<br />
150<br />
100<br />
50<br />
10 arcsec<br />
00<br />
50 100 150<br />
150<br />
100<br />
50<br />
10 arcsec<br />
00<br />
50 100 150<br />
150<br />
100<br />
50<br />
10 arcsec<br />
00<br />
50 1 00 15 0<br />
100<br />
80<br />
60<br />
40<br />
20<br />
0 2<br />
0<br />
0 4<br />
0 6<br />
0 8<br />
0 1<br />
00
150<br />
100<br />
50<br />
00<br />
50 100 150<br />
150<br />
100<br />
50<br />
10 arcsec<br />
10 arcsec<br />
00<br />
50 100 150<br />
Fig. 5. IC 1459.<br />
O. González-Martín et al.: X-<strong>ray</strong> <strong>nature</strong> <strong>of</strong> <strong>LINER</strong>s, Online Material p 60<br />
150<br />
100<br />
50<br />
DEC=-36.462101<br />
10 arcsec<br />
RA=344.29419<br />
00<br />
50 100 150<br />
150<br />
100<br />
50<br />
10 arcsec<br />
00<br />
50 100 150<br />
150<br />
100<br />
50<br />
10 arcsec<br />
00<br />
50 100 150<br />
150<br />
100<br />
50<br />
10 arcsec<br />
00<br />
50 100 1 50<br />
100<br />
80<br />
60<br />
40<br />
20<br />
0 2<br />
0<br />
0 4<br />
0 6<br />
0 8<br />
0 1<br />
00
Appendix A: Notes on individual <strong>sources</strong><br />
O. González-Martín et al.: X-<strong>ray</strong> <strong>nature</strong> <strong>of</strong> <strong>LINER</strong>s, Online Material p 61<br />
NGC 315 (UGC 597, B2 0055+30). The high spatial resolution<br />
provided by Chandra imaging allowed <strong>the</strong> detection <strong>of</strong> X-<strong>ray</strong><br />
jets, <strong>the</strong> most striking one being <strong>the</strong> one along ∼10 ′′ to <strong>the</strong> NW<br />
(see Fig. 5 and Donato et al. 2004; Worral et al. 2003). Worral<br />
et al. (2003) made use <strong>of</strong> a 4.67 ks duration ACIS-S Chandra image<br />
to report an X-<strong>ray</strong> luminosity <strong>of</strong> 5.9×10 41 erg s −1 (2–10 keV)<br />
for our assumed H0 = 75 km s −1 Mpc −1 and a power-law energy<br />
index Γ = 1.4 seen through a moderate intrinsic column density<br />
<strong>of</strong> NH from 2.3 to 8.2 × 10 21 cm −2 for <strong>the</strong> <strong>nuclear</strong> component<br />
whose spectrum is fitted with a single-component absorbed<br />
power law. In contrast, Donato et al. (2004), using <strong>the</strong><br />
same spatial area for <strong>the</strong> extraction <strong>of</strong> <strong>the</strong> <strong>nuclear</strong> component<br />
(1.98 ± 0.20 ′′ ), conclude that two components are required to<br />
model <strong>the</strong> corresponding spectrum: a power-law (Γ = 1.56) and<br />
a <strong>the</strong>rmal one (apec in XSPEC) with solar metallicity (kT =<br />
0.51 keV, NH = 0.73 × 10 22 cm −2 ), which is <strong>the</strong>refore in very<br />
good agreement with our results by using RS+PL as <strong>the</strong> best<br />
model (see Table 6). Satyapal et al. (2005) class NGC 315 as<br />
an AGN-<strong>LINER</strong> (those displaying a hard <strong>nuclear</strong> point source,<br />
with a 2–10 keV luminosity >2 × 10 38 erg s −1 , coincident with<br />
<strong>the</strong> VLA or 2MASS nucleus); <strong>the</strong>ir spectral fitting results in<br />
kT = 0.54 keV, NH = 0.8 × 10 22 cm −2 , and Γ = 1.60, all <strong>of</strong><br />
which also agree with ours.<br />
Arp 318A and B (Hickson compact group 16 A and B).<br />
No point <strong>sources</strong> were detected in nei<strong>the</strong>r hard band images<br />
(4.5–8 ∗ keV or 6–7 keV), but <strong>the</strong> X-<strong>ray</strong> s<strong>of</strong>t emission is extended<br />
(see Fig. 5). Turner et al. (2001) analyzed <strong>the</strong> 40 ks EPIC<br />
XMM-Newton first-light observations and confirmed <strong>the</strong> presence<br />
<strong>of</strong> an AGN in both galaxies A and B. Three components<br />
were fitted to <strong>the</strong> EPIC X-<strong>ray</strong> spectrum <strong>of</strong> NGC 833 (Arp 318B):<br />
(1) a power-law for <strong>the</strong> obscured AGN, with Γ = 1.8 and NH =<br />
2.4 × 10 23 cm −2 , (2) an unabsorbed power-law for <strong>the</strong> radiation<br />
scattered into our line <strong>of</strong> sight by thin, hot plasma directly illuminated<br />
by <strong>the</strong> AGN, and (3) an optically-thin <strong>the</strong>rmal plasma<br />
with kT = 0.47 keV; <strong>the</strong> luminosity <strong>of</strong> <strong>the</strong> AGN component <strong>of</strong><br />
6.2×10 41 erg s −1 turns out to be 100 times brighter than <strong>the</strong> <strong>the</strong>rmal<br />
X-<strong>ray</strong> emission. The core <strong>of</strong> NGC 835 (Arp 318A) shows a<br />
very similar spectrum, with absorbed and scattered power laws<br />
indicating a heavily obscured AGN (NH = 4.6 × 10 23 cm −2 and<br />
Γ = 2.25) <strong>of</strong> 5.3 × 10 41 erg −1 (0.5–10 keV) and a s<strong>of</strong>t <strong>the</strong>rmal<br />
component with kT = 0.51 keV contributing to 2% <strong>of</strong> <strong>the</strong> total<br />
luminosity. Since <strong>the</strong> total counts for source B are insufficient for<br />
both <strong>the</strong> spectral analysis and <strong>the</strong> use <strong>of</strong> color–color diagrams,<br />
we only give <strong>the</strong> morphological classification as SB candidates<br />
for <strong>the</strong> two nuclei, in contrast to <strong>the</strong> reported XMM-Newton spectral<br />
results and an estimation <strong>of</strong> Γ and kT from color–color diagrams<br />
for source A, consistent with <strong>the</strong> XMM-Newton results,<br />
but with no indication <strong>of</strong> high obscuration in our analysis.<br />
NGC 1052. The X-<strong>ray</strong> morphology clearly indicates <strong>the</strong><br />
presence <strong>of</strong> an unresolved <strong>nuclear</strong> source in <strong>the</strong> hard bands<br />
(Fig. 5), in agreement with <strong>the</strong> classification by Satyapal et al.<br />
(2004). Evidence <strong>of</strong> <strong>the</strong> AGN <strong>nature</strong> <strong>of</strong> this object has already<br />
been given with <strong>the</strong> detection <strong>of</strong> broad lines in spectropolarimetric<br />
measurements by Barth et al. (1999). Guainazzi et al.<br />
(2000) confirm that its X-<strong>ray</strong> spectrum may <strong>the</strong>refore resemble<br />
that <strong>of</strong> Seyfert galaxies with <strong>the</strong> analysis <strong>of</strong> its BeppoSAX<br />
spectrum (0.1–100 keV), for which <strong>the</strong>y derive a very good<br />
fit with a two-component model, constituted by an absorbed<br />
(NH = 2.0 × 10 23 cm −2 ) and ra<strong>the</strong>r flat (Γ ≈ 1.4) power-law<br />
plus a “s<strong>of</strong>t excess” below 2 keV. The corresponding flux in <strong>the</strong><br />
2–10 keV is 4.0 × 10 −12 erg cm −2 s −1 . The presence <strong>of</strong> various<br />
jet-related X-<strong>ray</strong> emitting regions from a short (2.3 ks) Chandra<br />
observation, toge<strong>the</strong>r with a bright compact core, unresolved<br />
knots in <strong>the</strong> jet structure, and an extended emitting region inside<br />
<strong>the</strong> galaxy that is well aligned with <strong>the</strong> radio synchrotron<br />
jet-emission, have been reported by Kadler et al. (2004); <strong>the</strong>y<br />
derive Γ ≈ 0.25 and kT ≈ 0.5 keV for <strong>the</strong> fitting <strong>of</strong> <strong>the</strong> core<br />
spectrum. The value <strong>the</strong>y estimate for <strong>the</strong> luminosity is within<br />
<strong>the</strong> factor <strong>of</strong> 3 <strong>of</strong> our estimation (see Table 5).<br />
NGC 2681 (UGC 4645). An unresolved <strong>nuclear</strong> source was<br />
clearly detected at hard X-<strong>ray</strong> energies (Fig. 5). Satyapal et al.<br />
(2005), who made use <strong>of</strong> archival Chandra ACIS observations<br />
<strong>of</strong> this galaxy, classed <strong>the</strong>m as an AGN-<strong>LINER</strong>, and derived<br />
kT = 0.73 keV and Γ = 1.57 for an apec plus power-law fit<br />
to <strong>the</strong> <strong>nuclear</strong> spectrum. These values are in perfect agreement,<br />
within <strong>the</strong> errors, with <strong>the</strong> parameters we derive for our best<br />
model (ME+PL) (Γ = 1.74 and kT = 0.66 keV, see Table 6),<br />
which we recall gives unacceptable values for χ 2 .<br />
UGC 05101. In addition to <strong>the</strong> hard-band point <strong>nuclear</strong><br />
source, extended emission is seen in both (4.5–8.0 ∗ keV) and (6–<br />
7 keV) bands (Fig. 5). The evidence <strong>of</strong> a buried, active galactic<br />
nucleus in this ultra-luminous infrared galaxy has been provided<br />
by <strong>the</strong> analysis by Imanishi et al. (2003) <strong>of</strong> its XMM-Newton<br />
EPIC spectrum. They fit <strong>the</strong> spectrum with an absorbed powerlaw<br />
(Γ = 1.8 fixed), a narrow Gaussian for <strong>the</strong> 6.4 keV Fe Kα<br />
line, which is clearly seen in <strong>the</strong>ir spectrum, and a 0.7 keV<br />
<strong>the</strong>rmal component, deriving (NH = 14 × 10 23 cm −2 ) and<br />
EW(Fe Kα) = 0.41 keV. The resulting (2–10 keV) luminosity <strong>of</strong><br />
∼5 × 10 42 erg s −1 is about 30 times higher than <strong>the</strong> value we<br />
estimate. The Fe-K emission is marginally detected in <strong>the</strong> analysis<br />
<strong>of</strong> Chandra data by Ptak et al. (2003). The luminosity we<br />
estimate is a factor <strong>of</strong> two higher than that given by Dudik et al.<br />
(2005), derived from Chandra ACIS data.<br />
NGC 3226 (UGC 5617, Arp 94A). Several point <strong>sources</strong><br />
were detected at <strong>the</strong> (4–8) keV band image <strong>of</strong> this galaxy, with<br />
Fe emission unambiguously present in <strong>the</strong> nucleus (Fig. 5). The<br />
analysis <strong>of</strong> HETGS Chandra data by George et al. (2001), whose<br />
properties strongly suggested that this galaxy hosted a central<br />
AGN, resulted in an adequate fit with a photon index Γ = 1.94<br />
and NH = 4.8 × 10 21 cm −2 , with <strong>the</strong> implied luminosity L(2–<br />
10 keV) ≈ 3.2 × 10 40 erg s −1 . The XMM-Newton observations <strong>of</strong><br />
this dwarf elliptical galaxy more probably indicate <strong>the</strong> presence<br />
<strong>of</strong> a sub-Eddington, super-massive black hole in a radiatively inefficient<br />
stage (Gondoin et al. 2004). They conclude that, since<br />
<strong>the</strong> best fit is provided by a bremsstrahlung model absorbed by<br />
neutral material, <strong>the</strong> X-<strong>ray</strong> emission may <strong>the</strong>refore be reminiscent<br />
<strong>of</strong> advection-dominated accretion flows. Never<strong>the</strong>less, an<br />
acceptable fit is also obtained by including a power-law model<br />
(Γ = 1.96) absorbed by neutral (NH = 4.1 × 10 21 cm −2 ) and<br />
ionized material. The resulting (2–10 keV) luminosity, calculated<br />
for <strong>the</strong> distance we use, is 1.8 × 10 40 erg s −1 , a factor <strong>of</strong><br />
4 higher than <strong>the</strong> one we estimate. Terashima & Wilson (2003)<br />
fit <strong>the</strong> Chandra ACIS <strong>nuclear</strong> spectrum with a power-law with<br />
Γ = 2.21 (from 1.62 to 2.76) and NH = 0.93 × 10 22 cm −2 . Notice<br />
that substantial absorption is also derived from <strong>the</strong> position <strong>of</strong><br />
this galaxy in <strong>the</strong> color–color diagrams, whereas <strong>the</strong> power-law<br />
index we estimate is somewhat steeper (see Table 6).<br />
NGC 3245 (UGC 5663). No unresolved <strong>nuclear</strong> source was<br />
detected in <strong>the</strong> (4.5–8.0 ∗ keV) band image. This contrasts with<br />
<strong>the</strong> analysis by Filho et al. (2004) who, when making use <strong>of</strong> <strong>the</strong><br />
same Chandra data, conclude that <strong>the</strong>re is a hard <strong>nuclear</strong> X-<strong>ray</strong><br />
source coincident with <strong>the</strong> optical nucleus. The luminosity <strong>the</strong>y<br />
calculate with a fixed Γ = 1.7 is less than a factor <strong>of</strong> 2 fainter<br />
than ours.
O. González-Martín et al.: X-<strong>ray</strong> <strong>nature</strong> <strong>of</strong> <strong>LINER</strong>s, Online Material p 62<br />
NGC 3379 (UGC 5902, M 105). Very recently, David et al.<br />
(2005) published <strong>the</strong>ir study <strong>of</strong> <strong>the</strong> X-<strong>ray</strong> emission as traced by<br />
ACIS-S Chandra observations. It is mainly devoted to <strong>the</strong> analysis<br />
<strong>of</strong> extra-<strong>nuclear</strong> X-<strong>ray</strong> <strong>sources</strong> and diffuse emission, and <strong>the</strong>y<br />
derive a power-law index for <strong>the</strong> diffuse emission <strong>of</strong> 1.6–1.7,<br />
in agreement with <strong>the</strong> value reported by Georgantopoulos et al.<br />
(2002). David et al. (2005) do not fit <strong>the</strong> spectrum <strong>of</strong> <strong>the</strong> <strong>nuclear</strong><br />
source (<strong>the</strong>ir source 1) due to <strong>the</strong> too low net counts in<br />
<strong>the</strong> S3 chip data for this object. This is also <strong>the</strong> reason for having<br />
nei<strong>the</strong>r a fit nor an estimation <strong>of</strong> <strong>the</strong> spectral parameters (see<br />
Table 6).<br />
NGC 3507 (UGC 6123). No hard <strong>nuclear</strong> point source was<br />
detected for this galaxy (Fig. 5). The only previously published<br />
X-<strong>ray</strong> study is based on observations obtained with ASCA:<br />
Terashima et al. (2002) get Γ = 2.3 and NH = 1.0 × 10 22 cm −2 ,<br />
but conclude that a power-law model (Γ = 1.7) describes <strong>the</strong><br />
spectrum well.<br />
NGC 3607 (UGC 6297). No hard <strong>nuclear</strong> point source was<br />
detected for this galaxy (Fig. 5). Based on observations obtained<br />
with ASCA, Terashima et al. (2002) find no clear evidence for<br />
<strong>the</strong> presence <strong>of</strong> an AGN in this <strong>LINER</strong>, in agreement with our<br />
classification.<br />
NGC 3608 (UGC 6299). No hard <strong>nuclear</strong> point source was<br />
detected for this galaxy (Fig. 5). The only previous X-<strong>ray</strong><br />
study <strong>of</strong> this galaxy is that by O’Sullivan et al. (2001) who<br />
present a catalogue <strong>of</strong> X-<strong>ray</strong> bolometric luminosities for 401<br />
early-type galaxies obtained with ROSAT PSPC pointed observations.<br />
Adjusted to our adopted distance, this luminosity is<br />
1.37 × 10 40 erg s −1 , about 30 times brighter than our estimation.<br />
NGC 3628 (UGC 6350, Arp 317C). The hard X-<strong>ray</strong> morphology<br />
shows an unresolved <strong>nuclear</strong> component that also appears<br />
in <strong>the</strong> Fe image (Fig. 5). Chandra X-<strong>ray</strong> and groundbased<br />
optical Hα, arc-second resolution imaging is studied by<br />
Strickland et al. (2004), with <strong>the</strong> main aim <strong>of</strong> determining both<br />
spectral and spatial properties <strong>of</strong> <strong>the</strong> diffuse X-<strong>ray</strong> emission.<br />
They also show <strong>the</strong> total counts for <strong>the</strong> <strong>nuclear</strong> region (an extraction<br />
<strong>of</strong> 1 kpc radius around <strong>the</strong> dynamical center that, for<br />
this galaxy, corresponds to <strong>the</strong> central 20 ′′ ), but no spectral fitting<br />
was attempted. Our morphological classification does not<br />
agree with that <strong>of</strong> Dudik et al. (2005), who have classified this<br />
galaxy as an object displaying no <strong>nuclear</strong> source according to<br />
its morphology in Chandra ACIS data; this galaxy is taken as a<br />
<strong>LINER</strong>/transition object and an upper limit <strong>of</strong> 2.7 × 10 37 erg s −1<br />
(corrected to our adopted distance) is given for its (2–10 keV)<br />
<strong>nuclear</strong> luminosity, about 6 times fainter than our estimated luminosity.<br />
Note that high absorption is derived from <strong>the</strong> position<br />
<strong>of</strong> this galaxy in <strong>the</strong> color–color diagrams.<br />
NGC 3690B (Arp 299, Mrk 171). X-<strong>ray</strong> emission has plenty<br />
<strong>of</strong> features, with a hard unresolved source clearly detected in <strong>the</strong><br />
<strong>nuclear</strong> position, which is also seen in <strong>the</strong> 6–7 keV band (Fig. 5).<br />
The EPIC-pn XMM-Newton spatially resolved data have clearly<br />
demonstrated <strong>the</strong> existence <strong>of</strong> an AGN in NGC 3690, for which<br />
a strong 6.4 keV line is detected, and suggested that <strong>the</strong> nucleus<br />
<strong>of</strong> its companion IC 694 might also host an AGN 6 , since a strong<br />
6.7 keV Fe-Kα line is present (Ballo et al. 2004). The differing<br />
results can be explained by considering both that XMM-Newton<br />
integrates a larger area than <strong>the</strong> <strong>nuclear</strong> 3 ′′ we extract and that a<br />
Gaussian line toge<strong>the</strong>r with a single power-law fit (Γ = 1.8 and<br />
NH = 5.6 × 10 21 cm −2 ) is used for <strong>the</strong> fitting <strong>of</strong> EPIC-pn data.<br />
6 Note, however, that both galaxies are found in <strong>the</strong> comparative sample<br />
<strong>of</strong> starburst galaxies in Satyapal et al. (2004).<br />
NGC 4111 (UGC 7103). A hard <strong>nuclear</strong> point source was<br />
detected for this galaxy (Fig. 5). Previous X-<strong>ray</strong> spectral analysis<br />
comes from ASCA data by Terashima et al. (2000, see<br />
also Terashima et al. 2002) who could not fit <strong>the</strong> spectrum<br />
with a single-component model, but instead with a combination<br />
<strong>of</strong> a power-law toge<strong>the</strong>r with a Raymond-Smith plasma,<br />
with Γ = 0.9, kT = 0.65 keV (in reasonable agreement with<br />
<strong>the</strong> parameters we estimate from its position in <strong>the</strong> color–color<br />
diagrams, see Table 4) and NH = 1.4 × 10 20 cm −2 reproduced<br />
<strong>the</strong> observed spectrum well and gives an intrinsic L(2–<br />
10 keV) = 6.8 × 10 39 erg s −1 , a factor <strong>of</strong> 3 higher than <strong>the</strong> one we<br />
estimate (see Table 5).<br />
NGC 4125 (UGC 7118). Figure 5 shows <strong>the</strong> presence <strong>of</strong> a<br />
<strong>nuclear</strong> hard point source. The best fit that Georgantopoulos<br />
et al. (2002) obtain for <strong>the</strong> central 2 ′ BeppoSAX spectrum is<br />
provided by an absorbed power-law with Γ = 2.52 and NH = 3 ×<br />
10 22 cm −2 , providing L(2−10 keV) = 0.68 × 10 40 erg s −1 . Based<br />
on Chandra ACIS imaging, Satyapal et al. (2004) class this<br />
galaxy among those revealing a hard <strong>nuclear</strong> source embedded in<br />
s<strong>of</strong>t diffuse emission; <strong>the</strong>y estimate <strong>the</strong> luminosity by assuming<br />
an intrinsic power-law slope <strong>of</strong> 1.8, which results in (once adjusted<br />
to our adopted distance) L(2–10 keV) = 7.3 ×10 38 erg s −1 ,<br />
in very good agreement with <strong>the</strong> value we estimate.<br />
NGC 4261 (UGC 7360, 3C 270). The <strong>nuclear</strong> hard band<br />
emission <strong>of</strong> this galaxy is clearly unresolved both in <strong>the</strong> (4.5–<br />
8.0 ∗ keV) and 6–7 keV bands (Fig. 5). Sambruna (2003) published<br />
its <strong>nuclear</strong> EPIC-pn XMM-Newton spectrum (<strong>the</strong> central<br />
10”), which is best-fitted with a two-component model with a<br />
power law (Γ = 1.4) absorbed by a column density <strong>of</strong> NH ≈<br />
4 × 10 22 cm −2 plus a <strong>the</strong>rmal component with kT ≈ 0.7 keV (in<br />
agreement with Chandra spectral results by Gliozzi et al. 2003<br />
and Chiaberge et al. 2003a); an unresolved FeK emission line<br />
with EW ≈ 0.28 keV was detected at ∼7 keV. They also report<br />
short-term flux variability from <strong>the</strong> nucleus (timescale <strong>of</strong><br />
3–5 ks), which <strong>the</strong>y argue as originating in <strong>the</strong> inner jet. The various<br />
features seen at s<strong>of</strong>t energies (Fig. 5) were already shown<br />
by Donato et al. (2004), who also analyzed its Chandra ACIS<br />
data for <strong>the</strong> core component (core radius <strong>of</strong> 0.98”), which <strong>the</strong>y<br />
fit with a PL+apec model with Γ = 1.09, kT = 0.60 keV, and a<br />
high column density NH = 7.0 × 10 22 cm −2 , reported to be <strong>the</strong><br />
largest intrinsic column density <strong>of</strong> <strong>the</strong> 25 radio galaxies in <strong>the</strong>ir<br />
study. These parameters agree with those obtained by Rinn et al.<br />
(2005) and Satyapal et al. (2005) for <strong>the</strong> same data.<br />
Very recently, Zezas et al. (2005) published <strong>the</strong> analysis <strong>of</strong><br />
35 ks Chandra ACIS-S observations. They report an almost<br />
point-like emission above 4.0 keV and evidence <strong>of</strong> an X-<strong>ray</strong> jet<br />
component down to arc-second scales from <strong>the</strong> nucleus (barely<br />
visible in our Fig. 5). A three-component model is given as <strong>the</strong><br />
best fit for <strong>the</strong> X-<strong>ray</strong> spectrum <strong>of</strong> <strong>the</strong> <strong>nuclear</strong> 2”: a heavily obscured,<br />
flat power-law (Γ = 1.54 and NH = 8.4 × 10 22 cm −2 ),<br />
a less absorbed, steeper power-law (Γ = 2.25 and NH < 3.7 ×<br />
10 20 cm −2 ), and a <strong>the</strong>rmal component (kT = 0.50 keV), which<br />
results in L(2–10 keV) = 10.8 × 10 40 erg s −1 , a factor <strong>of</strong> 2 higher<br />
than what we estimate. They report an equally good fit with a<br />
single power-law (Γ = 1.37) seen through a partially covering<br />
absorber (NH = 7.7 × 10 22 cm −2 , fcov = 0.92) plus a <strong>the</strong>rmal<br />
component. We have not included this object in <strong>the</strong> SF subsample<br />
due to its complexity which gives as unexpected parameters<br />
with any <strong>of</strong> our five models.<br />
NGC 4314 (UGC 7443). No <strong>nuclear</strong> source was detected in<br />
<strong>the</strong> hard X-<strong>ray</strong> band (Fig. 5). Satyapal et al. (2004) use Chandra<br />
ACIS imaging to classify this galaxy among those that exhibit<br />
multiple, hard <strong>of</strong>f-<strong>nuclear</strong> point <strong>sources</strong> <strong>of</strong> comparable bright-
O. González-Martín et al.: X-<strong>ray</strong> <strong>nature</strong> <strong>of</strong> <strong>LINER</strong>s, Online Material p 63<br />
ness to <strong>the</strong> <strong>nuclear</strong> source; with an assumed power-law index<br />
<strong>of</strong> 1.8, <strong>the</strong> corresponding luminosity, corrected to our adopted<br />
distance, results in L(2–10 keV) = 8 × 10 37 erg s −1 , in excellent<br />
agreement with <strong>the</strong> one we estimate (see Table 5).<br />
NGC 4374 (M 84, UGC 7494, 3C 272.1). An unresolved <strong>nuclear</strong><br />
source is detected both in (4.5–8.0 ∗ keV) and 6–7 keV band<br />
images (Fig. 5). Satyapal et al. (2004) have already described<br />
<strong>the</strong> X-<strong>ray</strong> morphology traced by Chandra ACIS imaging <strong>of</strong><br />
this galaxy as revealing a hard <strong>nuclear</strong> source embedded in<br />
s<strong>of</strong>t diffuse emission. The Chandra ACIS-S data are analyzed<br />
by Finoguenov & Jones (2001) 7 ; <strong>the</strong>y report a remarkable interaction<br />
<strong>of</strong> <strong>the</strong> radio lobes and <strong>the</strong> diffuse X-<strong>ray</strong> emission,<br />
and provide <strong>the</strong> parameters for a fit with an absorbed (NH =<br />
2.7 × 10 21 cm −2 ) power law (Γ = 2.3) and <strong>the</strong> corresponding<br />
L(0.5–10 keV) = 4.7 × 10 39 erg s −1 , all in very good agreement<br />
with <strong>the</strong> ones we give in this paper (see Tables 3 and 6); but <strong>the</strong>y<br />
differ somewhat from <strong>the</strong> ones obtained from <strong>the</strong> ASCA spectrum<br />
(Terashima et al. 2002), most probably due to <strong>the</strong> different<br />
spatial resolutions.<br />
NGC 4395 (UGC 7524). The unresolved <strong>nuclear</strong> source is<br />
seen in both (4.5–8 ∗ keV) and 6–7 keV band images (Fig. 5).<br />
Moran et al. (2005) recently published 8 <strong>the</strong> first high-quality,<br />
broadband X-<strong>ray</strong> detection <strong>of</strong> <strong>the</strong> AGN <strong>of</strong> this object, confirming<br />
<strong>the</strong> rapid, large-amplitude variability reported in previous<br />
studies (Iwasawa et al. 2000; Shih et al. 2003) and confirmed<br />
with XMM-Newton EPIC-pn data (Vaughan et al. 2005).<br />
They fit a single power law model with absorption by neutral<br />
material to <strong>the</strong> spectrum <strong>of</strong> <strong>the</strong> <strong>nuclear</strong> 5 ′′ (Γ = 0.61 and<br />
NH = 1.2 × 10 22 cm −2 ), which provides a poor fit over <strong>the</strong> entire<br />
Chandra 0.5 to 9 keV range, but <strong>the</strong>y claim it is excellent<br />
for energies above ∼1.2 keV. Our best model results in a single<br />
absorbed power law as well, but with somewhat stronger absorption<br />
(NH = 2.87 × 10 22 cm −2 ) and a higher spectral index<br />
(Γ = 1.44, see Table 6). The iron line that is clearly resolved in<br />
<strong>the</strong> time-averaged ASCA spectrum shown by Shih et al. (2003)<br />
is also visible in our spectrum (see Fig. 3).<br />
NGC 4410A (UGC 7535, Mrk 1325). Both (4.5–8 ∗ keV) and<br />
6–7 keV band images show <strong>the</strong> unresolved <strong>nature</strong> <strong>of</strong> <strong>the</strong> <strong>nuclear</strong><br />
source at <strong>the</strong>se energies (Fig. 5). ACIS-S Chandra observations<br />
<strong>of</strong> <strong>the</strong> NGC 4410 group are presented in Smith et al. (2003), who<br />
obtained an adequate fit for <strong>the</strong> spectrum <strong>of</strong> <strong>the</strong> inner 1 ′′ to a<br />
power law with Γ ≈ 2 and a fixed NH = 5 × 10 20 cm −2 , in<br />
agreement with previous analysis <strong>of</strong> ROSAT X-<strong>ray</strong> observations<br />
(Tschöke et al. 1999). Our best model only needs <strong>the</strong> inclusion<br />
<strong>of</strong> a power law with Γ = 1.75 (consistent with <strong>the</strong>irs within <strong>the</strong><br />
errors)<br />
NGC 4438 (UGC 7574, Arp 120B). No <strong>nuclear</strong> point source<br />
was detected in our hard X-<strong>ray</strong> band images (Fig. 5). The results<br />
from 25 ks Chandra ACIS-S observations <strong>of</strong> this galaxy<br />
are presented in Machacek et al. (2004) who suggest <strong>the</strong> presence<br />
<strong>of</strong> an AGN, based on <strong>the</strong> steep spectral index and <strong>the</strong> location<br />
<strong>of</strong> <strong>the</strong> hard emission at <strong>the</strong> center <strong>of</strong> <strong>the</strong> galaxy, in contrast<br />
to our morphological classification. The spectrum <strong>of</strong> <strong>the</strong><br />
central 5 ′′ is claimed to be best-fitted by a combination <strong>of</strong> an<br />
absorbed power law (with NH = 2.9 × 10 22 cm −2 and a fixed<br />
Γ = 2.0) and a MEKAL 0.58 keV <strong>the</strong>rmal component, providing<br />
L(2−10 keV) = 2.5 × 10 39 erg s −1 . Never<strong>the</strong>less, Satyapal<br />
et al. (2005) class this galaxy as an non AGN-<strong>LINER</strong> based on<br />
its ACIS Chandra image, in agreement with our classification,<br />
7 See also Kataoka & Stawarz (2005) for <strong>the</strong> analysis <strong>of</strong> <strong>the</strong> two<br />
extra-<strong>nuclear</strong> knots.<br />
8 See also O’Neill et al. 2006, ApJ accepted, astro-ph/0603312.<br />
with kT = 0.77 keV and NH = 1.2 × 10 21 cm −2 , consistent with<br />
ours within <strong>the</strong> errors, but Γ = 1.19.<br />
NGC 4457 (UGC 7609). Hard emission is unresolved in <strong>the</strong><br />
nucleus <strong>of</strong> this galaxy (Fig. 5). The spectral analysis <strong>of</strong> ACIS<br />
Chandra data by Satyapal et al. (2005) gives Γ = 1.57, kT =<br />
0.69 keV, and no additional absorption, in very good agreement<br />
with our results (see Table 6).<br />
NGC 4459 (UGC 7614). Our morphological classification<br />
(SB candidate, see Fig. 5) agrees with that by Satyapal et al.<br />
(2005), also based on ACIS Chandra data, who give no additional<br />
X-<strong>ray</strong> information on this object.<br />
NGC 4486 (M 87, UGC 7654, Virgo A, Arp 152, 3C 274).<br />
Both <strong>the</strong> unresolved <strong>nuclear</strong> emission and <strong>the</strong> jet-like feature extending<br />
∼15” to <strong>the</strong> W-NW, in <strong>the</strong> direction <strong>of</strong> <strong>the</strong> optical jet,<br />
are seen in Fig. 5. Combined deep Chandra, ROSAT HRI and<br />
XMM-Newton observations <strong>of</strong> this galaxy are shown in Forman<br />
et al. (2005), where <strong>the</strong> same salient features present in our Fig. 5<br />
can be seen with X-<strong>ray</strong> jets clearly detected, but no spectral<br />
analysis is made. Donato et al. (2005) analyze both Chandra<br />
and XMM-Newton data providing a radius for <strong>the</strong> core <strong>of</strong> 0.22 ′′ .<br />
Dudik et al. (2005) class it among objects exhibiting a dominant<br />
hard <strong>nuclear</strong> point source and estimate its luminosity as L(2–<br />
10 keV) = 3.3 × 10 40 erg s −1 with a fixed Γ = 1.8 power law, in<br />
good agreement with <strong>the</strong> one we estimate (see Table 5).<br />
NGC 4494 (UGC 7662). Hard <strong>nuclear</strong> emission is point-like<br />
(Fig. 5). The XMM-Newton EPIC spectrum extracted from a 45 ′′<br />
region has been published by O’Sullivan & Ponman (2004). In<br />
agreement with our findings, a ME+PL combination results in<br />
<strong>the</strong> best model for <strong>the</strong> spectral fitting, for which <strong>the</strong>y get Γ =<br />
1.5 (consistent with our value) but for hydrogen column density<br />
fixed at <strong>the</strong> Galactic value (NH = 1.56 × 10 20 cm −2 and kT =<br />
0.25 keV). In agreement with our morphological classification,<br />
Dudik et al. (2005) class it as a hard <strong>nuclear</strong> point-dominated<br />
source and estimate L(2–10 keV) = 7.2×10 38 erg s −1 with a fixed<br />
Γ = 1.8 power law, about a factor <strong>of</strong> 6 fainter than <strong>the</strong> one we<br />
calculated with <strong>the</strong> spectral fitting.<br />
NGC 4552 (M 89, UGC 7760). This galaxy shows an unresolved<br />
source in <strong>the</strong> hard band over an extended nebulosity<br />
morphology with <strong>the</strong> peak <strong>of</strong> emission coincident with <strong>the</strong><br />
galaxy center determined from 2MASS data (Fig. 5). Xu et al.<br />
(2005) found from Chandra ACIS-S data that <strong>the</strong> central source<br />
is <strong>the</strong> brightest in <strong>the</strong> field and that it coincides with <strong>the</strong> optical/IR/radio<br />
center <strong>of</strong> <strong>the</strong> galaxy within 0.5 ′′ . The X-<strong>ray</strong>identified<br />
source is compact and variable on short time scales<br />
<strong>of</strong> 1 h. Their best-fitted model <strong>of</strong> <strong>the</strong> source is consistent with<br />
an absorbed power-law with spectral index Γ = 2.24 in ra<strong>the</strong>r<br />
good agreement with <strong>the</strong> ASCA data reported by Colbert &<br />
Mushotzky (1999). The inferred luminosity in <strong>the</strong> 2–10 keV is<br />
4 × 10 39 erg s −1 , consistent with our result (2.6 × 10 39 erg s −1 ).<br />
Their main conclusion based on <strong>the</strong> variability, <strong>the</strong> spectral analysis,<br />
and multi-wavelengh data is that <strong>the</strong> central source is more<br />
likely a low-luminosity AGN than contribution from LMXBs.<br />
Our best-fit parameters are consistent with a model <strong>of</strong> a power<br />
law with an spectral index Γ = 1.81 plus a <strong>the</strong>rmal RS <strong>of</strong><br />
kT = 0.83, in much better agreement with <strong>the</strong> results by Filho<br />
et al. (2004) on <strong>the</strong> analysis <strong>of</strong> Chandra archival data, with<br />
Γ = 1.51 and kT = 0.95.<br />
NGC 4579 (M 58, UGC 7796). This galaxy shows a compact<br />
<strong>nuclear</strong> source sitting in a diffuse halo (Fig. 5). Eracleous<br />
et al. (2002) fitted <strong>the</strong> compact unresolved central source detected<br />
in Chandra X-<strong>ray</strong> data, coincident with <strong>the</strong> broad-line<br />
region detected in UV by Barth et al. (2002) with a simple
O. González-Martín et al.: X-<strong>ray</strong> <strong>nature</strong> <strong>of</strong> <strong>LINER</strong>s, Online Material p 64<br />
power law spectra with Γ = 1.88, which gives an estimated luminosity<br />
<strong>of</strong> 1.7 × 10 41 erg s −1 . More recently, Dewangan et al.<br />
(2004) presented XMM-Newton data to search for <strong>the</strong> presence<br />
<strong>of</strong> an FeKα line. The best-fit spectrum is ra<strong>the</strong>r complex: an<br />
absorbed power law with Γ = 1.77 plus a narrow Gaussian<br />
at 6.4 keV and a broad Gaussian at 6.79 keV with FWHM ∼<br />
20 000 km s −1 . This broad component is interpreted as arising<br />
from <strong>the</strong> inner accretion disk. The estimated luminosity amounts<br />
to 1.2 × 10 40 erg s −1 , lower than both Eracleous’s estimation and<br />
ours (1.4 × 10 41 erg s −1 ).<br />
NGC 4594 (M 104, Sombrero Galaxy). The Sombrero<br />
galaxy shows <strong>the</strong> typical X-<strong>ray</strong> morphology <strong>of</strong> a compact unresolved<br />
<strong>nuclear</strong> source on top <strong>of</strong> a diffuse halo (Fig. 5). Dudik<br />
et al. (2005) class it with <strong>the</strong> objects that exhibit a dominant hard<br />
<strong>nuclear</strong> point source. Pellegrini et al. (2003) present an investigation<br />
with XMM-Newton and Chandra <strong>of</strong> <strong>the</strong> 7 ′′ central <strong>nuclear</strong><br />
source being consistent with an absorbed power law <strong>of</strong> Γ = 1.89<br />
with a column density <strong>of</strong> NH = 1.8 × 10 21 cm −2 , in close agreement,<br />
within <strong>the</strong> errors, with our fitted values. Our value <strong>of</strong> <strong>the</strong><br />
estimated 2–10 keV luminosity, 1.2 × 10 40 erg s −1 , agrees fairly<br />
well with <strong>the</strong> data reported by Pellegrini from XMM-Newton.<br />
NGC 4596 (UGC 7828). This galaxy is very faint at X-<strong>ray</strong><br />
frequencies, showing diffuse X-<strong>ray</strong> morphology in all <strong>the</strong> spectral<br />
bands (Fig. 5). Information on its spectral properties cannot<br />
be obtained based on <strong>the</strong> present data due to <strong>the</strong> lack <strong>of</strong> sufficient<br />
counts in <strong>the</strong> hard band (4.5–8.0 ∗ keV). No previous X-<strong>ray</strong> data<br />
have been reported for this galaxy.<br />
NGC 4636 (UGC 7878). This galaxy does not show emission<br />
at high energies (Fig. 5). Chandra data do not have enough<br />
quality to allow proper fitting to <strong>the</strong> spectrum. Xu et al. (2002)<br />
and O’Sullivan et al. (2005) present XMM-Newton data for this<br />
source and find that it can be consistent with <strong>the</strong>rmal plasma<br />
with a temperature kT between 0.53 and 0.71 keV. The arm-like<br />
structure reported by Jones et al. (2002) at s<strong>of</strong>t energies can be<br />
produced by shocks driven by symmetric <strong>of</strong>f-center outbursts,<br />
preventing <strong>the</strong> deposition <strong>of</strong> gas in <strong>the</strong> center. O’Sullivan et al.<br />
(2005) suggest that <strong>the</strong> X-<strong>ray</strong> morphology can be <strong>the</strong> result <strong>of</strong> a<br />
past AGN that is quiescent at <strong>the</strong> present. The difference in our<br />
luminosity estimation (1.77×10 39 erg s −1 ) and <strong>the</strong> value reported<br />
by Loewenstein et al. (2001) for <strong>the</strong> nucleus (2 × 10 38 erg s −1 ) is<br />
due to <strong>the</strong> different apertures used, 13 ′′ and 3 ′′ , respectively.<br />
NGC 4676A and B (Arp 242, The Mice Galaxy). No detection<br />
<strong>of</strong> X-<strong>ray</strong>s can be seen at high energies (Fig. 5). Read (2003)<br />
presents <strong>the</strong> first Chandra analysis <strong>of</strong> <strong>the</strong> Mice Galaxy and found<br />
a compact source in component B being ra<strong>the</strong>r diffuse in A.<br />
Their spectral fitting in B is both consistent with MEKAL <strong>the</strong>rmal<br />
and power law modeling. We did not perform any fitting<br />
due to poor counting statistics. From <strong>the</strong> color–color diagrams,<br />
<strong>the</strong> data for component A are consistent with a power law with<br />
an spectral index in <strong>the</strong> range 0.8–1.2. We did not make any estimation<br />
for component B since <strong>the</strong> error in <strong>the</strong> count rate for<br />
<strong>the</strong> hardest band is greater than 80%. Our estimated luminosities<br />
for both components agree remarkably well with <strong>the</strong> results<br />
by Read, and <strong>the</strong>y can be attributed to <strong>the</strong> starbursts in both<br />
components.<br />
NGC 4696 (Abell 3526). This galaxy is ra<strong>the</strong>r diffuse at high<br />
energies, having a clear <strong>nuclear</strong> halo morphology at s<strong>of</strong>t energies<br />
(Fig. 5). In fact, Dudik et al. (2005) class it as an object<br />
that reveals a hard <strong>nuclear</strong> point source embedded in s<strong>of</strong>t diffuse<br />
emission. In <strong>the</strong>ir reported ASCA data for a few giant ellipticals<br />
in clusters, Di Matteo et al. (2000) and Allen et al. (2000)<br />
include this galaxy, which is <strong>the</strong> center <strong>of</strong> <strong>the</strong> Centaurus cluster,<br />
and <strong>the</strong> analysis <strong>of</strong> its spectrum shows a high luminosity <strong>of</strong><br />
2.14 × 10 42 erg s −1 . Taylor et al. (2006) obtain <strong>the</strong> best-fit model<br />
by a MEKAL <strong>the</strong>rmal plasma with kT = 0.75 keV and abundance<br />
<strong>of</strong> 0.22 times <strong>the</strong> solar abundance; in <strong>the</strong> same sense, Rinn<br />
et al. (2005) fit its XMM-Newton spectrum with a <strong>the</strong>rmal model<br />
with kT = 0.7 keV but for a 1.2 solar metallicity. At variance<br />
with <strong>the</strong>m, our best-fit model seems to be a power law but with<br />
a ra<strong>the</strong>r high and unrealistic spectral index <strong>of</strong> 4.26. This difference<br />
can be attributed to <strong>the</strong> different aperture used, 3.9 ′′ in our<br />
case and 0.9 ′′ in <strong>the</strong> data by Taylor et al. Even so, <strong>the</strong> estimated<br />
luminosities are not very far within a factor <strong>of</strong> 2 (6 × 10 39 erg s −1<br />
and 1.2×10 40 erg s −1 for our analysis and Taylor’s, respectively).<br />
We classified this source as a good candidate for a Starburst due<br />
to <strong>the</strong> absence <strong>of</strong> a <strong>nuclear</strong>-unresolved source at hard energies<br />
(Fig. 5). Never<strong>the</strong>less, The VLBA data reported by Taylor and<br />
collaborators reveal a weak nucleus and a broad, one-sided jet<br />
extending over 25 pc, suggesting <strong>the</strong> AGN <strong>nature</strong> <strong>of</strong> this peculiar<br />
source.<br />
NGC 4698 (UGC 7970). This galaxy shows very faint, highenergy<br />
X-<strong>ray</strong> emission from its central region. The largest extension<br />
is found at intermediate energies, between 1 and 4 keV<br />
(Fig. 5). Georgantopoulos & Zezas (2003) make a careful analysis<br />
<strong>of</strong> <strong>the</strong> Chandra data on this source and find that <strong>the</strong> X-<strong>ray</strong><br />
<strong>nuclear</strong> position coincides with <strong>the</strong> faint radio source reported by<br />
Ho and Ulvestad (2001). They find that <strong>the</strong> best-fit model consists<br />
<strong>of</strong> an absorbed power law with Γ = 2.18 and column density<br />
<strong>of</strong> NH = 5 × 10 20 cm −2 , which gives a <strong>nuclear</strong> luminosity<br />
<strong>of</strong> 10 39 erg s −1 . We found from <strong>the</strong> color–color diagrams that <strong>the</strong><br />
data are consistent with a combined model <strong>of</strong> a power law with<br />
Γ = [1.2–1.6] and a <strong>the</strong>rmal component with kT = [0.7–0.8] keV<br />
and a luminosity lower by a factor <strong>of</strong> two than <strong>the</strong> one estimated<br />
by Georgantatopoulos & Zezas (2003). Cappi et al. (2006) fit<br />
its XMM-Newton spectrum with a single power law model with<br />
Γ = 2.0 and get L(2–10 keV) = 1.6 × 10 39 erg s −1 , a factor <strong>of</strong><br />
3 brighter than our determination.<br />
NGC 4736 (M 94, UGC 7996). This galaxy shows a large<br />
amount <strong>of</strong> unresolved compact <strong>sources</strong> in <strong>the</strong> few central arcseconds,<br />
which make <strong>the</strong> extraction <strong>of</strong> <strong>the</strong> true <strong>nuclear</strong> source ra<strong>the</strong>r<br />
difficult (Fig. 5). Eracleous et al. (2002) identified 3 <strong>sources</strong><br />
in <strong>the</strong> <strong>nuclear</strong> region, all <strong>of</strong> <strong>the</strong>m showing hard spectra with<br />
power law indices ranging from 1.13, for <strong>the</strong> brightest one,<br />
to 1.8 for X-3, and luminosities in <strong>the</strong> 2–10 keV band between<br />
4 × 10 38 erg s −1 and 9.1 × 10 39 erg s −1 . We identified <strong>the</strong> source<br />
X-2 by Eracleous as <strong>the</strong> nucleus <strong>of</strong> <strong>the</strong> galaxy since it coincides<br />
with <strong>the</strong> 2MASS near-IR nucleus within 0.82 ′′ . Eracleous (2002)<br />
points out <strong>the</strong> complications <strong>of</strong> defining an AGN or SB character<br />
to this source, suggesting that even if <strong>the</strong> brightest source is associated<br />
with an AGN it will only contribute 20% to <strong>the</strong> energy<br />
balance in <strong>the</strong> X-<strong>ray</strong>s. The radio monitoring observations made<br />
by Körding et al. (2005) with <strong>the</strong> VLBI found a double structure,<br />
and <strong>the</strong> radio position N4736-b coincides with our identified<br />
X-<strong>ray</strong> nucleus. From this double structure <strong>the</strong> brightest knot<br />
N4736-b also appears to be variable, pointing to an AGN <strong>nature</strong><br />
for this low luminosity AGN.<br />
NGC 5055 (M 63, UGC 8334). This galaxy shows a clearly<br />
unresolved <strong>nuclear</strong> source coincident with <strong>the</strong> 2MASS position<br />
for <strong>the</strong> nucleus (Fig. 5). No previous Chandra data have been<br />
reported. The only data available were ROSAT PSPC and HRI<br />
observations (Read et al. 1997; Roberts & Warwick 2000) pointing<br />
to <strong>the</strong> nucleated <strong>nature</strong> <strong>of</strong> this source within <strong>the</strong> low spatial<br />
resolution, 10 ′′ at best. Recently, in <strong>the</strong> course <strong>of</strong> an investigation<br />
<strong>of</strong> ULX over a sample <strong>of</strong> 313 nearby galaxies, Liu &<br />
Bregman (2005) found 10 ULX in this galaxy, one <strong>of</strong> which is
O. González-Martín et al.: X-<strong>ray</strong> <strong>nature</strong> <strong>of</strong> <strong>LINER</strong>s, Online Material p 65<br />
close to <strong>the</strong> nucleus with a variable luminosity between 0.96 and<br />
1.59 × 10 39 erg s −1 in 1.6 days.<br />
NGC 5194 (M 51a, UGC 8493, Arp 85a). A clearly unresolved<br />
<strong>nuclear</strong> source is identified in <strong>the</strong> hard band <strong>of</strong> M51 coincident<br />
within 2.87 ′′ with <strong>the</strong> near IR nucleus (Fig. 5). Dudik<br />
et al. (2005) class it as an object that reveals a hard <strong>nuclear</strong><br />
point source embedded in s<strong>of</strong>t diffuse emission. Its spectral<br />
properties suggest that <strong>the</strong> source can be modeled by a combination<br />
<strong>of</strong> MEKAL at kT = 0.61 keV plus a power law<br />
with Γ = 2.67 and column density consistent with <strong>the</strong> galactic<br />
value, and this fitting provides a fairly low luminosity in<br />
<strong>the</strong> hard band (1.38 × 10 38 erg s −1 ). Dewangan et al. (2005) obtain<br />
XMM-Newton observations for <strong>the</strong> galaxy that show an extremely<br />
flat continuum and a narrow iron Kα line. They investigate<br />
different models for <strong>the</strong> galaxy, <strong>the</strong> best one being more<br />
consistent with a reflection <strong>of</strong> <strong>the</strong> primary power law (Γ = 1.9)<br />
by cold and dense material. By using this model, <strong>the</strong>y estimate<br />
a luminosity <strong>of</strong> 1.8 ∼ 10 39 erg s −1 , which is a factor <strong>of</strong> 10 larger<br />
than our estimation. Cappi et al. (2006) fit its XMM-Newton<br />
spectrum with a combined power law with Γ = 0.6 and <strong>the</strong>rmal<br />
with kT = 0.5 keV, toge<strong>the</strong>r with an Fe K line with EW(Fe<br />
K) = 0.986 keV, and get L(2–10 keV) = 3.3 × 10 39 erg s −1 , a factor<br />
<strong>of</strong> 20 brighter than our determination. These differences can<br />
be attributed ei<strong>the</strong>r to <strong>the</strong> different model used or maybe to <strong>the</strong><br />
differing spatial resolution <strong>of</strong> XMM-Newton and Chandra data.<br />
It has to be noticed that <strong>the</strong> iron line FeK has not been included<br />
in our fitting, but it is clearly detected. We note that, whereas<br />
UGC 08696 shows a compact <strong>nuclear</strong> source in this energy band,<br />
it cannot be directly associated with an FeK line because it has a<br />
broad high-energy component at <strong>the</strong>se energies.<br />
Mrk 266 (NGC 5256, UGC 8632, IZw 67). Its X-<strong>ray</strong> morphology<br />
shows <strong>the</strong> double structure <strong>of</strong> <strong>the</strong>se merging system<br />
with <strong>the</strong> northwest nucleus brighter than <strong>the</strong> sou<strong>the</strong>rn one. Also<br />
<strong>the</strong> sou<strong>the</strong>rn nucleus shows hard emission being more diffuse<br />
(Fig. 5). New XMM-Newton observations have been reported<br />
by Guainazzi et al. (2005), with data consistent with a <strong>the</strong>rmal<br />
plasma <strong>of</strong> luminosity 3.6 × 10 40 erg s −1 , which seems to agree<br />
with our results (see Table 5).<br />
UGC 08696 (Mrk 273). Mrk 273 is one <strong>of</strong> <strong>the</strong> prototypical<br />
ultra-luminous galaxies showing a very complex structure at<br />
optical frequencies with a double nuclei and a long tidal tail.<br />
At high X-<strong>ray</strong> energies only <strong>the</strong> nor<strong>the</strong>rn nucleus is detected<br />
(Fig. 5), which is coincident with <strong>the</strong> compact radio source<br />
shown by VLBI observations (Cole et al. 1999; Carilli & Taylor<br />
2000). Based on Chandra ACIS imaging, Satyapal et al. (2004)<br />
class this galaxy among those revealing a hard <strong>nuclear</strong> source<br />
embedded in s<strong>of</strong>t diffuse emission. Xia et al. (2002) report previous<br />
analysis <strong>of</strong> <strong>the</strong> X-<strong>ray</strong> Chandra data; <strong>the</strong>ir careful analysis<br />
<strong>of</strong> both <strong>the</strong> nucleus and <strong>the</strong> extended emission shows that <strong>the</strong><br />
compact nucleus is described well by an absorbed power law<br />
(NH = 4.1×10 20 cm −2 , Γ = 2.1, L(2–10 keV) = 2.9×10 42 erg s −1 )<br />
plus a narrow FeKα line. The most remarkable result <strong>of</strong> this analysis<br />
is that <strong>the</strong> spectrum <strong>of</strong> <strong>the</strong> central 10 ′′ is consistent with a<br />
metallicity <strong>of</strong> 1.5 Z⊙, whereas <strong>the</strong> extended halo seems to be<br />
consistent with <strong>the</strong>rmal plasma with metallicity <strong>of</strong> 0.1 Z⊙. The<br />
results reported by Ptak et al. (2003) point out that most <strong>of</strong> <strong>the</strong><br />
observed X-<strong>ray</strong> emission (95%) comes from <strong>the</strong> nucleus. Using<br />
XMM-Newton data, Balestra et al. (2005) analyze <strong>the</strong> FeKα line<br />
and conclude that, as in <strong>the</strong> case <strong>of</strong> NGC 6240, <strong>the</strong> line is <strong>the</strong><br />
result <strong>of</strong> <strong>the</strong> superposition <strong>of</strong> neutral FeKα and a blend <strong>of</strong> highly<br />
ionized lines <strong>of</strong> FeXXV and FeXXVI. Our best-fit model agrees<br />
with <strong>the</strong>se data within <strong>the</strong> errors (Γ = 1.74, kT = 0.75 keV,<br />
NH = 3.9 × 10 20 cm −2 and L(2–10 keV) = 1.5 × 10 42 erg s −1 , see<br />
Tables 5 and 6).<br />
CGCG 162-010 (Abell 1795, 4C 26.42). This galaxy is <strong>the</strong><br />
central galaxy <strong>of</strong> <strong>the</strong> cluster A1795, which hosts <strong>the</strong> powerful<br />
type I radio source 4C26.42. The X-<strong>ray</strong> morphology shows a<br />
ra<strong>the</strong>r diffuse emission at high energies and a very clear long<br />
filament at s<strong>of</strong>t energies (Fig. 5). A full description <strong>of</strong> <strong>the</strong> <strong>nature</strong><br />
<strong>of</strong> this filament is made in Crawford et al. (2005), who attribute<br />
<strong>the</strong> observed structure to a large event <strong>of</strong> star formation<br />
induced by <strong>the</strong> interaction <strong>of</strong> <strong>the</strong> radio jet with <strong>the</strong> intra-cluster<br />
medium. Satyapal et al. (2004) class this galaxy among those<br />
revealing a hard <strong>nuclear</strong> source embedded in s<strong>of</strong>t diffuse emission,<br />
based on Chandra ACIS imaging. Never<strong>the</strong>less, Donato<br />
et al. (2004) investigate <strong>the</strong> <strong>nature</strong> <strong>of</strong> <strong>the</strong> X-<strong>ray</strong> central compact<br />
core in a sample <strong>of</strong> type I radio galaxies and classify this galaxy<br />
among <strong>sources</strong> without a detected compact core, in agreement<br />
with our classification. Our X-<strong>ray</strong> spectroscopic analysis results<br />
in this object being one <strong>of</strong> <strong>the</strong> five most luminous in our sample,<br />
with a value in very good agreement with <strong>the</strong> one estimated by<br />
Satyapal et al. (2004) for an intrinsic power-law slope <strong>of</strong> 1.8 (see<br />
Table 5).<br />
NGC 5746 (UGC 9499). No previous X-<strong>ray</strong> data have been<br />
reported previously. Its morphology shows a clearly compact,<br />
unresolved <strong>nuclear</strong> source (Fig. 5). Nagar et al. (2002) detected a<br />
compact radio source suggesting <strong>the</strong> AGN <strong>nature</strong> <strong>of</strong> this galaxy.<br />
Both <strong>the</strong> fitting and <strong>the</strong> position in <strong>the</strong> color–color diagrams indicate<br />
considerable obscuration (see Table 6).<br />
NGC 5846 (UGC 9706). Based on Chandra data, Trinchieri<br />
& Goudfroij (2002) reveal a complex X-<strong>ray</strong> morphology with no<br />
clear <strong>nuclear</strong> identification (see also Fig. 5). They detect, however,<br />
a large amount <strong>of</strong> individual, compact <strong>sources</strong> in <strong>the</strong> range<br />
<strong>of</strong> luminosities <strong>of</strong> 3–20 × 10 38 erg s −1 . Filho et al. (2004) report<br />
a weak, hard (2–10 keV) <strong>nuclear</strong> source with Γ = 2.29, compatible<br />
within <strong>the</strong> errors with <strong>the</strong> value we obtain from <strong>the</strong> spectral<br />
fitting. Satyapal et al. (2005) analyze <strong>the</strong> Chandra data <strong>of</strong> this<br />
galaxy that <strong>the</strong>y class within non-AGN <strong>LINER</strong>s, fitting its spectrum<br />
with a single <strong>the</strong>rmal model with kT = 0.65 keV, exactly<br />
<strong>the</strong> same as we get for our single RS model (see Table 3).<br />
NGC 5866 (UGC 9723). The data for this galaxy reveal a<br />
ra<strong>the</strong>r complex morphology at hard frequencies with an identifiable<br />
<strong>nuclear</strong> region and extended emission in <strong>the</strong> northwest<br />
direction (Fig. 5). Previous X-<strong>ray</strong> data by Pellegrini (1994) are<br />
based on ROSAT PSPC observations, where <strong>the</strong>y pointed out <strong>the</strong><br />
high excess <strong>of</strong> s<strong>of</strong>t X-<strong>ray</strong> emission in S0 galaxies. Filho et al.<br />
(2004) and Terashima & Wilson (2003) failed to detect any hard<br />
<strong>nuclear</strong> X-<strong>ray</strong> emission in <strong>the</strong> Chandra image <strong>of</strong> this galaxy,<br />
and Satyapal et al. (2005) class it as a non-AGN-<strong>LINER</strong>, which<br />
agrees with our morphological classification.<br />
NGC 6251 (UGC 10501). This is a well-known radio galaxy<br />
hosting a giant radio jet (Birkinshaw & Worrall 1993; Sudou<br />
et al. 2001). The high-energy X-<strong>ray</strong> morphology shows a welldefined<br />
unresolved <strong>nuclear</strong> source without any extended halo<br />
(Fig. 5). Guainazzi et al. (2003) report a full analysis <strong>of</strong> <strong>the</strong> <strong>nuclear</strong><br />
energy source comparing Chandra, BeppoSAX, and ASCA<br />
data. They find that <strong>the</strong> spectra can be modeled by a combination<br />
<strong>of</strong> <strong>the</strong>rmal plasma at kT = 1.4 keV, plus a power law with<br />
Γ = 1.76 and NH = 1.6×10 21 cm −2 , but <strong>the</strong>y do not find evidence<br />
<strong>of</strong> <strong>the</strong> broad FeKα claimed by previous ASCA observations.<br />
However, <strong>the</strong> high sensitivity <strong>of</strong> XMM-Newton leads Gliozzi
O. González-Martín et al.: X-<strong>ray</strong> <strong>nature</strong> <strong>of</strong> <strong>LINER</strong>s, Online Material p 66<br />
et al. (2004) to again suggest that such a broad (σ = 0.6 keV)<br />
FeKα line at 6.4 keV with an EW = 0.22 keV does exist. They<br />
suggest <strong>the</strong> presence <strong>of</strong> an accretion disk in addition to <strong>the</strong> jet<br />
for explaining <strong>the</strong> origin <strong>of</strong> <strong>the</strong> X-<strong>ray</strong> emission. Chiaberge et al.<br />
(2003a) modeled <strong>the</strong> spectrum from γ-<strong>ray</strong> to radio frequencies<br />
and find that it is consistent with a synchrotron self-compton<br />
model with an unexpected high resemblance to blazar-like objects.<br />
This model, toge<strong>the</strong>r with <strong>the</strong> dispute over <strong>the</strong> existence <strong>of</strong><br />
FeKα, leads Evans et al. (2005) to favor <strong>the</strong> relativistic jet emission<br />
as <strong>the</strong> main component <strong>of</strong> <strong>the</strong> observed emission. Our data<br />
agree remarkably well with <strong>the</strong> ones reported by Gliozzi et al.<br />
(2003).<br />
NGC 6240 (IC 4625, UGC 10592, 4C 02.44). Komossa et al.<br />
(2003) discovered a binary AGN in <strong>the</strong> galaxy coincident with<br />
<strong>the</strong> optical nucleus. They appear compact-unresolved at energies<br />
between 2.5–8 keV. The spectroscopic analysis shows a very<br />
hard radiation for both nuclei, with Γ = 0.2 for one to <strong>the</strong> South<br />
and 0.9 for one to <strong>the</strong> Nor<strong>the</strong>ast. The FeKα is present in both<br />
nuclei. Satyapal et al. (2004) class it as an object that reveals<br />
a hard <strong>nuclear</strong> point source embedded in s<strong>of</strong>t diffuse emission.<br />
Ptak et al. (2003) point out <strong>the</strong> complexity <strong>of</strong> <strong>the</strong> <strong>nuclear</strong> spectrum<br />
<strong>of</strong> this galaxy and construct a more complex model that,<br />
in addition to <strong>the</strong> standard MEKAL and power law components,<br />
also includes a Gaussian fit for <strong>the</strong> FeKα and a Compton reflection<br />
component with different column densities. To give an idea<br />
<strong>of</strong> <strong>the</strong> complexity <strong>of</strong> <strong>the</strong> source let us point out that Boller et al.<br />
(2003) best-modeled <strong>the</strong> FeKα line as resolved into 3 narrow<br />
lines: neutral FeKα at 6.4 keV, an ionized line at 6.7 keV, and<br />
a blend <strong>of</strong> higher ionized lines (FeXXVI and <strong>the</strong> Fe Kβ line)<br />
at 7.0 keV. For consistency with <strong>the</strong> statistical analysis, we modeled<br />
<strong>the</strong> continuum spectrum with a combination <strong>of</strong> <strong>the</strong>rmal plus<br />
a power law component without taking <strong>the</strong> complex FeKα line<br />
into account. High absorption is derived for this source from<br />
both <strong>the</strong> spectral fitting and <strong>the</strong> estimation from color–color diagrams<br />
(Table 6).<br />
IRAS 17208-0014. The X-<strong>ray</strong> <strong>nuclear</strong> emission <strong>of</strong> this<br />
infrared ultra-luminous galaxy appears to be unresolved at<br />
high energies (Fig. 5). Rissaliti et al. (2000) analyzed luminous<br />
IR galaxies in X-<strong>ray</strong> with BeppoSAX to investigate <strong>the</strong><br />
2–10 keV <strong>nature</strong> <strong>of</strong> <strong>the</strong>ir emission and <strong>the</strong>y classify it as a<br />
star forming galaxy with quite a large X-<strong>ray</strong> luminosity (L(2–<br />
10 keV) = 1 × 10 42 erg s −1 ). Franceschini et al. (2003) report<br />
XMM-Newton data for a sample <strong>of</strong> 10 ULIRGs and find that for<br />
this galaxy <strong>the</strong> observations are equally consistent with a model<br />
<strong>of</strong> a <strong>the</strong>rmal plasma with a temperature kT = 0.75 keV plus a<br />
power law component with Γ = 2.26 and NH = 1.1 × 10 22 cm −2 ,<br />
and a <strong>the</strong>rmal component with a temperature kT = 0.74 keV<br />
plus a cut-<strong>of</strong>f power law component with Γ = 1.30 and NH =<br />
2.6 × 10 21 cm −2 , leading in both cases to a similar luminosity<br />
on <strong>the</strong> order <strong>of</strong> a few times 10 41 erg s −1 . Based on <strong>the</strong> lack <strong>of</strong><br />
FeKα and <strong>the</strong> close value between <strong>the</strong> SFR estimated through<br />
<strong>the</strong> Far IR emission and <strong>the</strong> X-<strong>ray</strong> emission, <strong>the</strong>y suggest that<br />
X-<strong>ray</strong> emission has a starburst origin. We did not tried to fit <strong>the</strong><br />
spectrum due to low counts. From <strong>the</strong> position in <strong>the</strong> color–<br />
color diagrams, this galaxy seems to be consistent with high<br />
column density and a mix model with power law index between<br />
1.6 and 2.0 and temperature in <strong>the</strong> range 0.6–0.8 keV.<br />
Ptak et al. (2003) analyze <strong>the</strong> Chandra data on this object and<br />
find that <strong>the</strong> best fit to <strong>the</strong> global spectrum is provided by a combined<br />
power law (Γ = 1.68) and <strong>the</strong>rmal (kT = 0.35 keV) with<br />
NH = 0.52 × 10 22 cm −2 model. The <strong>nuclear</strong> luminosity is estimated<br />
to be L(2–10 keV) = 4.2 × 10 41 erg s −1 , a factor <strong>of</strong> 3<br />
brighter than <strong>the</strong> one we estimate (see Table 5).<br />
NGC 6482 (UGC 11009). This galaxy is <strong>the</strong> brightest member<br />
<strong>of</strong> a fossil group. Khosroshashi et al. (2004) analyze <strong>the</strong><br />
temperature pr<strong>of</strong>ile <strong>of</strong> <strong>the</strong> group but not for <strong>the</strong> individuals. The<br />
Chandra data on this source show no hard <strong>nuclear</strong> source (Fig. 5)<br />
associated with <strong>the</strong> compact radio source detected by Goudfroij<br />
et al. (1994). Our spectral analysis shows that <strong>the</strong> data are consistent<br />
with a <strong>the</strong>rmal plasma at kT = 0.68 keV. This is <strong>the</strong> only<br />
galaxy for which <strong>the</strong> <strong>nuclear</strong> spectrum is better-fitted by a single<br />
<strong>the</strong>rmal component.<br />
NGC 7130 (IC 5135). This galaxy shows a well-defined <strong>nuclear</strong><br />
source at high X-<strong>ray</strong> energies (Fig. 5). Since most <strong>of</strong> <strong>the</strong><br />
UV emission is spectrally characteristic <strong>of</strong> star formation (Thuan<br />
1984; Gonzalez-Delgado et al. 1998), Levenson et al. (2005)<br />
tried to decompose <strong>the</strong> AGN and Starburst contributions and find<br />
that <strong>the</strong> AGN contribution manifested mainly at higher energies,<br />
higher than 3 keV. They find that <strong>the</strong> obscuration <strong>of</strong> <strong>the</strong> nucleus<br />
is Compton-thick, which prevents <strong>the</strong> detection <strong>of</strong> <strong>the</strong> intrinsic<br />
emission in <strong>the</strong> Chandra bandpass below 8 keV. We recall that<br />
our spectral fitting is not statistically acceptable for this source.<br />
NGC 7331 (UGC 12113). Stockdale et al. (1998) and<br />
Roberts & Warwicl (2000) used ROSAT data to point out <strong>the</strong><br />
AGN <strong>nature</strong> <strong>of</strong> this galaxy. Never<strong>the</strong>less, <strong>the</strong> hard X-<strong>ray</strong> data<br />
from Chandra do not show any evidence <strong>of</strong> a <strong>nuclear</strong> source,<br />
being very diffuse at high energies (Fig. 5). Note that Filho et al.<br />
(2004) describe this galaxy as hosting a hard (2–10 keV) X-<strong>ray</strong><br />
nucleus, but Satyapal et al. (2004) class it as an object exhibiting<br />
multiple, hard <strong>of</strong>f-<strong>nuclear</strong> point <strong>sources</strong> <strong>of</strong> comparable brightness<br />
to <strong>the</strong> <strong>nuclear</strong> source. Our estimated parameters are consistent<br />
with a spectral index <strong>of</strong> 2–2.6 and temperature <strong>of</strong> 0.7 keV.<br />
Gallo et al. (2006) present XMM-Newton data on <strong>the</strong> source and<br />
find that <strong>the</strong> spectrum is consistent with a <strong>the</strong>rmal component at<br />
kT = 0.49 keV plus a power law with Γ = 1.79 giving a luminosity<br />
that it is a factor <strong>of</strong> 10 larger than our estimation. The reasons<br />
for this difference are not clear. The estimation <strong>of</strong> <strong>the</strong> luminosity<br />
by Satyapal et al. (2004) for an intrinsic power slope <strong>of</strong> 1.8 is in<br />
perfect agreement with ours, hinting that resolution effects are<br />
important to explain <strong>the</strong> difference with <strong>the</strong> work by Gallo et al.<br />
(2006).<br />
IC 1459 (IC 5265). This galaxy presents an unresolved <strong>nuclear</strong><br />
source on top <strong>of</strong> a diffuse halo at high energies (Fig. 5),<br />
in agreement with <strong>the</strong> classification by Satyapal et al. (2004). It<br />
hosts a Super-massive black hole (2 × 10 9 M⊙, Cappellari et al.<br />
2002) but with ra<strong>the</strong>r moderate <strong>nuclear</strong> activity. Fabbiano et al.<br />
(2003) find that it shows a ra<strong>the</strong>r weak (L(2–10 keV) = 8.0 ×<br />
10 40 erg s −1 ) unabsorbed <strong>nuclear</strong> X-<strong>ray</strong> source with Γ = 1.88<br />
and a faint FeKα line at 6.4 keV. These characteristics describe a<br />
normal AGN radiating at sub-Eddington luminosities, at 3×10 −7<br />
below <strong>the</strong> Eddington limit. They suggest that ADAF solutions<br />
can explain <strong>the</strong> X-<strong>ray</strong> spectrum, but <strong>the</strong>se models failed to explain<br />
<strong>the</strong> high radio power <strong>of</strong> its compact source (Drinkwater<br />
et al. 1997). Our fitting parameters are in a remarkably good<br />
agreement with <strong>the</strong>irs (Γ = 1.89, kT = 0.30 keV and L(2–<br />
10 keV) = 3.6 × 10 40 erg s −1 ).