ResearchNewsletter - Archive Server
ResearchNewsletter - Archive Server
ResearchNewsletter - Archive Server

You also want an ePaper? Increase the reach of your titles
YUMPU automatically turns print PDFs into web optimized ePapers that Google loves.
European<br />
Semiconductor Application Markets<br />
Wume II—Newsletters<br />
UNITED KINGDOM<br />
Dataquest UK Limited<br />
13th Floor, Centrepoint<br />
103 New Oxford Street<br />
London WClA IDD<br />
England<br />
01-379-6257<br />
Telex: 266195<br />
Fax: 01-240-3653<br />
GERMANY<br />
Dataquest GmbH<br />
Rosenkavalierplatz 17<br />
D-8000 Munich 81<br />
)^fest Germany<br />
(089)91 10 64<br />
Telex: 5218070<br />
Fax: (089)91 21 89<br />
Dataquest<br />
n n acompanyof<br />
UiB TheOun&Bradstreetcorporation<br />
1290 Ridder Park Drive<br />
San Jose, California 95131-2398<br />
(408) 437-8000<br />
Telex: 171973<br />
Eax: (408) 437-0292<br />
Sales/Service Offices:<br />
FRANCE<br />
Dataquest SARL<br />
Tour Gallieni 2<br />
36, avenue Gallieni<br />
93175 Bagnolet Cedex<br />
France<br />
(1)48 97 31 00<br />
Telex: 233 263<br />
Fax: (1)48 97 34 00<br />
JAPAN<br />
Dataquest Japan, Ltd.<br />
Taiyo Ginza Building/2nd Floor<br />
7-14-16 Ginza, Chuo-ku<br />
Tokyo 104 Japan<br />
(03)546-3191<br />
Tfelex: 32768<br />
Fax: (03)546-3198<br />
EASTERN U.S.<br />
Dataquest Boston<br />
1740 Massachusetts Ave.<br />
Boxborough, MA 01719-2209<br />
(508) 264-4373<br />
Telex: 171973<br />
Fax: (508) 635-0183<br />
KOREA<br />
Dataquest Korea<br />
63-1 Chungjung-ro, 3Ka<br />
Seodaemun-ku<br />
Seoul, Korea<br />
(02)392-7273-5<br />
Tfelex: 27926<br />
Fax: (02)745-3199<br />
The content of this report represents our interpretation and analysis of information generally available<br />
to the public or released by responsible individuals in the subject companies, but is not guaranteed<br />
as to accuracy or completeness. It does IKA contain material provided to us in confidence by our clients.<br />
This information is not furnished in connection with a sale or offer to sell securities, or in connection<br />
witii the solicitation of an offer to buy securities. This firm and its parent and/or their officers,<br />
stockholders, or members of their families may, from time to time, have a long or short position in<br />
the securities mentioned and may sell or buy such securities.<br />
Printed in the United States of America. All rights reserved. No part of this publication may be<br />
reproduced, stored in retrieval systems, or transmitted, in any form or by any means—mechanical,<br />
electronic, photocopying, duplicating, microfilming, videotape, or otherwise—without the prior written<br />
permission of the publisher.<br />
© 1989 Dataquest Incorporated
Newsletters 1989
Dataquest<br />
a company of<br />
The Dun& Bradsticet Corporation<br />
Research Newsletter<br />
EUROPEAN SEMICONDUCTOR PROCUREMENT SURVEY<br />
SUMMARY<br />
Dataquest pericKlically conducts procurement<br />
surveys of the leading semiconductor puichasiog<br />
locadoQS in Europe. The infoimation from these<br />
surveys is then analyzed to provide key industry<br />
indicators such as regional, product, and a^Hcation<br />
forecasts and ti^ids. lliis newsletter covers a<br />
number of inqioitant procurement trends within<br />
diffluent market sectors and highlights major issues<br />
cutrendy facing procurement executives and semic(»iductor<br />
marketing manages. Table 1 summarizes<br />
the results obtained in Dataquest's most recent<br />
survey.<br />
THE MARKET SEGMENTS<br />
Data Processing Segment<br />
When asked to specify, in local currency<br />
terms, the percentage of increase in their semiconductor<br />
purchases from 1988 to 1989, the majority<br />
TABLE 1<br />
European Procurement Survey Key Results<br />
Segment<br />
D^a Rocesang<br />
Comnmnications<br />
TranqKxtalicn<br />
tadustdal<br />
MBilaiy<br />
Consumer<br />
Target<br />
Invoitory Levels<br />
5-6 wedcs OVCT<br />
2 weeks over<br />
2-3 weeks under<br />
3 weeks over<br />
OK<br />
Ugh<br />
SonioHiductor ' Spending<br />
1989-1988 1990-1^9<br />
+25%-60% 0%-5%<br />
+10%-15%<br />
+5%-10%<br />
5%-10%<br />
20%<br />
10%<br />
of le^poodom 'va^caisd a range between 25 smd<br />
60 paceaL For 1989 to 1990, die growth expectation<br />
varies firom 0 to 5 pocent. Hie decline in<br />
growth rate strans first from a decline in the avaage<br />
selling |sice of MOS memory products and<br />
second from an increase in inventcnry levels within<br />
the PC sector. Most of die large users, especially<br />
those coQcoitrating cm PC production, indicated<br />
th£^ their actual invratory levels were five to six<br />
weeks higher than their targeted inventory levels.<br />
The major culpih causing this excess iaventory<br />
level is memory, which represents more than<br />
50 percent of these cotiq>anies' semiconductor purchases<br />
in dollar toms. No new large orders have<br />
beea placed for DRAMs over die last few mondis,<br />
and our analysis indicates that many buyers are<br />
hedging for die best prices before they place more<br />
DRAM ordes^. Very little double ordering is occurring<br />
because most buyers are not rescheduling dieir<br />
delivery dates. The market for PCs grew by more<br />
5%-10%<br />
+10%<br />
Eat<br />
5%<br />
Negative<br />
Key Concerns<br />
Memoiy inventones md prices<br />
locreased oaca^isaiy of ASICs manory paces<br />
Disoete, c^ito<br />
On-time cfelive^, dism'buti(»i shakoq)<br />
Recbictkn cf mOitaty memory siq^lieis<br />
Sbwcbwn in consumer spending<br />
Souice: Dataquest<br />
October 1939<br />
ID1989 Dataquest Incoipoiated October-Reproduction Prohibited<br />
0005330<br />
ESAM Volume n. Newsletters 1989-22<br />
77K content of this report represents our interpretation and analysis qfinprmation generally available to the public or released by responsible individuals in the subject companies, but<br />
IS not guamiueed as to accuracy or completeness It does not contain material provided lo us in confidence by our clients Individual companies reported on and analyzed by Dataquest<br />
may be clients tifthis and/or other Dataquest services. This inprmatwn is not furnished in connection with a sale or itffer to sell securities or in connection mlh the solicitation cfan<br />
offer lo buy securities. This firm and its parent and/or their officers, stockholders, or members of their families may, from time lo time, have a long or short position in the securities<br />
mentioned and may sell or buy such securities<br />
Dataquest Incorporated, 1290 Ridder Park Drive, San Jose, CA 95131-2398 / (408) 437-8000 / Telex 171973 / Fax (408) 437-0292
than 50 percent in the first half of 1989. The<br />
inventory build-up is due to suppliers catching up<br />
on long-teim agreed contract delivery dates and<br />
prices. We expect inventories to be used up by the<br />
fourth quartet of 1989.<br />
One sign of major concern facing this sector<br />
is diat most Japanese vendors soe cutting back on<br />
1Mb DRAM cs^mcity in favor of 256K SRAMs<br />
and 4Mb DRAMs. This situation could cause some<br />
hicci^s in supply of 1Mb DRAMs, especially<br />
when 4Mb DRAMs become widely available<br />
in 1990.<br />
Communications Segment<br />
The major central office equipment manufacturers<br />
indicated a growth of 10 to IS percent in<br />
semiconductor purchases in 1989 over 1988. However,<br />
this growth is expected to decline to 5 to<br />
10 pocent in 1990. This segment is also a very large<br />
user of ASIC devices. Dataquest believes that fiillcustom<br />
ASICs will still dominate ova standard cell<br />
and gs^ array devices ta terms of purchasing dollars<br />
sp«it in 1990.<br />
The next biggest expenditure should be for<br />
memories, followed by microcontrollers. Inventory<br />
levels in diese products are two weeks over targets!<br />
levels and are expected to remain the same in<br />
the near future. The datacommunication sector<br />
showed some signs of weakness, with some buyers<br />
indicating very little growth in 1989 over 1988 and a<br />
minimal increase of 5 percent in 1990.<br />
Issues that caused procurement managers in<br />
the telecommunications sector most concern were<br />
pricing, on-time delivery, and quality of incoming<br />
goods—ranked in that order.<br />
Transportation Segment<br />
Most survey respondents indicated that they<br />
are two to three weeks below their targeted inventory<br />
levels of three to four weeks holdings. The<br />
majority of them participate in just-in-time programs<br />
with their key vendors. Comparatively<br />
speaking, they spend a large portion of their purchasing<br />
dollars on discrete and optoelectronics<br />
products, followed by linear devices and microcontrollns.<br />
Exceptionally, most buyers indicated that<br />
they were budgeting for a 10 percent growth in 1990<br />
in contrast to other segments that indicated a<br />
gradual slowdown in semiconductor purchase<br />
0005330<br />
EUROPEAN SEMICONDUCTOR PROCUREMENT SURVEY<br />
dollars. This growth is being driven specifically by<br />
the greater use of electronic systems and components<br />
in the mass market range of automobiles.<br />
Major issues ranked by transportation buyers<br />
were on-time delivery, pricing, quality, and<br />
accurate forecasting of demand. Interestingly, a<br />
number of buyers intimated that they relied upon<br />
making up to S percent of their purchases via<br />
distributors in order to make up for shortfalls in<br />
delivered quantities from major vendors.<br />
Industrial Segment<br />
As in the transportation segment, discrete and<br />
optoelectronic devices enjoy a relatively high<br />
proportion of the total semiconductor expenditure<br />
in the industrial segment These devices make up<br />
more than 50 percent of the purchased devices in<br />
dollars, followed by linear, memory, and standard<br />
logic. Most respondents indicated that between 20<br />
and 35 percent of their purchases were via &anchised<br />
distributors. Despite this fact, most of the<br />
microcontrollers and ASICs are purchased directly<br />
from semiconductor vendors.<br />
Inventory levels in this segment are three<br />
weeks over targeted levels. Overall, industrial segment<br />
buyers anticipate that their 1990 spending<br />
will be flat compared with 1989 despite buoyant<br />
market conditions in the test, instrumentation, and<br />
medical markets.<br />
Military Segment<br />
Most military buyers indicated a slowdown in<br />
their purchasing power in 1990, with some stating<br />
a positive 20 percent growth in 1989 over 1988.<br />
Inventory levels do not seem to be a major problem<br />
because of the availabiiky of standard parts from<br />
distributor shelves and the long lead times required<br />
for some military parts.<br />
Major concerns are the shrinking base of military<br />
high-density memory suppliers and the switch<br />
from bipolar to CMOS devices. A large percentage<br />
of dollars is spent on memory products, followed<br />
by ASICs, linear, microcomponents, and standard<br />
logic. A number of respondents intimated that a<br />
high proportion of their memory spending is taken<br />
up by q)ecialized hybrid configurations. Among<br />
their ASIC expenditures, 80 percent were in the<br />
PLD segment, with standard ceUs becoming more<br />
popular.<br />
(D1989 Dataquest Incoipoiated October-Reproduction Prohibited<br />
ESAM Volume II. Newsletters 1989-22<br />
i
i EUROPEAN<br />
SEMICONDUCTOR PROCUREMENT SURVEY<br />
Consumer Segment<br />
i^thJn the consumer segn»i^ piocQmnaiU<br />
executives indicated concern abcnt the overall economic<br />
sUn^ion. Most econcnnists are fixecasting a<br />
rmfaicticHi in GNP during the first half of 1990. In<br />
the United Kingdom in paiticalar, hi^ intore^<br />
rates have affected the amount of disposable<br />
incOToe in circulation, l^iding to a reduction in<br />
order intake. Invmti»y levels at present are Mgb,<br />
and total spending in 1990 could be reduced by iq><br />
to 10 pracent over 1989. Key c(m.cems in this<br />
sector w&K ju^-in-time, quality, and pricing.<br />
01989 Dataquen Incoipoiated October-Reproductioii Prohibited<br />
ESAM Volume Q. Newsletten 1989-22<br />
DATAQUEST CONCLUSIONS<br />
Dat^uest's overall analysis shows that it wiU<br />
take time for excess invoitoty to be used up,<br />
re^ihing in slow growth in 1990. We believe that<br />
the brightest sectors wiU be transportation,<br />
telecommunications, and industrial; the data<br />
processing, txaHiary, and conaioKr segmei^ wiU<br />
diow some decline.<br />
Bipin Parmar<br />
0003330
m '¥m<br />
vs:^<br />
Dataoyest<br />
a company of<br />
The Dun tt Bradstiect Coqwration<br />
Research Newsletter<br />
SUMMARY<br />
ESAM Code: Volume n. Newsletters<br />
1989-20<br />
0005082<br />
PRINTER MANUFACTURING SCENE TRANSFORMED IN EUROPE<br />
The European printer industry is experiencing a period of rapid change caused by the<br />
increase of Japanese plants in Europe. This newsletter examines the European printer<br />
industry changes in three parts. The first part explores the reasons behind the Japanese<br />
influx, studies the European printer industry's recent history, and shows the results of a<br />
Dataquest survey of Japanese printer plants. The second part looks at the European<br />
printer market in detail and analyzes the potential impact on the semiconductor market<br />
of the increase in local production. Finally, the third part lists the major printer<br />
manufactmng locations in Europe by the types of printers manufactured at each site.<br />
RECENT PRINTER INDUSTRY HISTORY<br />
Until 1970, the European printer market was dominated by Centronics. In 1984, as<br />
the potential demand for printers for the oncoming PC boom was recognized, European<br />
and North American companies started to invest in new printer production sites in<br />
Europe. European printer production focused mainly on high-quality, heavy-duty printer<br />
products for multiuser systems. Brother was the first company to prepare for volume<br />
dot matrix printer production in Japan.<br />
With the boom in PC markets, there was a clear demand for low-priced,<br />
high-quality printers. Although Centronics was the first company to provide a dot<br />
matrix printer costing less than $1,000, the product had too many technical problems to<br />
survive in the market. North American and European companies noted this problem and<br />
many gave up their products in this market.<br />
Meanwhile, two Japanese manufacturers (namely, Epson and Oki) responded with<br />
high-quality, low-cost products that were produced in high-volume factories. With a<br />
well-established distribution network in Europe, the Japanese producers managed to gain<br />
a 60 percent market share; virtually all of this was in products that cost less than<br />
$1,000. In 1987, Japanese market share had risen to 75 percent of the European market.<br />
© 1989 Dataquest Incorporated October—Reproduction Prohibited<br />
The content of this report represents our interpretation and analysis of information generally available to the public or released by responsible individuals in the subject companies, but<br />
is not guaranteed as to accuracy or completeness. It does not contain material provided to us in confidence by our clients Individual companies reported on and analyzed by Dataquest<br />
may be clients of this and/or other Dataquest services This information is notjumished in connection with a sale or offer to sell securities or in cormection with the solicitation of an<br />
(^r to buy securities. This firm arui its parent and/or their officers, stockholders, or members of their families may, from time to time, have a long or short position in the securities<br />
mentioned and may sell or buy such securities<br />
Dataquest Incorporated, 1290 Ridder Park Drive, San Jose, CA 95131-2398 / (408) 437-8000 / Telex 171973 / Fax (408) 437-0292
Europe-based manufacturers were concerned, which resulted in a large-scale<br />
investigation by the European Community (EC) that was instigated by the Europrint<br />
Group. In March 1987, the EC Antidumping Committee initiated an informationgathering<br />
process for analyzing the intricacies of the complex path from manufacturers<br />
to end users. The EC's objective was to raise the prices of Japanese dot matrix printers<br />
and to allow European manufacturers breathing room so that they could become more<br />
competitive, but the EC did not anticipate the 13 new Japanese printer production plants<br />
in Europe. These plants were set up to avoid the high tariff on imported printers.<br />
In 1988, the EC imposed import tariffs on the majority of imported printers from<br />
Japan. The companies that received maximum tariff penalties of 33.4 percent accounted<br />
for more than 50 percent of the printer market share in 1987. This resulted in more than<br />
$500 million in import tariffs from sales of more than $1.6 billion. To make sure that<br />
end-user prices reflected the import tariffs, the EC produced a new regulation, 2423/88,<br />
which compelled Japanese manufacturers to apply the tariff on imports sold at the first<br />
European point of sale. The idea behind the rule was to prevent manufacturers from<br />
spreading import tariffs over a wider range of products or to recover tariffs from the<br />
more expensive models. The EC, after finalizing an investigation into local content for<br />
photocopiers, started a similar investigation into the printer industry in 1988.<br />
DATAQUEST SURVEY OF JAPANESE PRINTER MANUFACTURERS<br />
In 1987, there was only one Japanese printer manufacturing plant in Europe—that of<br />
Canon in France. By 1988, there were 14. More than 70 percent of total investment was<br />
situated in the United Kingdom. Table 1 lists the most important factors cited by<br />
manufacturers in deciding where to locate.<br />
Table 1<br />
Factors in Choosing Locations<br />
Most Important Less Important<br />
Local government grants Wage cost<br />
Communication Skilled labor<br />
Language Overall cost<br />
Component sourcing<br />
Source; Dataguest<br />
October 1989<br />
© 1989 Dataquest Incorporated October ESAM Newsletter
As indicated in Table 1, sourcing of components is considered very important. The<br />
major problems currently encountered in local sourcing are that of quality, price, and<br />
delivery. The companies surveyed estimated that it would take them 12 months to reach<br />
40 percent local content, 18 months to reach 50 percent, and 24 months to reach<br />
60 percent. What is apparent is that most companies are determined to source more<br />
thain the required minimum of 40 percent local content-<br />
As the printer manufacturing industry in Europe begins to mature, we expect an<br />
infrastructure comparable to that of Japan to emerge. Until then, most of these<br />
semiconductor components probably will be sourced from Japan. Fujitsu's announcement<br />
that it will locate its semiconductor fab in the United Kingdom is just the beginning of a<br />
potential wave of investment by Japanese component suppliers and printed circuit board<br />
(PCB) assembly subcontractors in Europe.<br />
Major Printer Components<br />
The main components of a printer are the printheads, PCB with electronic<br />
components, and specialized mechanical subassemblies. Dataquest believes that<br />
although the 40 percent content rule can easily be met without PCB, some Japanese<br />
plants have started inclusion of subcontract to local PCB assembly houses. These PCB<br />
boards can then be counted as local content as they are invoiced in local currencies. The<br />
majority of semiconductor components on the PCB still are sourced from Japanese<br />
vendors because most of the value is added via ASICs that are designed in Japan and<br />
sourced from either an in-house semiconductor supplier or an appropriate merchant<br />
supplier. Table 2 shows the major semiconductor components used in three types of<br />
printers.<br />
Table 2<br />
Major Semiconductor Printer Components<br />
Serial Dot Matrix Printer<br />
Quantity Components<br />
1 Serial EEPROM and small RAM buffer<br />
1 128-Kbit EPROM<br />
1 8155 8-bit parallel port<br />
1 8-bit controller with 128-Kbit EPROM and four 8-bit<br />
A/D converters<br />
1 Printhead electronics with 9 Darlington pairs<br />
delivering up to 2 amps and 24 pulsed volts<br />
10 Standard TTL<br />
Estimated total semiconductor value = $18.10<br />
ESAM Newsletter © 1939 Dataquest Incorporated October<br />
(Continued)
Table 2 (Continued)<br />
Major Semiconductor Printer Components<br />
Ink Jet Printer<br />
Quantity Components<br />
2 ASIC nozzle-control 8-bit input and 4 x 8-bit output<br />
2 ASIC parallel ports<br />
2 ASIC bus controllers<br />
1 16-bit MPU<br />
2 Diode arrays<br />
3 Discrete power supply regulator chips<br />
7 Custom nozzle drives<br />
1 LSI decoder<br />
12 Standard TTL logic<br />
Estimated total semiconductor value = $58.10<br />
Page Printer (Laser Printer)<br />
Quantity Components<br />
1 16/32-bit image processor<br />
1 8-bit MCU<br />
3 ASIC control logic, bus controllers, clock chip<br />
30 Standard TTL logic<br />
16 256-Kbit DRAMs<br />
1 Hybrid laser driver, with controllers for lens,<br />
motors, mirrors, scanners<br />
Estimated total semiconductor value = $214.10<br />
Source: Dataguest<br />
October 1989<br />
© 1989 Dataquest Incorporated October ESAM Newsletter
OPPORTUNITIES FOR EUROPE-BASED SEMICONDUCTOR VENDORS<br />
An analysis of the semiconductor content of a printer shows that most of the<br />
technology, and therefore value, is packed into ASICs. Considerable use is made of gate<br />
arrays and full-custom ICs, particularly in the printer head controlling the pin drivers.<br />
Most of this technology is proprietary, and in the case of Japanese printer companies,<br />
the design is done in Japan. This makes it very hard for European semiconductor<br />
companies to design in their products. The fundamental requirement must be to have a<br />
design center in Japan.<br />
Other than ASICs, printers incorporate standard logic, EEPROM, EPROM, DRAM,<br />
MCUs, and power transistors. Further integration of standard logic into ASICs is<br />
difficult, since this mainly comprises octal bus fxmctions.<br />
The Ihinter Mai^et's Potential Impact on the Semiconductor Market<br />
The printer market can be broken down into the following three major categories:<br />
• Serial printers<br />
• Line printers<br />
• Page printers<br />
Each category has several types of printers; for a full breakdown, please refer to the<br />
"Definition Section" of your ESAM binder or turn to the glossary at the end of this<br />
newsletter.<br />
Serial Printers<br />
The total serial printer market in 1988 was estimated to be 4.5 million units in<br />
Europe. Of these, Dataquest estimates that 1.6 million units were produced in Europe.<br />
This many units would represent a potential semiconductor market of $29 million if<br />
semiconductors were sourced locally. The market is expected to grow at a compound<br />
annual growth rate (CAGR) of 5.5 percent, reaching 5.9 million units by 1993. We<br />
estimate that 4.5 million units will be produced in Europe by 1993. Assuming that the<br />
majority of semiconductors will be purchased locally, this represents a potential market<br />
of $82 million.<br />
The market is led by Epson, Star Micronics, and NEC, which together control<br />
40 percent of the market. Citizen, Oki, and Amstrad follow; together they control<br />
19 percent of the market.<br />
Line Printers<br />
The line printer market is aimed at professional users (i.e., mainframes,<br />
microcomputers, and workstation installations). The total line printer market for 1988<br />
was estimated to be 46,500 units and is expected to grow to 61,800 units by 1993. The<br />
largest growth would be in line, impact, thermal transfer printers; we expect this market<br />
to grow at a CAGR of 33.8 percent to reach 28,600 units.<br />
Dataquest estimates that 14,000 line printers were produced in Europe in 1988. Of<br />
these, 9,000 were in the line, impact, fully formed category. The leading companies in<br />
this category are: Dataproducts, Gemicron, Fujitsu, IBM, and Nixdorf.<br />
ESAM Newsletter © 1989 Dataquest Incorporated October 5
Page Printers<br />
Page printers are commonly known as laser printers. Dataquest estimates that the<br />
1988 market was 445,000 units, and we expect it to grow at a CAGR of 27.9 percent to<br />
reach 1.5 million units in 1993. We estimate that 45,000 laser printers were produced in<br />
Europe in 1988. The largest category in unit shipment terms will be in the 1- to 10-ppm<br />
(page per minute) category representing 1.3 million units; of this, we estimate that<br />
540,000 will be produced locally. Although laser printer unit shipments are relatively<br />
low compared with serial printers (see Table 2), their semiconductor content in 1988 was<br />
estimated at $214.10. This amount represents a semiconductor market of $9.6 million in<br />
1988 for semiconductors that were sourced locally and should rise to $113 million for the<br />
1- to 10-ppm category by 1993.<br />
The leaders in the 1- to 10-ppm printer category are Hewlett-Packard, Canon, and<br />
Kyocera, which together control a 50 percent market share. Apple, NEC, and Qume<br />
follow, together controlling 14 percent of the market.<br />
Printer Production in Europe<br />
During 1988, 13 additional plants relocated to Europe, the result of the EC<br />
Antidumping duties on imported printers. Currently, 42 printer manufacturing plants are<br />
located in Europe—12 in the United Kingdom and Ireland, 11 in West Germany, 5 in<br />
France, 4 in the Benelux countries, 3 in both Scandinavia and Italy, and 2 each in Spain<br />
and Switzerland. Table 3 shows plant locations and types of printers manufactured.<br />
Cppipgipy<br />
Agfa-Gevaert<br />
Daisy Systems<br />
IBM<br />
Printronix<br />
Bull Peripherals<br />
PNPP<br />
Canon<br />
Epson<br />
lER<br />
TIV<br />
Canon/Olivetti*<br />
Honeywell Bull<br />
Olivetti<br />
SIFF, SNTT<br />
Facit<br />
SIDM<br />
IBM<br />
PNPP<br />
Mercante<br />
Table 3<br />
Western European Printer Manufacturing Sites<br />
City(ies)<br />
Mortsel<br />
Wijchen<br />
Amsterdam<br />
Wijchen<br />
Belfort<br />
Liffre, Brittany<br />
Paris<br />
Besancon<br />
Lognes<br />
Aglie<br />
Milan<br />
Ivrea<br />
Atvidaberg<br />
Stockholm<br />
Copenhagen<br />
Country<br />
Belgium<br />
Netherlands<br />
Netherlands<br />
Netherlands<br />
France<br />
France<br />
France<br />
France<br />
France<br />
Italy<br />
Italy<br />
Italy<br />
Sweden<br />
Sweden<br />
Denmark<br />
Technology<br />
PNPP<br />
SIFF<br />
SIDM<br />
LIDM<br />
LIFF,<br />
PNPP<br />
SIDM<br />
SIDM<br />
SIDM<br />
PNPP<br />
SIDM<br />
SIDM,<br />
SIFF,<br />
LIFF,<br />
PNPP<br />
(Continued)<br />
© 1989 Dataquest Incorporated October ESAM Newsletter
Company<br />
Fujitsu<br />
Rank Xerox<br />
Hermes<br />
Wenger<br />
Dataproducts<br />
Brother<br />
Citizen<br />
Epson<br />
Newbury Data<br />
NEC<br />
Okidata*<br />
Panasonic<br />
Rank Xerox<br />
Star*<br />
Technitron<br />
Walters<br />
Binder<br />
Kienzle<br />
Mannesmann Tally<br />
Nixdorf<br />
Olympia<br />
Philips<br />
Siemens<br />
Siemens<br />
TEC<br />
Triumph-Xdler<br />
Walther<br />
^Production plans<br />
DATAQUEST CONCLUSIONS<br />
Table 3 (Continxied)<br />
Western Eurcqiean Printer Manufacturing Sites<br />
Cit;y(i9S}<br />
Malaga<br />
Madrid<br />
Yverdon les Bains<br />
Reinach<br />
Dublin<br />
Wrexham<br />
Scunthorpe<br />
Telford<br />
Staines<br />
Telford<br />
Glasgow<br />
Newport, Gwent<br />
Gloucester<br />
Tredegar, Wales<br />
Slough<br />
High Wycombe<br />
Villingen<br />
Villingen<br />
Elchingen<br />
Paderborn<br />
Wilhelmshaven<br />
Siegen<br />
Muenchen<br />
Berlin<br />
Braunschweig<br />
Nuremburg<br />
Gerstetten<br />
announced, but not yet<br />
Cgvmtry<br />
Spain<br />
Spain<br />
Switzerland<br />
Switzerland<br />
Ireland<br />
United Kingdom<br />
United Kingdom<br />
United Kingdom<br />
United Kingdom<br />
United Kingdom<br />
United Kingdom<br />
United Kingdom<br />
United Kingdom<br />
United Kingdom<br />
United Kingdom<br />
United Kingdom<br />
West Germany<br />
West Germany<br />
West Germany<br />
West Germany<br />
West Germany<br />
West Germany<br />
West Germany<br />
West Germany<br />
West Germany<br />
West Germany<br />
West Germany<br />
finalized<br />
Techno l
PRINTER INDUSTRY DEFINITIONS<br />
APPENDIX<br />
The following categories comprise all electronic printers:<br />
• Serial printers<br />
• Line printers<br />
• Page printers<br />
Serial Printers<br />
Serial printers are printers that use a single printhead or striking mechanism to print<br />
characters sequentially across the page. They include the following:<br />
Line Printers<br />
Serial, impact, fully formed (SIFF) printers<br />
Serial, impact, dot matrix (SIDM) printers<br />
Serial, nonimpact, direct thermal (SNDT) printers<br />
Serial, nonimpact, thermal transfer (SNTT) printers<br />
Serial, nonimpact, ink jet (SNIJ) printers<br />
These are printers with a printhead that covers a full line of the printed page and a<br />
striking mechanism that prints one full line at a time. They include the following:<br />
• Line, impact, fully formed (LIFF) printers<br />
• Line, impact, dot matrix (LIDM) printers<br />
• Line, nonimpact, direct thermal (LNDT) printers<br />
• Line, nonimpact, thermal transfer (LNTT) printers<br />
Page Printers<br />
Page printers can buffer, in part or whole, a page of images received from an<br />
electronic source and then transmit these images to a receiving substrate. They include:<br />
Page, nonimpact, plain paper printers (PNPP) using laser, LED, ionography,<br />
magnetography, or ink jet technology.<br />
© 1989 Dataquest Incorporated October ESAM Newsletter
^ P Dataouest<br />
^te=VkpisS^ 1i!l a company of<br />
J^^^Mij I E D ThcDun&BradstFectCcxporation<br />
ThcDuntTBrad<br />
^M •sffS^i<br />
mm Research Newsletter<br />
DOMESTIC METERING: THE MARKET IN EUROPE<br />
SUMMARY<br />
This newsletter examines the prospects for<br />
semiconductor consumption in electronic domestic<br />
meters used for measuring electricity, gas, and<br />
water in Europe. In it, we will discuss the main<br />
factors that will affect the rate of substitution of<br />
these meters over mechanical rivals and forecast<br />
the demand for semiconductors during the next five<br />
years. Dataquest forecasts that the total market will<br />
increase from an estimated $18 million in 1989 to<br />
$83 million by 1994, showing an overall 35 percent<br />
compound annual growth rate (CAGR).<br />
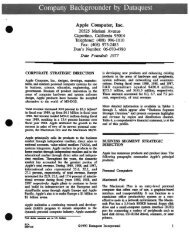
Figure 1 shows our estimation of the demand<br />
among electricity, water, and gas applicadons for<br />
1994. Electricity meters and teleswitches should<br />
account for the lion's share—90 percent—of this<br />
market, with consumption for meter applicadons<br />
forecast to grow at a heady 54 percent CAGR<br />
between 1989 and 1994.<br />
ELECTRONIC METERS BRING<br />
NEW FEATURES<br />
Although electronic meters cannot exactly<br />
match mechanical products point for point on cost,<br />
they do offer features that oraditional meters cannot<br />
provide. Table 1 summarizes these feamres, which<br />
are the "back doors" to the meter market.<br />
Electronic meters allow multiple rate tariffs to<br />
be administered according to the season, day of the<br />
FIGURE 1<br />
European Semiconductor Revenue Forecast by Domestic Metering Application (1994)<br />
Total Revenue = $83.1 Million<br />
Water<br />
$6.2 Million<br />
7.5%<br />
Gas<br />
$2.2 Million<br />
2.6%<br />
0005070-1 Source: Dataquest<br />
October 1989<br />
TABLE 1<br />
Benefits from Electronic Functionality for Electricity, Gas, and Water Meters<br />
F^mction Electricity Gas Water<br />
Multiple Tariff<br />
Supply Managemott<br />
Data Capture<br />
Note: 1 3 Mou Important; 2 a Important; 3 • Least Imponani N/<br />
M s Not Meaningful<br />
week, or time of day. The benefits are most<br />
pronounced for electricity metering where<br />
considerable power savings may be made to<br />
encourage or shape demand.<br />
Supply management functions allow the utility<br />
companies to switch off certain home appliances<br />
during periods of peak demand. As for multiple<br />
rate tariffs, the greatest benefit is in electricity<br />
management Trials have been conducted in the<br />
United Kingdom using the public telephone network,<br />
radio, and mains signaling to control household<br />
appUances. Savings are as much as $50 per<br />
annum per domestic consumer; however, this is not<br />
sufficient to justify equipment and installation<br />
costs.<br />
Data capture features can either shorten the<br />
manual measurement process or remove the need<br />
for meter-reading personnel to visit each home.<br />
Although automated measurement is common in<br />
the United States where the utility companies have<br />
a statutory obligation to read and bill monthly, this<br />
is not the case in Europe. Combined with the lower<br />
cost of labor in Europe, the prospects for remote<br />
measurement systems are weak.<br />
ELECTRICITY—COGS AND DISKS<br />
RULE ... FOR NOW<br />
Dataquest expects the greatest demand for<br />
semiconductors to occur in the electricity segment,<br />
where extra features offered by electronic meters<br />
bring the greatest utility.<br />
However, traditional mechanical, nonelectronic<br />
meters still dominate the market in Europe<br />
years after many predicted a switch to electronic<br />
meters. With few exceptions, this is true worldwide.<br />
Whether used for measurement of electricity,<br />
gas, or water, the crucial selling points for both<br />
products are price, reliability, and durability.<br />
Electricity meters using the spinning Ferraris<br />
disk cost $35 and have a proven useful life of up to<br />
30 years. They are approximately $10 less expen-<br />
N/M<br />
N/M<br />
DOMESTIC METERING: THE MARKET IN EUROPE<br />
3<br />
Source: Dataquest<br />
October 1989<br />
sive than electronic versions, which have lifetimes<br />
that can only be estimated.<br />
Semiconductor Content<br />
Many solutions have been developed for<br />
domestic power measurement The most common<br />
solution is to feed current signal from a lasertrimmed<br />
shunt and voltage signal into an analog<br />
multiplier to derive a power signal (see the semiconductor<br />
breakdown in Table 2). This power signal<br />
is, in turn, passed to a voltage-frequency converter<br />
and frequency counter to enable reading by a<br />
standard microcontroller (MCU). Excluding the<br />
MCU, all these functions are integrated onto a single,<br />
low-noise CMOS or bipolar .ASIC. An<br />
EEPROM provides a nonvolatile store in case of<br />
power failiu-e. We estimate the semiconductor cost<br />
for this approach to be $8.95, 21 percent of an<br />
average selling price of $42.00.<br />
Another approach dispenses with the analog<br />
multiplier circuit and resistive shunt by combiiung<br />
current-voltage measurement and power multiplication<br />
functions onto a single Hail probe attached to a<br />
slow 12-bit A/D converter and MCU.<br />
Electronic teleswitches are common adjuncts<br />
to either electronic or eiectromechaiucal meters.<br />
There are two basic types that differ in terms of the<br />
transmission medium the utility companies use to<br />
control them. First, radio teleswitches using the<br />
198-kHz radio band are employed widely in the<br />
United Kingdom. Second, ripple teleswitches, or<br />
"ripple controllers," are used widely in Austria,<br />
France, and West Germany; they use the electricity<br />
supply grid as the transmission medium.<br />
Except for the front-end receiving circuitry,<br />
the semiconductor contents for radio and ripple<br />
teleswitches are similar. Dataquest's estimation for<br />
the semiconductor content of a radio teleswitch is<br />
shown in Table 2. The major components are a<br />
radio-frequency preamplifier IC, a switch capacitor<br />
filter/data decoder ASIC, and an 8-bit MCU. We<br />
(HWSOTO 51989 Dataquest Incorporated October-Reproduction Prohibited<br />
ESAM Volume II. Newsletters 1989-19
DOMESTIC METERING: THE MARKET IN EUROPE<br />
TABLE 2<br />
Estimated Semiconductor Content for an Electronic Meter and Teleswitch<br />
Function<br />
8-Bit MicnxxntiDUer widi LCD<br />
Connolter<br />
1-Kbit EEFROM<br />
Analog Power Multi{dier anid frequency<br />
Conversian<br />
Discrnes<br />
Total Semiconductor CcHUent<br />
Average Selling Price<br />
I/O Rado<br />
F^inctioQ<br />
8-Bit MioDoomroUer<br />
RF Front-End/Reamplifier<br />
Reoeiver/Filter/Deooder<br />
Disoetes (Relay DnveR &. LED)<br />
Total Semiamductor Ccnuent<br />
Average Selling Price<br />
I/O Ratio<br />
Elednnic Meter (Wldi LCD Display)<br />
IMuioiogy<br />
Stanlaid CMOS<br />
Standanl NMOS<br />
Linear CMOS ASIC<br />
Bipolar<br />
Tuiir Teieswitdi*<br />
l^chnolDgy<br />
Staiviaid CMOS<br />
Analog ASIC bipolar<br />
Analog/digital ASIC CMOS<br />
Mixed<br />
Cost<br />
$4.00<br />
0.65<br />
3i0<br />
0.80<br />
$ 8.95<br />
$42.00<br />
21.3%<br />
Cost<br />
$4.00<br />
3.00<br />
5i0<br />
0.90<br />
$13.40<br />
S60.00<br />
•Content estimated for U.K. 198-kHz radio tcieswitch Source: Dataquest<br />
October 1989<br />
estimate the semiconductor content of these units to<br />
be $13.40, which is 22 percent of an average<br />
selling price of $60.00.<br />
At present, most teleswitches are designed to<br />
complement double-rate Ferraris disk meters,<br />
which are less expensive to supply than electronic<br />
versions. As Table 2 indicates, there is a significant<br />
scope for the combination of meters and teleswitches<br />
into one unit, allowing sharing of the<br />
same MCU and integration of the ASIC fiinctions<br />
onto one IC.<br />
Market Analysis<br />
Table 3 shows the major companies that have<br />
commenced domesdc electronic metering equipment<br />
manufacture in Europe. In addition, many<br />
smaller national suppliers of conventional meters<br />
are developing electronic versions too.<br />
By region, France and the United Kingdom<br />
currently lead Europe in domestic electronic meter<br />
implementation. The public utility Electiicite de<br />
S>IV89 Duaquesi Incorporated October-Reproduction Prohibited<br />
ESAM Volume (I, Newslctlen 1989-19<br />
22.3%<br />
France (EDF) is the most ambitious, with plans to<br />
build its initial trial of 90,000 electronic meters<br />
(supplied by Sauter and Schlumberger) to full electronic<br />
metering across all of France by 1995.<br />
In 1989, Dataquest estimates that only<br />
330,000 electronic meters will be sold out of<br />
7.4 million meters shipped to Europe each year.<br />
Most of these units are electronic budget meters<br />
that replace vulnerable coin meters in the United<br />
Kingdom. By 1994, we expect electronic meters to<br />
account for 40 percent of all meters shipped.<br />
This year, we estimate that 1.1 million<br />
teleswitch units will be fitted in Europe. Of these,<br />
430,000 are radio versions for use in the United<br />
Kingdom and the rest are ripple controllers going<br />
mainly to France, West Germany, and Austria.<br />
We predict that this volume of teleswitch shipments<br />
will have risen to 4.1 million units within five<br />
years; one-half of these units will be integrated<br />
with an electronic electricity measurement<br />
function.<br />
0003070
TABLE 3<br />
Key Electronic Electricity Meter Suppliers<br />
Company<br />
AEG<br />
GEC Meters<br />
Landis & Gyr<br />
Sauler<br />
Schlumbeiger<br />
Siemens<br />
Ibwn<br />
Hamdn<br />
Stem<br />
Acton<br />
Figure 2 shows Dataquest's estimate for semiconductors<br />
consumed in domestic electronic electricity<br />
meters and teleswitches in Europe. We estimate<br />
this market to be worth $18 million in 1989,<br />
rising to $75 million by 1994, a 32 percent CAGR.<br />
MIXED PROSPECTS FOR WATER METERS<br />
Telfoid<br />
Irankfiiit<br />
Zug<br />
Mulhouse<br />
Fslixstowe<br />
Poitiers<br />
Chasseneuil<br />
Vienna<br />
Although no electronics are used in water<br />
meters, electronic encoders can be connected to<br />
them to allow fast transmission of water usage data<br />
to meter reading personnel. The major suppliers of<br />
these encoders in Europe are Kent (ASEA Brown<br />
Boveri) and Neptune (Schlumberger).<br />
Except for the United Kingdom, where very<br />
few domestic water meters currently are used,<br />
meters are installed in each of Europe's 120 million<br />
households. Dataquest estimates that 7.6 million<br />
new meters will be fitted in Europe this year, rising<br />
to 8.9 million units by 1994. The increasing<br />
demand is due largely to the privatization of the<br />
water industry in the United Kingdom, where rapid<br />
demand is expected. We estimate that only<br />
0.13 percent of these shipments will be fitted with<br />
encoders this year, resulting in semiconductor consumption<br />
of only $60,000. Of the several water<br />
authorities we contacted in Europe, none will be<br />
prepared to fit electronic meters for a few years, for<br />
the following reasons:<br />
• Cost—With a selling price of $60, encoders<br />
presendy cost many times more than the $20 for<br />
Qdham<br />
Nunembuiig<br />
DOMESTIC METERING: THE MARKET IN EUROPE<br />
Country<br />
>\fest Gennany<br />
England<br />
Engiaid<br />
England<br />
>\fest Gennany<br />
Switzeiiand<br />
France<br />
England<br />
France<br />
France<br />
Ausoia<br />
England<br />
>\fest Gennany<br />
Source: Daiaquesi<br />
October 1989<br />
the meters themselves, thus making manual<br />
reading more attractive.<br />
• Power availability-Batteries are a common solution,<br />
but their lifetimes (10 to 12 years) and<br />
reliability are unacceptably low.<br />
• Industry standards—Industry standards for<br />
encoder transmission techniques are lacking.<br />
As encoder prices fall compared with the cost<br />
of labor, this situadon will change. Assuming that<br />
one in five water meters will have encoders in<br />
1994, we estimate the European semiconductor<br />
market to be $6.2 million in 1994. This market is<br />
small compared with the demand for semiconductors<br />
in domestic electricity metering.<br />
ELECTRIFIED GAS?<br />
Conventional mechanical bellows gas meters<br />
are bulky and inaccurate. At $60 each, they also are<br />
far more expensive than their electricity or water<br />
counterparts.<br />
Limited electronic meter trials are under way<br />
in West Germany. However, inexpensive electronic<br />
versions are not currently available. Research and<br />
development is under way, some of it fiinded by<br />
the utility companies themselves. The major companies<br />
involved are Ferranti Meters Limited (Siemens),<br />
Sauter, and Schlumberger.<br />
Of the utility companies we contacted, none<br />
expect electronic gas meters to be widely used for<br />
(KKISOTO ^1989 Daiaqucst Incorporated October-Reproduction Prohibited<br />
ESAM Volume II, Newsletters 1989-19
DOMESTIC METERING: THE MARKET IN EUROPE<br />
FIGURE 2<br />
Semiconductor Consumption Forecast for Electronic Electricity Meters in Europe (1989-lS^)<br />
Millions of Dollars<br />
80-<br />
70-<br />
60-<br />
50<br />
40<br />
30<br />
20-<br />
10-<br />
0005070-2<br />
^B Electronic Meters<br />
KXl Teleswltchsfl<br />
$18.3<br />
$23.5<br />
$28.4<br />
X\\V''<br />
$41.7<br />
h . \ \ \ . ,<br />
wi<br />
^S
DataQuest<br />
aaMTipanyof<br />
ThcDunSTBradsti ticet Corporation<br />
Research Newsletter<br />
SUMMARY<br />
THE EUROPEAN PC HOME MARKET:<br />
AN UNKNOWN POTENTIAL<br />
ESAM Code: Newsletters<br />
1989-18<br />
0002383<br />
The home market for microcomputers is often associated with fringe activities such as<br />
family entertainment and hobbyist usage. But with growth rates in the business market<br />
expected to flatten out over the next few years, an increasing number of PC vendors,<br />
including IBM, are taking the home market seriously. Throughout Europe, shipments to the<br />
home market currentiy account for one quarter of all PCs shipped. However, a more<br />
significant statistic is that current household penetration rates are low, attaining less than<br />
5 percent in even the most developed home markets. This means that the potential of the<br />
equivalent home market is still far from being fully exploited when compared with the<br />
European business markets. In this respect, it is interesting to look at the penetration of<br />
PCs into U.S. households; Dataquest estimates that, in 1988, the U.S. penetration was<br />
around 15 percent.<br />
In this newsletter, the home market is defined as the sum total of PCs purchased by<br />
individuals rather than by corporate or other legal entities. The basic distinctive criterion<br />
for the home market is therefore "who pays for the PC." This implies that the distinction<br />
is not at all related to product characteristics of the hardware acquired. In defining a PC,<br />
Dataquest only considers fully functional PC models sold with a central processing unit,<br />
keyboard, display monitor and with at least one internal floppy disk drive, costing US$600<br />
or more, exclusive of value-added tax. This definition excludes the dedicated word<br />
processors, low-performance 8-bit PCs and games consoles currentiy sold to home users by<br />
vendors such as Amstrad, Atari, Commodore and Nintendo.<br />
© 1989 Dataquest U.K. Limited September—Reproduction Prohibited<br />
The content cfthis report represents our interpretation and analysis of information generally available to the public or released by responsible individuals in the subject companies, but<br />
is not guaranteed as to accuracy or completeness. It does not contain material provided to us in confidence by our clients Individual companies reported on and analyzed by Dataquest<br />
may be clients of this and/or other Dataquest services. This infimnation is not furnished in connection with a sale or offer to sell securities or in connection with the solicitation of an<br />
qffir to buy securities. This firm and its parent and/or their cfficers, stockholders, or members of their fimtities may, from time to time, have a long or short position in the securities<br />
mentioned and may sell or buy such securities<br />
Dataquest Incorporated, 1290 Ridder Park Drive, San Jose, CA 95131-2398 / (408) 437-8000 / Telex 171973 / Fax (408) 437-0292
CHARACTERISTICS OF THE HOME MARKET<br />
Price-Driven with Special Requirements<br />
Home users traditionally have more limited budgets and tend to be far more price<br />
sensitive than business users when it comes to buying personal computers. However, price<br />
is not the only deciding factor. In certain respects, such as a machine's graphical and<br />
musical capabilities, home users are very demanding and have very specific requirements.<br />
Vendors such as Atari and Commodore were quick to recognize the fact, and developed<br />
PCs that provided fairly sophisticated graphics and sound capabilities at a modest price.<br />
Amstrad's PCs are successful because they provided IBM compatibility at a low price. But<br />
the PC1512's integral design and the bundling of inexpensive, cut-down versions of<br />
professional software were also imponant factors.<br />
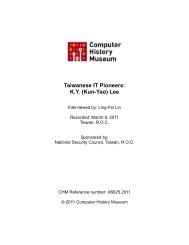
Figiue 1 shows the business/home breakdown of the European market and Figure 2<br />
shows the percentage penetration of PCs into European households.<br />
Increasingly Sophisticated Applications<br />
Home users have always differed from business users in terms of their needs and their<br />
motivation for buying a PC. Businesses purchase PCs to increase their competitive edge,<br />
either by computerizing individual tasks or by installing more encompassing management<br />
tools. Home users typically buy for yet another set of reasons, which now stretches well<br />
beyond the traditional leisure and hobbyist activities. Currendy, the basic application for<br />
PCs within households is still the home/hobbyist application. However, educational or<br />
instructional usages, as well as "household productivity or commercial" applications, are<br />
gaining in importance.<br />
Educational applications include both the more sedentary education activities usually<br />
associated with parents and their children, and the more specialized activities of students.<br />
Of these, the student "home campus" market is cuirentiy the most developed and<br />
sophisticated. Students are also the most mobile members of the educational population. As<br />
laptops become smaller and lighter, and as more vendors introduce IBM-compatible<br />
notepad-size PCs and "palmtops," students are likely to become a major driving force in<br />
the development of this lightweight PC market. However, a major price/performance issue<br />
still needs to be solved by the laptop vendors before laptops become really successful in<br />
the student market<br />
© 1989 Dataquest U.K. Limited September ESAM<br />
0002383
ESAM<br />
0002383<br />
Parcemoea<br />
100% f<br />
Figure 1<br />
European 1988 PC Market<br />
Estimated Breakdown by Market Sector<br />
W.G. N*tlwi1tndt S«ia. U.K. Frm» B«l>um It^ SH" Sewid. Otlnn<br />
H i Home iSSSa Business<br />
Figure 2<br />
European 1988 PC Market<br />
Estimated Penetration of Households by Country<br />
2 3<br />
Percentage<br />
1989 Dataquest U.K. Limited September<br />
Source: Dataquest<br />
September 1989<br />
Source: Dataquest<br />
September 1989
In the past, using computers to work at home was limited to executives and the<br />
professions, but more and more employees are now taking work home, and a small but<br />
growing number of employees actually work at home. Links between the office and the<br />
"home office" are thus likely to become much more widespread with die development of<br />
networking and communications in workplaces, and as these home-to-work links become<br />
effective and affordable. With job mobility also tending to increase and employees having<br />
to learn new work skills, home-based computerized adult education is also likely to<br />
experience renewed growth. This formal instruction dimension also seems a prerequisite for<br />
the success of joint employer-employee financed schemes such as tiie Private Computer<br />
Projects which, altiiough they have become a major driving force of die Dutch PC market,<br />
are increasingly criticized for their lack of effectiveness. Without appropriate software and<br />
a high level of formalized training, many of these PCs are collecting dust in cupboards.<br />
The commercial applications in the home market are likely to assume significant<br />
proportions in the coming years. The scope of this market ranges from traditional uses,<br />
such as word processing, accounting and filing, to the integrated computerization of homes'<br />
The French have termed this latter concept "Domotique." It entails cabling houses and<br />
apartment blocks during their construction to allow for die computerized control of heating,<br />
lighting, security systems, and audio/visual and kitchen appliances. No reference point<br />
exists at present and die market is wide open.<br />
Figure 3 shows 1988 shipments in the European market by both product type and<br />
application.<br />
Non Comp.$2000 5.2% '^^^^^^^^k / Commercial 16.5%<br />
Education 34.5%<br />
Total 1988 Market Total 1988 Market<br />
1.2 Million Units 1.2 Million Units<br />
Source: Dataquest<br />
September 1989<br />
1989 Dataquest U.K. Limited September ESAM<br />
0002383
Which Computer?<br />
The computers purchased by home users are strongly influenced by their previous<br />
experience with computers, either in the classroom, at their workplace or at their home<br />
with a game/hobbyist machine. Thus, IBM compatibility is almost a prerequisite for most<br />
employees wishing to work at home, while non-compatible machines tend to predominate<br />
where PCs are used in a strictiy family environment.<br />
PCs bought by home users are also becoming more high powered. Already, certain<br />
long-established vendors of home computers, such as the British vendor Acorn, have<br />
introduced highly sophisticated models equipped with RISC processors. Low-cost UNIX<br />
workstations are also on the horizon. As in the business market, the availability of<br />
increasingly powerful hardware, including hardware based on the Intel family, is one of the<br />
driving forces of the home market. If the percentage for PC penetration in the home<br />
market is really to increase, the hardware needs to become considerably more user-friendly,<br />
and with better performance, than at present. Both requirements—user-friendliness and pure<br />
performance—can only be met by more powerful processors, allowing really sophisticated<br />
applications to be run, such as the previously mentioned Domotique applications. Current<br />
pricing will initially limit the market for such models to the more elitist and affluent<br />
"power users," but prices are expected to drop and highly user-friendly and powerful PCs<br />
will become available for even the most computer-illiterate households.<br />
Expensive Entry Tickets in Promotion and Distribution<br />
The home market is characterized by its high barriers for entry, which make it difficult<br />
for any newcomer to this market to acquire a market share that really challenges the<br />
current market leaders. The sheer investment in marketing and promotion in order to build<br />
up a market presence, and the resources involved in the development of services and other<br />
complementary activities around the PC hardware, are all factors adding to the high barriers<br />
for entry in the home market Most established home vendors are deeply involved in the<br />
area of software, and support user clubs, dedicated brand-oriented magazines, and so on.<br />
Additionally, the research and development (R&D) costs involved in the supply of a<br />
challenging and complete product line are high and prohibitive for many potential<br />
newcomers.<br />
Another significant entry barrier is the structure of the distribution channels for the<br />
home market. The home segment is typically supplied by non-dedicated PC dealers, such<br />
as the various kinds of mass merchandisers—-department stores, hypermarkets and cash and<br />
carry stores—hi-fi and video shops, and stationery stores. These home market dealers tend<br />
to have a highly concentrated structure, and are mainly controlled by large chains or a<br />
purchasing group. It is therefore critical to get shelf space among the relatively few<br />
companies that control a large proportion of the home market at the retail level. At the<br />
same time, mass merchandisers that sell PCs are very selective and arc willing to sell only<br />
a restricted number of strong and potentially best-selling brands. Examples of these mass<br />
merchandisers are Auchan, FNAC and NASA in France; Dixons in the United Kingdom;<br />
ESAM © 1989 Dataquest U.K. Limited September 5<br />
0002383
El Corte Inglds in Spain; Vroom & Dreesmann in the Netherlands; Bilka in Denmark; and<br />
Kaufhof in West Germany.<br />
Specialist Vendors Dominate the Market<br />
Largely as a result of the importance of these entry barriers, the competitive situation<br />
on the home market is one of extreme concentration. In 1988 three vendors, Atari,<br />
Commodore and Amstrad, had a combined market share of close to 70 percent. This<br />
almost oligopolistic nature of the home market contrasts sharply with the structure of the<br />
1988 business market, where 11 vendors accounted for not more than 60 percent of total<br />
sales. Figure 4 shows the percentage market shares in terms of shipments of the main<br />
vendors in both 1987 and 1988.<br />
Figure 4<br />
European PC Home Market<br />
1987 and 1988 Shipments by Vendor<br />
J t* "--..^^ Amstrad<br />
Commodore ^ ^ ^<br />
23.2%<br />
Total 1987 Market<br />
767,340 Units<br />
T.m^<br />
Commodore<br />
23.4%<br />
Total 1988 Market<br />
1,2 Million Units<br />
others<br />
Source: Dataquest<br />
September 1989<br />
The three leading vendors in the home market are companies that are highly specialized<br />
toward, and with a background in, consumer-electronics products. Cuirentiy, tiieir<br />
specialization is also reflected in the fact that a high proportion of tiieir business is done<br />
on tiie home market, witii sales to the business market accounting for a relatively low<br />
proportion of their total sales.<br />
1989 Dataquest U.K. Limited September ESAM<br />
0002383
Atari, which became the number one supplier to the home market in 1988, is the best<br />
example of this. In 1988, 83 percent of all Atari sales went into the home market. As far<br />
as sales to the business maricet are concerned, Atari, follows an approach very much<br />
oriented to niche markets, where it specializes in the MIDI (musical instrument digital<br />
interface) and multimedia markets (such as desktop video, Q)-ROM and animation).<br />
Interestingly, several of the home-market vendors have currendy embarked on a strategy<br />
to move upmarket, and are planning to take a greater share of the business market; the<br />
best examples are Amstrad, with a new strategy based on its P200 range, and Commodore,<br />
which has recruited several top executives from Apple, Hewlett-Packard, Olivetti and<br />
Compaq in the past year. However, it remains to be seen whether a highly developed home<br />
image jeopardizes sales to the business market, or whether the home-market vendors can<br />
remain competitive through the high-margin professional dealer outiets.<br />
Despite the structural difficulties in challenging the position of the leading vendors on<br />
the home market, it is possible that several high-end vendors will take a share of the home<br />
market, and that companies with strong R&D and mass-merchandising muscle, such as<br />
Philips and Olivetti, will increase their stake in this market.<br />
DATAQUEST ANALYSIS<br />
In view of the many uncertainties about product development, applications and market<br />
entrants affecting the development of the home market, it is difficult to predict how far this<br />
market will increase. However, the sheer number of households in Europe (124 million),<br />
combined with the still very low penetration figures, shows that there is probably a large<br />
potential market waiting to be developed.<br />
(This document was first published in European Monitor, August, 1989.)<br />
ESAM © 1989 Dataquest U.K. Limited September<br />
0002383<br />
Brian Pearce<br />
Kees Dobbelaar<br />
Bipin Parmar
mm^ J>ataQuest<br />
/'•''•••''.-'^"\!''':'r m o "
However, although there can be little doubt that digital networks will be successful<br />
in the longer term, there are some factors which, in the short term, could slow the initial<br />
adoption of the new technology.<br />
Current Networks<br />
Cellular networks in Europe currently conform to many standards, but this has not<br />
prevented a substantial growth in the subscriber base over the last four years. Indeed, in<br />
many of the continental European countries where initial growth was rather slow, more<br />
recent statistics show that growth rates are accelerating,<br />
At present growth rates, the installed base of analog system subscribers could<br />
approach 5 million by 1992. Historically, estimates of cellular growth have tended to be<br />
conservative, so it is clear that, by 1992, there will be a significant number of users<br />
employing analog technology.<br />
IMPLEMENTATION OF DIGITAL NETWORKS<br />
One of the major factors that has governed the growth of cellular radio is believed<br />
to have been the large latent demand for widespread, economic mobile communications.<br />
Some may regard current cellular technology as far from economic. However, it is<br />
significantly less expensive—and more widespread—than the systems that preceded it.<br />
Much of this latent demand has been satisfied by the analog networks and therefore will<br />
not be present to provide an impetus to the digital system, except in those countries<br />
where networks are very small.<br />
Additionally, the growth rate experienced by the analog systems was in an<br />
environment of no competing technologies, A digital cellular system will not have this<br />
luxury and will have to compete in the marketplace on its own merits as would any other<br />
product or service. Consequently, it must be perceived by the customer to offer an<br />
advantage in price and performance over existing systems; specifically, improved<br />
performance at a lower price.<br />
This particular requirement presents the network operators with something of a<br />
dilemma; that between earning a good return on investment in the now-mature analog<br />
system and at the same time promoting a technologically superior product that initially<br />
will show a lower return.<br />
Similarly, the customer has also made an investment in purchasing and subscribing<br />
to the analog network. Only in a few cases will this equipment be discarded prior to its<br />
normal life expectancy simply to change network technology. In cases where mobile<br />
equipment is leased, the lessor could have significant funds invested in equipment that<br />
possibly relies on one- to three-year leasing contracts to recover that investment.<br />
There is no financial incentive to change that installed base until such time as those<br />
leasing agreements expire. There is a real possibility that as the introduction of digital<br />
networks approaches, the resale value of leased mobile equipment could tend toward<br />
zero.<br />
© 1989 Dataquest Incorporated July ESAM Newsletter
Y<br />
Moreover, in the early days of a digital cellular system, its coverage will not be as<br />
widespread as the existing analog system. This could be a major delaying factor for<br />
those users wishing to adopt digital technology.<br />
Another factor in the dynamics equation is the appearance of new operators building<br />
, and operating a competing network infrastructure. A new operator would have to install<br />
a digital network from scratch. Initially, there would be no disadvantage in this respect<br />
as other licensed digital operators would also have to install their networks. However,<br />
there would still be competition from the existing analog system operators (some or all<br />
of whom might also be digital operators).<br />
As yet, there has been no significant downward pressure on air-time charges on the<br />
analog networks. Faced with attempts from the new digital operators to establish their<br />
place in the market, there could well be room for analog operators to cut tariffs on their<br />
networks to a level at which the digital operators, with their heavy investment costs and<br />
initially smaller subscriber base, would find it extremely difficult to compete. It could<br />
be possible, therefore, without some form of regulation, for current operators (which will<br />
themselves move to digital) to inhibit competition in new networks at an early stage.<br />
Digital cellular radio could also experience competition from other emerging<br />
technologies—a problem that analog systems did not experience. In particular, the<br />
emergence of CT2 cordless telephones, together with the deployment of "phone-point" or<br />
"zone-phone" public cordless services, could impinge on users who are unsure as to<br />
whether they really need the level of flexibility that cellular radio offers. It is too early<br />
in the development of CT2 to analyze its impact. At present, Dataquest believes that<br />
CT2 and cellular technologies will be initially largely complementary rather than<br />
competitive.<br />
Although all of the foregoing factors will affect the development of digital cellular<br />
networks, probably the most significant will be the quality of service provided by the<br />
analog networks in three years' time. Already during peak hours in the densely populated<br />
(in cellular terms) Southeast England, there are signs that the networks cannot cope and<br />
users are complaining of poor transmission quality, dropped calls, and interference from<br />
other calls in progress.<br />
With an increasing number of users subscribing to the service and the frequency<br />
spectrum becoming fully utilized, network operators will find it increasingly difficult to<br />
overcome these problems. If this scenario does occur when digital systems become<br />
available, it is possible that discontented users will switch to the new system. However,<br />
this mechanism could be self-limiting, because as the number of subscribers on the<br />
analog network decreases, the quality of service will begin to improve, removing the<br />
need to switch networks.<br />
ESAM Newsletter © 1989 Dataquest Incorporated July
DATAQUEST CONCLUSIONS<br />
The assertion that digital cellular technology will be successful still holds true for<br />
the longer term. However, this newsletter has aimed to demonstrate that the mechanics<br />
of the marketplace are not as simple and straightforward as when analog systems were<br />
launched. As a result, the available choice could well confuse both existing and potential<br />
customers. This could cause them to defer making a decision until the new networks<br />
have proven themselves capable of offering an improved solution.<br />
(This document is reprinted with the permission of Dataquest's European<br />
Telecommunications Industry Service.)<br />
Jim Eastlake<br />
Ted Richardson<br />
© 1989 Dataquest Incorporated July ESAM Newsletter<br />
V
Si^^ Dataoyest<br />
mi^,<br />
M^i^^^P<br />
"" ' ' VJ.^^L'li^-t.^",<br />
' " " ^ • ' . ^ ^ ^<br />
i acompanyof<br />
) llieDunliBraaslreetCiHparation<br />
Research Newsletter<br />
INTRODUCTION<br />
ESAM Code: Volume II Newsletters<br />
1989-16<br />
0004613<br />
PARXn<br />
CELLULAR RADIO IN EUROPE—GROWING INTO THE FUTURE<br />
This is the second newsletter in an initial series of three about cellular radio. These<br />
newsletters are entitled:<br />
Part I: Cellular Radio—Its History and Principles<br />
Part II: Cellular Radio in Europe—Growing into the Future<br />
• Part III: Digital Cellular Radio—The Market Forces<br />
The first in the series deals with the principles of operation of this exciting<br />
communications medium. This newsletter reviews the growth in the European market<br />
for cellular radio, and the reasons and factors for its success and forthcoming<br />
development. The third newsletter reviews the possible market dynamics that could<br />
interact when digital networks are deployed in the early 1990s.<br />
BACKGROUND<br />
Cellular radio began in earnest in Europe as recently as October 1981, when Sweden<br />
launched its NMT-450 system. By the following March, the system was available<br />
throughout Scandinavia. The new medium experienced spectacular growth, reaching a<br />
level of 100,000 subscribers in just three years (see Figure 1: Scandinavian Cellular<br />
Market).<br />
In January 1985, the United Kingdom launched its two networks (three months ahead<br />
of schedule). Demand for the service was huge, exceeding even the operators' optimistic<br />
forecasts (see Figure 2: United Kingdom Cellular Market). Since then, many European<br />
countries have launched cellular radio networks. However, due to proprietary system<br />
designs and available spectrum in each of the individual countries, most of the systems<br />
are incompatible and do not permit country-to-country mobile roaming. The exceptions<br />
are the Nordic countries (Denmark, Finland, Norway and Sweden) who all adopted the<br />
same system, thereby allowing a mobile to be used in each of the four countries. Table 1<br />
shows the systems operated in some of the major European countries.<br />
© 1989 Dataquest Incorporated July—Reproduction Prohibited<br />
77K amiem of this report represents our interpretation and amlysis cfinfjrmnlion generally available to the public or released by responsible individuals in the subject companies, but<br />
is not guaranteed as to accuracy or completeness It does not contain material provided to us in confidence by our clierus Individual companies reported on and analysed by Dataquest<br />
may be dients if this and/or other Dataquest services. This irtfimiation is notfiimished in connection with a sale or qgir to sell securities or in connection mth the solicitation cfan<br />
Offir to buy securities. TUs firm and its parent and/or their cfficers. stockholders, or members of their fiimilies may, fiom time to lime, have a long or short position in the securities<br />
mentioned and may sell or buy such securities.<br />
Dataquest Incorporated, 1290 Ridder Park Drive, San Jose, CA 95131-2398 / (408) 437-8000 / Telex 171973 / Fax (408) 437-0292
1,200<br />
1,000<br />
800<br />
600<br />
400<br />
200<br />
0004613-1<br />
1,400<br />
1.200<br />
1,000<br />
800<br />
600 h<br />
400<br />
200<br />
0<br />
0004613-2<br />
Thousands<br />
i ^ Subscribers<br />
Figure 1<br />
Scandinavian Cellular Market 1982-1992<br />
i ^<br />
E^-v,;?*<br />
1982 1983 1984 1985 M<br />
Thousands<br />
- mH Subscribers<br />
1985<br />
i^'^^M<br />
^^<br />
i.^><br />
^:<br />
Figure 2<br />
p'v:m<br />
1987 1968 1989 1990 1991 1992<br />
United Kingdom Cellular Market 1985-1992<br />
^m<br />
I !<br />
fe.. •"•'f^<br />
w<br />
^i^wh<br />
Mm<br />
1986 1987 1988 1989 1990 1991<br />
Source: Dataquest<br />
July 1989<br />
!%&*!<br />
1992<br />
Source: Dataquest<br />
July 1989<br />
© 1989 Dataquest Incorporated July ESAM Newsletter
Market Structure<br />
Austria<br />
Denmark<br />
Finland<br />
France<br />
Ireland<br />
Italy<br />
Netherlands<br />
Norway<br />
Spain<br />
Sweden<br />
West Germany<br />
United Kingdom<br />
Table 1<br />
Systems in Operatirais Across Europe<br />
NMT-450<br />
NMT-450/900<br />
NMT-450/900<br />
RC2000 (quasi-cellular)<br />
TAGS<br />
RTMS (quasi-cellular)<br />
NMT-450<br />
NMT-450/900<br />
NMT-450<br />
NMT-450/900<br />
C-450<br />
TAGS (and ETAGS)<br />
Source: Dataquest<br />
July 1989<br />
In common with traditional telecommunications networks, cellular radio in most<br />
European countries is run by the Post, Telegraph and Telephone organizations (PTTs) on a<br />
monopoly basis. The main exception is the United Kingdom, where two network<br />
operators compete for market penetration. There is also limited competition in Sweden.<br />
France has licensed a second cellular radio operator whose NMT-450 network was<br />
scheduled to begin service in March 1989.<br />
ESAM Newsletter © 1989 Dataquest Incorporated July
COMPETITIVE ENVIRONMENT IN THE UNITED KINGDOM<br />
It is significant that the U.K. market has shown the most prolific growth in its<br />
subscriber base as well as the greatest price erosion of mobile telephone handsets. Rapid<br />
growth has been experienced for several reasons:<br />
• There was an immense latent demand for an accessible mobile service.<br />
• The economic climate was fostering economic growth, mindful of<br />
ever-improving efficiency.<br />
• Two network operators were able to cope with high demand whereas one may<br />
have been overwhelmed, with resultant waiting lists (which in turn may have<br />
stifled demand).<br />
• . Competition was growing.<br />
The provision of cellular services in the United Kingdom is based on a hierarchical<br />
structure. Under the terms of their licenses, Racal Vodaphone and Cellnet are not<br />
permitted to sell equipment directly to the end user. This has caused the growth of a<br />
competitive infrastructure of retailers and dealers, who also sell the air-time on the<br />
network and provide the necessary billing services.<br />
These dealers and retailers have been operating in an environment that has become<br />
increasingly fierce, to the benefit of customers but to the detriment of some retailers.<br />
The first move came when some retailers started to discount mobile telephone sets in an<br />
attempt to establish and increase their market share. Over the last two years, this has<br />
continued to such an extent that it is believed that some retailers are earning no revenue<br />
from the sale of equipment, but are instead relying on the sale of air-time for their<br />
revenue. This discounting has been partly offset by bonuses that network operators pay<br />
to the retailers for each new subscriber they connect to the network.<br />
Air-time to retailers is sold at a discounted rate compared to that which the end<br />
user pays, so that a margin is present from which the retailer can earn revenue. The<br />
greater the number of subscribers a retailer has, the larger is the discount received from<br />
the network provider. Clearly, this system benefits the larger retailers, who thus have a<br />
greater overall margin than their smaller competitors. This in turn exerts pressure on<br />
the smaller retailers to supply the mobile equipment itself at competitive prices.<br />
Consequently, we believe only retailers with a sufficiently large subscriber base are<br />
likely to survive in the longer term. Approximately 65 retailers operate in the United<br />
Kingdom today; it is possible that as few as 15 will survive in their present form over the<br />
next two years.<br />
© 1989 Dataquest Incorporated July ESAM Newsletter
The Market in Mainland Europe<br />
With the exception of Scandinavia, initial growth on most of the national cellular<br />
networks in Europe was relatively slow. However, more interest has been aroused<br />
recently, and the growth in the subscriber base has increased.<br />
We believe that this previous lack of interest was due to the high cost of subscribing<br />
to the system, the shortage of suppliers of the service, slow growth in the area covered<br />
by the system, and the absence of competition.<br />
THE FUTURE<br />
Currently all operating networks use analog transmission technology and each type<br />
of system is incompatible with others. Consequently, subscribers are limited to using<br />
their mobile only in their own country.<br />
This shortcoming should be overcome with the introduction of second-generation<br />
digital cellular technology in 1991, implementing a common standard throughout Europe.<br />
The drive behind the "pan-European digital cellular system" is motivated by several<br />
reasons:<br />
To permit Europe-wide cellular usage.<br />
Common standards enable a single technology, and therefore economies of<br />
scale, to be achieved.<br />
To provide the first real example of Europe-wide telecommunications<br />
cooperation.<br />
To provide European industry with a technological lead in mobile systems over<br />
the rest of the world.<br />
Digital technology permits greater utilization of available bandwidth (by a<br />
factor of between 2.5 and 5).<br />
Enhancements providing new features/services would be easier with a digital<br />
system.<br />
To provide higher-quality service.<br />
Certainly, this international co-operation in largely agreeing standards in just under<br />
two years fulfills the promise that the pan-European digital system can become a<br />
successful reality.<br />
ESAM Newsletter<br />
© 1989 Dataquest Incorporated July
However, having overcome the technical and logistical problems of a digital system,<br />
the next hurdle for the network operators will be a commercial one. They will be in the<br />
position of operating two networks with different characteristics:<br />
• An analog network with wide coverage and a large subscriber base<br />
• A digital network with low coverage and few subscribers.<br />
The challenge for the operators is to manage successfully the transition from analog<br />
to digital system.<br />
DATAQUEST ANALYSIS<br />
Cellular radio has become firmly established across Europe as an indispensable<br />
communications medium. Dataquest believes that current trends indicate continued<br />
strong growth in the subscriber base well into the 1990s.<br />
Although the United Kingdom has experienced severe price erosion of radio<br />
telephone handsets, the prices throughout the rest of Europe are still relatively high.<br />
Increased growth in the subscriber base should enable manufacturers to improve<br />
manufacturing efficiency, and reduce the prices of mobile equipment. Dataquest also<br />
believes that there is room for suppliers of end-user equipment to reduce margins per<br />
unit, and increase revenues from the larger volumes that should result.<br />
The introduction of digital networks in 1991 will produce additional challenges for<br />
equipment suppliers and network operators. Dataquest believes the advent of<br />
competition in network operation will be of benefit to all parties, since prices will fall<br />
and demand will rise. The additional features offered by a digital system should greatly<br />
enhance its utility to current and future users of mobile technology.<br />
However, we do envisage some transient problems during the introductory period.<br />
This topic is discussed in the third newsletter in the series about cellular radio.<br />
(This document is reprinted with the permission of Dataquest's European<br />
Telecommunications Inudstry Service.)<br />
Jim Eastlake<br />
Ted Richardson<br />
© 1989 Dataquest Incorporated July ESAM Newsletter
Dataqyest<br />
I acomiKinyof<br />
I ThcDun&BradsticctCcMporation<br />
Research Newsletter<br />
INTRODUCTION<br />
ESAM Code: Volume II Newsletters<br />
1989-15<br />
0004614<br />
PARTI<br />
CELLULAR RADIO—ITS HISTORY AND PRINCIPLES<br />
Cellular radio has been operating for just seven years in Europe and in that time has<br />
experienced tremendous growth which at present shows no sign of slowing down. This<br />
newsletter is the first in a series of three newsletters about cellular radio. These<br />
newsletters are entitled:<br />
• Part I: Cellular Radio—Its History and Principles<br />
• Part II: Cellular Radio in Europe—Growing into the Future<br />
• Part III: Digital Cellular Radio—The Market Forces<br />
This newsletter reviews the history and principles of this communication medium.<br />
The second newsletter reviews the current European market and its short-term prospects,<br />
while the third newsletter takes a longer-term view and discusses the prospects for the<br />
pan-European digital cellular network.<br />
PRINCIPLES OF CELLULAR RADIO<br />
Although the main idea for a "cellular" radio system originated in the Bell Telephone<br />
Laboratories in 1947, it was not until the early 1980s that technology made the first<br />
systems practicable. The main advantage of a cellular system over conventional mobile<br />
radio systems is its ability to handle a wider range of traffic loading through a more<br />
efficient reuse of available frequency spectrum. Ultimately cellular systems cater for<br />
considerably more customers than the earlier, traditional mobile radio systems.<br />
Cell Structure<br />
The area required to be covered is split into a number of smaller areas (cells). Each<br />
cell is equipped with its own radio base station. The cells are arranged together into<br />
clusters, the available number of radio channels being allocated to the clusters in a<br />
regular pattern that repeats over the entire coverage area. This technique enables radio<br />
channels to be reused several times throughout the coverage area.<br />
The number of cells in a cluster has to be chosen such that the clusters fit together<br />
into a continuous area. Only certain configurations do this. Typical cluster arrangements<br />
are based on 4, 7, 12, or 21 cells (see Figure 1).<br />
© 1989 Dataquest Incorporated July—Reproduction Prohibited<br />
77K comem of this report represenls our imerpreuttion and analysis c^infirmatkm generally amilabk lo the public or released by responsible individuals m the subject companies, but<br />
is not guaranteed as to accuracy or completeness It does not contain material provided to us in coiffidence by our clients. Individual companies reported on and analyzed by Dataquest<br />
may be clients of this and/or other Dataquest services. This irfiirmation is not furnished in connection with a sak or o^r to sell securUies or in connectum with the sohatatwn of an<br />
c^r to buy securities. This film and its parent and/or their c^icers, stockholders, or members of their Jiimilies may, from rime to time, have a Img or short position in the securities<br />
mentioned and may sell or buy such securities.<br />
Dataquest Incorporated, 1290 Ridder Park Drive, San Jose, CA 95131-2398 / (408) 437-8000 / Telex 171973 / Fax (408) 437-0292
0004614-1<br />
Figure 1<br />
Cell-Repeat Patterra<br />
4-Cell 7-Cell<br />
12-Cell 21-Cell<br />
Source; Dataquest<br />
July 1989<br />
The number of cells in each cluster has a significant impact on the overall capacity<br />
of the system. The smaller the number of cells per cluster, the larger the number of<br />
channels per cell, and consequently the traffic carried per cell is higher. However, there<br />
is a trade-off. Since more channels are being used per cell and the cluster size is smaller<br />
(fewer cells), then the distance between cells using the same channels reduces, with the<br />
consequence that interference from adjacent clusters increases (co-channel interference).<br />
The total number of channels per cell (and therefore, the traffic) is governed by the<br />
total number of channels available and the cell-repeat pattern that is:<br />
Total number of channels per cell<br />
Total number available channels<br />
Cell-repeat pattern (4, 7, 12, 21)<br />
However, traffic in a particular area can be increased (bearing in mind interference<br />
constraints) by reducing the cell size, thereby increasing the number of available radio<br />
channels in that area.<br />
© 1989 Dataquest Incorporated July ESAM Newsletter
System Structure<br />
Each cell's base station is connected to a switching center, which is a modified<br />
central office switch. In practice, a cellular network will consist of several<br />
interconnected switching centers, which are themselves also connected to the public<br />
telephone network (see Figure 2), This configuration enables the full permutation of call<br />
types to be initiated and completed, that is, PSTN to mobile, mobile to mobile, etc.<br />
Two main features within a cellular system enable efficient communication with a<br />
mobile subscriber to be maintained. The first of these is the process of "registration",<br />
which is the ability of the system to maintain a knowledge of an individual mobile's<br />
whereabouts. This is described below.<br />
0004614-2<br />
Base station<br />
Figure 2<br />
Cellular Radio Network<br />
To PSTN<br />
To Other<br />
Mobile<br />
Switching<br />
Centers<br />
Source: Dataquest<br />
July 1989<br />
ESAM Newsletter © 1989 Dataquest Incorporated July
Registration<br />
Within the system, a number of radio channels are reserved as common signaling<br />
channels. Additionally the network is divided up into a number of traffic areas, each area<br />
consisting of a group of cells. The base station generates a code identifying the traffic<br />
area to which it belongs, as part of the information transmitted on the signaling charmels.<br />
A mobile subscriber travels through the network, monitoring the strongest common<br />
signaling channel. As the mobile moves from one cell and/or traffic area to the next, it<br />
will detect a deterioration in the received quality (usability) of the existing common<br />
signaling channel and, therefore, will begin a search for a stronger, more usable signal.<br />
After the mobile has tuned to the new signal, two options for action are possible.<br />
The first option is that having crossed a cell boundary, the mobile is still in the same<br />
traffic area, in which case (in respect of registration) no further action is taken.<br />
The second option is that the mobile has crossed not only a cell boundary but also a<br />
traffic area boundary. In this instance, the mobile transmits its identity to the new base<br />
station, which passes the information onto the switching center. Thus the mobile has<br />
registered its location with that of the system so that the network is able to route an<br />
incoming call to the mobile efficiently and quickly.<br />
In-Call Hand-Off<br />
The second process in the cellular system is that of "in-call hand-off". As a mobile<br />
moves throughout the coverage area it may cross a cell boundary while a call is in<br />
progress. So that the call is not dropped as it moves from one cell to another, the current<br />
base station monitors the received signal from the mobile and will detect any<br />
deterioration of the signal in the region of the cell boundary. At this point the base<br />
station informs the switching center that a "hand-off may be necessary. The switching<br />
center then commands the base stations in the adjacent cells to monitor the mobile's<br />
signal and chooses the best cell to which to transfer the call. A radio channel allocation<br />
in the new cell is made and the mobile, via the original base station, is instructed (over<br />
the signaling channel) to tune to that selected channel. The final part of the hand-off<br />
takes slightly less than 500 ms typically and is barely noticeable to the user. This small<br />
break in transmission hardly affects a voice call but, of course, could be disastrous for a<br />
data call. Consequently, modems with specific error-correcting protocols are necessary<br />
if a user wishes to use a cellular network for the reception/transmission of data.<br />
© 1989 Dataquest Incorporated July ESAM Newsletter
ADJACENT AND CO-CHANNEL INTERFERENCE<br />
Voice communication is carried on the speech channels. In addition, at certain times,<br />
some signaling is also carried on the speech channels.<br />
Speech is carried on the speech channel as an analog frequency-modulated (FM)<br />
signal with a frequency deviation of 9.5 kHz. (More traditional radio telephone systems<br />
using the same 25 kHz channel spacing generally have a maximum frequency deviation of<br />
5 kHz. This approach was taken to minimize interference problems in adjacent channels.)<br />
The use of higher deviation in cellular radio greatly improves the rejection of<br />
unwanted signals on the same frequency (co-channel interference). Co-channel<br />
interference is the most significant limiting factor determinir^ the cell-repeat pattern<br />
used. However, there has to be a compromise. Increasing the deviation increases the<br />
interference to adjacent channels, and if this effect becomes too large it will negate the<br />
effect of using higher deviations. This can be controlled by careful channel allocation, for<br />
example ensuring that adjacent channels are never allocated in the same cell.<br />
CONCLUSIONS<br />
This newsletter has given a brief overview of the general principles of cellular radio.<br />
While cellular radio is not a recent idea,, the practicalities of planning and operating such<br />
high-capacity systems have been rapidly learnt. Further advances in antenna design, for<br />
example, have enabled capacity to be increased by further dividing urban cells<br />
(sectorization).<br />
The rapid move towards an all-digital technology will again increase the utilization<br />
of the available frequency spectrum. Further techniques still to be honed into practical<br />
solutions lie in the areas of modulation techniques and reduced channel spacing.<br />
The number of cellular subscribers has grown considerably over the past seven years,<br />
and is still growing—proof that there is a considerable futvire market to exploit this<br />
technology further.<br />
(This document is reprinted with the permission of Dataquest's European<br />
Telecommunications Industry Service.)<br />
ESAM Newsletter © 1989 Dataquest Incorporated July<br />
Jim Eastlake<br />
Ted Richardson
i^M$M:M<br />
DataQuest<br />
accmipanyof<br />
ihe Dun 8i Bradstiect Corporation<br />
Research Newsletter<br />
SUMMARY<br />
ESAM Code: Volume II, Newsletters<br />
1989-14<br />
0004480<br />
DATAQUEST'S EUROPEAN SENGCONDUCTOR INDUSTRY CONFERENCE:<br />
"THE EUROPEAN RENAISSANCE"<br />
Dataquest's eighth annual European Semiconductor Industry Conference was held<br />
recently at the Park Hilton, Munich, West Germany. The theme of the conference, "The<br />
European Renaissance," provided an excellent opportunity to discuss how Europe's<br />
consolidation of twelve economic entities into one will affect the ways that both<br />
Europeans and non-Europeans do business.<br />
Many key issues were discussed, including the following:<br />
Application markets<br />
International trade<br />
Distribution<br />
Deregulation<br />
Mergers and acquisitions<br />
New technology<br />
This newsletter summarizes the information presented, by topic and speaker, at the<br />
conference.<br />
SPEAKER HIGHLIGHTS<br />
The following extracts are highlights from the conference presentations.<br />
© 1989 Dataquest Incorporated July—Reproduction Prohibited<br />
77K contem of this report represeras our interpretation ami analysis qfinprmation generally available to the public or released by responsible individuals in the subject companies, but<br />
is not guaranteed as to accuracy or completeness, it does not contain material provided to us in confidence by our clients individual companies report&i on and analyzed by Dataquest<br />
may be clients
"World Economic Overview"<br />
Joseph W. Duncan, Corporate Economist and Chief Statistician<br />
Dun & Bradstreet Corporation<br />
The U.S. trade deficit has been the world's engine of growth, but President George<br />
Bush's economic policy will have to tread a careful path between Draconian deficit<br />
reduction, which could lead to recession, and reduction measures that are too lax, which<br />
could lead to higher inflation. Mr. Duncan believes that President Bush can find the<br />
right balance and predicts high growth for the U.S. economy in the first half of 1989 and<br />
slow growth in the second half.<br />
However, five factors could affect that prediction as follows:<br />
A bail-out for the savings and loans will occur this year and will cost each U.S.<br />
citizen $1,000.<br />
The U.S fiscal deficit can only be reduced by higher taxes, and it is expected<br />
that corporation taxes will be increased.<br />
New Soviet links offer the United States the chance to reduce its obligations<br />
to NATO and give economic credits to Russia, which would help reduce the<br />
budget and trade deficits.<br />
Action will have to be taken on the debt burden of the less developed countries.<br />
Action will have to be taken on the growth of leveraged buyout debt.<br />
"New Frontiers in Technology"<br />
Hans Geyer, Assistant General Manager<br />
Intel Europe<br />
Intel has spent $250 million in the last five years on CAD, and every Intel design<br />
engineer has a Sun hooked to VAXes and IBM mainframes for simulation. Thus, Intel's<br />
'Megaprocessor' strategy for 1-million-plus transistor chips like the 486, i860, and the<br />
new version of its 80960 is well supported. These chips require close cooperation in the<br />
early stages of the design cycle between design technologists, process technologists, and<br />
manufacturing personnel. The result is that Intel's chips will be made on processes so<br />
complicated and unique to Intel that no other company will be capable of manufacturing<br />
them. Processor technology is evolving fast toward the microprocessor of the future,<br />
which, by 2000, will have 100 million transistors, 250-MHz operation, 2,000 mips and<br />
1-billion-flops performance.<br />
"Manufacturing Globally"<br />
Joel Monnier, Worldwide Corporate Manufacturing Manager<br />
SGS-Thorason Microelectronics<br />
The Japanese strength is in manufacturing science. SGS-Thomson has targeted the<br />
manufacturing standards it wants to attain within the next six years to match Japanese<br />
capability. The key is equipment uptime: SGS-Thomson's target is to increase the<br />
average length of time for which equipment works without stopping from today's<br />
© 1989 Dataquest Incorporated July ESAM Newsletter
30 minutes to 600 minutes by 1995. In 1995, SGS-Thomson expects to have peopl-eless<br />
fabs that will be six times more productive than present fabs. SGS-Thomson has<br />
targeted 1990 for its 4-Mbit EPROM on a 0.8-micron process, 1993 for a 16-Mbit<br />
EPROM on a 0.5-micron process, and 1996 for a 64-Mbit EPROM at 0.3 micron.<br />
"The New Cordless Community"<br />
Bairy Moxley, Managing Director<br />
Phonepoint<br />
Research indicates that a cheap, light, cordless telephone that is usable anywhere<br />
would have a large market. Semiconductor technology now allows digital cordless<br />
systems to replace analog systems, thus allowing for a high density of users—3,000 per<br />
square kilometer—for which interference problems have ruled out analog systems. When<br />
combined with the lower power, which means smaller, lighter batteries are required for<br />
the modern telephone chip sets, this allows for the rapid evolution of cheaper, lighter,<br />
and smaller phones. Prices will follow a similar course, as was seen with calculators, and<br />
in the future, it will be common for people to own several cordless telephones.<br />
"RISC versus CISC"<br />
Bob Miller, President, Chairman and CEO<br />
MIPS Computer Systems Inc.<br />
With MIPS' performance capabilities on 260,000 transistors, there is no need to<br />
design 1-million-plus transistor microprocessors like Intel's. Also, MIPS has five<br />
competing sources (instead of one for Intel microprocessors) and a rapidly increasing<br />
level of performance—60 to 70 mips in CMOS this year, 120 mips in ECL in 1991, and<br />
180 to 220 mips in GaAs in 3 to 4 years' time. In 1993, 7 million of the estimated<br />
16 million processors sold will be RISC based. The RISC performance levels are achieved<br />
primarily through software (particularly the compilers), rather than from pushing the<br />
technological limits of silicon hardware. If Microsoft succeeds in making OS/2 portable,<br />
and an "informed rumor" says it is working on it, then RISC must win over CISC.<br />
"Electronics in the Automotive Environment"<br />
Enrico Ferrati, Research and Development Manager<br />
Marelli Autronica SpA<br />
The value of electronics in a car is now about 5 percent of the value of the car, but<br />
this percentage will rise to 20 percent by the year 2000. Electronics will be used in<br />
power steering, digital displays, information control, active suspension, electronic<br />
transmission, shock damping, antilock systems, and engine management. Electronics<br />
features will amalgamate into electronics subsystems, which will be integrated together<br />
on ASIC chips. Such subsystems will be in the areas of power management, chassis<br />
control, information management, and various convenience features. ASICs and smart<br />
power will account for 50 percent of the automotive semiconductor's total available<br />
market (TAM) in 2000, whereas the current TAM is 50 percent discretes, 35 percent<br />
standard ICs, 10 percent microcontrollers, and 5 percent ASICs.<br />
ESAM Newsletter © 1989 Dataquest Incorporated July
"Positioning Internationally"<br />
Robert Freischlag, President<br />
Fujitsu Mikroelektronik<br />
The European semiconductor market is expected to grow from $8.5 billion in 1988 to<br />
$12 billion by 1992. European companies that rely on state support and protectionist<br />
legislation will lose out, while the most efficient companies will survive. Cars and<br />
semiconductors, however, will receive national protection from their governments.<br />
Non-European companies that merely export to Europe will be in trouble. Those who<br />
want to win will need a European headquarters sales office, assembly, packaging and test<br />
facilities and diffusion plants. To support the future market they will also need<br />
increased R&D. Companies will need to pursue global strategies, while retaining their<br />
sensitivities to local needs.<br />
"Integrating into Europe"<br />
Bany Waite, Vice President and General Manager Europe<br />
Motorola Semiconductor<br />
Europe has 360 million consumers, of whom 320 million are in the European<br />
Economic Communities (EEC) compared with 250 million in the United States. Europe's<br />
GNP is $4.7 billion—10 percent more than the U.S.'s GNP. Europe's semiconductor<br />
requirements are supplied 43 percent by U.S. producers, 38 percent by European<br />
producers and 19 percent by Japanese producers. New markets for semiconductors will<br />
account for 40 percent of the 1994 semiconductor TAM. These markets will be in car<br />
safety, emission controls, intelligent credit cards, ISDN, HDTV, CD-I, pan-European<br />
digital cellular phones, and satellite TV. As Europe grows in self-sufficiency, it will<br />
increasingly manage free trade to the point where capital and information will be the<br />
only freely traded worldwide commodities.<br />
"Global Distribution in the 1990s"<br />
Stephen Segal, Executive Vice President<br />
Future Electronics Inc.<br />
The world is becoming a global marketplace characterized by huge TAMs (e.g., a<br />
1993 distributor TAM of $5.7 billion); world trade liberalization (e.g., the push to open up<br />
the Japanese market); consolidations, acquisitions, and mergers (e.g., Harris/GE/RCA);<br />
technology alliances (e.g., Motorola/Toshiba, Texas/Hitachi, and new fabs (e.g.,<br />
Amphenol and Fujitsu in Scotland). The strategy for non-European distributors in Europe<br />
is fourfold, as follows:<br />
• Have deep pockets to prepare for a nonprofit period of up to two years<br />
•<br />
Enter Europe through start-ups or takeovers<br />
Be structurally efficient—ship-from-stock and credit, single price globally,<br />
MIS systems, regional warehousing<br />
Form quality partnerships with a few global customers on a global supply basis<br />
© 1989 Dataquest Incorporated July ESAM Newsletter
"Think Global—Act Global"<br />
Jose Menendez, General Manager and President of the Executive Committee<br />
Sonepar Group<br />
Think global and act local. Europe is a more difficult place to do business in than<br />
outsiders expect: the many different currencies, local customs, languages, and credit<br />
practices all contribute to outsiders' confusion. Sonepar deals with nine different<br />
nationalities and believes that there is a long way to go before the European market can<br />
be addressed in a single, logical manner using standardized metliods. Sonepar's<br />
personalized contacts, market data, and ability to provide local assistance and service<br />
can help manufacturers to penetrate Europe by providing manufacturers with early<br />
anticipation of demand (without manufacturers losing control of their marketing and<br />
distribution networks).<br />
"A Vendor's Viewpoint on Distribution"<br />
Marco Land!, Vice President, Semiconductor Marketing and Sales<br />
Texas Instruments<br />
A shake-up is coming in European distribution. One reason for the shake-up is the<br />
declining profitability of the industry (e.g., a major distributor has closed in Italy, and<br />
Unitech has made a major disinvestment). The year 1992 will accelerate this shakeout<br />
because there are new European distributors (BMW bought Kontron). Also, new<br />
non-European companies want to enter the market. Who will survive? The following<br />
characteristics point to success:<br />
Pay attention to cost of sales<br />
Differentiate in selected market segments<br />
Commit to close relationships with manufacturers<br />
Invest in EDP for inventory management<br />
Look for profit before sales growth<br />
Breadline<br />
Generate demand as well as serve it<br />
"Pan-European Distribution"<br />
Edward D Burgess, General Manager<br />
ITT Distribution Worldwide<br />
Pan-European distribution must satisfy 80,000 customers in 15 countries which<br />
collectively purchase $2 billion worth of semiconductors/annually. Furthermore, it needs<br />
to help its major customers reach customers that they cannot serve directly, which<br />
represent 15 to 35 percent of the TAM. It would be attractive for a supplier to sign one<br />
agreement that contains the same contractual conditions for all 15 countries with one<br />
distributor and have that distributor service 15 national markets. But pan-European<br />
franchises are rare, and not all distributors have Europewide management or<br />
warehousing. The year 1992 should see an increase in the share of the TAM that goes<br />
ESAM Newsletter © 1989 Dataquest Incorporated July
through distribution, but the large investments required to be pan-European and- the<br />
declining profitability of the industry may turn out to be insurmountable hurdles for<br />
some companies.<br />
"Introductory Remarks on the European Renaissance"<br />
Jean-Marie Cadiou, Director of ESPRIT<br />
Commission of the European Communities<br />
The European IT industry has some weaknesses—it is dependent on non-European<br />
microprocessors and foreign chips—but it is looking better. ESPRIT 2 will produce<br />
0.5-micron CMOS ASIC and 0.5-micron SOI processes. Europe still needs an engineering<br />
culture to bring leading-edge chips to market. ESPRIT I's successes included a<br />
state-of-the-art BiCMOS process; spectacular results in the silicon compiler project;<br />
and the Supernode project, which produced parallel processing machines that beat Intel.<br />
Opportunities for Europe lie in HDTV, ISDN, and broadband communications networks.<br />
"Procuring in the 1990s"<br />
Dan Byrne, Director of European Operations<br />
Apple Computer<br />
Apple wants to be a truly European computer company. Since 1986, it has been<br />
doubling the annual amount of its European-sourced components. Recently that process<br />
has accelerated and in 1989, the company will source the same number of components<br />
from Europe in one quarter as it sourced in the whole of 1988. Apple's procurement<br />
requirements are as follows:<br />
• Shipment on an as-needed basis to fit with the Cork manufacturing plant's<br />
flexible production schedules<br />
• Apple works to 0.5 percent defects today and is moving to 0.05 percent in the<br />
early 1990s as part of its commitment to high quality<br />
• Competitive prices that are key to Apple, because 90 percent of its product<br />
cost is materials cost<br />
• New products/technology, because Apple has a total bias toward innovation<br />
and needs suppliers that can keep it ahead of the technology curve<br />
"A European in the International Scene"<br />
Heinz W. Hagmeister, Managing Director and CEO, Business Unit ICs<br />
Philips Components<br />
Fewer companies are buying more and more of the world IC output. These<br />
companies are multinationals that operate with local profit centers, but which demand<br />
worldwide pricing and high standards of service and quality. Currently, 15 companies<br />
buy 15 percent of the output of the semiconductor industry. These major customers are<br />
reducing the numbers of vendors that they deal with and thus require global servicing.<br />
Philips Components is responding by strengthening its presence in the Asia/Pacific region.<br />
© 1989 Dataquest Incorporated July ESAM Newsletter
"Telecommunications Technologies for the 1990s"<br />
Horst Ohnsorge, Director, Research and Technology<br />
Alcatel<br />
Already the 29 biggest cities in Germany have been linked \yith 500,000 kilometers<br />
of fiber-optic cable for a broadband communications system. Fiber-optic technology is<br />
also prevalent in other countries: Fiber-to-the-home is the goal in the United States,<br />
with trials in 11 cities; France has the Biarritz network; the United Kingdom has the<br />
Milton Keynes network; Canada has the Elie Manitoba net; and Japan has the Hi Ovis<br />
network. Technical advances that are required to service broadband communications<br />
equipment include the following:<br />
• 1-million-plus transistor ASICs with less than 50ps gate delays<br />
• 32-Mbit memories with 1 ns access time costing 10 ECUs<br />
• 500-mips, 32-bit microprocessors with 100-MHz clock rates costing 50 ECU<br />
"Eastern Europe and Perestroika"<br />
Yuri Levine, Senior Research Fellow<br />
Institute of World Economy and International Relations, USSR Academy of Sciences<br />
Having a nonconvertible currency, an inefficient bureaucracy, and a state monopoly<br />
on foreign trade have contributed to slow economic growth in Russia. However, since<br />
December 1988, every Russian company has had the right to trade abroad and find<br />
partners. By the end of 1988, 200 joint ventures—representing Western investment of<br />
$441 million—had been registered. So far, in 1989, 300 more have been added. There is<br />
no limit on the percentage share that foreign companies can hold. Nonconvertibility of<br />
the ruble poses problems for foreign companies that want to repatriate profits. Either<br />
the Commerce Ministry could find ways around that problem, or Western companies<br />
could either purchase Russian goods and export them or export the products of the joint<br />
venture.<br />
"Consumer Europe"<br />
Jacques Noels, President and CEO<br />
Nokia Consumer Electronics<br />
A revolution is taking place in Europe on several fronts. First, a revival of interest<br />
in consumer electronics with big investments in HDTV, in satellite broadcasting, and DSP<br />
is taking place. Second, the technical revolution that has changed the computer world<br />
has not yet affected consumer electronics, but it will—TVs in the 1990s will have<br />
50 Mbytes of RAM. Third, personal electronics will become big business, especially with<br />
home-integrated systems. Fourth, what effect will 1992 have? And, last but not least,<br />
are the effects of deregulation. European governments should support the industry that<br />
is fighting not only the Japanese but the developing countries as well.<br />
ESAM Newsletter © 1989 Dataquest Incorporated July
"The European Renaissance"<br />
Jurgen Knorr, Senior Vice President, Components Division<br />
Siemens<br />
If a renaissance in Europe's electronics industry is to occur, the industry will need to<br />
catch up in microelectronics technology. Siemens believes that it is only six months<br />
behind the Japanese with the 4-Mbit generation of DRAMs and will catch up with<br />
16 Mbit technology. It will cost $3.7 billion to reach the stage of producing 10 million<br />
16-Mbit DRAMs a month. The R&D cost for the 16-Mbit DRAMs will be $500 million.<br />
It is an expensive and risky business, but dependency could result if only one member of<br />
the triad has DRAM manufacturing capability. JESSI, funded 50 percent by participating<br />
companies and 25 percent by the EEC, will ensure that Europe maintains its position in<br />
DRAMs. "So we see a green light for the European semiconductor industry."<br />
NEW DIRECTORY OF DATAQUEST PUBLICATIONS<br />
Byron Harding<br />
A new directory describing 30 Dataquest Research Publications is now available<br />
from Dataquest's Direct Marketing Group. The directory includes information<br />
on the following:<br />
• Monthly newsletters on global semiconductor, information<br />
systems, and office equipment markets<br />
• SpecCheck specification guides for hundreds of facsimile<br />
machines, copiers, personal computers, and printers<br />
• In-depth reports on current high-technology topics, from<br />
intellectual property issues to high-definition video technology<br />
For a free copy of the directory, call the Direct Marketing Group toll-free at<br />
1-800-624-3282 or write:<br />
Direct Marketing Group<br />
Dataquest Incorporated<br />
1290 Ridder Park Drive<br />
San Jose, CA 95131<br />
Source Code: K4<br />
© 1989 Dataquest Incorporated July ESAM Newsletter
Mv^-y5t5;fsi<br />
^ci Research<br />
DataQuest<br />
aoMnpanyof<br />
The Dun STBrad^icet OMporatnn<br />
Newsletter<br />
OVERVIEW<br />
ESAM Code: Volume II, Newsletters<br />
1989-13<br />
0004342<br />
INTERNATIONAL SEMICONDUCTOR TRADE ISSUES-<br />
DOMINANCE, DEPENDENCE, AND FUTURE STRATEGIES<br />
Trade issues have been a major concern throughout the world thus far in 1989. The<br />
Japanese semiconductor manufacturers have achieved dominance of the worldwide<br />
DRAM market, while U.S. manufacturers still hold a comfortable lead in high-end<br />
microprocessors. The European semiconductor producers, particularly in view of the<br />
forthcoming 1992 combined-market scenario, have pledged that they will be in a position<br />
to supply Europe's semiconductor needs. Finally, substantial growth is being seen<br />
throughout the Asia/Pacific region as Taiwan, Korea, and Singapore rapidly expand their<br />
semiconductor production base.<br />
Dataquest forecasts a global semiconductor industry taking shape by the mid-1990s,<br />
with a more balanced distribution of products and technologies than we witnessed in the<br />
1970s and 1980s. However, with the trade press burgeoning with weekly—if not<br />
daily—statistics regarding export balances, threats of protectionism, and national<br />
agendas for critical electronic components, it is difficult to sort out the true current<br />
situation in the worldwide market, Dataquest has taken an alternate perspective on<br />
current worldwide production/consumption of semiconductor components and has<br />
classified each region as to whether it consumes more ICs than it produces or has a<br />
sufficiency for export after satisf3nng domestic needs. This ne,t difference for each<br />
region, presented by major product category, is a measure of the self-sufficiency profile<br />
for each region. By understanding the net consumer or net producer profile of each<br />
region, we can anticipate strategic moves that the IC producers in these regions may<br />
make in the international marketplace.<br />
© 1989 Dataquest Incorporated July—Reproduction Prohibited<br />
The amsera c^tiiis report represents our interprettUion and analysis of infi>rmation generally available to the public or released by responsible individuals in the subject con^xmies, but<br />
is not guaranteed as to accuracy or am^tteteness. It does not coraain material provided to us in cor^idence by our clients^ Individual ccrnipanies report&i on artd analyzed by Dataquest<br />
may be clients of this and/or o^r Dataquest services This ir^rmation is notjumishai in connection with a sale or c^r to sell securities or in connection with tile solicitation of an<br />
c^rto buy securities. This firm and its parent and/or their oifficers, stodtholders, or members of their fimulies may, from time to time, have a long or short posititm in the securities<br />
mentioned and may sell or buy such securities.<br />
Dataquest Incorporated, 1290 Ridder Park Drive, San Jose, CA 95131-2398 / (408) 437-8000 / Tfelex 171973 / Fax (408) 437-0292
PROFILES BY REGION<br />
U.S. Companies<br />
We begin our analysis of worldwide production and consumption of ICs with a look at<br />
the U.S. semiconductor consumption/production profile. Figure 1 illustrates that the<br />
United States has a relatively symmetrical consumption/production profile, except for<br />
DRAMs and analog ICs. Figure 2 presents a better picture of the United States' position<br />
as a net consumer or net producer of ICs. From it, we can see that the United States is<br />
a net producer of both microprocessors and microcontrollers of bipolar standard logic,<br />
analog ICs, and discrete transistors. However, as expected, the United States also is a<br />
net consumer of DRAMs, a net consumer of SRAMs, and, surprisingly, a net consumer of<br />
both bipolar and MOS gate arrays.<br />
0004342-1<br />
Figure 1<br />
Semiconductor Consumption/Production Profile<br />
United States<br />
1 0 1<br />
Billions of Dollars<br />
© 1989 Dataquest Incorporated July<br />
Source: Dataquest<br />
July 1989<br />
ESAM Newsletter
Figure 2<br />
Difference between Semiconductor Consumption and Production<br />
United States<br />
DRAM<br />
SRAM<br />
Nonvolatile<br />
MPU<br />
MCU<br />
Bipolar Gate Array<br />
MOS Gate Array<br />
MOS PLD<br />
Bipolar Std. Logic<br />
S:<<br />
'•.. \. X \ %<br />
r 0<br />
Billions of Dollars<br />
ESAM Newsletter © 1989 Dataquest Incorporated July<br />
Source: Dataquest<br />
July I9S9
Japanese Companies<br />
Figure 3 presents the overlay of Japanese semiconductor consumption, and Figure 4<br />
presents the net consumption/production chart as it relates to Japan. These figures<br />
illustrate that Japan is overwhelmingly a net producer of ICs and that it consumes only<br />
microprocessor units, MOS PLDs, and bipolar standard logic from foreign sources.<br />
ORAM<br />
SRAM<br />
Nonvolatile<br />
MRU<br />
MCU<br />
Bipolar Gate Array<br />
MOS Gate Array<br />
MOS PLD<br />
Bipolar Std. Logic<br />
0004342-3<br />
Analog<br />
Transistor<br />
Opto<br />
Figure 3<br />
Semiconductor Consumption/Production Profile<br />
Japan<br />
Consumed by Japan<br />
Produced by Japan<br />
^^^^^:^^<br />
^m.<br />
t^^<br />
[ ^<br />
^^^^^^^B<br />
h^iSKV^x<br />
^S<br />
1 1<br />
Billions of Dollars<br />
Source: Dataquesl<br />
July 19S9<br />
© 1989 Dataquest Incorporated July ESAM Newsletter
Figure 4<br />
Difference between Semiconductor Consumption and Production<br />
Japan<br />
DRAM<br />
SRAM<br />
Nonvolatile<br />
MRU<br />
MCU<br />
Bipolar Gate Array<br />
MOS Gate Array<br />
MOS PLD<br />
Bipolar Std. Logic<br />
0004042-4<br />
Analog<br />
Transistor<br />
Opto<br />
2.5<br />
Net Consumption<br />
Nst Production<br />
1.6<br />
K^<br />
0.5 O.S<br />
Billions of Dollars<br />
ESAM Newsletter © 1989 Dataquest Incorporated July<br />
1.5 2.5<br />
Source: Dataquest<br />
July l9S9
European Companies<br />
Figures 5 and 6 depict the consumption/production scenario for Europe. As seen in<br />
Figure 6, Europe is a net consumer of foreign semiconductors in all categories.<br />
DRAM<br />
SRAM<br />
Nonvolatile<br />
MPU<br />
MCU<br />
Bipolar Gate Array<br />
MOS Gate Array<br />
MOS PLD<br />
Bipolar Std. Logic<br />
0004342-5<br />
Analog<br />
Transistor<br />
Opto<br />
Figure 5<br />
Semiconductor Consumption/Production Profile<br />
Europe<br />
?^^^^^^»^<br />
m.<br />
i "' ••'''•••- I Consumed by Europe<br />
^^M Produced by Europe<br />
• ^<br />
m^<br />
r ^<br />
S<br />
\
Figure 6<br />
Difference between Semiconductor Consumption and Production<br />
Europe<br />
DRAM<br />
SRAM<br />
Nonvolatile<br />
MRU<br />
MCU<br />
Bipolar Gate Array<br />
MOS Gate Array<br />
MOS PUD<br />
Bipolar Std. Loglo<br />
0004342-6<br />
Analog<br />
Transistor<br />
Opto<br />
1 00<br />
Ji^i'ii4•i*ii*•i4^S^i^•i•^•«:^<br />
r''--'''*-.'') Net Consumption<br />
^ ^ Net Production<br />
1 1<br />
0.75 0.50<br />
i?^<br />
j^^i^m^<br />
•^ '*>. \. >, >. '--'.-. ^--'L. \-<br />
^^^::.,>-;-v<br />
1<br />
0.25<br />
Billions of Doll ars<br />
im<br />
i<br />
(<br />
ESAM Newsletter © 1989 Dataquest Incorporated July<br />
>•<br />
1<br />
5 0.25 0.5<br />
Source: Dataquest<br />
July 1989
Asia/Pacific and ROW Companies<br />
Figures 7 and 8 depict the consumption/production profile for the rest of the world,<br />
which is essentially Asia/Pacific. As seen in these figures, ROW is a net consumer of<br />
foreign ICs, with the exception of SRAMs.<br />
DRAM<br />
SRAM<br />
Nonvolatile<br />
MRU<br />
MCU<br />
Bipolar Gate Array<br />
MOS Gate Array<br />
MOS PUD<br />
Bipolar Std. Logic<br />
0004342-7<br />
Analog<br />
Transistor<br />
Opto<br />
H^S:<br />
Figure 7<br />
Semiconductor Consumption/Production Profile<br />
Rest of World<br />
Consumed by Rest of World<br />
Produced by Rest of World<br />
.v^<br />
^<br />
^ ^<br />
K^:<br />
K.xs>^^:^^^t^»^^^"<br />
\Vvv%>A\.\<br />
0.5 0.5<br />
Billions of Dollars<br />
1.5<br />
Source: Daiaquest<br />
July 1989<br />
© 1989 Dataquest Incorporated July ESAM Newsletter
Figure 8<br />
Difference between Semiconductor Consumption and Production<br />
Rest of World<br />
DRAM<br />
SRAM<br />
Nonvolatile<br />
MPU<br />
MCU<br />
Bipolar Gate Array<br />
MOS Gate Array<br />
MOS PLD<br />
Bipolar Std. Logic<br />
0004342-a<br />
Analog<br />
Transistor<br />
Opto<br />
1.5<br />
DATAQUEST ANALYSIS<br />
k'\.\l Net Consumption<br />
^ ^ Net Production<br />
s^^;.:><br />
i<br />
i^<br />
i^<br />
si:
Dataquest believes that U.S. producers will continue to exercise dominance in<br />
microprocessors, given their superiority in complex design and software expertise;<br />
however, we also believe that the United States will become a net consumer of<br />
microcontrollers as Japanese companies gain expertise in this technology. This is<br />
particularly true for the less complex microcontrollers, which are embedded into a vast<br />
array of consumer electronic products and office equipment.<br />
The U.S. companies' position in gate arrays, both bipolar and MOS, is surprising.<br />
Already, in this relatively young market, the United States does not produce enough to<br />
satisfy its own needs, suggesting underinvestment in this important and growing market.<br />
Unless dramatic changes occur, and occur very soon, we believe that non-U.S. suppliers<br />
will gain dominance in MOS gate arrays and that the U.S. electronics industry will<br />
continue to consume more gate arrays than it produces in the 1990s. Finally, although<br />
the U.S. IC producers appear to have a strong position in analog ICs, we believe that this<br />
strength will diminish somewhat in the 1990s, resulting from the lack of an indigenous<br />
consumer electronics industry.<br />
To no one's surprise, the Japanese IC suppliers are the world's leaders in DRAMs.<br />
Dataquest believes that the Japanese companies will continue in their dominance of<br />
these markets and will be substantial net producers of DRAMs in the 1990s. Numerous<br />
Japanese companies are well positioned in 4Mb DRAMs already and are beginning to<br />
focus their attention on the 16 and 64Mb DRAMs. With this much inertial energy, we<br />
believe that it will be difficult for anyone to dislodge the Japanese IC producers from<br />
this number-one status. We believe , that the Japanese semiconductor producers will<br />
continue to strengthen their position in gate arrays and soon will begin to focus their<br />
energies on the MOS programmable logic device (PLD) area. Although it is purely<br />
speculation at this point, we believe that in the light of increasing trade friction, the<br />
Japanese suppliers may pursue microprocessor devices with less intensity and that the<br />
Japanese electronics industry will continue to be a net importer of MPUs, particularly<br />
32- and 64-bit MPUs.<br />
The European region forecast is less clear. The European electronics industry, at<br />
this time, is substantially dependent upon non-European sources for its critical<br />
semiconductor devices. We will have to wait to see if the "1992 Effect" and the recent<br />
consolidation of several European IC manufacturers will have a positive impact upon this<br />
profile as we head into the 1990s.<br />
Dataquest believes that the area wherein the greatest change in profile could occur<br />
will be ROW—principally, Taiwan, Korea, Singapore, and Malaysia. Taiwanese and<br />
Korean companies are making substantial increases in semiconductor manufacturing<br />
capacity. In the last year alone, Taiwan has witnessed several new IC start-ups focused<br />
on the SRAM market as well as incorporation of SRAMs into the product profiles of<br />
many of the existing Taiwanese companies. Korean companies are well positioned to<br />
gain a major role in DRAMs. Singapore, Malaysia, and Taiwan, to some extent, have<br />
large amounts of installed foundry capacity. Dataquest believes that several of these<br />
foundries may begin to run SRAM-type products as technology drivers and as capacity<br />
balancers, further enhancing the region's image as a net producer of SRAM-type<br />
products. We also believe that there will be increased activity in both microprocessorand<br />
microcontroller-type products, especially in Taiwan and Korea, as these regions'<br />
technical competency increases in high-end personal computers and workstations.<br />
10 © 1989 Dataquest Incorporated July ESAM Newsletter
Dataquest anticipates an era of greater interdependence among geographic regions,<br />
beginning in the early 1990s. We believe that this will be especially true among the<br />
electronic IC companies of the United States, Japan, and Asia/Pacific, as all of these<br />
regions attempt to arrive at an amenable trade balance. We further believe that<br />
European industry will first focus on meeting a greater share of its own internal needs in<br />
the early 1990s and then join the other regions of the world in the mid- to late 1990s as<br />
the electronics industry becomes truly global in nature, with virtually no geographical<br />
boundaries.<br />
(This document is reprinted with the permission of Dataquest's Semiconductor<br />
Industry Service.)<br />
NEW DIRECTORY OF DATAQUEST PUBLICATIONS<br />
Byron Harding<br />
David Angel<br />
A new directory describing 30 Dataquest Research Publications is now available<br />
from Dataquest's Direct Marketing Group. The directory includes information<br />
on the following:<br />
• Monthly newsletters on global semiconductor, information<br />
systems, and office equipment markets<br />
• SpecCheck specification guides for hundreds of facsimile<br />
machines, copiers, personal computers, and printers<br />
• In-depth reports on current high-technology topics, from<br />
intellectual property issues to high-definition video technology<br />
For a free copy of the directory, call the Direct Marketing Group toll-free at<br />
1-800-624-3282 or write:<br />
Direct Marketing Group<br />
DataquestIncorporated<br />
1290 Ridder Park Drive<br />
San Jose, CA 95131<br />
Source Code: K4<br />
ESAM Newsletter © 1989 Dataquest Incorporated July 11
Dataoyest<br />
aamuianyof<br />
ThcDun& Bradsticet Corporation<br />
Research Newsletter<br />
ESAM Code: Volume II, Newsletters<br />
1989-12<br />
0004018<br />
THE PC CfflP SET MARKET: WADE IN CAREFULLY—THE POOL IS FULL!<br />
INTRODUCTION<br />
Worldwide, there were only six PC logic chip set vendors in 1987. In 1988, the<br />
number climbed to 13, and by the end of this year Dataquest expects to see 19 vendors<br />
worldwide. The new entrants are both large, well-capitalized semiconductor manufacturers<br />
and small, start-up design houses. These new suppliers have been attracted by the<br />
tremendous growth rate of the market and the initially small number of participants.<br />
This is characteristic of any emerging market. The main differences between this<br />
market and other emerging markets are the large amount of standardization already<br />
present and the ease of sizing the market by examination of the total number of PCs<br />
shipped.<br />
Dataquest believes that the rapid increase in new entrants and capacity will bring<br />
this industry to the saturation level by the end of this year, based on the Dataquest PC<br />
shipment forecast. We expect this saturation to lead to aggressive price competition,<br />
driving vendors to look for penetration of these products into new applications and<br />
markets. Figure 1 presents Dataquest's estimated actual and forecast revenue for the<br />
worldwide PC logic chip set market.<br />
Millions of Dollars<br />
$1000<br />
$900<br />
$800<br />
$700<br />
$600<br />
$500<br />
$400<br />
$300<br />
$200<br />
$100<br />
0<br />
0004018-1<br />
$393.3<br />
kXVV<br />
Figure 1<br />
Worldwide PC Chip Set Market Forecast<br />
(Millions of Dollars)<br />
$563.3<br />
$139.B K^ tjSS^<br />
V<br />
^:ssst<br />
$706.9<br />
$810.6<br />
»763.4<br />
$5§$l<br />
KVVS.1<br />
\. % \. \.<br />
^<br />
:\S<br />
IS^^S1<br />
M\<br />
t \ \. \ \<br />
Si-^^^'<br />
5 ^<br />
$889.6<br />
iVVVS<br />
M^<br />
^ ^<br />
1987 1988 1989 1990 1991 1992 1993<br />
Source: Dataquest<br />
May 1989<br />
© 1989 Dataquest Incorporated May—Reproduction Prohibited<br />
77K content cflhis report represents our interpretation and analysis cfirprmation generally available lo the public or released by responsible individuals in the subject companies, but<br />
is not guaranteed as to accuracy or completeness. It does not contain material provided to us in cor^idence by our clients- Individual companies reported on and analyzed by Dataquest<br />
may be clients c^this and/or other Dataquest services. This it^jrmation is not furnished in connection with a sale or offer to sell securities or in connection with the solicitation t^an<br />
qffir to buy securities. This firm and its parent and/or their cgicers, stockholders, or members of their ftmilies may, from time to time, have a long or short position in the securities<br />
mentioned find may sell or buy such securities<br />
Dataquest Incorporated, 1290 Ridder Park Drive, San Jose, CA 95131-2398 / (408) 437-8000 / Tfelex 171973 / Fax (408) 437-0292<br />
[ ^
fflOH GROWTH RATE ATTRACTS MANY NEW ENTRANTS<br />
Dataquest estimates the compound annual growth rate (CAGR) for chip set unit<br />
shipments from 1987 to 1993 to be about 38 percent, an attractive rate of growth to<br />
investors, which should entice them to seek ways to participate in this industry.<br />
However, because of the nature of the relationship between PC consumption and chip set<br />
consumption, it is important for potential new entrants to look at the development of<br />
this market in terms of the product life cycle.<br />
Figure 2 graphs shipments of chip sets against the shipments of DOS PCs, showing<br />
the rapid rise of chip set shipments as they approach the level of PC shipments.<br />
Between 1987 and 1988, chip set shipments grew by 157 percent. The estimated CAGR<br />
for 1987 to 1990 is still almost 70 percent. Dataquest estimates that during this same<br />
period, the number of chip set vendors will increase from 6 to 23.<br />
Dataquest believes that, in 1990, the penetration of chip sets into PCs will likely<br />
approach saturation. By the end of 1989, the penetration will be about 92 percent. At<br />
this point, the growth rate of chip set shipments will be tied directly to the growth rate<br />
of PC shipments. In fact, the CAGR for chip set shipments from 1989 to 1993 is<br />
estimated at only 12.2 percent. This level of growth should attract fewer new entrants<br />
and cause some participants to exit the industry,<br />
Millions of Units<br />
25-<br />
1987<br />
Number of<br />
Vendors: 6<br />
0004018-2<br />
Figure 2<br />
Worldwide PC Logic Chip Set Market Forecast<br />
as Compared with the DOS PC Forecast<br />
(Millions of Units)<br />
DOS PCs<br />
DOS PC Chip Sets<br />
1988<br />
13<br />
1989<br />
19<br />
1990<br />
23<br />
1991<br />
20<br />
1992<br />
18<br />
1993<br />
17<br />
Source: Dataquest<br />
May 1989<br />
© 1989 Dataquest Incorporated May ESAM Newsletter
A Case of Overcapacity<br />
According to a Dataquest survey, worldwide logic chip set vendors expect to ship<br />
more than 15 million units in 1989. Table 1 lists the results of this survey along with<br />
Dataquest's estimated actual and forecast numbers for chip set and PC unit consumption<br />
for 1987 through 1989. The vendors expect to ship 17.5 percent more than the forecast<br />
for chip sets in 1989 and 8.1 percent more than the forecast PC consumption.<br />
Table 1<br />
Worldwide PC Chip Set Vendor Survey Results<br />
(Thousands of Units)<br />
1987 1988 1989<br />
Dataquest DOS PC Consumption Estimate 9,552 12,293 13,953<br />
Dataquest DOS Chip Set Consumption Estimate 3,116 8,014 12,837<br />
Vendor-Estimated Chip Set Shipments 3,116 8,014 15,095<br />
Source; Dataquest<br />
May 1989<br />
The difference between the vendors' expectations and the Dataquest forecast might<br />
be explained by aggressive goal setting on the part of the vendors. One could also argue<br />
that some units will be shipped into inventory. It is clear, however, that more than<br />
enough capacity exists to satisfy the demand for chip sets, and it is expected that new<br />
entrants to the industry will aggravate this situation.<br />
The implications of ^ this analysis should be obvious. The competition for market<br />
share in this industry is likely to lead to aggressive, if not predatory, pricing policies on<br />
the part of participants. Given the degree of standardization of these products, they will<br />
take on more of the attributes of a commodity, where pricing and service are the keys to<br />
success.<br />
FORECAST METHODOLOGY AND ASSUMPTIONS<br />
The PC chip set forecast is derived from the Dataquest Personal Computer Industry<br />
Service PC forecast and from a survey of worldwide chip set vendors. Each year,<br />
Dataquest forecasts worldwide shipments of personal computers. Table 2 gives the<br />
Dataquest estimated worldwide shipments for DOS PCs. Dataquest's new chip set<br />
forecast for 1989 through 1993 is derived as a function of saturation of the DOS market.<br />
The estimates for 1987 and 1988 are based on the chip set vendor survey and Dataquest<br />
analysis. The following significant assumptions were made in these forecasts:<br />
• The worldwide DOS PC market will continue to grow through the period at a<br />
CAGR of about 14 percent.<br />
• As a general trend, discrete chips will be displaced by very large scale<br />
integration. In personal computers specifically, discrete logic chips will be<br />
replaced by logic chip sets. Because of the advantages of chip sets for the<br />
systems manufacturers—lower cost, better performance, faster time to<br />
market—this displacement has happened very rapidly.<br />
ESAM Newsletter © 1989 Dataquest Incorporated May
* Average selling prices (ASPs) will fall in 1989 because of price competition.<br />
They will rise in 1990 as the introduction of EISA chip sets and increased<br />
penetration of the MCA chip sets shifts the product mix toward the high end.<br />
ASPs will then come down slowly through the rest of the period as price<br />
decreases are offset by the continued move in product mix toward the high end.<br />
Table 2<br />
Worldwide PC Logic Chip Set Market Forecast<br />
(Thousands of Units)<br />
1987-1993<br />
1987 1988 1989 1990 1991 1992 1993 CAGR<br />
DOS PC<br />
Shipments 9,552 12,293 13,953 15,444 16,807 18,491 20,570 13.64%<br />
Chip Set<br />
Shipments 3,116 8,014 12,837 15,136 16,639 18,306 20,364 36.73%<br />
Saturation 33% 65% 92% 98% 99% 99% 99%<br />
Chip Set ASP $44.88 $49.08 $43.88 $46.84 $45.88 $44.28 $43.69 (0.45%)<br />
Chip Set<br />
Revenue<br />
($M) $139.8 $393.3 $563.3 $708.9 $763.4 $810.6 $889.6 36.12%<br />
Chip Set<br />
Revenue<br />
Growth N/A 181.2% 43.2% 25.9% 7.7% 6.2% 9.7%<br />
N/A = Not Available<br />
DATAQUEST ANALYSIS<br />
Critical Success Factors for Participants<br />
Source: Dataquest<br />
May 1989<br />
In order to participate successfully in this industry, vendors will require certain<br />
capabilities and resources, including the following:<br />
• Systems Expertise—Systems designers are looking for vendors that can work<br />
with them from the beginning of the board design to integrate and sometimes<br />
customize a chip set into the system. Chip set vendors with board design and<br />
systems expertise will be able to provide this capability.<br />
• Design Tools—Fast chip design turnaround will be required because of short<br />
product life cycles. Access to design tools will allow vendors to offer products<br />
as a core that can be modified to allow customers some degree of<br />
differentiation.<br />
© 1989 Dataquest Incorporated May ESAM Newsletter
• High-Volume/Low-Cost Manufacturing—Because of the increasing commodity<br />
status of these products, access to high-volume/low-cost foundries will be<br />
essential.<br />
• Customer Service/Support—Because of the lack of any major differentiation<br />
in these products, service and customer support is as important as pricing. A<br />
user might not switch vendors for either better pricing or better service, but if<br />
offered both, will find it difficult to resist.<br />
Opportunities<br />
As the chip set market approaches saturation and vendors find themselves with<br />
excess capacity, they will be forced to look for new applications for logic chip sets<br />
outside of the personal computer. Two areas that will benefit from this are the<br />
embedded DOS market and the personal workstation market.<br />
Embedded DOS Market<br />
At least one chip set vendor is pursuing embedded DOS applications as its primary<br />
strategy, and most others have thought about it as a secondary strategy but have not yet<br />
dedicated resources toward this market. The embedded DOS market can be defined as<br />
having applications that contain some form of keyboard (input device) and some sort of<br />
display (output device) that could benefit from the protocol of the DOS PC logic<br />
interface. These applications tend to be for low-end PC logic products. Examples are<br />
vending machines, traffic controllers, process controllers, communications, and medical<br />
and analytical instrumentation.<br />
Personal Workstation Market<br />
As the high-end personal computer products approach the functionality of low-end<br />
workstation products, a segment is developing that some have called the personal<br />
workstation market. With the introduction of the Intel 80486 and i860 microprocessors,<br />
opportunities exist to develop high-end chip sets that will combine the use of<br />
complex-instruction-set computer (CISC) and reduced-instruction-set computer (RISC)<br />
microprocessors to offer a system that will run both DOS and UNIX applications. One<br />
chip set vendor already has announced plans to develop a RISC chip set.<br />
This market is not well defined. Questions exist as to the size and viability of this<br />
segment, and standardization issues need to be resolved.<br />
ESAM Newsletter © 1989 Dataquest Incorporated May
DATAQUEST CONCLUSIONS<br />
The rapid initial growth rate of the DOS PC logic chip set market has invited many<br />
new entrants to this industry and has brought the market from infancy to saturation in a<br />
very short period of time. Although a change in product mix toward the high-end<br />
products will somewhat offset price declines over the next several years, pricing<br />
pressure will be considerable. This will cause some vendors to exit this market<br />
altogether and others to dedicate resources to seeking out new applications for these<br />
products. Vendors with access to low-cost foundries, appropriate design tools and<br />
expertise, and high-quality global sales organizations will stand the best chance of<br />
success.<br />
(This document is reprinted with the permission of Dataquest's Semiconductor<br />
Industry Service.)<br />
Jennifer Berg<br />
Ken Pearl man<br />
© 1989 Dataquest Incorporated May ESAM Newsletter
mm<br />
-mm Dataqyest<br />
acompanyof<br />
The Dun & nradstieet Corporation<br />
Research Newsletter<br />
SUMMARY<br />
ESAM Code: Volume II, Newsletters<br />
1989-11<br />
0004016<br />
WILL THE JAPANESE OWN THE 3.5-INCH RIGID MARKET?<br />
As of the end of 1988, no Japanese companies were credited with as much as<br />
10 percent of the sales of the world's 3.5-inch rigid disk drives. This statistic probably<br />
will come as a surprise to most readers because Japan has effectively captured large<br />
shares of computer storage-related commodity markets.<br />
This newsletter will examine the reasons behind the slowness of the Japanese in<br />
capturing this lucrative market. We will also lay out a time table for a reversal of the<br />
situation and the inexorable loss of one more U.S. market.<br />
BACKGROUND<br />
The first warning that we were about to lose the floppy disk drive (FDD) market<br />
should have been when the Japanese sewing machine industry (also once an American<br />
stronghold) converted its factories to the automated manufacture of 5.25-inch floppy<br />
drives. The U.S. drive-makers gave up and relinquished the FDD market to the low-cost<br />
assemblers. Today, no volume FDD factories are located in the United States, whereas,<br />
in 1981, 80 percent of these products bore the Made In USA label.<br />
The large Japanese system companies also have kept pace with U.S. drive companies<br />
on rigid disk drives (RDDs), and are largely self-sufficient through captive production of<br />
8- to 14-inch diameter products. Some of these drives have been well-accepted by OEM<br />
buyers around the world, with Fujitsu, NEC, and Hitachi often showing up as leaders in<br />
the high-capacity segments of the market. This Japanese leadership has not, however,<br />
excluded the U.S. firms, and the market has been fairly evenly divided around the world.<br />
With the advent of the 5.25-inch RDD in 1980, it looked very much as if Americans<br />
might have found a new product where they could establish their leadership and maintain<br />
it for a long period of time. So far, the U.S. companies' market shares continue to<br />
exceed 80 percent. Unfortunately, however, only a small portion of the world's<br />
5.25-inch disk drives are actually manufactured in the United States; most of these<br />
drives are coming from the Asian Rim where manufacturing costs can be minimized.<br />
© 1989 Dataquest Incorporated May—Reproduction Prohibited<br />
The content cfthis report represents our interpretation and analysis cfir^rmation generally available to the public or released by responsible individuals in the subject companies, but<br />
is not guaranteed as to accuracy or completeness. It does not contain material provided to us in confidence by our clients. Individiud amipanies reported on and analy^ by Datatjuest<br />
may be clients cfthis and/or other Dataquest services. This inprmatitm is notfitmished in connection with a sale or t^r to sell securities or in connection with the solicitation of an<br />
c^r to buy securities. This firm and its parent andlor their t^cers, stockholders, or members of their families may, from time to time, have a long or short position in the securities<br />
mentioned and may sell or buy such securities.<br />
Dataquest Incorporated, 1290 Ridder Park Drive, San Jose, CA 95131-2398 / (408) 437-8000 / Telex 171973 / Fax (408) 437-0292
Experienced disk drive producers were the first to enter the 3.5-inch business, with<br />
initial units coming from American factories. As volumes increased, however,<br />
competitive pressures forced a rapid move to off-shore production facilities. Today,<br />
90 percent of the 3.5-inch products are made by U.S. companies but are produced outside<br />
of the United States.<br />
SO WHAT'S THE ALARM?<br />
Even though the Japanese have so far been unable to make their presence felt in the<br />
3.5-inch market, nearly one-third of all these products are manufactured in Japan.<br />
Whoops. . . . We have lost it again.<br />
IBM has proven to be the world leader in 3.5-inch drive production from its factory<br />
in Fujisawa, Japan, where nearly 2 million units were made in 1988. The other U.S.<br />
company with drives coming from Japan is Quantum. Through a manufacturing<br />
relationship with Matsushita Kotobuki, Quantum and its subsidiary. Plus Development,<br />
are prepared to produce more than a million of these devices in 1989. The<br />
differentiating feature of the products from IBM and Quantum is their exceptional<br />
quality and reliability.<br />
IBM's production is predominantly for captive use in the PS/2 desktop computers,<br />
although an increasing number of these little drives are showing up in the OEM and retail<br />
distribution channels. The luxury of having a captive requirement to fortify production<br />
economy-of-scale keeps IBM able to be price competitive in the distribution market.<br />
Quantum's products are positioned in the high-performance, high-quality market<br />
and command a premium price. This extra revenue can be used to offset the dollar-yen<br />
imbalance and higher labor costs for a short period of time, but Matsushita Kotobuki<br />
probably will move offshore in order to be competitive in the future.<br />
Although LaPine Technology established a manufacturing agreement with Kyocera<br />
to produce commodity 3.5-inch drives, the costs were high and the business relationship<br />
was tenuous. Kyocera is now left on its own and the lawyers will make more money on<br />
the venture than either of the principals.<br />
THE DOMINOS WILL FALL<br />
We have examined the American companies now leading the 3.5-inch fray and their<br />
movement into Japan for production. But what of the Japanese producers themselves?<br />
The Japanese jumped into the 3.5-inch market in 1985 with Alps Electric, Epson,<br />
Fuji Electric, JVC, and NEC Information Systems the first to compete. By the time<br />
these companies had determined a worldwide sales strategy, they found they were not<br />
competitive. The U.S. marketeers had already established effective distribution<br />
channels and pricing policies with their 5.25-inch products, and the Japanese found<br />
themselves out-classed. Most of these Japanese companies have now retreated to their<br />
own country and to key OEM relationships with major electronic manufacturers.<br />
© 1989 Dataquest Incorporated May ESAM Newsletter
#<br />
We believe that the situation in 1989 will differ from that of 1985 in the following<br />
areas:<br />
• The worldwide 3.5-inch RDD market will exceed 10 million units in 1989.<br />
• The worldwide factory revenue available to 3.5-inch RDD sellers will approach<br />
$4 billion in 1989.<br />
In other words, it has now become an interesting business for manufacturers of<br />
high-quality, commodity products.<br />
Recently, we have seen announcements of, or have heard rumors regarding, a series<br />
of new products soon to be offered by major Japanese disk drive vendors. Most of these<br />
companies are vertically integrated manufacturers of components for 3.5-inch rigid<br />
drives, and most of them have demonstrated previous expertise in manufacturing<br />
automation techniques. What we are about to see is a logical extension of the<br />
capabilities we knew were there. Japan is ready to roll.<br />
Matsushita Communications, better known in the United States as Panasonic, has<br />
constructed an awesome, robotically controlled factory for the assembly and test of<br />
3.5-inch RDDs, with an estimated capacity of at least 100,000 units per month. Already<br />
shipping 100-Mbyte drives to Maxtor for remarketing, Panasonic has entered into a<br />
joint-development relationship with Priam for new, high-capacity drives. The team that<br />
designed the impressive Priam 760-Mbyte, 5.25-inch product is working on the next<br />
Panasonic family of drives.<br />
Sony Corporation has not been effective in the RDD market but continues to offer<br />
noteworthy 3.5-inch FDD products. Sony owns a proprietary thin-film-media process<br />
and could easily become a world force in the high-density media market. This<br />
electronics giant has quietly entered the 3.5-inch RDD wars with products meeting or<br />
exceeding most of those available from U.S. companies. A long-standing relationship<br />
with Apple Computer has provided a built-in customer for volume purchases of drives.<br />
Dataquest anticipates that Sony will shortly offer a broad range of drives with between<br />
40 and 200 Mbytes and access times well below 20 milliseconds.<br />
Fujitsu has already announced SCSI-interfaced, 3.5-inch drives in the 100- to<br />
200-Mbyte range, with access times in the 20-millisecond range. Matsushita Kotobuki is<br />
marketing the Quantum drives in Japan through Matsushita Electronics (in competition<br />
with Matsushita Communications). The manufacturing giant, Alps Electric, is known to<br />
be developing low-cost OEM devices with superior specifications. It is only a matter of<br />
a few months before other respected Japanese drive companies gear up for combat in<br />
this market.<br />
DATAQUEST CONCLUSIONS<br />
We are approaching a period when U.S. leaders such as Miniscribe, Western Digital,<br />
Conner, Quantum, and Seagate will expand their facilities to meet the intramural<br />
competition, showing little regard for the sleeping giant that is about to absorb the<br />
3.5-inch RDD industry. A quick look over the shoulder might be appropriate at this time.<br />
ESAM Newsletter © 1989 Dataquest Incorporated May
The Japanese may well make further moves into the Asian Rim countries to further<br />
reduce manufacturing costs. In fact, there seems to be continued interest in U.S.<br />
factories for Japanese vendors. It is not the currency imbalance that is dictating these<br />
moves because most of the large corporations can profitably weather an exchange rate<br />
of 110 yen/dollar.<br />
American industry leaders can do little to slow the inevitable. Caution in<br />
technology exchanges, awareness of coming competition, and continued searches for the<br />
best low-cost, high-quality manufacturing situation are the only protective measures<br />
available. Partnerships are unavoidable and will become more commonplace.<br />
The struggle will be to retain a reasonable market share for the U.S. drive business.<br />
The futures of many companies are tied to the outcome of this global industrial struggle,<br />
and, once again, the resolution is unlikely to be in the favor of the incumbent.<br />
(This document is reprinted with the permission of Dataquest's Semiconductor<br />
Application Market Service.)<br />
Jennifer Berg<br />
Terrance A. Birkholz<br />
© 1989 Dataquest Incorporated May ESAM Newsletter
I>ataQiiest<br />
acompuiyof<br />
The Dun & Bradsticct Corporation<br />
Research Newsletter<br />
SUMMARY<br />
CT2—A RISING STAR IN EUROPE<br />
ESAM Code: Volume II, Newsletters<br />
1989-10<br />
0003915<br />
In this newsletter, Dataquest will examine the equipment and semiconductor<br />
markets that the new CT2 digital cordless telephone technologies will drive. We will<br />
develop two contrasting but feasible scenarios, an "upside" and a "downside," to assess<br />
the markets for the applications that will follow.<br />
CT2 will allow users to make calls onto the public telephone network using portable<br />
handsets that will be both very compact and very inexpensive compared with cellular<br />
telephones. Calls must be made from fixed points. These may be private places, such as<br />
homes and offices, or public locations, such as airports, stations, and main streets.<br />
Tariffs for use of the public CT2 "telepoint" services will be smaller than existing<br />
cellular ones, and reflect the lower levels of investment per subscriber needed to set up<br />
a static cordless network compared with a mobile cellular one.<br />
A common air interface (CAI) standard has recently been developed for CT2 that<br />
will transform the cordless telephone into a universal tool for use in homes, offices, and<br />
public places throughout Europe. We expect CT2 handsets to reach the market two years<br />
before CT2's rival, the technically superior Digital European Cordless Telephone (DECT)<br />
standard, is finalized.<br />
In the upside example, we assume that the market for CT2 handsets will be driven<br />
mainly by a strong take-up of telepoint services across Europe. These services will allow<br />
subscribers to place calls on the public telephone network from pocket-size handsets,<br />
provided they are within about 100 meters of a public base station. Following trials in<br />
each country, telepoint is likely.to begin using the CAI standard in at least five European<br />
countries: Finland, France, Spain, the United Kingdom, and West Germany. In this<br />
scenario, we estimate that there will be 16 million CT2 handsets in Europe by 1995, or<br />
1 handset per 8 households. From this information, we estimate the total European<br />
market for CT2 equipment to be worth $334 million in 1991, rising to $1.2 billion by<br />
1995. By the year 2000, the cordless telephone will have become as much a part of<br />
everyday life as the hand calculator is today.<br />
The downside version takes a pessimistic view of the uptake of telepoint systems in<br />
Europe, restricting them to only the United Kingdom and France. Using this perspective,<br />
we estimate the total European market for CT2 equipment to be worth $75 million in<br />
1991, rising to $666 million by 1995, driven mainly by the demand for office and<br />
home-based CT2 systems.<br />
© 1989 Dataquest Incorporated July—Reproduction Prohibited<br />
77K amtent of this report represeras our interprvtatum and emafysis cfir^rmation ^neralty available to the public or released by responsible iruUviduals in the subject amipanies, but<br />
is ruH guararueed as to accuracy or completeness It does r\ot ctmtain material provided to us in cm^idence by our clients. Itkiividual companies reported on and analyzed by Dataquest<br />
may be clients cfthis and/or other Dataquest services. This ir^mruition is notjumished in atrmection with a sale or qffir to sell securities or in amnection with the solicitation of an<br />
c^r to btcy securities This firm and Us parent
CORDLESS STANDARDS<br />
CT2 cordless technology developments have been most prolific in the United<br />
Kingdom, with six different applications for standards submitted to the United<br />
Kingdom's Department of Trade and Industry (DTI) by early 1988. To overcome these<br />
conflicts, a single CAI specification since has been developed by seven UK<br />
companies—British Telecom, Ferranti, OPT, Mercury, Orbitel, Shaye, and STC—under<br />
the guidance of the DTI.<br />
After three public consultative meetings attended by manufacturers and operators<br />
from most European countries, the DTI now has frozen the CAI to make it the basis of a<br />
memorandum of understanding (MOU) between several countries for a roaming telepoint<br />
service in Europe. These countries are likely to include Finland, France, Spain, the<br />
United Kingdom, and West Germany, and may also include others such as Ireland, Italy,<br />
and Portugal if consumers accept the telepoint system.<br />
The CAI standard outlines the minimum specifications necessary to permit handsets<br />
to interwork on a public telepoint or private network, yet afford manufacturers the<br />
maximum opportunity to differentiate and enhance their products with special<br />
functions. The following key features may be deduced from the CAI document:<br />
• High call density—CAI provides for dynamic allocation of 40 100-kHz<br />
channels that span 864 to 868 MHz, compared with a fixed allocation of<br />
8 channels for CTl. With its low transmit power levels (ImW and lOmW), CAI<br />
is expected to permit an active call density of at least 2,000 calls/km^,<br />
• Compactness and lightness—CAI handsets will consume less power than CTl<br />
or cellular handsets and consequently will require smaller batteries. Use of<br />
the UHF radio frequency band will allow the handset to enclose the antenna,<br />
making it easy to hold in a hand or stow in a pocket.<br />
• Bidirectional call capability—The CAI standard allows handsets to both<br />
receive calls from and send calls to nearby base stations. However, the United<br />
Kingdom's telepoint operators are licensed only to provide their subscribers<br />
with outgoing call capability.<br />
• Digital transmission—In either direction, the CAI provides an average usable<br />
rate of 32 kbps for speech coding according to the Consultative Committee on<br />
International Telephony and Telegraphy (CCITT) G.721 Adaptive Differential<br />
Pulse Code Modulation (ADPCM) recommendation.<br />
Cordless technology will remain in a state of continual change for some time. Like<br />
CTl, the CAI is not destined to become a European cordless standard.. However, it may<br />
become an Interim European Telecommunications Standard (lETS) while the European<br />
Telecommunications Standards Institute (ETSI) works on the more advanced DECT<br />
standard. DECT uses a different method to transmit data and is expected to provide at<br />
least five-times-greater call density than CT2, but it will not be finalized until<br />
mid-1991—after CT2 has received consumer exposure in Europe. No compatibility is<br />
foreseen between CT2 and DECT equipment.<br />
© 1989 Dataquest Incorporated July ESAM Newsletter
APPLICATIONS<br />
CT2's new features will lead to many new products not technically or commercially<br />
feasible using current CTl or cellular radio technologies. Table 1 shows new applications<br />
envisaged for CT2 in the four main operating environments: home, office, public places,<br />
and mobile.<br />
CTl<br />
CT2<br />
DECT<br />
Cellular<br />
Table 1<br />
Suitability of CT2 Compared with Other Technologies<br />
by Application and Environment<br />
Home<br />
Single base<br />
station<br />
Single base<br />
station<br />
Single base<br />
station<br />
tr<br />
T<br />
Office<br />
Multiple base<br />
stations<br />
Multiple nested<br />
base stations<br />
Cordless PBX<br />
extension<br />
U<br />
Public Places<br />
T<br />
Telepoint<br />
handset<br />
Telepoint<br />
handset<br />
Portable<br />
handset<br />
T<br />
T<br />
T<br />
Mobile<br />
Mobile<br />
handset<br />
Note: T = technically not feasible; U s economically not feasible;<br />
CTl s first-generation analog cordless telephones, as used in the home<br />
today; CT2 s second-generation digital cordless telephones, to reach<br />
the market after mid-1989; DECT = third-generation DECT standards<br />
currently being developed by ETSI. Handsets are expected to reach<br />
the market after 1992.<br />
Source! Dataguest<br />
July 1989<br />
The first CT2 handsets (Shaye Communications' Forum and Ferranti's Zonephone)<br />
will go on sale in the United Kingdom this summer for use with the new telepoint<br />
services. These early handsets will use different and mutually incompatible standards,<br />
but will be superseded by handsets using the CAI standard after mid-1990.<br />
ESAM Newsletter<br />
© 1989 Dataquest Incorporated July
CT2's strengths reside in its applicability as a universal communicator that can be<br />
used in public places, in the office, and as a replacement for CTl units in the home.<br />
Little overlap is expected between the market for CT2 handsets and the market for<br />
cellular handsets. Homes and offices are places where the cellular application, with its<br />
low call density and high tariffs, will remain rarely used.<br />
TELEPOINT FOR ALL<br />
Telepoint services will be the main factor driving the demand for CT2 handsets,<br />
because they will be targeted to the largest possible group of end users—Europe's<br />
population of 267 million urban dwellers. During the first years, coverage will be limited<br />
to public places (shopping centers, airports, and railway stations) in major cities. For the<br />
five countries that are likely to participate in the MOU, this represents a smaller target<br />
population of 80 million people, or 32 million households.<br />
The level of penetration will depend on whether or not telepoint can win people's<br />
hearts and minds in the same way the Sony Walkman did in the early 1980s. For the<br />
personal communicator concept to succeed, the handsets must be sufficiently small and<br />
light, so as not to intrude upon everyday life. The Shaye handset, weighing less than<br />
130 grams (4.6 ozs)—just more than one-half the weight of the lightest cellular portable<br />
on the market today—does not yet conform to the CAI standard. We expect CAI<br />
handsets to weigh more at first, but to become progressively smaller, lighter, and less<br />
expensive as successive drives are made to reduce standard ICs into fewer custom parts.<br />
We forecast that .the CT2 handset will have become a mass consumer item retailing<br />
for about $140 by 1993, compared with at least $250 for the first proprietary CT2<br />
handsets expected to be launched by Shaye and Ferranti within the next few weeks.<br />
CT2 at Home<br />
The handset manufacturers also will offer domestic base stations that connect to a<br />
telephone socket in place of a normal telephone. They will resemble existing CTl base<br />
stations, but they will provide the following additional benefits:<br />
• More than one cordless handset for use with a base station<br />
• Improved speech quality<br />
• Prevention of illicit outgoing calls<br />
• Security from eavesdropping<br />
CT2 base units will retail separately for about $250 by early 1990, but one cannot<br />
help but wonder if private consumers will pay $500 for a complete CT2 handset/base<br />
station combination when CTl units can be purchased now for $150. Consequently, we<br />
do not expect the volume of CT2 home-base unit sales to match CTl unit sales until<br />
around 1993. By then, CT2 prices should be greatly reduced.<br />
4 © 1989 Dataquest Incorporated July ESAM Newsletter
CT2 in the Office<br />
Greater demand for CT2 base stations will come from the business market.<br />
However, CT2 is unlikely to support sufficient call density for use in large, densely<br />
packed office environments, which will limit it to small office environments.<br />
At least two manufacturers, GPT and STC, are expected to launch a range of<br />
standalone multiple-line cordless base stations in sizes ranging from 6 to 24 handsets.<br />
These will possess some PBX-like features such as individual extensions, call forwarding,<br />
and conference calling. A wide-area pager may be incorporated into some handset<br />
models, partly to overcome the telepoint restriction of making outgoing calls only.<br />
DATAQUEST ANALYSIS<br />
This is the beginning of a new market—a time when predictions are most difficult to<br />
make, but when, for investment purposes, they are most needed. The market for CT2<br />
semiconductors depends on the market for CT2 equipment which will, in turn, depend on<br />
how widespread telepoint usage becomes. Dataquest foresees three factors most critical<br />
for the success of a CT2-based telepoint service in Europe. These factors are as follows:<br />
• The CAI standard must succeed in becoming a European interim standard.<br />
This is a vital step toward the European PTTs recognizing and adopting it for<br />
telepoint use before DECT is finalized.<br />
• The cost of a telepoint call compared with a normal call is significant. In the<br />
United Kingdom, with heavy competition likely between the four licensed<br />
consortia, we expect telepoint to cost roughly twice as much as a normal<br />
telephone call. It is less clear if similar low tariffs will be adopted by the<br />
PTTs in the other European countries.<br />
• Handset prices must fall to about $140 by 1993 to make them affordable on a<br />
wide scale. The interest shown by many potential handset manufacturers,<br />
coupled with the several possibilities to reduce IC costs, suggests that this is<br />
achievable (as discussed later in this newsletter).<br />
We believe that the variability of these factors undermines the reliability of a single<br />
forecast. Instead, we present estimates for the CT2 equipment markets according to the<br />
two contrasting views outlined in the summary.<br />
ESAM Newsletter © 1989 Dataquest Incorporated July
The Upside Scenario<br />
Figure 1 shows a positive upside outlook for the unit sales of telepoint handsets in<br />
Europe, according to the upside perspective, which estimates a total installed base of<br />
16 million CT2 handsets in Europe by the end of 1995. This is based on the following<br />
assumptions:<br />
• The CT2 telepoint market will be in those countries expected to be party to<br />
the MOU—Finland, France, Spain, the United Kingdom, and West Germany.<br />
• One in three households located in the major cities of these countries will<br />
possess a single handset by the end of 1995.<br />
• Telepoint service subscriptions and call tariffs will be competitively priced in<br />
each country, so that a telepoint call will cost no more than double the price<br />
of an equivalent call placed through a normal payphone.<br />
• Strong price erosion will weaken the average selling price (ASP) of a telepoint<br />
handset from $250 in 1989 to $100 by 1995.<br />
• CT2 home base unit sales will match CTl sales by 1993.<br />
• By 1995, offices with PBXs of 100 lines or less will have reached a penetration<br />
of 1 in 10 installed lines.<br />
Millions of Units<br />
8-<br />
7<br />
6<br />
5<br />
4<br />
3<br />
2H<br />
1<br />
0<br />
upside<br />
Figure 1<br />
Estimated CT2 Hardset Shipments for Europe<br />
Upside and Downside Scenarios<br />
Downside<br />
1SS9 1990 1991 1992 1993 1994 1995<br />
0003915-1 Source: Dataquest<br />
July 1989<br />
© 1989 Dataquest Incorporated July ESAM Newsletter
We estimate that the total CT2 equipment market will rise from $334 million in<br />
1991 to $1.2 billion by 1995, a 38 percent compound annual growth rate (CAGR).<br />
Telepoint handsets will account for the largest proportion of this revenue with<br />
46 percent, followed by office handsets and base stations with 40 percent and home base<br />
stations with 14 percent.<br />
The Downside Scenario<br />
Figure 1 also presents a somber, yet conceivable, downside point of view for the unit<br />
sales of telepoint handsets in Europe if CT2 fails to win support from all but two<br />
European countries. We estimate that this would result in a total telepoint and office<br />
installed base of 4 million handsets in Europe by the end of 1995. Our assumptions<br />
are as follows:<br />
• Telepoint services will be adopted in the United Kingdom and France only.<br />
• One in 10 U.K. households located in major cities will possess a single handset<br />
by the end of 1995.<br />
• Late commencement of telepoint and less aggressive pricing by<br />
France-Telecom will result in only 1 in 20 French households in major cities<br />
possessing a single telepoint handset by the end of 1995.<br />
• Weaker price erosion will reduce the telepoint handset ASP from $250 in 1989<br />
to $150 by 1995.<br />
• CT2 home-base unit sales will match CTl unit sales by 1995..<br />
• There will be a lower penetration into small offices with PBXs of 100 lines or<br />
less, with cordless telephones attached to 1 in 20 of these lines by 1995.<br />
This outcome would lead to a total CT2 equipment market of $75 million in 1991,<br />
growing to $666 million by 1995 (72 percent CAGR). Office equipment would account<br />
for the greatest part of this market with 36 percent, followed by telepoint handsets with<br />
37 percent and home base stations with 27 percent.<br />
SEMICONDUCTOR CONSUMPTION<br />
Table 2 describes one typical integrated circuit (IC) breakdown for the first CAI<br />
handsets, which are expected to reach the market in early 1990. We estimate the total<br />
semiconductor content to be $51, giving an I/O ratio of 20 percent, which is high<br />
compared with that of other consumer electronic products.<br />
The expensive radio frequency (RF) hybrid receiver module is a major candidate for<br />
cost reduction, which could be accomplished by integrating it into one or two ICs.<br />
Funded by British Telecom, one leading U.K. IC vendor is believed to have accomplished<br />
this using zero intermediate frequency (IF) techniques to reduce the input stages to a<br />
single BiCMOS full-custom IC.<br />
ESAM Newsletter © 1989 Dataquest Incorporated July
Table 2<br />
Estimated Semiconductor Content for an Early CM CT2 Handset<br />
Function<br />
4-bit microcontroller<br />
with special features<br />
27256 UV EPROM<br />
Burst mode logic<br />
RF receive circuit<br />
G.721 ADPCM<br />
CODEC<br />
RF front end<br />
7-segment LCD driver<br />
Total Semiconductor Content<br />
Average Selling Price<br />
I/O Ratio<br />
Technology Cost<br />
Standard CMOS<br />
Standard CMOS<br />
CMOS ASIC(s)<br />
Bipolar hybrid<br />
Standard CMOS<br />
Standard CMOS<br />
RF MOSFET discretes<br />
Standard CMOS<br />
Source:<br />
$<br />
$<br />
3.50<br />
4.00<br />
3.50<br />
20.00<br />
14.00<br />
3.00<br />
1.70<br />
1.00<br />
50.70<br />
$250.00<br />
20.3%<br />
Dataquest<br />
July 1989<br />
Other opportunities exist to integrate standard parts (LCD driver, MCU,<br />
PLL/synthesizer, CODEC, ADPCM). For example, the integration of the standard<br />
CODEC and ADPCM parts into a single IC not only reduces IC count, but also eliminates<br />
unnecessary features, thereby reducing power consumption. Given a strong market, we<br />
estimate that these and other cost reductions will squeeze the semiconductor content to<br />
$29 by 1992, leading to a less expensive and more compact product. Figure 2 presents<br />
our estimation of the breakdown of IC revenue by CT2 equipment type in 1992, according<br />
to each point of view.<br />
$ © 1989 Dataquest Incorporated July ESAM Newsletter
0003915-2<br />
The Players<br />
Figure 2<br />
Estimated IC Consumption Breakdown by<br />
CT2 Equipment Type—1992<br />
Upside Scenario Downside Scenario<br />
Total = $88 Million<br />
Office<br />
Hands ats<br />
30%<br />
Home Base _\<br />
I Stations / \<br />
\ 19% / \<br />
\. / Office \<br />
\ / Handsets \<br />
\ / 12% \<br />
Telepoint Handsets /<br />
39% /<br />
Total = $28 Million<br />
Source: Dataquejt<br />
July 1989<br />
Our forecast of who the players will be in the CT2 equipment market is as follows:<br />
• First movers: Expected product announcements from second quarter of 1989<br />
to second quarter of 1990—Ferranti Creditphone, GEC-Plessey<br />
Telecommunications, Shaye Communications, STC Telecommunications<br />
• Later entrants: Possible announcements from third quarter of 1990—Alcatel,<br />
Autophon, Bosch, Crouzet, Ericsson, Matra, Motorola, NEC, Nokia-Mobira,<br />
Orbitel, Panasonic, Philip, Samsung, Sony, Uniden<br />
The first handsets, non-CAI and for the United Kingdom only, will be announced by<br />
Ferranti and Shaye within the next few weeks. CAI units will go on sale in mid-1990,<br />
and initially come from those companies that participated in the CAI's development last<br />
year. These companies will continue to derive some temporal advantage from the<br />
standard's ambiguity in certain areas, despite the fact that it has been public for some<br />
weeks. The combined production plan for these firms alone is aggressive, building from<br />
60,000 pieces per month in late 1990 to nearly 200,000 per month by 1992.<br />
In the longer term, considerable Far Eastern interest is expected because CT2 is<br />
attractive as a global consumer product, and because Japan is considering similar<br />
cordless telepoint networks. Their presence is likely to fragment the market from the<br />
beginning, with European manufacturers opting to develop higher-margin products for<br />
the office market, and Far Eastern companies supplying the consumer segment of<br />
products.<br />
ESAM Newsletter © 1989 Dataquest Incorporated July
DATAQUEST CONCLUSIONS<br />
CT2's main application will be handsets for use with telepoint services, but its<br />
technical strengths will make it suitable for use in office environments where CTl<br />
technology previously has failed. We expect CT2 handsets and base stations to make<br />
inroads mainly into small office environments, but the advent of cordless technology for<br />
large offices must await the arrival of DECT equipment in the early 1990s.<br />
One major future possibility is that CT2 or its DECT successor might provide an<br />
alternative to the local loop that connects local exchanges to subscribers' premises. This<br />
is most conceivable in the United Kingdom, where the local telecommunications<br />
regulatory body, Oftel, has already expressed its dqsire to further break British<br />
Telecom's near-total monopoly of the public telephone network. A removal of the<br />
restriction on its four telepoint operators prohibiting incoming calls would create an<br />
enormous new opportunity for these consortia, resulting in a significantly greater market<br />
for CT2 equipment in the United Kingdom than was forecast in either scenario.<br />
We believe that designers of CT2 handsets must avoid the temptation to target both<br />
telepoint and office users with the same product. The features sought by each group of<br />
users may prove mutually exclusive. Telepoint handsets will sell on the basis of<br />
compactness, style, and price, whereas office users will seek durability and functionality.<br />
Judging from the large number of interested players, we expect the telepoint<br />
market to be extremely competitive. Cost reduction through mass production will be<br />
critical for success. This will favor many of the powerful potential later entrants to the<br />
CT2 market that we identified earlier. In contrast, we expect the office markets to be<br />
more differentiated and to offer safer, albeit smaller, opportunities for the smaller first<br />
movers manufacturers to tailor CT2 equipment to individual PBXs and office systems.<br />
Jonathan Drazin<br />
10 © 1989 Dataquest Incorporated July ESAM Newsletter
Dataqyest<br />
aoMTipanyof<br />
Ine Dun KBradstiect Corpoiabon<br />
Research Newsletter<br />
SUMMARY<br />
EISA—WILL IT BE AN ALTERNATIVE FOR MCA?<br />
ESAM Code: Volume II, Newsletters<br />
1989-9<br />
0003655<br />
An alternative to IBM's microchannel architecture bus structure (MCA) was<br />
announced by a group of PC competitors on September 13, 1988. Support for the<br />
enhanced industry standard architecture (EISA) bus has been widely endorsed by PC<br />
vendors, hardware manufacturers, and software vendors.<br />
This announcement has caused a strong reaction in the marketplace, with<br />
uncertainty as to which architecture to support. Businesses need to plan for the future,<br />
and the issue of whether to purchase MCA systems now or wait for EISA systems to<br />
become available is an important one. Dataquest believes that there will be some clear<br />
winners and losers with the EISA announcement and that the end result will be two<br />
"standards" playing to a confused customer base in the short term and a single MCA<br />
standard in the long term.<br />
BACKGROUND<br />
EISA was started by several PC manufacturers, led by Compaq, that did not want to<br />
pay the royalties that IBM demanded for using its microchannel architecture. They have<br />
argued that IBM developed MCA as a strategy to increase its market share and to limit<br />
the number of manufacturers of PCs by increasing the barriers to entry for low-cost<br />
manufacturers. IBM has denied this, stating that the MCA bus was developed because of<br />
its technical superiority and its ability to meet future computing demands.<br />
At present, there is no product that uses the features of the MCA or EISA bus. The<br />
immediate requirement is for high-speed graphics, optical storage, scanners, distributed<br />
processing, LANs, and data base management to control the masses of paper that<br />
businesses must process in a single day.<br />
© 1989 Dataquest Incorporated April—Reproduction Prohibited<br />
The cont&u of this report rqjreseras our interpretaticm and analysis cfir^rmation generally available to the public or released by resportsible individuals in the subject companies, but<br />
is not guaranteed as to accuracy or completeness. It does not contain material provided to us in confidence by our dients Individucd companies report on and analy^ by Dataquest<br />
may be clients of this andlor other Data^/est services. This infi)rmatwn is not jiinushed in oynnection wUh a scde or offer to sell securities or in connection with the soticitatitM cf an<br />
The present ISA, or AT bus, is not capable of solving this requirement. As Bill<br />
Lowe, president of IBM Entry Systems Division, stated at last September's PCIS<br />
conference, the introduction of the EISA bus simply proves that a new bus structure is<br />
essential.<br />
Technically, both MCA and EISA can support the same applications. Although<br />
proponents of each group claim advantages for their own design, the real question is:<br />
Which bus structure will win or will they coexist?<br />
EISA<br />
EISA Delivery Time<br />
The EISA bus is in its evolutionary phase. A technical synopsis has been developed<br />
with an outline and goals stated, and each member of the consortium has listed its input<br />
and needs. Agreement has been reached as to the design of the connector used.<br />
According to the company hired by the consortium to administer the details, the finished<br />
specification is on target to be published sometime in the first quarter of this year.<br />
Work still must be done to generate the silicon, build prototypes, test and benchmark the<br />
system, and obtain agency approvals, among other things.<br />
Once PCs are introduced with the EISA bus, third-party manufacturers of add-in<br />
products will have a forum into which to sell their products. The board manufacturers'<br />
urgency to supply EISA boards will be limited to the size of this market. As EISA<br />
systems increase in the marketplace, third-party manufacturers will then allocate<br />
resources to service those systems. This delay in shipping EISA third-party boards can<br />
only boost MCA credibility.<br />
EISA's success will depend greatly upon the perception of when an extended bus is<br />
required. The sooner the MCA bus can demonstrate that it can satisfy new demands, the<br />
fewer buyers will wait for the EISA bus to become available. Companies are balancing<br />
today's applications with tomorrow's advances and making risk decisions as to which bus<br />
structure to follow. If a company buys a PC without the extended bus today and an<br />
application that requires the new bus becomes available before the life of the newly<br />
purchased PC is over, then it has lost. On the other hand, why make higher expenditures<br />
for PCs if they will not provide a higher payback?<br />
The average life of a PC is five years. Typically, older products are passed down to<br />
areas with no PCs, are discarded due to failure, or are sold to employees. A system<br />
purchased today, therefore, will perform the same tasks for its life. Dataquest believes<br />
that," perhaps as early as Fall 1989 Comdex, high-speed graphics cards, communications<br />
boards, and improved disk and I/O management products will be introduced. These<br />
products will use the MCA bus because it is the only extended bus architecture at<br />
present. This will immediately place the proponents of EISA in a catch-up mode.<br />
EISA Backward Compatibility<br />
According to its advocates, EISA's main advantage is its backward compatibility for<br />
the customer. Customers have large investments in LAN cards, communication boards,<br />
and peripheral products that can be moved to newly purchased systems.<br />
2 © 1989 Dataquest Incorporated April ESAM Newsletter
I Dataquest<br />
does not agree that this issue is strong enough to dis lade businesses from<br />
purchasing a different bus architecture, for the following reasons:<br />
• Because older systems are passed down intact to areas<br />
devoid of PCs, businesses do not have surplus boards avail<br />
• The new systems probably contain standard features that<br />
systems.<br />
• The third-party board manufacturers have added new fea<br />
their products, which makes upgrading attractive.<br />
These factors were amply demonstrated when the PC AT s:<br />
Imagine placing a 10MB, 85ms hard disk drive running on an 8-bit c<br />
or doing CAD/CAM with a CCA monitor driven by the original col<br />
save money.<br />
Although backward compatibility is feasible with EISA, Dataqi<br />
business environment, the bus layout will not significantly alter sz<br />
products, third-party boards, and peripherals are competitive!<br />
available. The total system price and the support product avail<br />
determine which product will sell.<br />
An important underlying issue is the question of who sets<br />
compatibility. Until now, IBM has been the standard, the<br />
clonemakers. IBM has had control over the direction of this indu<br />
market share. Will the EISA consortium, led by Compaq, be cap<br />
this tradition to establish and maintain a new standard? Whose EIS<br />
the compatibility standard for the other consortium members? N<br />
will it be the first EISA machine on the market {if it is not Compe<br />
in the ability of Compaq to lead and to maintain the support, coop<<br />
the consortium members.<br />
EISA Second Sources<br />
hat were previously<br />
)le.<br />
/ere options on older<br />
res and functions to<br />
cem was introduced.<br />
itroUer into the AT,<br />
• card in an effort to<br />
;t believes that in a<br />
:s—provided support<br />
priced and readily<br />
lility will ultimately<br />
2 standards for PC<br />
model for the PC<br />
ry, even as it loses<br />
)le of breaking from<br />
machine will define<br />
11 it be Compaq's or<br />
s)? The answer lies<br />
ation, and respect of<br />
Many companies selecting PCs prefer to have multiple J arces for the same<br />
product. The number of PC manufacturers supporting the EISA bi makes the EISA PC<br />
attractive for this reason. Dataquest believes that this is an espe ally critical area to<br />
watch—to ensure that the EISA bus is identical from one PC to ano er.<br />
The jjotential exists for one manufacturer to "improve" on<br />
market share, as in the case, for example, of expanded memory.<br />
companies developed an approach to use memory in protected n<br />
mode memory so that larger spreadsheets could be manipulated. 1<br />
this scheme, another company developed a similar but different s<br />
features. Now, both Expanded Memory System (EMS) and Enham<br />
System (EEMS) memory management techniques exist.<br />
ESAM Newsletter © 1989 Dataquest Incorporated Ap 1<br />
matures to leverage<br />
prominent group of<br />
ie to "stretch" real<br />
;tead of staying with<br />
leme with different<br />
d Expanded Memory
MCA<br />
MCA Delivery Time<br />
IBM has been shipping MCA bus PCs since April 1987. Dataquest estimates that<br />
1.5 million MCA-based systems will be installed by the end of 1988. Thus, companies<br />
that expect to have new applications for their PCs do not have to wait for a PC with the<br />
MCA bus to be developed.<br />
Dataquest believes that third-party manufacturers of application hardware initially<br />
will concentrate their resources on MCA-based PCs, simply because of the large<br />
marketplace into which they can sell product. Strong development of products using the<br />
MCA bus will place the EISA bus in a catch-up mode.<br />
MCA Backward Compatibility<br />
MCA's disadvantage is that is is not compatible with the nearly 33 million MS-DOS<br />
PCs shipped since 1983. However, Dataquest does not view this as a strong justification<br />
for not purchasing the MCA PC for the reasons stated earlier. Those reasons are: the<br />
requirement to use existing PCs intact, the desire to upgrade to the new features and<br />
functions offered by third-party boards, and the fact that certain features are now<br />
standard on new PCs.<br />
MCA Second Sources<br />
Several companies have announced plans to ship MCA PCs or have announced that<br />
they are already shipping them. These companies, which are members of the EISA<br />
consortium, have stated that, one way or another, they will satisfy the customer. The<br />
argument that there is only one vendor for MCA has therefore been eliminated.<br />
Apple's success is another illustration that shows the fallacy of the argument that<br />
companies are reluctant to purchase products from a sole source. Although it has a<br />
completely noncompatible bus and operating system and is the only company producing<br />
the product, Apple holds the number two spot behind IBM with an estimated 14.5 percent<br />
of the 1988 U.S. market.<br />
MARKET PARTICIPANTS<br />
To examine the success or failure of EISA or MCA, the participants must also be<br />
examined.<br />
4 © 1989 Dataquest Incorporated April ESAM Newsletter
IBM<br />
Dataquest believes that IBM holds the winning hand in this card game. It is in a<br />
good position to influence the outcome of the EISA/MCA challenge and can sway the<br />
business community to embrace MCA. Our analysis is based on the following factors:<br />
Compaq<br />
• EISA may not be available from PC manufacturers for 9 to 18 months. This<br />
gives IBM time to introduce products that can take advantage of MCA, and to<br />
establish a user base. The sooner useful MCA applications hit the market, the<br />
greater the market share MCA will capture.<br />
• Although it has stated that the royalty structure will remain in place, IBM<br />
always has the option of changing its mind, if it becomes beneficial.<br />
• Companies that have a universal cross-licensing agreement in place with IBM<br />
may not be required to pay the same royalty fees as companies that do not.<br />
This makes it more attractive for those companies to manufacture MCA-based<br />
PCs.<br />
• It is being debated whether EISA or MCA, in the current configurations and<br />
environment, is technically superior. We laelieve that the issue is really which<br />
architecture will perform best in the future.<br />
An expected requirement is the ability to expand to a 64-bit data path<br />
and handle processing speeds above 40 MHz.<br />
- ESIA will have problems with both the physical accommodation of a<br />
64-bit bus and the electrical noise associated with high-speed processors.<br />
- IBM has the time and the option to redesign the current MCA to<br />
eliminate the debate and to clearly differentiate performance before the<br />
first EISA machine is even shipped.<br />
• Most importantly, whereas MCA exists now, EISA is, at present, vaporware.<br />
Compaq Computer will hold an estimated 3.4 percent U.S. market share of personal<br />
computers shipped in 1988. Compaq is also the leader of the EISA consortium, and we<br />
believe that it holds enough market share and following to make EISA a viable product.<br />
It was the first company to introduce an 80386 PC and continues to be a leading force in<br />
the industry.<br />
Dataquest believes that Compaq will follow through and introduce EISA regardless<br />
of how the rest of the PC industry reacts to extended bus architectures. In fact,<br />
Compaq has announced that, as of April 21, it will sever its relationship with<br />
Businessland. Businessland has stated that it may back only MCA technology; although<br />
Compaq denies that this caused the rift, many analysts believe otherwise.<br />
ESAM Newsletter © 1989 Dataquest Incorporated April
EISA Consortium<br />
Dataquest believes that the EISA Consortium is very serious. It is well organized<br />
and well supported by the members. Nevertheless, it faces an uphill battle against MCA<br />
with obstacles that IBM will exploit at every opportunity.<br />
The first obstacle is that the EISA standard is being formed by a group of<br />
competitors anxious to increase their own market shares in an extremely competitive<br />
market. Even with the common interest of EISA, it is hard to believe that any group of<br />
competitors with a common goal will stay together. Any fragmentation in the ranks will<br />
be quickly noted by IBM.<br />
A second obstacle is one of economics. Members of the EISA consortium will hedge<br />
their bets and will develop, or already have developed, MCA PCs, and will actively<br />
market them. This is partially because of the effort they have already put into cloning<br />
MCA systems and partially because of the fear of being caught without an extended<br />
architecture product if EISA stalls. Tandy, for example, is shipping MCA products now.<br />
John Roach, president and CEO of Tandy, stated at Dataquest's PCIS Conference that he<br />
would be ready to satisfy his customers whether they wanted MCA or EISA product. Dell<br />
also has announced that it has MCA systems. Companies with MCA systems that are<br />
shipping now, or will be very shortly, are ALR, Dell, Mitac, Olivetti, and Tandy.<br />
The Winners and the Losers<br />
The Winners<br />
Dataquest believes that, provided Apple Computer can capitalize on its stable<br />
NuBus platform, it will be a clear winner as a result of the chaos caused by multiple PC<br />
bus standards. Corporations vacillating between the Apple and the IBM product will<br />
purchase Apple because it has a viable 32-bit bus technology without competitive<br />
confusion. Other winners will be the third-party board manufacturers that will sell their<br />
products to both buses—MCA and EISA. Board vendors view the two standards as<br />
expanded opportunities. They see the MCA and EISA markets as a larger total market<br />
that offers increased opportunities for selling their products. Certainly, Microsoft will<br />
win as it is hardware independent and will sell products to both MCA and EISA-based<br />
PCs.<br />
The Losers<br />
The losers will be the public, which ultimately will pay the price for this confusion,<br />
and the manufacturers, which must invest limited funds into both standards. Designing<br />
two products is costly because of development time, distribution and revision changes,<br />
service, and repair.<br />
DATAQUEST CONCLUSIONS<br />
Dataquest thinks that IBM will react strongly to the introduction of EISA in the<br />
following ways:<br />
• Introducing applications—possibly at Fall 1989 Comdex—that use the unique<br />
characteristics of the microchannel architecture<br />
6 © 1989 Dataquest Incorporated April ESAM Newsletter
• Encouraging companies with cross-licensing agreements to introduce MCA<br />
products quickly and offering assistance to third-party vendors in order to<br />
increase the use of MCA<br />
• Squeezing PC-clone vendors by lowering prices to make MCA PCs more<br />
attractive<br />
• Seizing every opportunity to discredit the viability of EISA, as members of the<br />
EISA group introduce MCA products<br />
However, Dataquest believes that IBM will reduce its licensing fees for MCA<br />
technology only as a last resort.<br />
In the near term, we expect sales of MCA-based PCs to increase because of the<br />
creditability given to a new bus structure by the PC-clone manufacturers. In our<br />
opinion, IBM's influence, EISA's late entry, and fragmentation within the EISA ranks will<br />
hinder the acceptance of EISA systems. Compaq's strong influence and determination<br />
ensure that MCA systems and EISA systems will coexist in the market, at least in the<br />
intermediate term, with MCA products gaining market share as other vendors offer MCA<br />
systems. EISA will survive as a bridge, to extend the use of the current installed base of<br />
XT and AT machines. In the long term, however, Dataquest believes that EISA will not<br />
meet the challenge of future performance and expandability requirements and that this<br />
market will become a shrinking niche market, serviced by only a few surviving vendors.<br />
(The majority of this document was originally published by Dataquest's Personal<br />
Computer Industry Service and is reprinted with its permission.)<br />
ESAM Newsletter © 1989 Dataquest Incorporated April<br />
Jennifer Berg<br />
Robert Charlton
Dataquest<br />
Conference Schedule<br />
1989<br />
Semiconductor User/<br />
Semiconductor Application Markets<br />
Japanese Components<br />
Computer Storage<br />
Document Processing<br />
Copiers<br />
Printers<br />
Electronic Publishing<br />
Imaging Supplies<br />
Color<br />
SEMICON/West Seminar<br />
Telecommunications<br />
European Components<br />
Asian Semiconductor and<br />
Electronics Technology Seminar<br />
Financial Services<br />
Technical Computing and<br />
Applications<br />
European Copying<br />
and Duplicating<br />
Western European Printer<br />
Taiwan Conference<br />
Distributed Processing *<br />
SIA/Dataquest<br />
Joint Conference<br />
Information Systems<br />
Semiconductor<br />
Asian Semiconductor and<br />
Electronics Technology<br />
European Telecommunications<br />
European Personal Computer<br />
February 27-28<br />
April 20-21<br />
April 26-28<br />
May 16-18<br />
May 16-17<br />
May 16-17<br />
May 18<br />
May 18<br />
May 18<br />
May 24<br />
June 5-7<br />
June 7-9<br />
June 28<br />
August 22-23<br />
September 11-13<br />
September 18-19<br />
September 20-22<br />
September 25-26<br />
September 26-28<br />
September 27<br />
October 2-6<br />
October 16-18<br />
November 2-3<br />
November 8-10<br />
December 6-8<br />
Le Meridien Hotel<br />
San Francisco, California<br />
Tokyo Bay Hilton International<br />
Tokyo, Japan<br />
The Doubletree Hotel<br />
Santa Clara, California<br />
Monterey Sheraton Hotel<br />
Monterey, California<br />
The Dunfey Hotel<br />
San Mateo, California<br />
Silverado Country Club<br />
Napa, California<br />
Park Hilton<br />
Munich, West Germany<br />
Radisson Hotel<br />
San Jose, California<br />
The Doubletree Hotel<br />
Santa Clara, California<br />
The Doubletree Hotel<br />
Santa Clara, California<br />
Majestic Hotel<br />
Cannes, France<br />
Majestic Hotel<br />
Cannes, France<br />
Grand Hotel<br />
Taipei, Taiwan<br />
The Doubletree Hotel<br />
Santa Clara, California<br />
Santa Clara Marriott<br />
Santa Clara, California<br />
Tokyo American Club<br />
Tokyo, Japan<br />
Monterey Sheraton Hotel<br />
Monterey, California<br />
Kunlun Hotel<br />
Beijing, China<br />
Grand Hotel<br />
Paris, France<br />
Athens, Greece
Dataquest<br />
I jcHupdnypT<br />
i TtirDunVwxbdiRtCovponbon<br />
Research Newsletter<br />
INTRODUCTION<br />
ESAM Code: Volume II, Newsletters<br />
1989-8<br />
0003656<br />
EUROPE—A HEALTHY MARKETPLACE FOR UNIX<br />
The Western European UNIX market is developing rapidly and becoming an<br />
increasingly significant part of the European computer market as a whole. In 1987, total<br />
Western European computer shipments amounted to $22.4 billion. Of this, $2.6 billion<br />
were UNIX systems, accounting for 12 percent of the market. The UNIX systems<br />
distribution by country is shown in Figure 1.<br />
0003656-1<br />
Figure 1<br />
European UNIX Computer Shipments<br />
by Country<br />
1987<br />
Total - $2.6 Billion<br />
Source: Dataquest<br />
April 1989<br />
© 1989 Dataquest Incorporated April—Reproduction Prohibited<br />
The amtent cf^iis repeal represeros our interpretation and analysis ofir^rmation genendly available to ^ public or released by responsible individuals in the subject cvrnpanies, but<br />
is not guaranteed as to accuracy or completeness. It does not contain material provided to us in cor^dence by our dients- individual companies report^ on and analyzed by Dataquest<br />
may be clients qf^is and/or other Dataquest services. This ir^trmation is notfiinushed in connection Mith a sale or q^r to sell securities or in amnection with the solicitation c^an<br />
c^r U) Imy securities. This firm and its parent and/or their cheers, stockholders, or members of ^ir families may, from time to time, have a bmg or short position in the securities<br />
mentioned and may sell or buy sudi securities.<br />
Dataquest Incorporated, 1290 Ridder Park Drive, San Jose, CA 95131-2398 / (408) 437-8000 / Telex 171973 / Fax (408) 437-0292
Background<br />
The UNIX penetration into Europe largely has followed the historic path of the<br />
introduction of Information Technology there. For example, the United Kingdom is the<br />
favorite entrance point for U.S. technology. As a result, the United Kingdom has<br />
21 percent of the Western European UNIX market, but only 17 percent of computer<br />
shipments as a whole, with particularly strong presence in the small department<br />
computers (SDCs) sector. (See Attachment A for Dataquest's computer market<br />
definitions.) Despite the United Kingdom's early development, it is now Germany that<br />
leads Europe in UNIX systems shipments with 27 percent. This is mainly because of the<br />
heavy promotion of UNIX on Siemens' systems over the last two years, primarily in the<br />
work group (WG) computers marketplace. While France's position in the UNIX market is<br />
very similar to its position in the market as a whole. Southern Europe has been slower to<br />
adopt UNIX; in particular, the Italian market has fallen behind, with only 8 percent of<br />
UNIX shipments compared with 13 percent of the total market. Dataquest expects the<br />
Italian market to adopt UNIX as a standard over the next few years.<br />
MARKET OVERVIEW<br />
The structure of the UNIX market is determined by the nature of the machines<br />
running the operating system. As can be seen in Figure 2, UNIX systems shipments show<br />
a very different profile than the computer market as a whole. The most dramatic<br />
difference is in the corporate resource computers (CRCs). Whereas these constitute<br />
41 percent of 1987 shipment value for the market as a whole, only 2 percent of UNIX<br />
systems revenue came from this segment. Very few large systems run UNIX; the<br />
exceptions are mostly supercomputers that have average systems values of twice the<br />
norm. Even the business unit computers (BUCs), which constitute 12 percent of the total<br />
market revenue, have only 5 percent of the UNIX market. On the other hand,<br />
single-user enhanced (SUE) systems have 26 percent of the UNIX market, though they<br />
constitute only 4 percent of the total market.<br />
CRCs and BUCs constitute 53 percent of the total market but only 7 percent of the<br />
UNIX market. The high-value CRC market is dominated by IBM with a share of more<br />
than 55 percent, increasing to two-thirds of the market if IBM compatibles are included.<br />
UNIX usually operates as a guest operating system in the CRC market, so IBM's major<br />
revenue base is not threatened by UNIX. However, the CRC market is not forecast to<br />
grow as fast as midrange systems.<br />
© 1989 Dataquest Incorporated April ESAM Newsletter
0003656-2<br />
Major Participants<br />
Figure 2<br />
European Computer Market and UNDC Market by Segment<br />
1987<br />
UNIX Market<br />
Total - $2.6 Billion<br />
Total Market<br />
Total - $22.4 Billion<br />
Source: Dataquest<br />
April 1989<br />
Figure 3 shows the major participants in the UNIX market. The largest vendor is<br />
Hewlett-Packard (HP), mainly because of its technical workstation sales. In this<br />
category, HP has a 36 percent share. HP's sales of large department computers (LDCs)<br />
are also significant; its market share is twice the size of any other company in this<br />
group. Although HP has a significant presence in most European countries, it is<br />
particularly strong in Germany. HP's strong commitment to UNIX is evident by its<br />
investment in a RISC-based architecture optimized for running UNIX. With 42 percent<br />
of the company's shipments currently being UNIX systems, it is in a strong position to<br />
benefit from future UNIX market growth.<br />
HP's strength in Germany has helped that country become the largest in the<br />
European UNIX marketplace, but the major reason has been Siemens' use of UNIX in its<br />
line of departmental systems. More than 70 percent of Siemens' UNIX revenue comes<br />
from the WG sector, where it has a third of the European market, and the rest from<br />
SDCs. However, fully 70 percent of the company's sales have been in Germany.<br />
Digital Equipment Corporation's UNIX penetration is spread throughout Europe<br />
mainly because of its midrange systems strength. More than 10 percent of VAXs run<br />
Ultrix; however, this means that nearly 90 percent of VAXs are running VMS, to which<br />
Digital remains heavily committed. This accounts for Digital's cautious approach to<br />
UNIX, while embracing open systems developments.<br />
ESAM Newsletter © 1989 Dataquest Incorporated April
Figure 3<br />
European UNIX Computer Shipments by Vendor Market Share<br />
1987<br />
Olivetti<br />
5% j<br />
00036S6-3<br />
Sun ^~~~~—ii<br />
^"^——-"—'p<br />
Altos - ^ /<br />
6%^/ /<br />
Others<br />
41%<br />
\^ Apollo / 1 \<br />
\ ^'^ / 1 Digital<br />
\ / Siemens i5%<br />
\C 10%<br />
Total - $2.6 Billion<br />
HP<br />
14%<br />
Source: Dataquest<br />
April 1989<br />
Altos is a UNIX specialist, supplying UNIX systems at the lower end of the market.<br />
The majority of these are in the WG sector, where Altos is the only significant<br />
competitor to Siemens in Germany, and the rest in the SDC sector, where Altos is the<br />
leading supplier in the United Kingdom. Altos's share of the UNIX market inevitably will<br />
fall as the other major vendors grow their UNIX bases.<br />
Sun's 6 percent share of the UNIX market falls entirely within the SUE sector where<br />
it has a quarter of the market. This is a sector in which the company competes with<br />
HP; whereas HP dominates in Italy and Germany, Sun has the largest share in France<br />
and the United Kingdom. Apollo, Digital, and other vendors are also aiming for the SUE<br />
market and are standardizing on UNIX.<br />
Olivetti's strength in the UNIX market is in departmental systems, particularly the<br />
SDCs, where it has more than half of the Italian market. The company's commitment to<br />
UNIX started with the AT&T SB systems and now includes the LSX line. It supplies both<br />
its own proprietary operating system (MOS) and UNIX on the LSX line. New applications<br />
are being developed for the UNIX environment, while MOS users are offered a growth<br />
path from their current systems to LSX. Olivetti also sells an AT&T version of UNIX on<br />
its SB Series. In fact, these systems represented all of Olivetti's UNIX sales in 1987. In<br />
1988 and beyond, the SB Series will be phased out in favor of the LSX Series.<br />
NCR, like Altos and Siemens, is prominent mainly in the SDC and WG sectors of the<br />
UNIX market. Its presence in the SDC market is particularly significant in Scandinavia<br />
where the Tower system is selling well. In the WG market, it is the largest UNIX<br />
supplier in France, Italy, and the United Kingdom.<br />
4 © 1989 Dataquest Incorporated April ESAM Newsletter
A GROWING MARKET<br />
The significance of the UNIX marketplace to the major systems vendors is clearly<br />
shown in Figure 4. The total Western European computer systems market is expected to<br />
grow at an 8 percent compound average growth rate (CAGR) between 1987 and 1991.<br />
For UNIX systems shipments, the equivalent figure is 25 percent. By 1991, the total<br />
systems market will likely be worth $31 billion and the UNIX market $6 billion, which<br />
means that the UNIX systems share of the market will increase from 12 to 19 percent, as<br />
can be seen in Figure 5.<br />
Market Share<br />
40-<br />
35~<br />
30<br />
25<br />
20<br />
IS<br />
10-j<br />
5<br />
0<br />
00036S6-4<br />
lC%^<br />
^<br />
f^S<br />
'sS-i'*''<br />
I IBM<br />
Figure 4<br />
Selected Vendors' Share of Systems Shipped<br />
Total Market and UNIX Only<br />
1987<br />
NX<br />
Siemens Digital Bull Unisys ICL<br />
ESAM Newsletter © 1989 Dataquest Incorporated April<br />
Total Market<br />
UNIX Market<br />
Source: Dataquest<br />
April 1989
1987 Total<br />
$22.4 Billion<br />
Figure 5<br />
UNIX Systems' Share of Total Systems Market<br />
1987 and 1991<br />
1991 Total<br />
$31.0 Billion<br />
00036S6-S Source; Dataquest<br />
April 1989<br />
UNIX is primarily used on low-end and midrange systems. These systems are<br />
expected to show higher growth than larger systems in the next few years. The<br />
proportion of these systems running UNIX is expected to increase. These factors result<br />
in a forecast growth rate of 25 percent for UNIX systems. UNIX therefore is highly<br />
attractive to the many vendors who are finding it difficult to maintain high levels of<br />
growth.<br />
Much of the activity in the UNIX market will be concentrated around IBM and<br />
Digital sites, since they have very large customer bases in the European market. Many<br />
of their large users will see UNIX as a means to compatibility, portability, and a wider<br />
choice of software with less dependence on any one supplier. This is a threat to IBM and<br />
Digital. Third-party solutions are essential to penetrate vertical markets, and<br />
third-party software developers are attracted to the UNIX environment for similar<br />
reasons to the users. Nevertheless, IBM and Digital are large enough to attract large<br />
numbers of third parties for their proprietary AS/400 and VAX architectures. Other<br />
systems vendors in the main are turning to UNIX as a means to participate in the<br />
fast-growing midrange market.<br />
Sales Channels<br />
Two key factors in the UNIX marketplace are therefore vertical markets and the<br />
use of third-party sales channels. The use of third-party channels will greatly aid niche<br />
market penetration and enhance vendors' vertical market strengths. It is also apparent<br />
that there will be a different rate of acceptance of UNIX in the different industry<br />
markets.<br />
6 © 1989 Dataquest Incorporated April - ESAM Newsletter
TECHNICAL WORKSTATIONS<br />
Substantial benefits are to be had from penetrating particular market segments<br />
effectively. Figure 6 shows the vendor shares of the technical workstation market,<br />
which is particularly significant as it is a very fast-moving and fast-growing market. Of<br />
the total end-user market value of $0.8 billion, more than 75 percent is UNIX-based.<br />
From 1987 to 1992 the total market is expected to grow in revenue at a CAGR of nearly<br />
32 percent. With the average 1987 unit price value falling to less than one-third during<br />
this time, the unit shipment growth runs at more than a 60 percent CAGR.<br />
HP is the technical workstation market leader. Apollo also has achieved significant<br />
penetration, mainly through its vertical market emphasis. However, it is estimated that<br />
Sun, with more than double Apollo's UNIX shipments, took over second place in 1988 and<br />
is challenging HP for leadership. Digital is also rising fast in this market, although most<br />
of its technical workstation shipments have not been UNIX-, but VMS-based, to be used<br />
by its very large VMS user base. Both HP and Digital are benefiting from their<br />
third-party reseller networks through which many technical workstations are sold; HP in<br />
particular is doing relatively better in Europe than in the United States.<br />
Figure 6<br />
Western European Technical Workstation Market<br />
by Vendor Market Share<br />
1987<br />
Sun<br />
19%<br />
Apollo<br />
24%<br />
y Digital<br />
\ 13%<br />
Others \<br />
17% \<br />
HP /<br />
27% /<br />
Total - $0.8 Billion<br />
0003656-6 Source: Dataquest<br />
ESAM Newsletter © 1989 Dataquest Incorporated April
DATAQUEST ANALYSIS<br />
The issue of UNIX standards also will affect the future market growth. The greater<br />
the development of common standards, the greater the portability of UNIX—its major<br />
selling point. Standards are derived through industry development and vendor<br />
agreement, such as the X/Open initiative.<br />
Considerable disarray exists in the UNIX standards arena at the moment, along with<br />
considerable controversy about the control of the development of the UNIX standard.<br />
AT&T's reluctance to give up control of the standard resulted in the formation of the<br />
Open Systems Foundation (OSF). However, many significant vendors chose not to join<br />
OSF for a variety of reasons including the choice of the precise version of UNIX to be<br />
the basis of OSF's standard. Recently, most if not all major systems vendors that were<br />
not active in OSF have come together in an alternative grouping code-named Archer.<br />
AT&T is part of Archer,<br />
DATAQUEST CONCLUSIONS<br />
The key difference between the two forces attempting to shape future UNIX<br />
standards is that they have chosen different versions of UNIX. It is nevertheless hoped<br />
that they will reach a compromise as no doubt exists that there is very strong demand<br />
for a single UNIX standard. Failure to provide a single standard will undoubtedly hinder<br />
growth in the UNIX market.<br />
(This document is reprinted with the permission of Dataquest's European Computer<br />
Industry Service.)<br />
Bipin Parmar<br />
Philippe de Marcillac<br />
&; © 1989 Dataquest Incorporated April ESAM Newsletter
Attachment A<br />
The Dataquest market segment definitions are as follows:<br />
• Corporate resource computers (CRCs)<br />
- These systems are large-scale computers capable of supporting more<br />
than 128 concurrent users and supporting the central data processing<br />
needs of a large organization or the needs of a smaller number of users<br />
performing computationally intensive applications.<br />
CRCs require the support of dedicated personnel.<br />
- Current pricing typically exceeds $1 million.<br />
• Business unit computers (BUCs)<br />
- These systems are medium- to large-scale computers that typically<br />
support from 65 to 128 concurrent users and serve the data processing<br />
needs of a large business unit or organization, or they serve the central<br />
data processing needs of a smaller organization with equivalent<br />
requirements.<br />
BUC systems may also support a smaller number of users engaged in<br />
computationally intensive applications.<br />
- BUC systems require limited support personnel.<br />
- Current pricing typically ranges from $150,000 to $1 million.<br />
• Large department computers (LDCs)<br />
- These systems are medium-scale computers that typically support from<br />
21 to 64 concurrent users and serve the data processing needs of a large<br />
department in a large organization or the central data processing needs<br />
of a smaller organization with equivalent requirements.<br />
- They also may s.upport a smaller number of users performing<br />
computationally intensive applications.<br />
- LDC systems require limited support personnel.<br />
Current pricing typically ranges from $75,000 to $250,000.<br />
ESAM Newsletter - © 1989 Dataquest Incorporated April
• Small department computers (SDCs)<br />
- These systems are small- to medium-scale computers that typically<br />
support from 11 to 20 concurrent users and serve the data processing<br />
needs of a department in a large organization or the central data<br />
processing needs of a small organization with equivalent requirements.<br />
- They may also support a smaller number of users performing computationally<br />
intensive applications.<br />
- SDC systems usually require no dedicated support personnel.<br />
Current pricing typically ranges from $25,000 to $75,000.<br />
• Work group computers (WGCs)<br />
These systems are small-scale computers that typically support from<br />
2 to 10 concurrent users.<br />
- They have resident multiuser capability and are commonly referred to as<br />
multiuser microcomputers.<br />
These systems require no dedicated support personnel.<br />
Work group computer systems are typically priced at less than $25,000.<br />
• Single-user enhanced (SUE)<br />
- These systems are standalone general-purpose systems with integrated<br />
graphics and extensive network interfaces.<br />
- They support only a single user.<br />
Technical computer systems are segmented by product into the following categories:<br />
• Supercomputers<br />
Supercomputers are designed for extremely high-speed mathematical<br />
computation and optimized to perform vector mathematics.<br />
- They must perform scientific applications using 64-bit floating-point<br />
arithmetic at peak speeds of 100 raflops or higher.<br />
- Supercomputers are typically priced between $1 and $20 million.<br />
10 - © 1989 Dataquest Incorporated April ESAM Newsletter
Minisupercomputers<br />
Minisupercomputers are designed for high-speed mathematical<br />
computation, and most have the architecture to perform vector<br />
mathematics.<br />
Minisupercomputers must perform some scientific applications using 60or<br />
64-bit floating-point arithmetic at a speed at least one-fourth that of<br />
a Cray-l/S.<br />
Mainframes<br />
Pricing typically ranges between $300,000 and $2 million.<br />
- Mainframes have at least a 32-bit CPU and I/O structure with very large<br />
capability.<br />
- They are typically priced at more than $500,000 and are designed for<br />
batch processing or a large number of users.<br />
- Mainframes support a large number of disks and tapes.<br />
Superminicomputers<br />
- Superminicomputers have a CPU-to-memory data path and a CPU bit<br />
width greater than 24 bits (usually 32 bits).<br />
They are priced between $20,000 and $600,000.<br />
Technical workstations<br />
- Technical workstations are complete standalone general-purpose systems<br />
or distributed network-based systems that contain integrated networking<br />
capabilities in the operating system.<br />
- Technical workstations contain graphics controllers integrated on the<br />
system bus.<br />
- They have a resident operating system and local programming capability,<br />
and they are typically priced at less than $75,000.<br />
This category fits directly into the single-user enhanced computer<br />
system market segment.<br />
ESAM Newsletter © 1989 Dataquest Incorporated April 11
DataQuest<br />
Conference Schedule<br />
1989<br />
Semiconductor User/<br />
Semiconductor Application Markets<br />
Japanese Components<br />
Computer Storage<br />
Document Processing<br />
Copiers<br />
Printers<br />
Electronic Publishing<br />
Imaging Supplies<br />
Color<br />
SEMICON/West Seminar<br />
Telecommunications<br />
European Components<br />
Asian Semiconductor and<br />
Electronics Technology Seminar<br />
Financial Services<br />
Technical Computing and<br />
Applications<br />
European Copying<br />
- and Duplicating<br />
Western European Printer<br />
Taiwan Conference<br />
Distributed Processing<br />
SIA/Dataquest<br />
Joint Conference<br />
Information Systems<br />
Semiconductor<br />
Asian Semiconductor and<br />
Electronics Technology<br />
European Telecommunications<br />
European Personal Computer<br />
February 27-28<br />
April 20-21<br />
April 26-28<br />
May 16-18<br />
May 16-17<br />
May 16-17<br />
May 18<br />
May 18<br />
May 18<br />
May 24<br />
June 5-7<br />
June 7-9<br />
June 28<br />
August 22-23<br />
September 11-13<br />
September 18-19<br />
September 20-22<br />
September 25-26<br />
September 26-28<br />
September 27<br />
October 2-6<br />
October 16-18<br />
November 2-3<br />
November 8-10<br />
December 6-8<br />
Le Meridien Hotel<br />
San Francisco, California<br />
Tokyo Bay Hilton International<br />
Tokyo, Japan<br />
The Doubletree Hotel<br />
Santa Clara, California<br />
Monterey Sheraton Hotel<br />
Monterey, California<br />
The Dunfey Hotel<br />
San Mateo, California<br />
Silverado Country Club<br />
Napa, California<br />
Park Hilton<br />
Munich, West Germany<br />
Radisson Hotel<br />
San Jose, California<br />
The Doubletree Hotel<br />
Santa Clara, California<br />
The Doubletree Hotel<br />
Santa Clara, California<br />
Majestic Hotel<br />
Cannes, France<br />
Majestic Hotel<br />
Cannes, France<br />
Grand Hotel<br />
Taipei, Taiwan<br />
The Doubletree Hotel<br />
Santa Clara, California<br />
Santa Clara Marriott<br />
Santa Clara, California<br />
Tokyo American Club<br />
Tokyo, Japan<br />
Monterey Sheraton Hotel<br />
Monter^, California<br />
Kunlun Hotel<br />
Beijing, China<br />
Grand Hotel<br />
Paris. France<br />
Athens. Greece
Dataoyest<br />
acon^nyof<br />
The Dun & Uadsticet Corporabon<br />
Research Newsletter<br />
SUMMARY<br />
ESAM Code: Newsletters<br />
1989-7<br />
0002294<br />
EUROPEAN PERSONAL COMPUTER PRODUCTION AND ITS IMPACT<br />
ON THE SEMICONDUCTOR MARKET<br />
European personal computer (PC) production continued to increase substantially in<br />
1988, by 42 percent in unit terms. This was reflected in the rise of semiconductor<br />
consumption. The total semiconductor market in Europe reached $8,355 million in 1988,<br />
and Dataquest estimates that PC manufacturers consumed $955 million of this total,<br />
representing 11.4 percent.<br />
This newsletter examines PC production and its impact on the semiconductor<br />
market with particular emphasis on:<br />
• the effect of DRAM shortages and price increases<br />
• expanding manufacturing locations within Europe<br />
• semiconductor content in PCs<br />
• future trends in semiconductor consumption by the PC sector.<br />
INCREASED PRODUCTION DESPITE MEMORY SHORTAGES<br />
Most personal computer manufacturers increased their unit production in 1988,<br />
despite the now well-publicized shortages of DRAM memories, and the resulting price<br />
increases. Table 1 shows Dataquest's estimates of unit PC production in Europe from<br />
1986 to 1988 by different PC type.<br />
Unit production of the old 8086/88-based machine continued to increase at a rate of<br />
43 percent over 1987, and represents the largest PC platform. We expect the 286-based<br />
machine to overtake 8086/88-based machines in 1989. The 286-based machines saw a<br />
32 percent growth in unit production in 1988, while 386-based machines are now coming<br />
of age, with an estimated 1988 unit production of 167,000, a huge 568 percent increase<br />
over 1987. We expect this trend to continue in 1989, with the official release of OS/2<br />
operating system "software. In 1988 most 386-based machines were used for network<br />
controllers, and file servers, as very few OS/2 software applications were available at<br />
this time.<br />
© 1989 Dataquest Incorporated March—Reproduction Prohibited<br />
The content of this report represents our interpretation and analysis of mfi^rmation generally available to the public or released by responsible individuals in the subject avnpanies, but<br />
is ntx guaranteed as to accuracy or completeness. It does not contain material provided to us in confidence by our clients. Individual companies reported on and analyzed by Dataquest<br />
may be clients of this and/or other Dataquest services. This ir^rmation is notjumished in connection witii a sale or qffir to sell securities or in connection with the solicitation cfan<br />
q^r to buy securities. This firm and its parent arui/or their c^icers, stodcholders, or members of their fimiilies may, from time to time, have a long or short position in the securities<br />
mentioned and may sell or buy such securities.<br />
Dataquest Incorporated, 1290 Ridder Park Drive, San Jose, CA 95131-2398 / (408) 437-8000 / Telex 171973 / Fax (408) 437-0292
8086/88<br />
286<br />
386<br />
Non-compatible<br />
NA = Not Applicable<br />
Table 1<br />
Estimated Unit PC Production in Europe<br />
(Thousands of Units)<br />
1986<br />
957<br />
538<br />
NA<br />
288<br />
1987<br />
1,112<br />
815<br />
25<br />
333<br />
1988<br />
1,593<br />
1,072<br />
167<br />
404<br />
1987/88<br />
Growth<br />
43%<br />
32%<br />
568%<br />
21%<br />
Total 1,783 2,285 3,236 42%<br />
Source: Dataquest<br />
March 1989<br />
European PC production now provides over 60 percent of the local PC market. We<br />
would have expected a growth higher than 43 percent in unit PC production in 1988, had<br />
it not been for the DRAM shortages and price increases which badly affected several<br />
manufacturers in both production and reduced operating margins.<br />
HIVE OF VENDOR ACTIVITY<br />
IBM, Olivetti, and Apple are the leading PC manufacturers in Europe, and they all<br />
increased production in 1988 over 1987. Apple's production facility in Cork, Ireland is<br />
close to full capacity. Hewlett-Packard has greatly increased production at its Grenoble<br />
facility, while Zenith has also increased production at its Irish plant, and similarly NCR<br />
at its facility in Augsburg, West Germany. Table 2 provides preliminary estimates of<br />
unit production by major vendor and PC type for 1988.<br />
Some vendors are going through a transition phase; either switching over to newer<br />
models or reassessing their market positions. Siemens and Nixdorf are at the stage<br />
where increased sales are a must to ensure viability of their local production. Bull is now<br />
integrating its business with that of Honeywell's PC business. ICL appears to have an<br />
unclear strategy and is well behind Apricot and a rapidly rising star. Research Machines,<br />
United Kingdom.<br />
We have included Amstrad and Commodore in our market estimates of<br />
manufacturers as they purchase semiconductors locally in Europe, even though the PC<br />
manufacturing is done in the Far East. Acorn, who subcontracts its production, has<br />
shown a considerable growth, particularly in its RISC architecture model, the<br />
Archimedes, of which we estimate 15,000 were produced in 1988 out of the total 70,000<br />
PCs produced by the company.<br />
© 1989 Dataquest Incorporated March ESAM Newsletter
1 IBM<br />
2 Olivetti<br />
3 Amstrad<br />
4 Apple<br />
5 Hewlett-Packard<br />
6 Commodore<br />
7 Zenith<br />
8 Tulip<br />
9 Bull<br />
10 Acorn<br />
Others<br />
Total<br />
NA = Not Applicable<br />
Table 2<br />
Total Estimated 1988 European PC Unit Production<br />
by Leading PC Manufacturers<br />
8086/88<br />
350,000<br />
350,000<br />
332,000<br />
NA<br />
104,000<br />
44,250<br />
94,500<br />
35,000<br />
38,000<br />
NA<br />
245.250<br />
286<br />
440,000<br />
200,000<br />
16,000<br />
NA<br />
45,000<br />
14,000<br />
15,870<br />
28,000<br />
32,000<br />
NA<br />
281.250<br />
1,593,000 1,072,120<br />
386 Non-comp Total<br />
60,000<br />
15,000<br />
2,000<br />
NA<br />
1,000<br />
NA<br />
6,230<br />
15,000<br />
5,000<br />
NA<br />
NA<br />
NA<br />
NA<br />
260,000<br />
NA<br />
64,000<br />
NA<br />
NA<br />
NA<br />
70,000<br />
850,000<br />
565,000<br />
350,000<br />
260,000<br />
150,000<br />
122,250<br />
116,600<br />
78,000<br />
75,000<br />
70,000<br />
63.420 10.000 599.920<br />
167,650 404,000 3,236,770<br />
Source: Dataquest<br />
March 1989<br />
Dataquest has noticed some new trends where small manufacturers such as Kontron<br />
and Olympia are supplying OEM PCs to the industrial market. Olympia, which is owned<br />
by Daimler Benz via AEG, will increase production to satisfy the in-house needs of the<br />
holding company. Newcomers to the local production scene include Compaq and Sun in<br />
Scotland, Tandon in Austria, and Thomson, who will manufacture PCs in the old<br />
Nordmende TV factory in Germany. We have not included these four vendors in our<br />
estimates as they made no semiconductor purchases in 1988. One noticeable absentee<br />
from our list is Philips, who is a strong player in the market, but manufactures its PCs in<br />
Canada. Schneider, the former distributor of Amstrad in West Germany, will be included<br />
in our 1989 estimates; we believe that they produced 80,000 PCs in 1988, but did not<br />
purchase semiconductors from Europe.<br />
The Japanese Absence<br />
Japanese vendors are noticeable by their absence from our 1988 list of<br />
manufacturers. Fujitsu has started production in Spain, for OEM business, and Toshiba,<br />
the laptop PC leader, will begin manufacturing in Regensburg, Germany. We do not<br />
expect any local semiconductor purchases to be made for at least two years.<br />
As the 1992 open European market approaches, we expect to see more Japanese<br />
vendors moving their laptop production to Europe. The only laptop PC manufacturer<br />
currently in Europe is Goupil.<br />
ESAM Newsletter © 1989 Dataquest Incorporated March
ANALYSIS OF SEMICONDUCTOR CONTENT<br />
The average total semiconductor content in PCs has more than tripled in dollar<br />
terms since 1986. Table 3 shows our estimate of semiconductor content by dollar value<br />
and PC type. Clients of Dataquest's European Semiconductor Application Market<br />
(ESAM) segment will receive an in-depth PC service section, containing details of the<br />
PC models used for the anaysis in Table 3, giving type, quantity, and average selling<br />
price of semiconductors used per PC model. For example, the model used for calculating<br />
386 semiconductor content was the Compaq 386 Deskpro.<br />
NA = Not Applicable<br />
Table 3<br />
Average Semiconductor Content by PC Model<br />
8086/88<br />
286<br />
386<br />
Non-compatible<br />
ISM 1987 1988<br />
$150<br />
253<br />
NA<br />
15Q<br />
$ 196<br />
269<br />
1,034<br />
180<br />
$ 250<br />
354<br />
991<br />
138<br />
Total $553 $1,679 $1,733<br />
Semiconductor Consumption by PC Sector<br />
Source: Dataquest<br />
March 1989<br />
Table 4 shows Dataquest's estimates of total semiconductor consumption by the<br />
European personal computer market for 1986 through 1988. The total value of<br />
semiconductors used by European PC manufacturers rose to $955 million in 1988, almost<br />
doubling over 1987. This represented 11.4 percent of the total estimated semiconductor<br />
market of $8,355 million in Europe. Of the 94.5 percent increase in PC semiconductor<br />
demand, 42 percent resulted from increases in unit production, with the remaining<br />
52.5 percent due to price inflation caused by shortages of key memory and<br />
microprocessor devices. We expect the price of DRAMs to come down to a more stable<br />
level in 1989 and expect to see a slower growth in demand for PC semiconductors in<br />
terms of dollar revenues.<br />
Our preliminary analysis shows that 58 percent of all DRAMs sold in 1988 were<br />
consumed by the PC sector. These figures do not include an additional 10 percent of<br />
demand from related PC add-on board manufacturers. Clearly DRAMs are overexposed<br />
in this equipment market, a precarious situation that can easily result in a repeat of the<br />
1984 scenario of ROM memory in the video game market.<br />
© 1989 Dataquest Incorporated March ESAM Newsletter
Table 4<br />
Estimated Total Semiconductor Consumption by Personal Computer Market<br />
pillions of Dollars)<br />
NA = Not Applicable<br />
8086/88<br />
286<br />
386<br />
Non-compatible<br />
12M 19S2 19M<br />
$143<br />
136<br />
NA<br />
21<br />
$217<br />
220<br />
26<br />
28<br />
$398<br />
380<br />
165<br />
12<br />
Total $300 $491 $955<br />
Source: Dataquest<br />
March 1989<br />
We were surprised at the comparatively low level of microprocessor exposure in the<br />
PC market in Europe, where 23 percent of the 1988 microprocessor total available<br />
market (TAM) went into the PC sector. This is due to the more balanced nature of the<br />
European market where the use of microprocessors is spread over other market sectors<br />
such as telecoms and industrial. Although exposure at the market level is relatively low,<br />
some vendors are overexposed in the PC sector.<br />
Major vendors to the PC sector could be severely jolted by even a slight downturn in<br />
the PC market, due to factors such as:<br />
• Price erosion in the market caused by additional plant capacity<br />
• Inventory build-up at the dealer network<br />
• Confusion about different bus standards for newer PC models<br />
• A general slowdown in economic activity.<br />
Following the general industry trend, ASIC and application-specific standard<br />
products (ASSP) devices are rapidly cannibalizing the bipolar standard logic and<br />
microprocessor peripheral TAM. The microprocessor peripheral TAM in the PC sector<br />
has fallen from 39.8 percent of the total TAM in 1986 to 24.4 percent in 1988, while the<br />
ASIC and ASSP TAM in the PC sector rose from almost zero in 1986 to 16.9 percent in<br />
1988.<br />
ESAM Newsletter © 1989 Dataquest Incorporated March
FUTURE TRENDS<br />
The advent of markets for PCs, local area networks (LANs), disk controllers and<br />
graphics chip sets, together with single in-line memory modules (SIMM) using 4-Mb<br />
DRAM and higher-speed processors, will result in a highly integrated motherboard<br />
design. Most PC vendors currently facing increased margin pressure on their standard<br />
hardware platforms have been exploring new ways of adding further value to their<br />
boxes. The higher integration of the motherboard provides additional room for adding<br />
extra features and will permit a degree of product differentiation in the overcrowded<br />
market. Some PC vendors will incorporate PS/2, AT-compatible disk controller ICs on<br />
the motherboard, while some disk drive manufacturers will incorporate the controller<br />
board electronics via highly integrated VLSI chip sets inside the drive itself.<br />
Dataquest expects a high explosion in the LAN market for PCs. Currently LANs are<br />
provided by a multitude of small vendors, but we expect further integration of LAN chip<br />
sets to be offered as standard features on the motherboard. Other features which will be<br />
integrated on future motherboards are modems, faxes, and high-end graphics chip sets,<br />
providing new product differentiation.<br />
CONCLUSIONS<br />
The European personal computer market now forms a critical driving force behind<br />
growth in the semiconductor market. It consumed almost 12 percent of the 1988<br />
European semiconductor TAM, up from 8.2 percent in 1987. This was due both to<br />
increases in unit production and to price rises in key semiconductor memories and<br />
microprocessors. We expect the recent price increases to stabilize. The demand for<br />
semiconductors in the PC sector will continue to grow, as more use is made of highly<br />
integrated chip sets.<br />
Bipin Parmar<br />
© 1989 Dataquest Incorporated March ESAM Newsletter
DataQuest<br />
aoMiipamrof<br />
The Dun 8L Bradsbcct Corporation<br />
Research Newsletter<br />
SUMMARY<br />
REGIONAL REVIEW 1989--A YEAR OF CONSOLIDATION<br />
ESAM Code: Newsletters<br />
1989-6<br />
0002293<br />
In 1988 the European semiconductor market experienced strong growth fueled by a<br />
healthy personal computer demand and subsequent price increases, particularly in DRAM<br />
and SRAM components. Dataquest predicts that the high growth experienced in 1988<br />
will be followed by a year of consolidation in 1989. Production rates in the data<br />
processing segment have slowed, and prices are expected to decrease in the areas of<br />
MOS memory and MOS microprocessor components. The European semiconductor<br />
market is forecast to grow by 8.6 percent in 1989.<br />
This newsletter outlines the reasons for growth in each of the European regions in<br />
1988 and 1989. It pays particular attention to application trends and addresses the<br />
impact that the "Single Europe Act" in 1992 is already having on these regional markets.<br />
The key points are highlighted below:<br />
• The United Kingdom and Ireland once again outgrew West Germany in 1988.<br />
The two regions are now of almost equal size in Europe. The U.K. and Ireland<br />
market is forecast to grow at 11.0 percent in 1989 to become the largest<br />
region in Europe at $2,475 million.<br />
• Rest of Europe experienced the largest growth of all the regions in 1988,<br />
driven by the high percentage growth in semiconductor consumption in Spain<br />
and Portugal. Rest of Europe will continue to exhibit growth well above the<br />
market average, growing 20.1 percent in 1989 to $829 million.<br />
• West Germany grew the least of all the European regions in 1988 when<br />
measured in both dollars and local currency. West Germany is forecast to<br />
grow at 6.7 percent in 1989, approximately 2 percent below the total market<br />
growth.<br />
• Italy will grow slightly in 1989 at 2.0 percent, having exhibited a 49.4 percent<br />
local currency growth in 1988.<br />
Table 1 summarizes the regional growth analysis for 1988 and 1989 and Figure 1<br />
shows the forecast percentage market share of each region in 1988 and 1989.<br />
© 1989 Dataquest Incorporated March—Reproduction Prohibited<br />
The content of this report repres&^s our interpretation and analysis cf information generally available to the public or released by responsible individuals in the subject companies, but<br />
is not guaranteed as to accumcy or completeness. It does not contain material provided to us in amfidence by our clients. Individual ampanies reported on and analyz&i by Dataquest<br />
may be clients of this and/or other Dataquest services. This infimruuion is notfitmished in connection with a sale or offer to sell securities or in amnection with the solicitation
Benelux<br />
France<br />
Italy<br />
Scandinavia<br />
U.K. & Ireland<br />
West Germany<br />
Rest of Europe<br />
Total Europe<br />
U.K. and Ireland 26.2%<br />
France 14.2%<br />
1987<br />
$407<br />
940<br />
660<br />
458<br />
1,570<br />
1,890<br />
430<br />
$6,355<br />
Table 1<br />
European Regional Growth Analysis<br />
(Millions of Dollars)<br />
1988<br />
$504<br />
1,210<br />
982<br />
625<br />
2,230<br />
2,250<br />
690<br />
$8,491<br />
1989<br />
$532<br />
1,303<br />
1,002<br />
681<br />
2,475<br />
2,399<br />
829<br />
$9,221<br />
Figure 1<br />
Dollar<br />
1987-88<br />
23.8%<br />
28.7%<br />
48.8%<br />
36.5%<br />
42.0%<br />
19.0%<br />
60.5%<br />
33.6%<br />
European Regional Market Share 1988-1989<br />
(Millions of Dollars)<br />
Italy 11.6%<br />
1988<br />
$8,491 Million<br />
West Germany 26.5%<br />
West Germany 26.0%<br />
Benelux 6.0%<br />
Scandinavia 7.4% France 14.1%<br />
Rest of Europe 8.1%<br />
Growth<br />
1988-89<br />
5.5%<br />
7.7%<br />
2.0%<br />
9.0%<br />
11.0%<br />
6.7%<br />
20.1%<br />
8.6%<br />
llHly10.9%<br />
1989<br />
$9,221 Million<br />
Local Currency<br />
Growth<br />
1987-88 1988-89<br />
21.8%<br />
27.7%<br />
49.4%<br />
32.3%<br />
30.6%<br />
16.4%<br />
52.5%<br />
29.2%<br />
5.5%<br />
7.7%<br />
2.0%<br />
9.0%<br />
11.0%<br />
6.7%<br />
20.1%<br />
8.6%<br />
Source: Dataquest<br />
March 1989<br />
U.K. and Ireland 26.8%<br />
Benelux 5.8%<br />
Scandinavia 7.4%<br />
Rest of Europe 9.0%<br />
Source: Dataquest<br />
March 1989<br />
© 1989 Dataquest Incorporated March ESAM Newsletter<br />
i
REGIONAL SEMICONDUCTOR ANALYSIS<br />
Dataquest's European semiconductor consumption forecast for 1989 shows Europe<br />
growing 8.6 percent over 1988. In 1989 the European market will be worth $9,221 million.<br />
Benelux<br />
In 1988 the Benelux semiconductor market was estimated to be worth $504 million.<br />
This represented a local currency growth of 21.8 percent over 1987. The main source of<br />
this growth was from the telecoms segment. Demand from Alcatel/Bell Telephone was<br />
particularly strong as a result of the company's strong sales to Mexico and China. An<br />
increase in PC production assist the region, along with memory and microprocessor<br />
device price inflation due to shortages. However, the large consumer total available<br />
market (TAM) was significantly impacted by Philips moving production of its compact<br />
disk player to the Far East.<br />
The outlook in 1989 for Benelux is one of lower than average growth at 5.5 percent.<br />
With the absence of compact disk player production from the consumer segment the<br />
outlook is flat compared to 1988. The data processing sector will decline through<br />
reduced PC production and price erosion on MOS memories and microprocessor devices.<br />
Growth will again be fueled by Alcatel/Bell Telephone, and to some extent Siemens/GTE<br />
in the telecoms segment.<br />
France<br />
The French semiconductor market grew by 27.7 percent in local currency in 1988.<br />
This was slightly below the European market average of 29.2 percent local currency<br />
growth. The telecoms segment, which represents a major part of the region's<br />
semiconductor demand, grew marginally. The production rate of Minitel, the French<br />
videotex system, virtually halved compared to 1987. Demand for telephone switching<br />
exchanges was low and this significantly reduced semiconductor demand from Alcatel.<br />
The data processing and transportation segments were the driving forces behind the<br />
overall growth.<br />
In 1989 the French market is forecast to grow by 7.7 percent over 1988 to<br />
$1,303 million. The telecoms segment will continue to be affected by reduced demand<br />
for switching equipment and Minitel equipment. However, France Telecom's strenuous<br />
efforts to drive ISDN will stimulate new demand in the telecoms segment. The fastest<br />
growing segments will be transportation and consumer. PSU, the electronic component<br />
division of the Peugeot Citroen Group, is considerably expanding its consumption of<br />
semiconductors, while consumer demand from Thomson is expected to be high. The data<br />
processing segment will experience low growth; Bull is still in a phase of restructuring;<br />
this, coupled with price erosion in MOS memories and microprocessors, leads us to<br />
expect to see only modest growth in the data processing segment.<br />
ESAM Newsletter © 1989 Dataquest Incorporated March
Italy<br />
The Italian market exhibited the second highest local currency growth of the seven<br />
European regions in 1988. It reached $982 million growing at 49.4 percent in local<br />
currency compared to 1987. The data processing and transportation markets exhibited<br />
very strong growth. In the data processing segment Olivetti had a bumper year, though<br />
the growth in dollar demand was obviously exaggerated by memory and microprocessor<br />
price increases. Marelli Autronica, the electronic components division of Fiat, did<br />
exceptionally well in 1988. This in turn drove a large demand for ASIC and smart power<br />
components.<br />
Following dramatic growth in 1988, the Italian semiconductor market is expected to<br />
show a below-average growth of 2.0 percent in 1989, pushing the market size to<br />
$1,002 million. This slower growth will be due to a decline in demand from the data<br />
processing segment, coupled with price decreases in memories and microprocessors as<br />
excess inventories are burned off.<br />
Scandinavia<br />
Although Norway and Denmark both experienced modest growth, the positive<br />
market conditions in Sweden and Finland resulted in Scandinavia growing at 32.3 percent<br />
in local currency for 1988. In Finland, Nokia represents a large portion of the market,<br />
and Nokia's consumer division, Salora, had a particularly good year. Sweden, the largest<br />
of the Nordic countries, saw Ericsson's telecoms business grow well. The distribution<br />
market in Sweden also showed positive growth of 25.0 percent after three years of flat<br />
and declining consumption.<br />
In 1989 Scandinavia is expected to have a positive growth of 9.0 percent over 1988,<br />
due to the positive outlook for Ericsson and Nokia in the telecoms, data processing, and<br />
consumer segments. This will boost the Scandinavian semiconductor market to<br />
$681 million in 1989.<br />
United Kingdom and Ireland<br />
The U.K. and Irish semiconductor market grew slightly above the European average<br />
at 30.6 percent local currency growth for 1988, reaching $2,230 million. The high<br />
demand for PCs in the U.K. market was a major contributor to the semiconductor<br />
market growth. This, coupled with the increase in prices for MOS memories and the<br />
higher average selling price (ASP) for 32-bit microprocessors, drove the market. The<br />
promises of the "Single Europe Act" and the imposition of import tariffs on Japanese<br />
printers and office equipment by the EEC during 1988 is starting to have a positive<br />
effect the semiconductor TAM, particularly in the U.K. and Ireland market. A number<br />
of Japanese and U.S. companies have either set up or announced plans to set up factories<br />
in the United Kingdom and Ireland. These manufacturers included NEC, Compaq, Oki,<br />
Citizen, Sun, and Sanyo.<br />
4 © 1989 Dataquest Incorporated March ESAM Newsletter
The U.K. and Ireland semiconductor market is forecast to grow by 11.0 percent in<br />
1989. With this growth it will become the largest of the seven regions in Europe at<br />
$2,475 million. Despite the reduction in demand from PC manufacturers such as IBM and<br />
Amstrad, and price erosion in memory and microprocessors, the region will still show the<br />
second largest growth in Europe mainly as a result of demand from new applications such<br />
as cellular telephony. The new manufacturers that have set up in the region, as<br />
described earlier, will also have a positive effect on the TAM.<br />
West Germany<br />
The West German market grew by 16.4 percent in local currency in 1988. In 1988 it<br />
was the largest semiconductor market of all regions within Europe at $2,250 million.<br />
Both the data processing and telecoms segments showed little growth. High labor rates<br />
and restrictive labor laws have encouraged German companies over the past few years to<br />
locate their manufacturing facilities outside West Germany, either in other European<br />
countries or in the Far East. The two key growth areas in the region during 1988 were<br />
consumer and transportation.<br />
The outlook for the West German market is for below-average growth in 1989 of<br />
6.7 percent. The data processing segment will be affected by low demand from Nixdorf<br />
as the company restructures and repositions its emphasis in the higher growth area of<br />
computers.<br />
Following the EEC's green paper on the liberalizing of the European telecoms<br />
market, the Bundespost has entered a phase of complete restructuring. This is having a<br />
massive impact on the West German telecoms sector. As a result, demand from the<br />
telecoms segment is expected to be relatively flat in 1989. It is the consumer and<br />
transportation sectors that will show the strongest growth in 1989. A large demand for<br />
state-of-the-art color televisions and satellite receiver equipment should see the<br />
consumer segment grow by 15 percent. In transportation improved demand for high-end,<br />
electronics-filled executive cars will result in about 8 percent growth in semiconductor<br />
consumption in this segment.<br />
Rest of Europe<br />
Austria, Portugal, Spain, and Switzerland, which together comprise Rest of Europe,<br />
exhibited a 52.5 percent local currency growth in 1988. Their combined semiconductor<br />
markets amounted to $690 million. The basis for this growth was the rapid expansion of<br />
the equipment market in Spain and Portugal. Companies such as IBM, Ericsson, Olivetti,<br />
Alcatel, Samsung, Fujitsu, Siemens, and Philips now have manufacturing facilities in<br />
Spain and Portugal. They manufacture equipment for consumption both locally and in<br />
other EEC countries. The primary segments are data processing, telecoms, and<br />
consumer. The demand for telecoms equipment in Spain is particularly strong.<br />
ESAM Newsletter © 1989 Dataquest Incorporated March
The Rest of Europe market is expected to continue to show the highest growth in<br />
1989. Dataquest forecasts the growth at 20.1 percent over 1988, reaching $829 million.<br />
Once again growth in Spain and Portugal will drive the market; these two countries are<br />
expected to continue to attract considerable investment from equipment manufacturers<br />
wishing to set up manufacturing capability within the EEC and benefit from the source<br />
of good quality, inexpensive labor.<br />
CONCLUSIONS<br />
From double-digit growth in 1988, Europe and its regions will experience slower<br />
growth in 1989. However, as Europe attracts more foreign investment in electronics<br />
manufacture in readiness for a "Single Europe" in 1992, the semiconductor market is on<br />
an upbeat trend. This is particularly obvious in the United Kingdom and Ireland.<br />
The liberalizing of the European telecoms market had a major impact on the local<br />
PTTs. Their buying patterns are changing radically and this is particularly impacting the<br />
semiconductor demand in France, Italy and West Germany.<br />
Through mergers and acquisitions Europe now has three major consumer companies,<br />
ITT-Nokia, Philips and Thomson. The focus that they have brought to Europe is having a<br />
strong positive effect on the semiconductor market in Finland, France, Portugal, Spain<br />
and West Germany.<br />
The data processing sector is still reeling from the strong PC growth in 1988. This,<br />
coupled with high memory and microprocessor prices, causes concern that the market<br />
may be on course for negative growth; the U.K. and Ireland market is the most exposed<br />
here.<br />
The increased usage of electronics in cars has meant strong growth in semiconductor<br />
consumption from Bosch, Siemens/Bendix, Marelli Autronica and Peugeot Citroen. The<br />
French, Italian and West German semiconductor markets will continue to benefit from<br />
this.<br />
The consumption of military semiconductors in France and the United Kingdom, the<br />
two main European regions, continues to be flat. The light on the horizon is the<br />
Eurofighter. Companies including Aerospatiale, British Aerospace, Ferranti, Marconi,<br />
and Thomson will all be in line to benefit from these military contracts. The outlook for<br />
1989 is still for little or no growth in military semiconductor consumption.<br />
© 1989 Dataquest Incorporated March ESAM Newsletter
Dataoyest<br />
a company of<br />
ine Dun & Bradstreet Corporation<br />
Research Newsletter<br />
EXECUTIVE SUMMARY<br />
THE EEC RULES ON "MADE IN EUROPE"<br />
—ARTICLE 5 No. 802/68 ANALYZED<br />
ESAM Code: Newsletters 1988-1989<br />
1989-5<br />
0002283<br />
This bulletin examines the European Commission's new interpretation of its rules to<br />
determine the origin of integrated circuits. Dataquest believes that it will have a major<br />
impact on the European and worldwide semiconductor industries.<br />
The Origin Rules<br />
The "non-preferential" rules (Article 5 of the Council Regulation No. 802/68) states<br />
that "a product in the production of which two or more countries were concerned shall be<br />
regarded as originating in the country in which the last substantial process or operation<br />
that is economically justified was performed, having been carried out in an undertaking<br />
equipped for the purpose, and resulting in the manufacture of a new product or<br />
representing an important stage of manufacture".<br />
The New Interpretation<br />
The phrase "last substantial process or operation" has recently been interpreted by<br />
the Origin Committee to mean that "diffusion shall be considered as the last substantial<br />
operation in the manufacture of integrated circuits".<br />
The EC defines "diffusion" as the "operation where integrated circuits are formed on<br />
a semiconductor substrate by the selective introduction of an appropriate dopant". As<br />
long as diffusion is carried out within the EC it will no longer be necessary for ICs to be<br />
assembled in Europe to qualify them as "EC sourced".<br />
Impact on European Diffusion Plants<br />
In future, vendors will need to perform the diffusion steps within Europe for the IC<br />
to qualify as originating from within the EEC. Dataquest expects to see a spate of<br />
cross-licences, second sourcing and foundry deals with vendors who have local diffusion<br />
plants in Europe. Vendors with world-class fab plants located in Europe (such as Philips,<br />
SGS-Thomson, Siemens and Plessey) will be able to negotiate licence and foundry deals<br />
with vendors who perform diffusion in Europe.<br />
© 1989 Dataquest Incorporated March—Reproduction Prohibited<br />
The amtent of this report represenis our iruerpretation and analysis cf iT^rmation generally available to the public or released by responsible individuals in the subject companies, but<br />
is not guaranteed as (o accuracy or completeness It does not contain material provided to us in cxmfidence by our clients. Individual companies reported on and analyzed by Dataquest<br />
may be clients cfthis and/or other Dataquest services This ir^imation is not furnished in cormection with a sale or offer to sell securities or in connection with the solicitation cfan<br />
offer to hty securities. This firm and its parent and/or their officers, stockholders, or members cf their families may, fhm time to time, have a long or short position in the securities<br />
mentioned and may sell or buy such securities<br />
Dataquest Incorporated, 1290 Ridder Park Drive, San Jose, CA 95131-2398 / (408) 437-8000 / Telex 171973 / Fax (408) 437-0292
Intel and National Semiconductor have fab plants in Israel. Israel currently enjoys<br />
preferential trade access with the EEC; whether this will be the case after 1992 is a<br />
topic of hot debate within the EEC. It is very likely that parts diffused in Israel will<br />
carry normal EEC import tarrifs.<br />
Dataquest believes that Europe will benefit as more U.S. and Japanese vendors<br />
introduce state-of-the-art technology and capital intensive fab plants in Europe. This<br />
we believe will increase competition and cost efficiency of integrated circuit<br />
manufacturing, as more vendors compete for larger market shares within the EEC.<br />
Local Content<br />
Dataquest believes that the IC origin interpretation has set a precedent for further<br />
interpretations governing the origin of partially assembled goods such as printed circuit<br />
boards. Many electronic equipment manufacturers have, so far, been able to satisfy the<br />
EC's 40 percent local content ruling by the use of local sub contractors who make<br />
printed circuit boards (PCBs) with imported ICs who invoice in local currencies.<br />
Examples are those companies that run "screwdriver" operations in Europe to assemble<br />
VCRs, photocopiers, printers or microwave ovens.<br />
Vendors with local fabs will have a further market advantage as these "screwdriver"<br />
operations start purchasing locally-made ICs in anticipation of new rulings affecting<br />
PCBs. Over a longer term, we expect a number of vendors, mainly Japanese, will set up<br />
local diffusion plants in the face of pressure from local Japanese equipment<br />
manufacturers to supply locally diffused components.<br />
DATAQUEST CONCLUSIONS<br />
The new interpretation of the existing origin rule will have a major impact on both<br />
the IC market and on IC production in Europe. It will offer a multitude of opportunities<br />
to vendors to strike up licensing and foundry deals with vendors who presently have<br />
fabrication plants in Europe.<br />
Over a longer period we expect other EC rules and interpretations to spread<br />
downstream to determine the origins of component sub-assemblies, such as PCBs. When<br />
these rulings occur, they will open up lucrative markets for IC vendors with local fabs.<br />
This could result in higher semiconductor penetration into U.S. and Japanese OEMs who<br />
manufacture in Europe.<br />
Dataquest's European Semiconductor Industry Service (ESIS) will be regularly<br />
analyzing and reporting on the EEC directives, highlighting to our clients the<br />
ramifications that these changes will bring to the European high technology<br />
infrastructure.<br />
Bipin Parmar<br />
© 1989 Dataquest Incorporated March ESAM<br />
0002283
DataQuest<br />
t acDmparryDf<br />
I ThcDuna'^iadsbni<br />
Research Newsletter<br />
ESAM Code: Vol. II, Newsletters<br />
1989-4<br />
0003658<br />
Rev. 4/89<br />
FACSIMILE MACHINES: TERMINALS TODAY, TOOLS TOMORROW<br />
EXECUTIVE SUMMARY<br />
*<br />
A revolution in personal communications is occurring today because consumer<br />
demands and technology capabilities are now impacting each other. Figure 1 illustrates<br />
the favorable environment needed to create the type of progress that is currently<br />
happening. Equipment designers and semiconductor suppliers are presented with<br />
challenging opportunities whenever consumer needs or component technologies change or<br />
advance. This newsletter focuses on the specifics for facsimile machines from the<br />
standpoint of these concurrent and interrelated market and product evolutions.<br />
Semiconductors<br />
$113 Million<br />
(1988 OEM)<br />
Figure 1<br />
Linking European Market and Product Evolution<br />
Requirements Needs<br />
Design<br />
and<br />
Manufacturing<br />
Solutions<br />
Equipment<br />
$750 Million<br />
(1988 Factory)<br />
Marketing<br />
and<br />
Sales<br />
Satisfactions<br />
© 1989 Dataquest Incorporated March—Reproduction Prohibited<br />
Us6rs<br />
$2,720 Million<br />
(1988 Retail)<br />
Source: Dataquest<br />
April 19S9<br />
The content of Ms report represents our interpretation and analysis c^ii^rmation gaieralfy availabk to the puMic or released by responsible individuals in the subject con^fames, but<br />
is not guaranteed as to accuracy or amtpleteness. It does not conttdn material provided to us in amfidence by our clients. Individual am^xtnies reported on and analyzed by Dataquest<br />
may be clients cfthis andlor orficr Dtuaquest services. This ii^^mation is notfiimished in connection with a sale or offer to sell securities or in connection with the soliciuaion of an<br />
o(Jfer to buy securities. This firm and its parent and/or their c^icers, stoddtoiders, or members of their fiimilies may, from time to time, have a lor^ or short position in the securities<br />
mentioned and may sell or buy sudi securities.<br />
Dataquest Incorporated, 1290 Ridder Park Drive, San Jose, CA 95131-2398 / (408) 437-8000 / Tfelex 171973 / Fax (408) 437-0292
Dataquest believes that continuing advancements in semiconductors will make a<br />
revolution in facsimile machines possible. End-user needs drive equipment designs, and<br />
equipment requirements drive semiconductor components. However, advances in<br />
semiconductors make better equipment designs possible, and the end users receive more<br />
value for the purchase price of the equipment. We conclude that the result will be the<br />
widespread acceptance of facsimile by the business community within the next few<br />
years, and that facsimile will be as essential to running a business as the telephone is<br />
today.<br />
Dataquest estimates that in Europe facsimile machine prices will continue to<br />
decline at a compound annual growth rate (CAGR) of negative 8 percent; unit shipments<br />
will continue to increase at a CAGR in the 30 to 35 percent range; penetration of the<br />
business market, which was approximately 14 percent in 1988, will increase to about<br />
80 percent in 1992; and a home market for facsimile will emerge in the early 1990s. We<br />
also forecast that, over the next decade, the capability for remote hard copy replication<br />
will become a standard feature on the deluxe models of some computer and<br />
communications equipment, such as laptop computers, laser printers, cellular telephones,<br />
and personal computers.<br />
THE MARKETING SIDE OF FACSIMILE MACHINES<br />
Market Estimates<br />
Dataquest's estimate of facsimile machine sales in Europe is presented in Table 1,<br />
with estimates for 1987 vendor market share illustrated in Figure 2. Between 1983 and<br />
1988, Dataquest estimates that unit sales increased at a CAGR of 92 percent, while the<br />
average retail price declined at a CAGR of negative 7 percent. For 1988 through 1992,<br />
Dataquest estimates that unit sales will increase at a CAGR of 33 percent, while the<br />
average retail price will continue to decline at a similar CAGR of negative 8 percent.<br />
Semiconductor content is calculated using an average input/output ratio of 4.1 percent<br />
of retail sales.<br />
Year<br />
1983<br />
1984<br />
1985<br />
1986<br />
1987<br />
1988<br />
1989<br />
1990<br />
1991<br />
1992<br />
Table 1<br />
Estimated Sales of Facsimile Machines in Eurc^je<br />
Unit Shipments<br />
(Thousands)<br />
30.7<br />
49.9<br />
86.4<br />
199.0<br />
433.9<br />
818.9<br />
1, ,289.0<br />
1, ,772.0<br />
2, ,194.0<br />
2, ,555.0<br />
Average<br />
(Price)<br />
$4,598<br />
$4,111<br />
$3,555<br />
$3,767<br />
$3,665<br />
$3,320<br />
$2,979<br />
$2,733<br />
$2,578<br />
$2,399<br />
Sales<br />
lilliona<br />
$ 141<br />
$ 205<br />
$ 307<br />
$ 749<br />
$1,590<br />
$2,718<br />
$3,839<br />
$4,843<br />
$5,656<br />
$6,129<br />
Total<br />
Semiconductor<br />
Consumption<br />
(Millions)<br />
$ 6<br />
$ 8<br />
$ 13<br />
$ 31<br />
$ 65<br />
$113<br />
$157<br />
$199<br />
$232<br />
$251<br />
Source s: Dataquest<br />
March 1989<br />
© 1989 Dataquest Incorporated March ESAM Newsletter
Figure 2<br />
Estimated 1987 European Market Shares<br />
for the Facsimile Market by Shipments<br />
(Thousands of Units)<br />
0003658-2<br />
User Base Expansion is Under Way<br />
Total = 433,900 Units<br />
Fujitsu<br />
4%<br />
Murata<br />
4%<br />
Source: Dataquest<br />
April 1989<br />
Dataquest predicts that as the retail price of facsimile machines continues to<br />
decline, these machines will begin to be located at the department level in larger<br />
companies. (We understand that most facsimile machines today are located in<br />
centralized facsimile rooms.) We also predict that in Europe the installed base of<br />
facsimile machines will increase from 1.5 million units in 1988 (or 14 percent of the<br />
11 million business establishments) to 9 million units in 1992.<br />
THE MANUFACTURING SIDE OF FACSIMILE MACHINES<br />
Dataquest's estimate of the semiconductor content of economy and midrange<br />
facsimile machines is presented in Table 2. Virtually all facsimile machines today are<br />
made in Japan and meet the Group III standard of the CCITT, which means they use<br />
digital transmission techniques based on modems and require approximately 30 seconds<br />
to a minute to transmit a page of information. Facsimile machines based on the Group<br />
IV standard currently being defined will use the ISDN network and will require about 2 to<br />
5 seconds to transmit a page of information.<br />
ESAM Newsletter © 1989 DataquestIncorporated March
Table 2<br />
Estimated Semiconductor Content of Group IK Facsimile Machines<br />
Semiconductor Components<br />
Integrated Circuits<br />
Memory<br />
SRAM<br />
EPROM<br />
Microcomponents<br />
Microprocessor<br />
Microcontroller<br />
Microperipheral<br />
Logic<br />
Standard Logic<br />
Gate Array<br />
Linear<br />
Discrete<br />
Optoelectronic<br />
CCD<br />
LEO Array<br />
Total Semiconductors<br />
Facsimile Equipment<br />
Factory Cost<br />
Retail Price<br />
Input/Output Ratio (factory)<br />
(retail)<br />
Economy<br />
Machines<br />
1 (64K)<br />
1 (256K)<br />
1<br />
0<br />
1 (modem)<br />
10<br />
2<br />
10<br />
51<br />
1<br />
1<br />
$124<br />
$696<br />
$2,510<br />
17.9%<br />
4.9%<br />
1<br />
1<br />
1<br />
2<br />
2<br />
10<br />
2<br />
10<br />
57<br />
1<br />
1<br />
$152<br />
Midrange<br />
Machines<br />
(256K)<br />
(512K)<br />
(modem, watch)<br />
$1 ,146<br />
$4 ,130<br />
13 .2%<br />
3. 7%<br />
Source: Dataquest<br />
March 1989<br />
Facsimile machines based on the Group I or Group II standards are being retired<br />
from the installed base, and Dataquest estimates that they will no longer be in use after<br />
1990. Group I and Group II machines use analog transmission techniques and require 3 to<br />
6 minutes to transmit a page of information.<br />
Component Prices Continue to Decline<br />
The negative 11 percent CAGR reduction in facsimile machine prices is made<br />
possible in part by the reduction in numbers and prices of the components used to make<br />
the facsimile machine. For example, the facsimile modem component was a complete<br />
card in 1983, with an estimated OEM-volume price of approximately $300, and it was<br />
supplied only by Rockwell. In 1988, Dataquest estimates that this same circuit function<br />
is implemented as either one or two semiconductor components with an OEM-volume<br />
price in the $80 to $100 range, and that more than six component manufacturers have<br />
entered the market. (The facsimile modem suppliers include Hitachi, Hycom/Sharp,<br />
© 1989 Dataquest Incorporated March ESAM Newsletter
Matsushita, Oki, Rockwell, Toshiba and Yamaha. Dataquest believes that SGS-Thomson<br />
will enter the facsimile modem market soon.) In 1989, Dataquest estimates that the<br />
OEM-volume price of the facsimile modem component will be reduced to the $40 to $50<br />
range, as these component manufacturers attempt to grow their sales by competing for<br />
more design wins.<br />
Component Functionality Continues to Increase<br />
Another trend in facsimile machines is the use of components that can be<br />
programmed with software to perform a number of different operations. For example,<br />
the Next Computer system will use a digital signal processor (DSP) component made by<br />
Motorola that can be configured with software to be either a facsimile modem,<br />
high-speed data modem, a speech synthesizer, or a CD-quality sound generator.<br />
Dataquest believes that OEM-volume pricing for such a component will be less than $40<br />
in 1989, and if a user needs all of these features in an item of equipment that already has<br />
a microprocessor, the equivalent cost of the facsimile modem would be just a fraction<br />
of the cost of the DSP component itself.<br />
Facsimile comjxjnent opportunities may exist also for suppliers of<br />
application-specific integrated circuits (ASICs). Dataquest believes that additional<br />
opportunity exists for the standard logic, linear, and discrete components to be further<br />
integrated into single-chip ASIC solutions, further reducing the manufacturing cost and<br />
product footprint size.<br />
Component Technology Continues to Advance<br />
As users are becoming experienced with facsimile , new feature-related needs are<br />
emerging that will affect the components required inside a machine. Dataquest believes<br />
that there are potential markets for facsimile machines with capabilities for color,<br />
store-and-forward memory, plain paper, error correction, local copies, gray-scale, and<br />
broadcasting. These deluxe model features will become more practical and more<br />
common as technology advancements continue to reduce their implementation costs to<br />
the point where users can afford them.<br />
For example, the reliability and resolution of the scanning operation could be<br />
improved by changing from charged-couple device (CCD) to contact image sensor (CIS)<br />
technology. However, Dataquest believes that the cost of the CIS technology will have<br />
to be reduced before it becomes a widely accepted substitute for the CCD technology<br />
currently used in most machines. Also, the current typical transmission time of<br />
20 seconds per page for Group III machines using the Modified Huffman coding technique<br />
could be reduced by 55 percent to about 9 seconds per page using the Modified Reed<br />
(MMR) coding technique. Memory and microprocessor components are needed to run the<br />
software programs used to implement these coding techniques, and Dataquest estimates<br />
that the prices on these components will continue to decline in general at CAGRs in the<br />
negative 5 to negative 15 percent range over the next four years.<br />
ESAM Newsletter © 1989 Dataquest Incorporated March
Production in Europe<br />
Dataquest estimates that, in 1988, only 15 percent of facsimile machines sold in<br />
Europe were also produced in Europe, giving rise to an estimated local IC consumption<br />
market of $16 million. This excludes those Japanese companies that currently operate<br />
screwdriver plants in Europe but import ICs from outside. Most of the European demand<br />
for facsimile ICs originates from Alcatel, which had a 77 percent share of the French<br />
market in 1987. However, Alcatel's local production will reduce as a consequence of its<br />
decision to label Japanese machines.<br />
Japanese manufacturers have been accelerating overseas production since 1986 to<br />
compensate for the high yen and the selective EC antidumping duties. Unlike Japanese<br />
printers and photocopiers, facsimile machines have not been subjected to local content<br />
requirements because there is now little European facsimile manufacturing to protect.<br />
Nevertheless, Dataquest expects the proportion of local IC content in Japanese locally<br />
assembled facsimile machines to increase. This follows the EC's recent proposals to<br />
deduce point of origin according to the "most," as opposed to the "last," substantial<br />
production process. Clearly, this is intended to favor locally purchased and fabricated<br />
ICs.<br />
DATAQUEST CONCLUSIONS<br />
Except for the special case of videotex in France, facsimile is the fastest-growing<br />
method of text transmission in Europe. Furthermore, the number of different user types<br />
is increasing. These trends will open opportunities for vendors to identify new niche<br />
markets for facsimile equipment and services.<br />
Facsimile Machine Sales Expected to Continue<br />
Dataquest estimates that the maximum potential installed base for facsimile<br />
machines in the European business sector is 5 million units. Although there were an<br />
estimated 11 million business establishments in Europe in 1988, the majority of these<br />
have fewer than 10 employees. While a large company may own several hundred<br />
facsimile machines, some of the smaller companies may decide that the services of a<br />
local facsimile center are sufficient to meet their needs.<br />
Dataquest also believes that a sizable home market for facsimile-related equipment<br />
will emerge from about 1994 on. Our estimate for the potential installed base of<br />
facsimile equipment in the home is 2 million units by 1996. Some of these home users<br />
would be telecommuters who work at home several days each month, and a facsimile<br />
machine would supplement the office-compatible personal computer systems they<br />
already use at home for their work. There were approximately 60 million white-collar<br />
workers and 137 million households in Europe in 1988, and we believe that the potential<br />
installed base of 2 million facsimile machines in the home is a conservative projection.<br />
Dataquest believes that the application markets for facsimile components are<br />
beginning to diversify. Today, most facsimile components are used in standalone<br />
facsimile machines; we expect that application to be the major market for facsimile<br />
components over the next five years. There are, however, other application markets<br />
currently in the niche stage that could expand as additional users discover the potential<br />
benefits of these facsimile-related products.<br />
6; © 1989 Dataquest Incorporated March ESAM Newsletter
Opportunities in Niche Markets<br />
The declining cost of facsimile machines will result in increasing sales to the home<br />
market. Dataquest believes that the successful models will be those that satisfy the<br />
special requirements of telecommuter users. Essentially, these are to provide office<br />
facilities in the home with a maximum of economy, by offering the following features:<br />
• Shared voice and facsimile on a single line<br />
• Combined photocopy and printer capability—ideally, onto plain paper using<br />
laser printer technology<br />
• Text compatibility with PC word processor users<br />
The following two segments have emerged within the office market:<br />
• Office workstation facsimile machines that are low in cost and small enough<br />
to sit on a desktop as an extension to a standard featurephone<br />
• Office resource facsimile machines for general office use (These machines<br />
represent the high end of the market and are frequently second purchases to<br />
cope with rising facsimile traffic in the office.)<br />
Long-Term Implications of Present-Day Developments<br />
As communications networks continue to evolve throughout the 1990s, Dataquest<br />
expects that more image storage and transmission will take place electronically.<br />
Dataquest believes that separate pieces of equipment, such as personal computers,<br />
copiers, and facsimile machines, will begin to merge during the 1990s into an<br />
all-electronic communications network. Peripherals such as scanners and printers will<br />
be attached to this network as the link to the world of hard copy. The likelihood of this<br />
happening sooner rather than later depends on how fast the business community adopts<br />
facsimile as a necessity. That acceptance depends, to a large extent, on technology<br />
continuing to find ways to reduce the manufacturing cost of a facsimile machine today.<br />
(Some of the data in this research newsletter were supplied by Dataquest's Japanese<br />
Semiconductor Application Markets service and Telecommunications Industry Service.)<br />
ESAM Newsletter © 1989 Dataquest Incorporated March<br />
Jonathan Drazin<br />
Anne Barbangon<br />
Roger Steciak
Dataquest<br />
Conference Schedule<br />
1989<br />
Semiconductor User/<br />
Semiconductor Application Markets<br />
Japanese Components<br />
Computer Storage<br />
Document Processing<br />
Copiers<br />
Printers<br />
Electronic Publishing<br />
Imaging Supplies<br />
Color<br />
SEMICON/West Seminar<br />
Telecommunications<br />
European Components<br />
Asian Semiconductor and<br />
Electronics Technology Seminar<br />
Financial Services<br />
Technical Computing and<br />
Applications<br />
European Copying<br />
and Duplicating<br />
Western European Printer<br />
Taiwan Conference<br />
Distributed Processing<br />
SIA/Dataquest<br />
Joint Conference<br />
Information Systems<br />
Semiconductor<br />
Asian Semiconductor and<br />
Electronics Technology<br />
European Telecommunications<br />
European Personal Computer<br />
February 27-28<br />
April 20-21<br />
April 26-28<br />
May 16-18<br />
May 16-17<br />
May 16-17<br />
May 18<br />
May 18<br />
May 18<br />
May 24<br />
June 5-7<br />
June 7-9<br />
June 28<br />
August 22-23<br />
September 11-13<br />
September 18-19<br />
September 20-22<br />
September 25-26<br />
September 26-28<br />
September 27<br />
October 2-6<br />
October 16-18<br />
November 2-3<br />
November 8-10<br />
December 6-8<br />
Le Meridien Hotel<br />
San Francisco, California<br />
Tokyo Bay Hilton International<br />
Tokyo, Japan<br />
The Doubletree Hotel<br />
Santa Clara, California<br />
Monterey Sheraton Hotel<br />
Monterey, California<br />
The Dunfey Hotel<br />
San Mateo, California<br />
Silverado Country Club<br />
Napa, California<br />
Park Hilton<br />
Munich, West Germany<br />
Radisson Hotel<br />
San Jose, California<br />
The Doubletree Hotel<br />
Santa Clara, California<br />
The Doubletree Hotel<br />
Santa Clara, California<br />
Majestic Hotel<br />
Cannes, France<br />
Majestic Hotel<br />
Cannes, France<br />
Grand Hotel<br />
Taipei, Taiwan<br />
The Doubletree Hotel<br />
Santa Clara, California<br />
Santa Clara Marriott<br />
Santa Clara, California<br />
Tokyo American Club<br />
Tokyo, Japan<br />
Monterey Sheraton Hotel<br />
Monter^, California<br />
Kunlun Hotel<br />
Beijing, China<br />
Grand Hotel<br />
Paris, France<br />
Athens. Greece
«i Dataoyest<br />
a company of<br />
The Dun & Bradstreet Corporation<br />
Research Newsletter<br />
ESAM Code: Vol. II, Newsletters<br />
1989-3<br />
0003193<br />
fflGH-DEFINITION TV IN EUROPE—AN INCREMENTAL APPROACH<br />
EXECUTIVE SUMMARY<br />
This newsletter analyzes the critical factors necessary for high-definition<br />
television's (HDTV's) success in Europe, and discusses in detail the television receiver IC<br />
market that will follow with HDTV's acceptance.<br />
Dataquest predicts that the European Commission, supported by local receiver<br />
manufacturers, will spurn adoption of Japan's Multiple Sub-Nyquist Sampling Encoding<br />
(MUSE) standard in favor of the European High-Definition Multiple Analog Component<br />
(HD-MAC) transmission standard. Europe's HD-MAC transmission standard will lag five<br />
years behind Japan's MUSE. It will be preceded by a number of intermediate MAC<br />
receivers, before it finally reaches consumers in the mid-1990s.<br />
Dataquest does not expect the appearance of HD-MAC receivers in Europe from<br />
1995 to be accompanied by a sharp increase in receiver IC sales. Instead, HD-MAC will<br />
mark the horizon to which a series of intermediate MAC receiver technologies will lead.<br />
Consumers are likely to switch to HD-MAC gradually as the benefits of HDTV become<br />
both perceivable and affordable. Dataquest predicts a moderate success for HD-MAC<br />
penetration by the year 2000, with a resultant market for HD-MAC ICs worth<br />
$217 million in Europe. In the same year, the market for HD-MAC ICs will account for<br />
34 percent of the whole receiver IC market, worth an estimated $641 million.<br />
Participants that address only the HDTV receiver market will not stay in this<br />
business for long. Enormous fixed costs in HTDV R&D and production will necessitate<br />
sharing these costs across the other product segments that benefit from HDTV<br />
technology.<br />
© 1989 Dataquest Incorporated February—Reproduction Prohibited<br />
The content cfthis report represents our iraerpretation and analysis of information generally available to (Ac public or released by responsible individuals in the subject companies, but<br />
is not guaranteed as to accuracy or con^fleteness It does not contain material provided to us in confiderux by our clients. Individual ctmjpanies report&l on and analyzed by Dataquest<br />
may be clients cfthis mid/or other Dataquest services This information is notjiirmshed in connection with a sale or qffir to sell securities or in connection with the solicitation of cm<br />
offer to buy securities. This firm and its parent and/or their officers, stockholders, or members of their families may, from time to time, have a long or short position in the securities<br />
menti
THE STANDARDS: MAC VERSUS MUSE<br />
Europe: MAC<br />
Activity in HDTV in Europe has focused on the development of the high-definition<br />
HD-MAC standard. HD-MAC will be compatible with the family of existing European<br />
Broadcast Union MAC standards. D2-MAC was developed as a cable and satellite<br />
standard by the CCETT in France and later taken over by Deutsche Bundespost.<br />
D-MAC, a wider bandwidth variant that includes conditional access has been<br />
recommended by the Independent Broadcasting Authority for satellite broadcast to the<br />
United Kingdom. Both D2-MAC and D-MAC offer some advantages over PAL and<br />
SECAM in terms of improved sound, greater picture resolution, and an optional 16:9 wide<br />
picture aspect ratio.<br />
Japan: MUSE<br />
During the last decade, new television technology evolved mainly in Japan, where<br />
companies have spent an estimated $700 million on R&D. Japan's HDTV standard,<br />
MUSE, was developed by NHK in collaboration with a number of major Japanese set<br />
manufacturers, principally Sony and Toshiba. MUSE offers more than twice the<br />
resolution of NTSC receivers with a wider aspect ratio of 16:9, and can be received by<br />
NTSC sets fitted with an adaptor. MUSE was demonstrated at EXPO 1985 in Tsukuba,<br />
Japan. NHK plans to start a nationwide MUSE broadcasting service, Hi-Vision, in 1990<br />
when its DS-3 satellites are launched. The prototypes for this service presently cost<br />
$80,000 each, but mass production will reduce the price to between $3,000 and $5,000 by<br />
the mid-1990s.<br />
Adoption of MUSE in Europe is flawed because the European frame rate is 50Hz<br />
compared with 60Hz for the United States and Japan. Consequently, Europe's existing<br />
PAL and SECAM sets could not be fitted with low-cost adaptors to receive MUSE<br />
transmissions in the early years.<br />
POLITICAL FORCES<br />
Europe maintains a fairly strong consumer electronics industry against fierce<br />
competition from Far East suppliers. Currently, European companies (Philips, Thomson,<br />
Nokia) represent some of the most formidable competitors in the global consumer<br />
markets. Thomson of France has become the largest manufacturer of color televisions in<br />
the world through its recent acquisition of RCA's consumer division and Thom-EMI's<br />
Ferguson.<br />
The largest potential block of viewers worldwide is post-1992 Europe and Eastern<br />
European SECAM viewers. This population will provide the European companies with the<br />
necessary economies of scale to compete in their home markets.<br />
© 1989 Dataquest Incorporated February ESAM Newsletter
The European Commission (EC) now is actively promoting HD-MAC as a world<br />
standard. Last November, it allocated ECU 45 million to a Brussels consortium,<br />
European Company for the Research and Promotion of HDTV (ECRP), to be set up in<br />
July 1989 in conjunction with 30 European manufacturers. ECRP will promote HD-MAC<br />
as a world-class standard to the CCIR (International Radio Consultative Committee)<br />
and, more specifically, to those East European countries that presently use SECAM.<br />
European consumer manufacturers will benefit from other EC-related programs such as<br />
Megaproject with its 4- and 16-Mbit DRAMs and Jessi with its submicron processes and<br />
related CAD tools for DSPs and ASICs.<br />
The Commission's central argument for not accepting the 60Hz MUSE transmission<br />
standard in Europe is that the standard is incompatible with current 50Hz PAL and<br />
SECAM standards. It argues that accepting MUSE would require huge investments<br />
simultaneously from three parties:<br />
• Program makers would be required to purchase new MUSE recording and<br />
editing equipment.<br />
• Broadcasters would need to invest in new transmission equipment.<br />
• Consumers would need to purchase a new receiver to watch MUSE HDTV<br />
broadcasts. Consumers also would need to own another PAL, SECAM, or MAC<br />
receiver to access the many non-MUSE broadcasts.<br />
THE SPIN-OFFS<br />
To appreciate the full impact that HDTV will bring, it is necessary to identify the<br />
many other applications that will benefit from HDTV innovations in signal processing, IC,<br />
and display technologies. They include the following:<br />
Video recorders (professional and consumer)<br />
Still and motion video cameras (professional and consumer)<br />
Video disk players (consumer)<br />
Computer displays (industrial, consumer, and military)<br />
Image processing engines (industrial and military)<br />
These secondary markets will be strongly synchronized with the emergence of reasonably<br />
priced HDTV receivers, and each is likely to equal the receiver market in size.<br />
ESAM Newsletter © 1989 Dataquest Incorporated February
DATAQUEST ANALYSIS<br />
Evolution of MAC<br />
We expect MAC to follow a step-by-step evolution in Europe, as shown in Figure 1.<br />
The first step begins this year when subscribers connect conventional PAL or SECAM<br />
sets to MAC adaptors to receive U.K. BSB and French TDF-1 satellite channels. MAC<br />
adaptors also will be needed to receive the new cable television networks, mainly in<br />
France and West Germany. By the end of 1990, manufacturers will have incorporated<br />
MAC decoders into their receivers and, by 1992, we expect wide-screen versions to be<br />
available. The appearance of high-definition HD-MAC receivers in the mid-1990s will<br />
mark the final stage in MAC's development. These high-definition receivers will use<br />
light projection in place of CRT displays to allow large-screen viewing without adding<br />
bulk to the receiver.<br />
0003193-1<br />
Stage 1:<br />
1989 - 1992<br />
Figure 1<br />
MAC Devel(q>ment Path<br />
D(2)-MAC<br />
Adaptor<br />
Stage 2:<br />
1990 - 2000<br />
Stage 3:<br />
1991 - 2000+<br />
Stage 4:<br />
1995 - 2000+<br />
,^J^JW•LLLl.|.|.|.•.•>J»;<br />
Conventional Ktm<br />
PAL/SECAM<br />
Receiver Jl-^=^'<br />
U.MMf.W"<br />
•vn'ni'i'rinTii'HTHtiniinnnr-r<br />
Integral<br />
MAC Receiver<br />
I iHiNnrr uriiimnii i<br />
s=i:'iVi:i'i':'i"<br />
Wide-Screen<br />
MAC Receiver<br />
T'"v;Vi'i""'<br />
I'Tniri'tiin'ry,, 'iTn-r<br />
HD-MAC _<br />
Receiver I'f*^<br />
"^ "'"":<br />
iMiniMriiiinnTt<br />
Source: IBA<br />
4 © 1989 Dataquest Incorporated February ESAM Newsletter
Figure 2 presents Dataquest's forecast on how production volumes of these receiver<br />
types will change over the next 12 years. Conventional PAL/SECAM receivers will<br />
succumb gradually to MAC receivers (which may continue to offer a PAL or SECAM<br />
option). We expect this transition to be slow for two reasons. First, it will be obligatory<br />
in the initial phase for cable operators in Germany to convert their MAC signals to PAL,<br />
with a similar move expected in France. Second, PAL has received a new lease on life<br />
following its adoption by News International to broadcast its Sky channels via the Astra<br />
satellite. The appearance of Palcrypt conditional access adaptors later this year will<br />
enable Sky to carry pay channels, and further weakens a key selling point for D-MAC.<br />
Millions of Units<br />
14-<br />
12<br />
10<br />
8-<br />
4-<br />
t$<br />
\<br />
I<br />
\<br />
1988<br />
Total = 14.60<br />
0003193-2<br />
Figure 2<br />
Estimated European Television Receiver Production<br />
I<br />
I<br />
I<br />
1990<br />
16.85<br />
.'^1-1<br />
1992<br />
18.47<br />
Impact on the SemicoiKhictor Market<br />
KS^ PAUSECAM Receivers [H] Wide MAC Receiver<br />
1^^ MAC Adaptors H I HO-MAC Receiver<br />
Is^ MAC Receivers<br />
1994<br />
19.79<br />
1996<br />
18.22<br />
1998<br />
19.03<br />
2000<br />
17.56<br />
Source: Dataquest<br />
February 1989<br />
The extent to which HD-MAC receivers will penetrate the European consumer<br />
market is unclear. When they appear, their real cost will be about the same as that of<br />
the early color receivers of the late 1960s—but the move to a cleaner picture may not<br />
be as desirable as the move to color. HD-MAC's acceptance also will be inhibited by the<br />
fact that, when it arrives in 1995, it will compete with the improved D-MAC sets<br />
already available in the stores.<br />
Despite the imminent appearance of D-MAC and D2-MAC receivers, major growth<br />
in European receiver IC consumption depends on the acceptance of HD-MAC. These<br />
receivers will have a greater IC content compared with their MAC predecessors. Table 1<br />
presents our forecast of the relative mix between IC function for PAL/SECAM, MAC,<br />
and HD-MAC receivers.<br />
ESAM Newsletter<br />
© 1989 Dataquest Incorporated February
Year<br />
Table 1<br />
Estimated IC Value by Function for<br />
PAL/SECAM, Integrated MAC, and HD-MAC Color TV Receivers<br />
Content<br />
Analog<br />
DSP<br />
Memory<br />
IC Content<br />
Average Sell: ing Price<br />
I/O Ratio<br />
*Digital PAL/SECAM receiver<br />
PAL/SECAM*<br />
1989<br />
30%<br />
60%<br />
10%<br />
$32<br />
$425<br />
7.5%<br />
Intearated<br />
1990<br />
20%<br />
50%<br />
30%<br />
$38<br />
$475<br />
8.0%<br />
MAC HD-MAC<br />
1995<br />
15%<br />
15%<br />
70%<br />
$150<br />
$2,500<br />
6.0%<br />
Source: Dataguest<br />
February 1989<br />
A survey of potential HD-MAC manufacturers reveals that between 70 and<br />
80 percent of HD-MAC's IC content by value will be composed of 30 to 35 Mbits of<br />
specialized video RAM. The remaining content will be split between the HD-MAC<br />
decoder, DSP circuits, and the analog rf and video stages. We forecast the IC content to<br />
be about five times higher than for a PAL/SECAM set. However, we expect the I/O<br />
ratio to decline slightly from 7.5 percent to 6.0 percent because high-definition display<br />
costs (tube plus projection optics) will be high.<br />
Figure 3 presents our forecast for European TV receiver IC consumption by receiver<br />
type. We estimate a 5 percent overall compound annual growth rate (CAGR) between<br />
1988 and 1994 due to the following major factors:<br />
• Unit volume growth resulting from a continued demand for second receivers<br />
• A gradual switch to MAC and wide-MAC receivers with higher IC content and<br />
a higher proportion of local European production than that for PAL/SECAM<br />
receivers<br />
• MAC royalties may be payable on non-European fabricated chip sets, which<br />
would further favor local receiver manufacturers<br />
• New demand for MAC adaptors for use with existing PAL/SECAM receivers<br />
© 1989 Dataquest Incorporated February ESAM Newsletter
Beyond 1994, the European receiver IC market will be influenced largely by the rate at<br />
which HD-MAC is accepted. Assuming that, by the year 2000, one in five receivers<br />
purchased will be HD-MAC compatible, we estimate that this amount will represent<br />
34 percent of a total receiver IC market worth $641 million.<br />
Figures<br />
Estimated Eurc^an TV Receiver<br />
IC Consumption<br />
Millions of Dollars<br />
700<br />
fyvl PAL/SECAM Receivers I I Wide MAC Receiver<br />
630<br />
^M MAC Adaptors<br />
HD-MAC Receiver<br />
560 f^^^ MAC Receivera<br />
490 H<br />
420<br />
350 ^<br />
280<br />
210<br />
140-1<br />
70<br />
•".\K\S<br />
\\. vs. %^<br />
1988<br />
Total = $412<br />
0003193-3<br />
1990<br />
$538<br />
DATAQUEST CONCLUSIONS<br />
1992<br />
$534<br />
1994<br />
$547<br />
1996<br />
$545<br />
1998<br />
$609<br />
2000<br />
$641<br />
Source; Dataquest<br />
February 1989<br />
Strong lobbying by the European Commission will ensure HD-MAC's acceptance as<br />
Europe's HDTV standard. There will be no single worldwide HDTV standard. HD-MAC's<br />
entry into the European consumer market will lag MUSE in Japan by five years.<br />
However, the MAC family of standards will give a head start to those companies with<br />
manufacturing and R&D facilities in Europe.<br />
Dataquest forecasts an overall CAGR of 14 percent in the European television<br />
receiver IC market from the end of 1988 to the end of 1990, due to strong local European<br />
production of intermediate MAC receivers/adaptors and a rising demand for second<br />
receivers. However, the outlook between 1990 and 1995 is of zero growth until the<br />
arrival of IC-intensive, HD-MAC receivers in 1996. With moderate success expected for<br />
HD-MAC by the year 2000, Dataquest estimates that HD-MAC will constitute<br />
$217 million (34 percent) of a total European receiver IC market worth $641 million by<br />
that time.<br />
ESAM Newsletter<br />
© 1989 Dataquest Incorporated February
In addition to the $217 million market for receiver ICs in Europe, we expect a |flk<br />
market two to three times greater from spin-offs such as VCRs, CD players, and ^Ir<br />
computer graphics. Success will go to those vendors that deliver a broad range of<br />
interrelated HDTV products.<br />
Jonathan Drazin<br />
Bipin Parmar<br />
§ © 1989 Dataquest Incorporated February ESAM Newsletter
f'W-:'^.^'!^<br />
^fe"*<br />
^mw^-^<br />
rafet^"<br />
Wf^i^<br />
: ."vf-A jvVP'^<br />
Dataqyest<br />
aoHiipanyof<br />
ThcDi&n&Bradstiteti :Oiq>oration<br />
m Research AfevHsfeflSer<br />
EXECUTIVE SUMMARY<br />
PARXn<br />
ISDN—THE EARLY MARKETS, 1988-1992<br />
ESAM Code: Vol. II, Newsletters<br />
1989-2<br />
0002513<br />
This newsletter discusses the major issues affecting the markets for ISDN integrated<br />
circuits over the period from 1988 to 1992. ISDN is not growing as rapidly as expected in<br />
Europe. This is due to the following three major obstacles:<br />
• Conflicting ISDN standards<br />
• Lack of tariff harmonization between countries<br />
• Alternative LAN technology<br />
With these constraints, Dataquest estimates that the market for ISDN semiconductors in<br />
Europe will be $137 million in 1992.<br />
A SERIES OF THREE NEWSLETTERS<br />
This is the second in a series of three newsletters that Dataquest is preparing in<br />
order to reflect the level of impact that ISDN will have on the European semiconductor<br />
markets. These newsletters are entitled:<br />
• Part I: ISDN—The ICs and Their Applications<br />
• Part II: ISDN—The Early Markets, 1988-1992<br />
• Part III: ISDN—Long-Term Market Outlook, 1992-2000<br />
Readers should refer to the first newsletter for an explanation of the ISDN concept<br />
and the ICs and their applications. Part I also contains a glossary of ISDN and related<br />
terms. Part III will analyze the long-term outlook for the ISDN semiconductor markets<br />
in Europe; it will be published in the third quarter of 1989.<br />
© 1989 Dataquest Incorporated January—Reproduction Prohibited<br />
The content of this report represents our interpretation and analysis ofir^rmation generally available to the public or released by responsible individuals in the subject companies, but<br />
is not guaranteed as to accuracy or amipleteness. h does not contain material provided to us in cm^dence by our clients. Individual amipanies reported on and (malyzed by LkUaquest<br />
may be clients of Ms and/or other Dataquest services. This ir^rmation is notfttmished in connection with a sale or o^r to sell securities or in connection with the solicitation of an<br />
o^ to buy securities This firm and its parent and/or their cheers, stockholders, or members of their families may,fixmi time to time, have a lor^ or short position in the securities<br />
mentioned and may sell or buy sudi securities.<br />
Dataquest Incorporated, 1290 Ridder Park Drive, San Jose, CA 95131-2398 / (408) 437-8000 / Telex 171973 / Fax (408) 437-0292
TOO MANY HURDLES?<br />
The promise that ISDN will answer most of our communications needs has been<br />
steadily eroded. It is clear that the European Commission's target for 5 percent<br />
(4 million lines) of all public digital lines to be ISDN by 1992 cannot be met until the<br />
mid-1990s.<br />
ISDN's two most advanced PTTs, France Telecom and Deutsche Bundespost, are now<br />
working to targets of only 150,000 and 370,000 Basic Rate lines, respectively, by 1992.<br />
British Telecom, the first to experiment with ISDN, is not expected to launch a Basic<br />
Rate service until late in 1989. Until recently, these delays had been attributed to<br />
ISDN's technical unreadiness (i.e. incomplete CCITT standards, lack of central office and<br />
PBX ISDN software, and chip unavailability). These technicalities are now largely<br />
resolved, but ISDN must overcome other tougher hurdles before it can live up to<br />
expectations. These hurdles include the following:<br />
• Rival technologies<br />
• Conflicting standards<br />
• Unclear tariffs<br />
Rival Technologies<br />
The new IEEE-802.6 and 802.9 Integrated Voice Data LAN standards may displace<br />
ISDN from large corporate users. IEEE 802.6 will provide a 140-Mbit/sec (Mbps)<br />
fiber-optic Metropolitan Area Network (MAN) suitable for connecting large sites. The<br />
802.9 LAN will give Primary Access data rates (2 Mbps) on twisted-pair lines, albeit<br />
limited to a 100-meter range. Many argue that these are more appropriate technologies<br />
for large offices populated with personal computers and workstations. If 802.6 and 802.9<br />
prevail, existing cheap analog telephones will be difficult to displace for voice<br />
applications. This will leave ISDN relegated to providing external communication<br />
between a PBX and a public network.<br />
Conflicting Standards<br />
In spite of emerging European Commission directives and CCITT recommendations,<br />
some European PTTs may retain their old Primary Rate signaling standards. The<br />
continued use of British Telecom's DASS-2 and Deutsche Bundespost's 1TR6 signaling<br />
standards to connect central offices will harm close interworking between private and<br />
public networks. A similar connectivity problem exists with PBXs, where GEC-Plessey<br />
Telecommunications (OPT) has adopted DPNSS and Siemens has gone with CorNet. This<br />
situation reduces the attraction of private ISDN networks in Europe, particularly<br />
international ones.<br />
The short-term prospects for Basic Rate are not wholly clear either. The CEPT is<br />
likely to endorse ANSI's adoption in the United States of British Telecom's 2B10<br />
U-interface line code in the next few months. The PTTs will then have to decide<br />
whether to postpone expansion of their present Basic Rate service or commit to a costly<br />
retrofit later on. In any case, 2B1Q ICs will not become available until the end of 1989.<br />
© 1989 Dataquest Incorporated January ESAM Newsletter
Unclear Tariffs<br />
The bottom line for all potential ISDN users will be how the cost of using the public<br />
ISDN compares with alternative services. Enormous disharmonies exist between tariffs<br />
in each Eiffopean country. The cost, for instance, of leased lines in the United Kingdom<br />
is many times lower than that in Germany. To abide with the EC Green Paper on<br />
telecommunications, the PTTs are expected to harmonize their tariffs over the next few<br />
years. But the fear is that multinational users will not commit to a public ISDN until the<br />
result is known.<br />
THE EARLY MARKET: 1988-1992<br />
Considering the above constraints, our estimation of the ISDN installed base in<br />
Europe by 1992 is:<br />
• 450,000 Basic Rate lines<br />
• 9,000 Primary Rate lines connected to offices with full internal ISDN<br />
We forecast the market for ISDN semiconductors in Europe to be $137 million in<br />
1992. This assumes that semiconductor demand leads line installations by 12 months.<br />
Our estimation of the market shares by IC category is shown in Figure 1, and Figure 2<br />
gives the estimated market size of each category from 1988 to 1992.<br />
We expect public Basic Rate services to represent most of the demand for ISDN<br />
transceiver ICs. Although the volume of S-interface chips will far exceed that for<br />
U-interface ICs, we expect the U-interface to have greater dollar market share<br />
(34 percent) than S-interface ICs (25 percent). This is due to the U-interface ICs' higher<br />
average selling price. Microcontrollers (13 percent) are expected to be less numerous<br />
than transceivers and confined mainly to terminal equipment.<br />
Unglamorous ISDN power supply ICs are forecast to occupy a sizeable 21 percent of<br />
the market. These are required in every application and provide specialized ISDN<br />
functions (power feed, shutdown, line drivers) not provided by other non-ISDN power<br />
supply ICs. Vendors are offering advanced technologies, ranging from AMD's 65V bipolar<br />
process to SGS-Thomson's mixed lOOV bipolar/CMOS/DMOS process currently under<br />
development.<br />
We expect ISDN rate adapters and speech codec/filters to take only a small fraction<br />
of the market, 4 percent and 2 percent of market share, respectively. The codec market<br />
will be small for two reasons. First, unlike S- or U-interface ICs, they are not required<br />
at the LT or NTl reference points. Second, we expect the traditional COMBO suppliers<br />
to compete aggressively, resulting in low average selling prices.<br />
ESAM Newsletter © 1989 Dataquest Incorporated January
Millions of Dollars<br />
150<br />
140<br />
120<br />
100-1<br />
80<br />
60H<br />
40<br />
20-<br />
0-<br />
l""-""J Power Supply<br />
^ i Microcontroller<br />
BM S-lnterface<br />
I I U-lnterface<br />
• • Codec/Filter<br />
mil Rate Adapter<br />
$2,5<br />
Figure 1<br />
Estimated Eurx^jean ISDN IC Markets<br />
(Millions of Dollars)<br />
$10.0<br />
$35.0<br />
#i;?53^^^!S!^<br />
S6S.0<br />
$137.0<br />
1989 1989 1990 1991 1992<br />
«X^13-1 Saurcc; Dacaqueji<br />
Innuary 1989<br />
Figure 2<br />
Estimated European ISDN Market Share by Chip Type<br />
1992<br />
0002513-a<br />
Total = $137 Million<br />
Rate Adapter<br />
4%<br />
Codec/Filter<br />
2%<br />
Source: Dataquest<br />
January 1989<br />
© 1989 Dataquest Incorporated January ESAM Newsletter
DATAQUEST CONCLUSIONS<br />
Major obstacles continue to hinder ISDN's acceptance as a true standard for<br />
telecommunications in Europe. Time is running out as newer, more aspirant MAN and<br />
LAN technologies threaten to rob ISDN's markets in large corporate environments.<br />
So who will use the ISDN? The brightest future lies with small business and<br />
residential Basic Rate subscribers for whom no alternative to ISDN exists. Small<br />
business users will benefit from a wide range of bearer services (telephone, packet<br />
switch, telex, facsimile) provided through a single physical socket. Further, the<br />
economic impetiK for Basic Rate will strengthen as the number of small businesses in<br />
Europe increases and the trend toward residential teleworking starts to grow.<br />
If the standards and tariffs hurdles can be overcome, we believe that ISDN's<br />
momentum will recover in Europe and bring a probable two- to threefold increase in<br />
ISDN semiconductor revenue.<br />
ACKNOWLEDGEMENT<br />
We would like to thank Dataquest's European Telecommunications Industry Service<br />
for sharing their insight and estimates on ISDN line takeup in Europe.<br />
ESAM Newsletter © 1989 Dataquest Incorporated January<br />
Jonathan Drazin
Dataqyesl<br />
I aoHTiparTvof<br />
The Di in EoradstiKt I<br />
Research Newsletter<br />
EXECUTIVE SUMMARY<br />
ISDN-<br />
PARTI<br />
-THE ICs AND THEIR APPLICATIONS<br />
ESAM Code: Vol. 11, Newsletters<br />
1989-1<br />
0002532<br />
This newsletter explains the basic concepts of the Integrated Services Digital<br />
Network (ISDN) and describes the main functions and applications for ISDN<br />
semiconductors.<br />
The diverse range of applications that ISDN embraces has caused most vendors to<br />
opt for highly modular chip sets. As a result of high design costs, most vendors have<br />
formed cross-sourcing agreements to offer a full ISDN product range.<br />
Dataquest estimates that from 1988 through 1992, 40 percent of the total market<br />
for ISDN ICs will go to providing an infrastructure for the public Basic Rate services,<br />
with 16 percent going into the infrastructure for public and private Primary Rate<br />
services. Customer premises equipment (CPE) manufacturers will account for the<br />
remaining 44 percent of demand.<br />
A glossary of ISDN terms has been included at the end of this newsletter for those<br />
who are unfamiliar with ISDN terminology.<br />
A SERIES OF THREE NEWSLETTERS<br />
This is the first in a series of three research newsletters that Dataquest is preparing<br />
in order to reflect the level of impact that ISDN will have on the European<br />
semiconductor markets. These three newsletters are entitled:<br />
• Part I: ISDN—The ICs and Their Applications<br />
• Part II: ISDN—The Early Markets, 1988-1992<br />
• Part III: ISDN—Long-Term Market Outlook, 1992-2000<br />
© 1989 Dataquest Incorporated January—Reproduction Prohibited<br />
The content
The two subsequent newsletters, Parts II and III, will analyze the market for ISDN<br />
semiconductors in Europe. Part II of this newsletter accompanies Part I, and Part III will<br />
be published in the third quarter of 1989.<br />
INTRODUCTION<br />
ISDN is a collective term for the I series of telecommunications standards<br />
recommended by the Consultative Committee on International Telephone and Telegraph<br />
(CCITT) and ratified by the Conference Europeenne des Administrations des Postes et<br />
des Telecommunications (CEPT). These standards will have a strong influence on the<br />
telecommunications semiconductor markets because they describe a single physical<br />
interface to be adopted worldwide for many forms of electronic communications<br />
equipment, including the following:<br />
• Voice telephony<br />
• Facsimile transmission<br />
• Data transmission (packet switch and virtual circuit)<br />
• Telex<br />
Many new applications for ISDN are likely to appear in the mid-1990s and to<br />
increase further the market for ISDN semiconductors. These include the following:<br />
• Integrated voice and data workstations (IVDWs)<br />
• Video telephony<br />
• Mixed video/text terminals<br />
• Home automation and remote diagnosis<br />
ISDN ACCESS AND REFERENCE POINTS<br />
The existing I series recommendations define the following two forms of ISDN<br />
access:<br />
• Basic Rate Access consists of two 64-Kbps B channels and 1 16-Kbps<br />
D channel with a total bandwidth of 144 Kbps, suitable for transmission across<br />
existing two-wire loops between subscribers and central offices or PBXs.<br />
• Primary Rate Access consists of 30 B channels and 1 D channel with a total<br />
bandwidth of 2.048 Mbps (in Europe).<br />
© 1989 Dataquest Incorporated January ESAM Newsletter
Figure 1 shows how the ISDN fits together for the Basic Rate service. TEl<br />
represents new ISDN terminal equipment that connects directly to the ISDN at the<br />
S-interface. TE2 represents existing equipment such as RS-232-C or X.21 terminals.<br />
This equipment may connect to the S-interface via a terminal adaptor, TA. NT2 is a<br />
multiplexer that concentrates two or more TEls or TAs. The NTl provides physical and<br />
electrical termination between the S-interface and U-interface transmission lines. The<br />
U-interface transmission is two-wire transmission at 144 Kbps and uses echo-canceling<br />
techniques to correct for signal reflections along the line. Transmission at the<br />
S-interface is four-wire transmission and will require substantial rewiring of most<br />
buildings to accommodate it.<br />
X/V - Series<br />
0002532-1<br />
THE CfflP SETS<br />
Figure 1<br />
ISDN Functional Entities<br />
Note; TEl = Terminal Equipment Type 1 {ISDN Terminal)<br />
TE2 = Terminal Equipment Type 2 (Non-ISDN Terminal)<br />
TA = Terminal Adapter<br />
NTl = Network Termination Type 1<br />
NT2 = Networl< Termination Type 2 (mainly Primary Rate)<br />
U = European Basic Rate Digital Subscriber Line<br />
LT = Local Exchange Termination<br />
Source: Dataquest<br />
January 1989<br />
The same types of ISDN ICs are used in several different ISDN applications. Figure<br />
2 describes one possible example of an ISDN chip set by function for a digital telephone<br />
handset connected to a central office (CO) exchange via a U-interface. For i^uture<br />
volume applications, these functions are likely to be integrated into a single IC.<br />
ESAM Newsletter © 1989 Dataquest Incorporated January
Voles ,<br />
• * — ^<br />
Data I<br />
0002532-2<br />
Figure 2<br />
Main ISDN Chip Functions<br />
6^3<br />
Digital Phone (TE) Natworic Tarmlnatlon (NT1) Local Exchange (LT]<br />
Codec<br />
Link/<br />
Control<br />
S-Interface I<br />
Powof<br />
S-Interface<br />
Power<br />
U-interface<br />
I U I<br />
S-lnterface<br />
Power<br />
Trunk<br />
Network<br />
Source: Dacaquest<br />
January 19S9<br />
Most vendors offer a modular family of CMOS devices that can be mixed and<br />
matched for a given application. No ISDN recommendations for connectivity at the IC<br />
level have been drafted or planned, although a single bus format would be desirable to<br />
maximize chip-to-chip compatibility between different vendors.<br />
Table 1 describes some of the bus schemes adopted. Most European vendors have<br />
chosen the General Component Interface (GCI). This is similar to Siemens'<br />
ISDN-Oriented Modular Revision 2 (IOM-2) scheme. The GCI bus has four lines: two for<br />
data receive and transmit, one for frame synchronization, and one clock line. Data for<br />
the D and two B channels are multiplexed onto a single line. Intel's Subscriber Line<br />
Datalink (SLD) combines the receive and transmit signals onto a single bidirectional<br />
line. Mitel's ST bus works in a similar way to GCI but can operate in an alternate mode<br />
where the B and D channels are transmitted on different lines.<br />
Control pins are eliminated from the GCI, ST, and SLD buses by interleaving data<br />
and control codes onto one line. This increases the complexity of the IC but eases the<br />
design process of integrating onto one piece of silicon.<br />
^ © 1989 Dataquest Incorporated January ESAM Newsletter
ISDN IC FUNCTIONS<br />
Table 1<br />
Bus Formats Adopted by the Major ISDN IC Vendors<br />
Bus Name<br />
GCI/IOM-2<br />
SLD<br />
ST<br />
IDL<br />
vensjgyg<br />
Advanced Micro Devices<br />
National Semiconductor<br />
Philips<br />
Plessey<br />
SGS-Thomson<br />
Siemens<br />
Signetics<br />
Intel<br />
National Semiconductor<br />
Mitel<br />
Motorola<br />
National Semiconductor<br />
Source: Dataquest<br />
January 1989<br />
Exchange and terminal equipment will be composed mainly of the following types of<br />
ISDN ICs.<br />
U-Interface IC—echo-canceling 192-Kbps digital transceivers for twistedpair<br />
subscriber loops<br />
S-Interface IC—four-wire S-interface transceivers providing link layer<br />
functions<br />
Microcontroller IC—provides layer 2, LAPD data link control; may also<br />
perform higher-level functions (e.g., keyboard control)<br />
Codec/Filter IC—performs codec and filter functions for voice telephone<br />
applications<br />
Rate Adaptor IC—adaption of the ISDN B channel to non-ISDN protocols (e.g.,<br />
V.24, X.21) for terminal adaptor (TA) applications<br />
Power supply IC—voltage regulation, line driver, arid power-down functions<br />
ESAM Newsletter © 1989 Dataquest Incorporated January
The major ISDN applications over the next five years will be the following:<br />
Central Office (CO) and PBX line cards (LT)<br />
Network Termination (NTl) at customers' premises<br />
Terminal Adapters (TAs) to allow connection of existing terminal equipment<br />
(e.g., RS-232/V.24, X.21) to the ISDN network<br />
Intelligent voice/data workstations (FVDWs)<br />
Facsimile Group 4<br />
Digital feature phones<br />
Digital handsets<br />
Table 2 describes typical IC uses for the different ISDN applications.<br />
IC Function<br />
U-interface<br />
S-interface<br />
Microcontroller<br />
Codec/Filter<br />
Rate Adaptor<br />
Power Supply<br />
Table 2<br />
ISDN IC Use by Application<br />
LI HI<br />
X X<br />
X<br />
X X<br />
*Please see glossary for terminology<br />
DEMAND BY APPLICATION<br />
lA<br />
X<br />
X<br />
X<br />
X<br />
Aoplication*<br />
IVDW<br />
X<br />
X<br />
X<br />
X<br />
X<br />
F^x<br />
X<br />
X<br />
X<br />
Feature<br />
Phone<br />
X<br />
X<br />
X<br />
X<br />
Digital<br />
Handset<br />
X<br />
X<br />
X<br />
X<br />
Source! Dataguest<br />
January 1989<br />
Figure 3 illustrates Dataquest's forecast for the ISDN IC market revenue shares by<br />
application in Europe from 1988 through 1992. The infrastructure (line cards, repeaters,<br />
and network termination) for the public Basic Rate services will receive 40 percent of<br />
the ISDN ICs. Public and private Primary Rate networks will take a smaller 16 percent<br />
share.<br />
© 1989 Dataquest Incorporated January ESAM Newsletter
Figure 3<br />
ISDN Semiconductor Demand by Ai^lication<br />
Group 4<br />
Facsimile<br />
7%<br />
IVDWs 2%<br />
000^32-3 Source: Dataquest<br />
January 1989<br />
Among customer premises equipment, the digital telephone will represent the<br />
largest single market (23 percent) for ISDN ICs, ISDN terminal adaptors will take second<br />
place with 12 percent, followed by facsimile machines (7 percent) and IVDWs (2 percent).<br />
DATAQUEST CONCLUSIONS<br />
Vendors are offering a number of highly modular ISDN chip sets. The CGI standard,<br />
a derivation of Siemens' IOM-2 bus protocol, has been most widely adopted by vendors<br />
for the European market. ISDN ICs are highly application independent at present.<br />
However, as volume applications develop (e.g., digital handsets), multiple ISDN functions<br />
will be integrated onto one piece of silicon.<br />
Dataquest estimates that during the period from 1988 through 1992, 40 percent of<br />
the total market for ISDN ICs will go to providing an infrastructure for the public Basic<br />
Rate services, with 16 percent going into the infrastructure for public and private<br />
Primary Rate services. Customer premises equipment (CPE) manufacturers will account<br />
for the remaining 45 percent of demand.<br />
ESAM Newsletter © 1989 Dataquest Incorporated January<br />
Jonathan Drazin
GLOSSARY<br />
ANSI (American National Standards Institute). A subcommittee of the Electrical<br />
Industry Association (EIA) that prepares software and electrical standards for U.S.<br />
industry.<br />
CCnr (Consultative Committee on International Telephone and Telegraph). A body of<br />
the ITU (International Telegraph Union) that prepares recommendations to resolve<br />
technical telegraph and telephone problems.<br />
CEPT (Conference Europeenne des Administrations des Postes et des Telecommimications).<br />
A body that coordinates the policies of the PTTs of Western Europe.<br />
CPE (Customer Premises Equipment). All forms of equipment used on customers'<br />
premises, excluding the termination (NTl) with the public network.<br />
DASS-2 (Digital Access Signaling Standard-2). British Telecom's signaling protocol for<br />
connecting Primary Rate subscribers with its central offices.<br />
DPNSS (Digital Private Network Signaling Standard). British Telecom's signaling<br />
protocol for connecting PBXs together to form a private network.<br />
GCI (General Component Interface). A common bus standard for ISDN chip sets, based<br />
on Siemens' IOM-2 standard and agreed between the main European vendors.<br />
Group 4. A high-speed facsimile protocol specific to ISDN, as defined in the CCITT<br />
F.5 recommendations.<br />
IDL (Interchip Digital Link). An ISDN bus developed by Motorola, consisting of separate<br />
data and control lines.<br />
IOM-2 (ISDN Oriented Modular Revision 2). A modular bus devised by Siemens for its<br />
ISDN chip set.<br />
IVDW. Integrated voice/data workstation. Provides multiple functions, including<br />
voice/video telephony, PC features, and data transmission.<br />
LAPB. The Link Access Protocol for the ISDN B channel defined in the CCITT X.25<br />
packet switch recommendations.<br />
LAPD. The Link Access Protocol for the ISDN D channel as defined by the CCITT 1.440<br />
and 1.441 recommendations.<br />
LT (Line Termination). A line card that provides termination of the subscriber loop at<br />
the PBX or central office.<br />
NTl (Network Termination 1). A unit that provides physical and electromagnetic<br />
termination of the U-interface two-wire transmission line.<br />
NT2 (Network Termination 2). A unit that provides switching and concentration of<br />
subscribers' lines at the S-interface (mainly for Primary Rate).<br />
© 1989 Dataquest Incorporated January ESAM Newsletter
PTT (P
RflftL SjaiiaiSMdM
fe-<br />
Dataoyest<br />
OMporatnn<br />
Research Newsletter<br />
SUMMARY<br />
ESAM Code: Vol. 11, Newsletters<br />
1988-7<br />
0002085<br />
EUROPE REFRESHES ITS STAGNANT WHITE GOODS MARKET<br />
The European white goods market is estimated to be worth $12.5 billion in 1988.<br />
This newsletter provides Dataquest's forecast for this white goods market (major<br />
household appliances) and a brief overview of the major white goods manufacturers in<br />
Europe.<br />
Low growth in the European white goods market, combined with overcapacity in the<br />
industry, has resulted in a massive restructuring of the major manufacturing companies<br />
and a shake-out among the smaller manufacturers. Many mergers have taken place over<br />
the last few years, of which the most noticeable have been the Whirlpool/Philips merger<br />
and Electrolux/Zanussi/Thorn-EMI mergers, with both companies vjang to become the<br />
dominant market leader. These events can be compared with what has happened in the<br />
automotive industry, where the market is fragmenting between high-volume, low-cost<br />
suppliers and low-volume, high-cost luxury model suppliers. AEG and Bosch-Siemens,<br />
following the German tradition, are becoming luxury model suppliers, while Electrolux<br />
and Philips are targeting the low-cost, high-volume end of the market.<br />
MARKET ESTIMATES<br />
Tables 1 and 2 show Dataquest's estimates for the European white goods market in<br />
both dollar and unit terms.<br />
© 1988 Dataquest Incorporated December—Reproduction Prohibited<br />
The corOent
Air Conditioners<br />
Microwave Ovens<br />
Washers, Dryers<br />
Refrigerators<br />
Dishwashers, Disposals<br />
Ranges, Ovens<br />
Vacuum Cleaners<br />
Food Processors<br />
Heaters<br />
Others<br />
Total<br />
Air Conditioners<br />
Microwave Ovens<br />
Washers, Dryers<br />
Refrigerators<br />
Dishwashers, Disposals<br />
Ranges, Ovens<br />
Vacuum Cleaners<br />
Food Processors<br />
Heaters<br />
Others<br />
Table 1<br />
Estimated and Forecast<br />
European White Goods Market<br />
(Millions of Dollars)<br />
1988<br />
$ 16<br />
232<br />
3,499<br />
2,609<br />
748<br />
2,181<br />
1,243<br />
326<br />
1,212<br />
480<br />
1985<br />
$ 30<br />
114<br />
2,797<br />
2,021<br />
583<br />
1,840<br />
1,080<br />
273<br />
1,140<br />
437<br />
$10,315<br />
1989<br />
$ 17<br />
380<br />
3,375<br />
2,664<br />
791<br />
2,284<br />
1,197<br />
333<br />
1,236<br />
488<br />
Estimated<br />
1986<br />
$ 18<br />
162<br />
3,105<br />
2,293<br />
655<br />
2,064<br />
1,176<br />
308<br />
1,235<br />
452<br />
$11,468<br />
Forecast<br />
1990 1991<br />
$ 20<br />
401<br />
3,260<br />
2,738<br />
842<br />
2,291<br />
1,201<br />
349<br />
1,261<br />
496<br />
$ 21<br />
422<br />
3,149<br />
2,812<br />
893<br />
2,296<br />
1,204<br />
356<br />
1,286<br />
496<br />
1987<br />
$ 17<br />
191<br />
3,213<br />
2,380<br />
702<br />
2,043<br />
1,187<br />
323<br />
1,260<br />
466<br />
$11,782<br />
1992<br />
$ 23<br />
445<br />
3,041<br />
2,868<br />
925<br />
2,301<br />
1,260<br />
374<br />
1,312<br />
512<br />
1993<br />
$ 26<br />
469<br />
2,938<br />
2,942<br />
1,000<br />
2,374<br />
1,292<br />
387<br />
1,338<br />
528<br />
Total $12,546 $12,765 $12,859 $12,935 $13,061 $13,294<br />
Source: Dataquest<br />
December 1988<br />
© 1988 Dataquest Incorporated December ESAM Newsletter
Air Conditioners<br />
Microwave Ovens<br />
Washers, Dryers<br />
Refrigerators<br />
Dishwashers, Disposals<br />
Ranges, Ovens<br />
Vacuum Cleaners<br />
Food Processors<br />
Heaters<br />
Others<br />
Table 2<br />
Estimated and Forecast<br />
European White Goods Market<br />
(Millions of Units)<br />
Estimated<br />
1985 1986<br />
0.2<br />
0.7<br />
11.1<br />
12.4<br />
2.2<br />
9.2<br />
10.8<br />
3.9<br />
22.8<br />
5.6<br />
0.1<br />
0.9<br />
11.5<br />
13.1<br />
2.5<br />
9.6<br />
11.2<br />
4.1<br />
23.3<br />
5.8<br />
1987<br />
0.<br />
1.<br />
11.<br />
13.<br />
2,<br />
9,<br />
11,<br />
4.<br />
23.8<br />
5.9<br />
Total 78.9 82.1 84.2<br />
Air Conditioners<br />
Microwave Ovens<br />
Washers, Dryers<br />
Refrigerators<br />
Dishwashers, Disposals<br />
Ranges, Ovens<br />
Vacuum Cleaners<br />
Food Processors<br />
Heaters<br />
Others<br />
1988<br />
0.1<br />
1.2<br />
12.5<br />
14.1<br />
2.9<br />
9.5<br />
11.3<br />
4.5<br />
24.2<br />
6.0<br />
1989<br />
0.1<br />
2.0<br />
12.5<br />
14.4<br />
3.1<br />
9.7<br />
11.4<br />
4.8<br />
24.7<br />
6.1<br />
Forecast<br />
1990 1991<br />
0.2<br />
2.1<br />
12.1<br />
14.8<br />
3.3<br />
9.8<br />
11.4<br />
5.0<br />
25.2<br />
6.2<br />
0.2<br />
2.2<br />
11.7<br />
15.2<br />
3.5<br />
9.8<br />
11.5<br />
5.2<br />
25.7<br />
6.2<br />
1992<br />
0.2<br />
2.3<br />
11.3<br />
15.5<br />
3.7<br />
9.9<br />
12.0<br />
5.5<br />
26.2<br />
6.4<br />
1993<br />
0.2<br />
2.5<br />
10.9<br />
15.9<br />
4.0<br />
10.0<br />
12.3<br />
5.8<br />
26.8<br />
6.6<br />
Total 86.3 88.8 90.1 91.2 93.0 95.0<br />
ESAM Newsletter © 1988 Dataquest Incorporated December<br />
Source: Dataquest<br />
December 1988
COMPANY ANALYSIS<br />
Detailed below is a brief overview of the major white goods manufacturers in<br />
Europe.<br />
AB Electrolux<br />
AB Electrolux is Europe's largest white goods manufacturer. The group as a whole<br />
has 450 operating companies in 40 countries manufacturing 26 product lines in five<br />
business areas, covering household appliances, forestry and gardening, industrial,<br />
commercial, and components. The household appliances area is Electrolux's largest<br />
business area, with 1987 sales of $6.23 billion.<br />
Electrolux has made several substantial acquisitions over the last few years. In<br />
1986, it acquired White Consolidated Industries, the third-largest U.S. white goods<br />
manufacturer, for $750 million. This acquisition made Electrolux the largest white goods<br />
manufacturer in the world. In 1984, Electrolux acquired 49 percent of Zanussi, the<br />
Italian white goods manufacturer. In 1985, Electrolux acquired Zanker of Germany,<br />
manufacturer of washers and dryers, and, in 1987, it acquired Thorn EMI's white goods<br />
division.<br />
Electrolux has striven toward economies of scale, knitting together its many<br />
acquisitions into a coherent and cohesive global entity. It now manufactures all its<br />
front-loading washing machines for Europe at Perdenone, Italy. Electrolux builds all<br />
top-loaders at Revin, France; all microwave ovens in Britain' and all top-price<br />
refrigerators in France. Other manufacturing locations are in Sweden, Norway,<br />
Switzerland, and the United States.<br />
Dataquest estimates Electrolux's market share of the total European white goods<br />
market to be 25 percent.<br />
AEG Aktiengesellschaft<br />
Daimler-Benz has been the majority shareholder of AEG Aktiengesellschaft since<br />
1986. White goods account for a small part of the corporation turnover, representing<br />
less than 10 percent of the total. Dataquest estimates that Daimler-Benz's 1986 white<br />
goods sales were $955 million and believes that AEG's share of the total European white<br />
goods market is approximately 6 to 7 percent. AEG has four white goods manufacturing<br />
plants in Germany.<br />
Bosch-Siemens Hausgerate<br />
Bosch-Siemens Hausgerate is a jointly owned company between Robert Bosch and<br />
Siemens in equal shares. Its sales reached $2.2 billion in 1987. Dataquest estimates that<br />
Siemens-Bosch has an 11 percent share of the European white goods market.<br />
© 1988 Dataquest Incorporated December ESAM Newsletter
Bosch-Siemens has four plants in Germany and one in Austria. The company owns<br />
100 percent of Neff GmbH, which has manufacturing plants in Germany, France, the<br />
United Kingdom, and Austria. Bosch-Siemens also has a 55 percent interest in Pitsos SA<br />
of Athens.<br />
GEC<br />
GEC owns Hotpoint and the Tube Investments' white goods division. Tube<br />
Investments is known for its Creda range. Refrigerators, freezers, and washing machine<br />
motors are made in England in Peterborough, and washing machines are made at their<br />
Llandudno and Rhyl plants in Wales.<br />
Hoover U.K.<br />
Hoover U.K., a subsidiary of the U.S. Group, manufactures vacuum cleaners in<br />
Cambuslang, Wales, and washing machines in Merthyr Tydfil, Wales.<br />
Merloni<br />
Merloni, a privately owned Italian company, recently purchased 75 percent of Indesit<br />
of Italy. Indesit was formally controlled by the Campioni family. The of combination<br />
Merloni (better known for its Ariston brand) and Indesit gives it a 9 percent share of the<br />
European white goods market.<br />
Miele<br />
Miele is a privately owned German company. Miele made the first wooden washing<br />
machine in 1903 and the first electric unit in 1929. The company has six manufacturing<br />
plants, five located in Germany and one in Austria.<br />
NV Philips<br />
Philips' white goods sales reached $3.1 billion in 1987, approximately 11 percent of<br />
the Philips Group's total turnover. Dataquest estimates Philips' share of the European<br />
white goods market to be 13 percent.<br />
Whirlpool, one of the largest U.S. white goods manufacturers, with an estimated<br />
15 percent share of the U.S. white goods market in 1986, acquired a 53 percent stake in<br />
Philips' white goods business in 1987.<br />
Philips has acquired several white goods manufacturers, including Bauknecht of<br />
Germany and IRE of Italy in 1984 and, in 1972, Ignis of Italy.<br />
Philips has a microwave plant in Sweden and white goods plants in the Netherlands,<br />
Spain, France, Portugal, the United Kingdom, Germany, and Austria.<br />
ESAM Newsletter © 1988 Dataquest Incorporated December
Thomson SA<br />
Thomson is bringing its consumer electronics operations (brown and white goods)<br />
together under one holding company called Thomson Consumer Electronics. This holding<br />
company will also incorporate the RCA consumer business acquired by Thomson in 1987.<br />
Dataquest believes that this will make Thomson the third-largest consumer<br />
manufacturer worldwide, after Matsushita and Philips. Dataquest estimates Thomson's<br />
white goods market share in Europe to be 6 percent.<br />
Others<br />
Other European white goods manufacturers include Moulinex (France), Gruvesa<br />
(Spain), Eurelsa (Spain), Unelsa (Spain), and Candy (Italy).<br />
FUTURE OUTLOOK<br />
Sales revenue will continue to exhibit low growth rates, in the 1 to 2 percent range.<br />
Because this is well below the average inflation rate, it represents a decline in real<br />
terms.<br />
The driving force behind the white goods market growth can be seen by measuring<br />
the penetration level of these goods in European households. Key mature products—for<br />
example, refrigerators, washing machines, and vacuum cleaners—have already reached<br />
saturation levels of approximately 80 percent. The resultant low growth is accounted for<br />
mainly by the replacement market, Pro
DataQuest<br />
t acompAiwcf<br />
The E^inK^sdsCrrct CApdnbon<br />
Research Newsletter<br />
SUMMARY<br />
1992—WHAT'S IN A NUMBER?<br />
ESAM Code: Vol. 11, Newsletters<br />
1988-6<br />
0000883<br />
On June 21, 1988, Malcolm Penn, Vice President and Director of Dataquest's<br />
European Operations, gave a keynote address at the Semiconductor Equipment and<br />
Materials Industry (SEMI) European Industry Focus Conference held in Munich, West<br />
Germany. The theme of this conference was "Can Europe Make It?" The theme of the<br />
Dataquest keynote address was "1992—Has Europe Got It? An Analyst's View." A copy<br />
of this speech with its accompanying slides is attached and is being published by all the<br />
Dataquest European Services.<br />
1992—HAS EUROPE GOT FT? AN ANALYST'S VIEW<br />
1992 represents the metamorphosis of the European Economic Community<br />
(EEC)—the transition from caterpillar to butterfly. The genesis was in 1957 when the<br />
six founder member states (Belgium, Federal Republic of Germany, France, Italy,<br />
Luxembourg, and Netherlands) formed the EEC. It grew to nine in 1973 (Denmark,<br />
Republic of Ireland, and United Kingdom), ten in 1981 (Greece), and twelve in 1986<br />
(Spain and Portugal).<br />
The next move is now coming—in 1992 the EEC will grow into one—the single<br />
market.<br />
The objective of creating a single "common market" in the EEC goes back to the<br />
EEC Treaty of Rome which established the Community 31 years ago. In 1985, the EEC<br />
heads of government committed themselves to completing the single market<br />
progressively by 31 December 1992. Their commitment has been included in a package<br />
of treaty reforms known as the Single European Act, which came into force on 1 July<br />
1987.<br />
Dataquest's European Research Operations have been tracking the European<br />
electronic equipment industries since 1981 and recently, with the significant winds of<br />
change that have been dominating the European industrial scene, the potential that the<br />
1992 single European market could have. This keynote address presents the issues and<br />
analysis of the present situation, one year after the passing of the Single European Act,<br />
together with the challenges and opportimities that lie ahead.<br />
This speech was written using research material provided by the European<br />
Semiconductor, Computer, Telecommunication, Printer, Copying and Duplicating,<br />
Industrial Automation, and Personal Computer groups.<br />
© 1988 Dataquest Incorporated July—Reproduction Prohibited<br />
The amtent of this report represeras our interpretation and analysis of information generally available to the public or release by responsible individuals in the subject companies, but<br />
is not guaranteed as to accuracy or amtpleteness. It does not contain material provided to us in amfidence by our clients. Individual companies reported on and analyzed by Dataquest<br />
may be clients cfthis and/or other Dataquest services This informaiimi is not furnished in amnection with a sale or offer to sell securities or in connection with the solicitation (fan<br />
c^r to buy securities. This firm and its parent and/or their officers, stoddwlders, or members of their families may, from time to time, have a long or short position in the securities<br />
mentioned and may sell or buy sudi securities.<br />
Dataquest Incorporated, 1290 Ridder Park Drive, San Jose, CA 95131-2398 / (408) 437-8000 / Telex 171973 / Fax (408) 437-0292
(Slide 1)<br />
Ladies and gentlemen, good morning. Yesterday Guy de Jonquieres from the<br />
Financial Times opened the proceedings of this conference with what I thought was a<br />
very thought-provoking speech entitled "1992: Has Europe Got It?—A Political View." I<br />
would like to continue from where Guy left off and look at the same issue from an<br />
analytical perspective.<br />
We analysts are charged with a challenge to piece together all the available data on<br />
a particular subject, rationalize it, sanitize it, and come up with a consensus view on<br />
what the issues and facts are—actually more specifically, the facts behind the facts; the<br />
trend behind the first glance. That is what I will attempt to do over the next 45 minutes<br />
or so.<br />
Dataquest held its seventh annual European Semiconductor Industry Conference<br />
approximately two weeks ago, at which we gathered together the top executives from<br />
makers and users of semiconductors. Part of the proceedings included a workshop to<br />
look at the issues of 1992.<br />
From this workshop, four major barriers to the growth of business and trade in<br />
Europe emerged: technical barriers^Kiiffering technical standards in broadcasting,<br />
telecoms, and consumer electronics; environmental barriers—different levels of safety<br />
in the various national laws on pollution, drugs, radiation levels on computer terminals,<br />
etc; government barriers—differing tariffs, duties, local subsidies, procurement policies<br />
and monopolies; and finally financial barriers—differences in the cost of capital,<br />
availability of venture capital, and tax incentives. These are the front-line analyses. So<br />
what was the fact behind the facts?<br />
Ignorance is the single biggest key barrier to the implementation of the single<br />
European market due to be created in 1992. While nearly everyone present knew<br />
something about the significance of 1992, no one there really knew how it was going to<br />
effect them or what the specific implications were for their business.<br />
(Slide 2)<br />
I'd like to draw your attention to a statement Jacques Delors, the president of the<br />
EEC made earlier this year. Specifically I'd like to refer you to the following words:<br />
"The 31st December 1992 deadline is now enshrined in a Single European Act."<br />
Ladies and Gentlemen, 1992 is a reality. On 31st December 1992, that Act will<br />
become law. That law will override local governments. Majority voting, as opposed to<br />
the present almost universal procedure of unanimous voting, will ensure that the days of<br />
filibustering are finally dead and buried. The four major barriers to trade mentioned<br />
above will no longer exist.<br />
The first of my recommendations this morning is that we had all better take this<br />
reality seriously—the days of the cozy cartels, monopolies, hidden tariffs, and other<br />
protectionist or self-interest motivated practices are numbered—1,653 days to be<br />
precise.<br />
Nobody likes change—we're all very much creatures of habit—but this is one change<br />
that will be viewed with hindsight as worthwhile. That is my second prognostication of<br />
the morning,<br />
2 © 1988 Dataquest Incorporated July ESAM Newsletter
What, I hear you ask, gives me the confidence to make such an equivocal<br />
statement? To answer that I would like to look back over past decades of the western<br />
world's economic performance.<br />
(Slide 3)<br />
The single biggest contributor to the postwar world economic recovery was market<br />
liberalization. The 1920s/'30s saw trade barriers dismantled, government-nurtured<br />
cartels broken up and controls on direct foreign investment lifted. The western world<br />
enjoyed a market-led sustained high GNP growth throughout this period.<br />
The oil shocks of the 1970s triggered a gradual shift away from market-led forces<br />
with an increasing tendency for cozy self-interests to prevail. GNP growth has<br />
slowed—unemployment has reached an intolerably high level (pan-Europe) and doggedly<br />
refuses to nudge down. EEC estimates reveal that the cost of non-European unity<br />
currently exceeds $100 billion dollars—$100 billion revenue lost due to internal trade<br />
barriers. To put that into perspective, that represents a year's growth in Europe today.<br />
SEA (The Single European Act) will change all that—prognosis number three.<br />
(Slide 4)<br />
Listed here are just a few examples of "hidden" trade barriers, and these are just<br />
some. Believe me, they are multitudinous in nature. This is today's reality. A reality<br />
we've grown up with, and a reality we've organized our activities, built factories,<br />
marketing plans, business strategies, and end products around.<br />
(Slide 5)<br />
At the stroke of midnight, 30 December 1992, all of these strategies and plans will<br />
be rendered obsolescent. They are all obsolescent now. Companies that are today still<br />
acting in a "country" organization structxjre and defining tactical issues on a local basis<br />
are in grave danger of missing the boat. On the 31st December 1992, we will have a<br />
have a free domestic market of over 330 million people, very nearly as many people as in<br />
the U.S. and Japan combined. Some of today's companies will not make the<br />
transition—they will fail to survive in this new competitive environment.<br />
If you would allow me to hypothesize that you accept that this will be the<br />
consequence of the SEA—given the drastic consequences it will bring—why then is it so<br />
necessary to change in the first place?<br />
ESAM Newsletter © 1988 Dataquest Incorporated July
(Slide 6)<br />
One of the few things in life that is a given certainty is progress. It is inevitable—I<br />
agree that not all progress is necessarily for the best, but nonetheless it happens. In the<br />
economic scenario, progress has taken us to a new dawning—one I would like to call<br />
"globalization." Joe Duncan, Dun & Bradstreet's corporate economist and chief<br />
statistician, points to seven factors that together characterize the new global economy.<br />
• First, trade and the fact that this has become now largely deficit driven.<br />
Large regional trade imbalances are no longer politically or commercially an<br />
acceptable way of life.<br />
• Second, macroeconomic policy—it ripples around the world. We worry about<br />
the size of the U.S. budget deficit, the fact that Germany remains unwilling to<br />
stimulate internal demand, and whether or not Japan really will open up its<br />
markets.<br />
• Third, currency fluctuations are a real wild card. How do you plan where to<br />
build new factories in an environment where an exchange rate variance can<br />
render them uncompetitive overnight, even before they have come on stream?<br />
• Fourth, international competition. That situation will continue to intensify.<br />
• Fifth, direct and indirect investment. Do I manufacture or buy the component<br />
or service I need? Will this be via an outsourcing agreement or via a joint<br />
venture?<br />
• Sixth, foreign capital flows. The excess liquidity at the global level slopping<br />
around the world seeking the best interest level or return is 26 times bigger<br />
than the total of all world trade put together. It is no longer trade factors<br />
that determine exchange rate values today—it is excess liquidity.<br />
• And, finally, information transfer. It is far easier than ever before, since<br />
financial transactions etc. are knitted together by instantaneous<br />
communications.<br />
I would like now to turn more specifically to your own industry, i.e. semiconductors,<br />
and its related fields, and to examine just where this industry is positioned today against<br />
the global backdrop I have just painted.<br />
(Slide 7)<br />
The semiconductor industry is currently embarking on a new phase in its<br />
evolutionary process. Phase 1 was technology-driven and the U.S. won that round. This<br />
was primarily due to the social and political environment at the time, ready access to<br />
venture capital, lots of innovation, and a strong military/aerospace industrial driver.<br />
Eventually technological strength alone was not sufficient and the mid-70s saw<br />
Phase 2 arrive—manufacturing. That round went to Japan, again due to their social and<br />
economic environment at the time, manufacturing science, people discipline, culture,<br />
and better economies of scale. That too is no longer sufficient.<br />
© 1988 Dataquest Incorporated July ESAM Newsletter
The 1980s have brought us to Phase 3—the marketing era. This is opening right now<br />
and no clear winners have yet emerged.<br />
(Slide 8)<br />
The implications, though, that it has on our industry have emerged. The winners in<br />
the marketing phase will be determined by these companies who today are positioning<br />
themselves internationally. And by that I don't just mean selling internationally, I mean<br />
sharing internationally: sharing products and technologies; embarking on horizontal and<br />
vertical alliances; and restructuring their organizations accordingly. All of this of<br />
course must clearly keep the focus on the customer as the priority objective.<br />
Let's now get down to the next level of detail and look first to see how Europe's end<br />
equipment industries are faring, and then, the position of Europe's semiconductor<br />
industry and its prospects for being among the winners for this next phase of the<br />
semiconductor evolution.<br />
(Slide 9)<br />
At the time the SEA becomes law, Dataquest predicts that the European<br />
semiconductor market will exceed $10 billion in value, up from our current estimate of<br />
the 1987 European market of $6.4 billion. That delta is slightly more the size of the<br />
whole of the 1983 European market. I would like to examine now what lies behind this<br />
growth rate and at the key industry segments that will impact the growth.<br />
(Slide 10)<br />
The computer segment will continue to have a major impact. With the creation of<br />
new emerging standards like UNIX and X OPEN, we expect to see more aggressive<br />
postures adopted by equipment vendors for larger market shares. This in turn will<br />
impact on price/performance ratios of semiconductors.<br />
It is important to remember when talking about computers nowadays that this<br />
industrial segment is no longer dominated by the mainframe computer. That era is<br />
fading after 30 years of dominance—the micro is taking command and in this area<br />
Europe's manufacturers have an already established strong position.<br />
In 1987, microcomputer revenue surpassed mainframes and there were over<br />
15 million PCs shipped into U.S. offices alone. The balance of power has moved to small<br />
systems that didn't even exist 10 years ago. Today's 80386~based machines can be<br />
bought for between $5K to $10K and offer the computing potential equivalent to the last<br />
generation of mainframes. By 1992, you will have 100 mips of computing power on your<br />
desk for the same cost as an 80386-based machine today.<br />
ESAM Newsletter © 1988 Dataquest Incorporated July
(Slide 11)<br />
Overall, the telecommunications market is not expected to experience rapid growth<br />
rates, mostly due to the slowdown in the number of digital lines installed as the system<br />
upgrade program reaches maturity, and the fierce PABX competition continues. The<br />
picture looks brighter for modems, cellular phones, and local area networks, other areas<br />
of European strength. In the wake of the recent consolidation amongst the European<br />
industry leaders, the now slimmed-down companies are better equipped to grasp the<br />
challenge that these opportunities will provide.<br />
(Slide 12)<br />
The consumer industry is making increasing use of sophisticated semiconductor<br />
devices and is responsible for driving some leading-edge products like data conversion<br />
and DSP products. Philips and Thomson dominate this market in Europe and together<br />
with Amstrad, especially as DSB starts to impact, are well poised to maintain this<br />
leadership position.<br />
(Slide 13)<br />
The joint Eurofighter project will have a major impact in Europe as it is not clear<br />
which military specification will be used for semiconductor components. This could be<br />
either U.S. specifications or the recently adopted CECC specifications. The resounding<br />
success that Airbus has had on the civil aircraft market is best measured by the rapid<br />
increase in protectionist political lobbying by Boeing in the United States over the past<br />
two years.<br />
(Slide 14)<br />
The relative strength of the European currencies over the U.S. dollar has resulted in<br />
a slowdown of exports of luxury models to the U.S. market. However the future trends<br />
for higher semiconductor contents in the midrange models will make the automotive<br />
market one of the most exciting segments for semiconductors.<br />
It is important here to remember that Europe produces more cars (12 million) than<br />
either the U.S. or Japan (8 million each), almost comparable with the total production of<br />
the U.S. and Japan added together. The problem today is that current "nontariff' trade<br />
barriers don't allow this potential economy of scale to be realized—1992 will change all<br />
that.<br />
(Slide 15)<br />
Finally, the industrial segment. This remains fragmented, but, for example, the<br />
adoption of solid-state electricity-measuring meters will give this area a big boost in<br />
semiconductor consumption, as the potential volumes involved are similar to those seen<br />
in the video games arena. Last year alone saw 2 million units shipped in field trials.<br />
An even bigger potential market will be that of the smart card, not particularly the<br />
financial sector of this market (though I agree that will be significant) but the disposable<br />
market, e.g. intelligent (nonforgable) tickets.<br />
6 © 1988 Dataquest Incorporated July ESAM Newsletter
What I would like to do now is to examine how Europe's big three semiconductor<br />
manufacturers are positioned in these six industrial segments, i.e. Philips, SGS-Thomson,<br />
and Siemens.<br />
(Slide 16)<br />
This slide shows the relative market size within the total European market along<br />
with the three companies' relative market ranking within the individual sectors. As you<br />
can see, apart from data processing and military sector, Eiffope's big three hold a<br />
commanding position. Now let's examine the facts behimi these already impressive facts.<br />
First, military. I've already discussed that this is a future high-growth segment, yet<br />
apparently Europe's semiconductor manufacturers do not participate strongly? Wrong,<br />
the number two supplier is Plessey/Ferranti just slightly behind National/Fairchild and<br />
ahead of Texas Instruments at number three. And with SGS-Thomson's total<br />
commitment to the European CECC program-I predict this picture will change<br />
dramatically over the next five years.<br />
In industrial, ASEA Brown Boveri commands the number five position and in<br />
consumer, ITT is number four. Though strictly speaking ITT is in our definition a<br />
U.S.-owned company—in reality it is totally European in structure, management, and<br />
control. I do not believe I am distorting the facts therefore by including ITT amongst the<br />
European manufacturers for the purpose of this analysis.<br />
In the other segment, data processing, we are all well aware that Europe's computer<br />
manufacturers conceded defeat to the U.S. in the mainframe market in the 1970s. No<br />
wonder, therefore, that the European semiconductor manufacturer's share here is the<br />
lowest. As I mentioned before, though, the whole characteristic of the data processing<br />
segment has changed—by 1992, therefore, we predict that Europe's semiconductor<br />
market share in this segment will increase from its present 24 percent to 35 percent.<br />
(Slide 17)<br />
The overall impact is shown here. Today's reality is that Europe's semiconductor<br />
companies control significant market share on a by-segment basis within Europe, from a<br />
low of 24 percent in data processing to an impressive high of 65 percent in consumer<br />
electronics.<br />
This achievement is the state of play at the entry point of the SEA. It has been<br />
achieved from a position of disadvantage brought about by fragmented markets,<br />
specification differences, and other operating and marketing inefficiencies. By 1992,<br />
those disadvantages will no longer be relevant. The true potential power that these<br />
numbers reflect will be capable of being unleashed against Europe's global competitors.<br />
Furthermore, I predict that the market pull will increase dramatically over the same<br />
time period, especially as Europe continues to flex its new-found cooperative strength<br />
under the banner "united we stand—divided we fall." For example, we are all well aware<br />
of the EEC antidumping issues that have affected the electronic printer industry over<br />
the last few months. This next slide clearly demonstrates the impact.<br />
ESAM Newsletter © 1988 Dataquest Incorporated July
(Slide 18)<br />
This year, Japanese production of electronic printers in Europe will reach 1.2 billion<br />
units, up from less than lOOK units in 1987. Next year, it will rise a further dramatic<br />
40 percent to 1.7 billion units. And with an EEC mandated 40 percent minimum local<br />
content, this is a huge shot in the arm; a tremendous marketing opportunity for Europe.<br />
There will be many more examples of this kind to follow as Europe starts getting tough<br />
in the globalization economic era.<br />
(Slide 19)<br />
Let's now step down one more level to look at the area of semiconductor production<br />
in Europe. Approximately 75 percent of the total semiconductor manufacturing base in<br />
Europe is European-owned. I predict that this will decrease over the next five years, not<br />
in real terms, but as a percent of total, as foreign companies rush to build new factories<br />
in Europe. And here I'm not talking about low value-added assembly plants—the<br />
semiconductor equivalent of a screwdriver plant. I'm speaking about full-blown wafer<br />
manufacturing facilities. Already Japan, led by NEC in Scotland, has gotten this<br />
message loud and clear.<br />
I'd like to pause now to reflect on what I've been discussing over the i>ast 30 minutes<br />
or so. What I've tried to do is to walk you "top down" through the current economic,<br />
political, and social environment, and show you how we see this changing over the next<br />
five years; to look at where Europe's end equipment markets are within this context; and<br />
the position of Europe's semiconductor industry to support this. I've made several<br />
prognostications en route, but so far no conclusions. Before I do that, I'd like to traverse<br />
that same route, "bottom up"—the classical analyst's approach to issue solving.<br />
(Slide 20)<br />
Whenever I've shown this slide in the past, it is always the first-level facts that<br />
dominate the dialogue. "See how dominant Japan is in its home market—isn't it time we<br />
forced them to open their markets?" Another common statement is "Look how small<br />
Europe's share of its own market is, compared with that of Japan and the U.S." To me<br />
though, the correct analysis is that Europe, far from being the laggard, is actually a<br />
perfect representation of the model multinational citizen of the future—build where you<br />
sell, buy where you build—emphasis on local value added.<br />
(Slide 21)<br />
In this new model of future excellence, the essence will be focused on a more even<br />
balance and sharing internationally. I would remind you of my earlier comments on the<br />
factors characterizing the new globalization economic era.<br />
Europe has already achieved this balance. Its downsizing and adjustment process is<br />
well down the track. The U.S and Japan are only just beginning on this route and for<br />
them, the painful adjustment process that Europe went through in the 1970s and early<br />
1980s lies ahead. I'm sure they will adjust quicker than Europe did, but today Europe has<br />
the strategic and tactical advantage.<br />
Bi © 1988 Dataquest Incorporated July ESAM Newsletter
(Slide 22)<br />
This necessary adjustment to the U.S and Japanese semiconductor domestic supply<br />
markets is of course an export opportunity for Europe's semiconductor manufacturers.<br />
In past years, poor export performance has been a fundamental characteristic of the<br />
so-called European malaise. Not any more I am glad to say.<br />
In 1987, exports accounted for 42 percent of Philips' worldwide revenue, 38 percent<br />
of SGS-Thomson's, and even Siemens, with its still essentially parochial marketing<br />
approach to semiconductors, achieved a commendable 28 percent figure. With the<br />
already strong home base I talked about earlier, the impact 1992 will have will be in<br />
making this position even stronger. European companies are positioned with the<br />
strongest set of cards than at any time previously in the history of the semiconductor<br />
industry.<br />
Let's turn now to the political initiative in the EEC. What chance does the EEC<br />
really have of significantly influencing industrial policy after 40 years or so of internal<br />
wrangling over such items of global importance as the price of sugar beet, milk quotas,<br />
and other agricultural related issues?<br />
(Slide 23)<br />
In the beginning was Esprit, considered at the time as doomed to failure, except<br />
perhaps by the more visionary champions.<br />
This slide shows the present status at the end of the first phase of the program.<br />
Even the most cynical are now compelled to accept that this initiative has not been a<br />
failure. I would agree it is too early to say it has been a resounding success, but I believe<br />
it is fair to say that it has exceeded even the most optimistic of expectations at the<br />
onset. It also showed that collaborative research could work and it spawned many<br />
clones, e.g. Alvey, Eureka, and Jessi as well as specific company collaboratives, e.g.<br />
Philips' and Siemens' Megaproject. Moving on from collaborative research and<br />
development to manufacturing, I would remind you of a prophecy I made in 1984 that a<br />
major restructuring in the world semiconductor industry was imminent.<br />
To succeed in the semiconductor industry you need to have either a sufficiently<br />
large market share to be somewhat isolated and protected from the industry's cyclical or<br />
tactical issues (that figure is around 4 to 8 percent market share). Or you need to be<br />
small enough to exploit a niche market opportunity, either technology or market related,<br />
where other factors allow a leadership position to be developed within a narrow field.<br />
Only a handful, perhaps 10 or 12 companies, will be in the former position, whereas in<br />
the latter position, this is where the bulk of the semiconductor companies will lie. Each<br />
will have less than 1 percent market share.<br />
It is in the middle band where the bulk of the industry realignments will<br />
occur—companies that are too big to be small and too small to be big. For these<br />
companies there is only one of two options. Merge (or be merged) or face extinction.<br />
ESAM Newsletter © 1988 Dataquest Incorporated July
(Slide 24)<br />
As you are aware, there have been many such examples of mergers in the<br />
semiconductor industry over the past 18 months, most noticeable in Europe that of SGS<br />
and Thomson, Plessey and Ferranti, and Brown Boveri and ASEA. In all cases, the<br />
combined companies are potentially much stronger and better equipped to face the issues<br />
of globalization than either part could have done independently.<br />
(Slide 25)<br />
Moving on now to Europe's equipment manufacturers. Here, too, evidence of change<br />
is endemic. I'd like to draw your attention to two interesting examples.<br />
First, cellular radio in Scandinavia. As the result of cooperation between the four<br />
local manufacturers and their PTTs, Sweden, Norway, Denmark, and Finland have<br />
managed to achieve an economy of scale and technological leadership that none could<br />
possibly have achieved unilaterally. And that in perhaps the most closeted of all<br />
industries—telecommunications.<br />
(Slide 26)<br />
Secondly, the activities of an organization called STACK. In existence now since<br />
the early 1970s, STACK is a user group of predominantly European system manufacturers<br />
whose role is to exploit the benefits of shared resources. An incredibly visionary<br />
decision when first formed and one of Europe's true success stories.<br />
Its early pioneering work has already put in place real programs covering the issues<br />
that are today only just beginning to achieve the necessary level of visibility in many<br />
other companies.<br />
(Slide 27-29)<br />
These three slides show a sample of some of the programs STACK has already<br />
established.<br />
(Slide 30)<br />
If one returns to the changing industry characteristics brought about by the era of<br />
global economy, these driving forces at work in the changing supplier/customer<br />
relationships show remarkable coincidence to the programs already successfully<br />
undertaken by STACK.<br />
(Slide 31)<br />
I mentioned this briefly earlier in my talk, but the implication of the previous slide<br />
is that as a result of the changing supplier/manufacturing relationships, foreign<br />
companies operating in Europe will progressively move down the so-called "value added"<br />
manufacturing chain, from sales, moving rapidly through pure assembly (or screwdriver<br />
operations) down to design, development, real local manufacturing, and local<br />
10 © 1988 Dataquest Incorporated July ESAM Newsletter
procurement, to eventual export of original European conceived and manufactured<br />
products. IBM is probably the best established in this regard at the present time, though<br />
other foreign companies, notably Digital and Sony, are catching up fast—the trend is<br />
inevitable. Given the 1992 deadline, we expect an acceleration of this trend as foreign<br />
companies strive to become good Europeans before the internal trade barriers fall.<br />
(Slide 32)<br />
I polled our internal Dataquest statistics recently to review the five hottest areas in<br />
the electronics equipment markets. They are shown here listed in this slide. Europe's<br />
electronics manufacturers are already strongly positioned in all of these areas of<br />
activity. The SEA and the resultant strength that a cor^olidated single market will<br />
provide gives them a unique opportxmity to achieve a world-class position as these<br />
industrial segments reach maturity.<br />
I would like now to use my closing minutes to draw some conclusions.<br />
(Slide 33)<br />
First, Europe will become a unified market after 1992. Restrictive trade barriers<br />
will be illegal, the market size will truly be 330 million people, and new European<br />
standards will emerge, especially in the areas of consumer electronics,<br />
telecommunications, and data processing. Companies that fail to recognize this<br />
prospective reality are destined for the scrap heap. And no matter how intransigent the<br />
problems may appear today, ignoring the inevitable will not help.<br />
The resultant economies of scale will drive down operating costs and Europe will be<br />
not only more competitive in its own market, but strategically and tactically positioned<br />
to exploit the export opport\jnities from a position of strength and equality with its other<br />
world competitors.<br />
(Slide 34)<br />
Europe will have the necessary semiconductor technology in place. Programs such<br />
as Esprit, Eureka, Megaproject, and Jessi will ensure that. It has today a production<br />
process capability comparable to the best, e.g. 1.2 micron CMOS, 1.5 micron bipolar,<br />
BiCMOS, and state-of-the-art sophisticated packaging techniques.<br />
The EEC initiative will also ensure that multinationals do adopt sound "good citizen"<br />
operating principles already discussed, including a high value-added local procurement<br />
content, and collaborative research and development, to ensure a strong manufacturing<br />
base is maintained. Europe's existing industrial strength will increase significantly.<br />
(Slide 35)<br />
As I speak to you here today, 1992 is only 1,653 days away. The question that<br />
remains on the table is whether the progress towards it will be evolutionary or<br />
revolutionary. Clearly the methods of managing revolution are different from evolution.<br />
ESAM Newsletter © 1988 Dataquest Incorporated July 11
I believe it will be revolutionary—and those companies that act the fastest will be<br />
the ones to make the substantial gains in the future. Indeed, I would go even further. I<br />
believe that if you haven't today already got a clear plan in place to take account of this<br />
effect that the SEA will have when it comes to force an 31st December 1992, it may<br />
already be too late.<br />
Now for some tactical advice—how to organize a revolution.<br />
(Slide 36)<br />
For this I've called upon the collective wisdom of prior experts to this field: Marx,<br />
Lenin, and Mao.<br />
• Get rid of the old guard<br />
• Build a new team<br />
• Explain the new reality<br />
• Develop a new philosophy and culture<br />
• Implement a new strategy<br />
• Declare a general modularization<br />
• Keep the revolution going<br />
(Slide 37)<br />
To conclude, I believe we do have a picture of 1992; we think we know what it will<br />
look like, but the trouble is, it is currently a jigsaw and the pieces are distributed<br />
throughout the countries in Europe. For the first time in nearly two decades, the 1990s<br />
offer the outlook of a new springboard for economic policy management and for major<br />
reductions in chronic European unemployment.<br />
I would like to close by postulating the answer to the following question: What will<br />
be the critical success milestones looking back to 1992 in, say, 1998?<br />
The first is really a prerequisite, without which the reality of a single European<br />
market will be unattainable—monetary unity and a central European bank. The second is<br />
qualitative, a perspective, and that is the feeling that the job is not quite finished yet.<br />
And third, the quantitative aspect, that the growth in Europe was higher than it would<br />
have been had unity not occurred.<br />
The challenge of a single European market by 1992 is first and foremost a challenge<br />
for Europeans. If they respond robustly, they will propel Europe onto the world stage in<br />
a position of competitive strength and on an upward trajectory of economic growth<br />
lasting into the next century.<br />
Jennifer Berg<br />
Malcolm Penn<br />
12 © 1988 Dataquest Incorporated July ESAM Newsletter
(Slide 1)<br />
(Slide 2)<br />
1992: HAS EUROPE GOT IT?<br />
MALCOLM G. PENN<br />
VICE PRESIDENT<br />
DATAQUEST EUROPE<br />
1992<br />
in 1992 the EEC countries form a genuine 'Common<br />
Market".<br />
'The 31st December 1992 deadline is now enshrined in<br />
a single European Act which defines the international<br />
market as an area without frontiers in which the free<br />
movement of goods, persons, services and capital is<br />
insured'. 'In recent months there has been an upsurge<br />
of support from businesses for the grand design<br />
implicit in the 1992 deadline'.<br />
"The Commission will develop a policy to promote the<br />
services market with an eye to completion of the<br />
internal market and the growing globalisation of trade".<br />
JACQUES DELORS - EEC PRESIDENT - 20 JANUARY 1988<br />
ESAM Newsletter © 1988 Dataquest Incorporated July 13
(Slide 3)<br />
(Slide 4)<br />
POSTWAR WORLD ECONOMIC RECOVERY<br />
• Market liberalization<br />
• 1920s/'30s trade barriers dismantled<br />
• Government-nurtured cartels broken up<br />
• Controls on direct foreign investment lifted<br />
Since the 1970s there has been<br />
a gradual shift away from market-led forces<br />
The Single European Act will turn the tide<br />
TRADE BARRIERS - - EUROPE<br />
• Technical<br />
-Standards (TV. telecommunications, power supplies)<br />
-Safety<br />
-Environmental (RF radiation, automobiles)<br />
• Financial<br />
-Standard terms and conditions<br />
-Local currency trade<br />
-Interest rates and capital sources<br />
• Government and legal<br />
-Tariffs and tax rates<br />
-Duties<br />
-Quotas<br />
-Subsidies<br />
14 © 1988 Dataquest Incorporated July ESAM Newsletter
(Slide 5)<br />
(Slide 6)<br />
1992 IMPACT<br />
• This will require a substantial re-think of our<br />
marketing strategies<br />
• Can manufacturers continue to have "Country"<br />
organisations defining<br />
- marketing strategies?<br />
- sell prices?<br />
- inventory levels?<br />
- support?<br />
NEW ECONOMIC ERA - GLOBALIZATION<br />
Seven factors on global economy<br />
• Trade<br />
• Macroeconomic policy<br />
• Currency fluctuations<br />
• International competition<br />
• Direct and indirect investment<br />
• Foreign capital flows<br />
• Information transfer<br />
ESAM Newsletter © 1988 Dataquest Incorporated July 15
(Slide 7)<br />
(Slide 8)<br />
THREE PHASES OF SEMICONDUCTOR INDUSTRY<br />
Phase 1 - Technology<br />
Phase 2 - Manufacturing<br />
Phase 3 - Marketing<br />
POSITIONING INTERNATIONALLY<br />
Means sharing internationally<br />
• Products and technologies<br />
• Organizational restructuring<br />
• Horizontal and vertical alliances<br />
• Customer-orientated as first objective<br />
16 © 1988 Dataquest Incorporated July ESAM Newsletter
(Slide 9)<br />
(Slide 10)<br />
EUROPEAN SEMICONDUCTOR MARKET<br />
BY END-USE SEGEMENT - 1987<br />
a Communications<br />
D Data Processing<br />
a Industrial<br />
D Consumer<br />
D Military<br />
n Transportation<br />
Total - $6,365 Million<br />
EUROPEAN COMPONENTS GROUP<br />
e Merger mania<br />
- GEC-Plessey<br />
- Ericsson-Matra<br />
- Bosch-Schneider<br />
- Alcatel-ITT<br />
Telecommunications<br />
Soureei Dataquest<br />
• Growth areas - 1987-1988<br />
- Modems - $540 million to $611 million - 13.1% growth<br />
- Central switches - $8.7 billion to $8.9 billion -<br />
2.8% growth<br />
- Cellular phones - $730 million to $951 million -<br />
30.3% growth<br />
- LANs - $524 million to $786 million - 49.9% growth<br />
Sourcei Dataquest<br />
ESAM Newsletter © 1988 Dataquest Incorporated July 17
(Slide 11)<br />
(Slide 12)<br />
EUROPEAN COMPONENTS GROUP<br />
Computers<br />
• Northern Europe takes the lead<br />
- Amadahl. Apple, Compaq. Digital. IBM. ICL, Wang<br />
• Higher-resolution graphics<br />
• Networking<br />
• 3.5' disk drives<br />
EUROPEAN COMPONENTS GROUP<br />
Industrial<br />
• Medical<br />
- GEC/Philips venture abandoned<br />
• Energy management<br />
- Solid-state meter trials in U.K. and France<br />
successful<br />
- Enertec. Ferranti, GEC. Sangamo, Siemens<br />
18 © 1988 Dataquest Incorporated July ESAM Newsletter
(Slide 13)<br />
(Slide 14)<br />
EUROPEAN COMPONENTS GROUP<br />
Consumer<br />
"Professional consumers"<br />
- Nokia. Philips, Siemens. Thomson<br />
Compact disks (DSPs, video. RAMs)<br />
High-definition TVs (DACs. DSPs. ECL)<br />
Digital audio tape<br />
EUROPEAN COMPONENTS GROUP<br />
Military<br />
Eurofighter project<br />
Procurement flat in U.K. and France<br />
Potential growth in German market<br />
Airbus Industrie<br />
ESAM Newsletter © 1988 Dataquest Incorporated July 19
(Slide 15)<br />
(Slide 16)<br />
EUROPEAN COMPONENTS GROUP<br />
Transportation<br />
Huge impact due to currency revaluation<br />
Slow growth in luxury models<br />
Semiconductor content increasing<br />
Car production higher in Europe than in U.S.<br />
and Japan<br />
EUROPEAN END-USE VENDOR RANKINES - 1987<br />
^^^^^^•^^^^^^^^^^^I^^^H^^^^H^^MI^^^^^^^^^^H^^HH^^^B^^HMH^^^H<br />
(Millions of US Dollars)<br />
Segement Philips SGS-Thomson Siemens Market Size<br />
Data processing<br />
Communications<br />
Industrial<br />
Consumer<br />
Military<br />
Transportation<br />
4<br />
1<br />
1<br />
1<br />
4<br />
6<br />
8<br />
3<br />
3<br />
2<br />
8<br />
2<br />
6<br />
5<br />
2<br />
3<br />
N/A<br />
1<br />
23%<br />
25%<br />
21%<br />
16%<br />
9%<br />
7%<br />
Total 1 2 5 100%<br />
Revenues $930 $537 $475 $6,335<br />
Soureei Dataquest<br />
20 © 1988 Dataquest Incorporated July ESAM Newsletter
(Slide 17)<br />
EUROPEAN END-USE VENDOR<br />
MARKET SHARES - 1987<br />
Segement % Share<br />
Data processing<br />
Communications<br />
Industrial<br />
Consumer<br />
Military<br />
Transportation<br />
24<br />
40<br />
49<br />
65<br />
36<br />
48<br />
Total 43<br />
TOP 5 EUROPEAN COMPANIES CONTROL 38% OF THE MARKET<br />
Sourcei Dataquost<br />
(Slide 18)<br />
JAPANESE PRINTER MANUFACTURER SURVEY<br />
Expected Offshore Printer Production<br />
(Thousands of Units)<br />
1987 1988 1990<br />
North America 206 500 850<br />
Western Europe 92 1.245 1.740<br />
Rest of World 3 5 10<br />
Total 300 1.750 2.600<br />
Sourcei Dataquest<br />
ESAM Newsletter © 1988 Dataquest Incorporated July 21
(Slide 19)<br />
(Slide 20)<br />
ESTIMATED EUROPEAN SEMICONDUCTOR<br />
PRODUCTION IN 1987<br />
Europe<br />
US<br />
Japan<br />
ROW<br />
Total<br />
(Millions of U.S. Dollars)<br />
n Europe<br />
D U.S.<br />
D Japan<br />
$80<br />
Total - $4,295 Million<br />
1987 REGIONAL MARKET SHARES<br />
(Billions of US Dollars)<br />
Sourc«< Dataquest<br />
Europe US Japan ROW Total<br />
2.6<br />
2.9<br />
0.9<br />
0.0<br />
0.8<br />
8.7<br />
2.0<br />
0.2<br />
0.1<br />
1.2<br />
13.0<br />
0.0<br />
0.5<br />
1.1<br />
1.9<br />
0.4<br />
4.0<br />
13.9<br />
17.8<br />
0.6<br />
6.4 11.7 14.3 3.9 36.3<br />
Souree> Dataquest<br />
22 © 1988 Dataquest Incorporated July ESAM Newsletter
(Slide 21)<br />
(Slide 22)<br />
Europe<br />
Other<br />
1987 EUROPEAN EXPORTS<br />
(Millions of US Dollars)<br />
Philips SGS-Thomson Siemens<br />
$930<br />
673<br />
Total $1,603<br />
% Export 42.0<br />
$537<br />
322<br />
$859<br />
37.5<br />
IN THE BEGINNING - ESPRIT<br />
Of the 227 projects in first phase<br />
• 143 Industrial significance<br />
• 27 Marketed products<br />
• 44 Products in developments<br />
• 44 Transferred outside esprit<br />
• 28 Contributed to international standards<br />
• 11 Scrapped or merged<br />
$475<br />
182<br />
$657<br />
27.7<br />
Source) Dataqu«st<br />
ESAM Newsletter © 1988 Dataquest Incorporated July 23
(Slide 23)<br />
(Slide 24)<br />
EUROPEAN SEMICONDUCTOR MERGEOVERS<br />
Plessey/FerrantI<br />
Brown Boveri/Asea<br />
SGS/Thomson<br />
CELLULAR RADIO - SCANDINAVIAN EXAMPLE<br />
Common system throughout Scandinavia<br />
- Sweden<br />
- Norway<br />
- Denmark<br />
- Finland<br />
Co-operation between PTT's and local<br />
manufacturers<br />
24 © 1988 Dataquest Incorporated July ESAM Newsletter
(Slide 25)<br />
(Slide 26)<br />
rtnu<br />
stack<br />
STANDARD COMPUTER KOMPONENTEN GmbH<br />
Control Data Corporation<br />
International Computers Limited<br />
The Plessey Company pic<br />
Nixdorf Computer A.G.<br />
Ing. C. Olivetti & C S.p.A.<br />
British Telecom pic<br />
The General Electric Company pic<br />
Standard Telephones & Cables pic<br />
General Telephone & Electronics Corp.<br />
Honywell Bull Inc.<br />
Italtal S.p.A.<br />
Northern Telecom Limited<br />
VENDORS - USERS<br />
CLOSER CO-OPERATION - TO ACHIEVE<br />
• Better Communication<br />
• Improved Quality and Reliability<br />
• Optimum Testing<br />
• Ship to Stock Procedures<br />
• On Time Delivery<br />
• Just in Time Delivery<br />
• Accurate Forecasting<br />
• Shorter Lead Times<br />
• Electronic Data Interchange<br />
ESAM Newsletter © 1988 Dataquest Incorporated July 25
(Slide 27)<br />
(Slide 28)<br />
VENDORS - USERS<br />
CLOSER CO-OPERATION - TO ACHIEVE Cont.<br />
• standard Racketing for Devices<br />
• Standard Labelling e.g. Bar Codes<br />
• Electronic Data Sheets<br />
• Computerized Device Models<br />
• Realistic ASIC Second Sourcing<br />
• Productive R&D<br />
• Realistic Pricing<br />
• Improved Quality and Realiability<br />
• Lower Cost of Ownership<br />
FORMAL MEETINGS<br />
• Technical Policy<br />
• Purchasing - Trend and Techniques<br />
• Test and Correlation<br />
• Purchase Specifications<br />
• Shared Evaluation<br />
• Semi-Custom - USICs<br />
• ASICs<br />
• Failure Analysis Techniques<br />
• Surface Mount Technology<br />
• Surface Mount Dimensions<br />
• Reliability<br />
26 © 1988 Dataquest Incorporated July ESAM Newsletter
(Slide 29)<br />
(Slide 30)<br />
SUPPLIER/CUSTOMER RELATIONSHIP<br />
Closer<br />
Longer-fewer<br />
Strategy - Technology roadmaps<br />
Product migration linkage<br />
Matched quality programmes<br />
Co-operative programmes<br />
- Developments<br />
- Qualifications<br />
- Tools<br />
Total data sharing<br />
Take time to establish<br />
Resources to maintain<br />
Sensitive data transfer<br />
Win-win requires changes<br />
VALUE ADDED MANUFACTURING CHAIN<br />
Sales<br />
Assembly<br />
Manufacturing<br />
Local procurement<br />
Design and Development<br />
Export<br />
ESAM Newsletter © 1988 Dataquest Incorporated July 27
(Slide 31)<br />
(Slide 32)<br />
28<br />
MULTINATIONAL CITIZEN PROFILE<br />
Buy where we build and sell<br />
• Products<br />
• Services<br />
• Technology<br />
• Jobs<br />
• Export<br />
MAJOR MARKET OPPORTUNITIES<br />
Markets<br />
32-blt PCs<br />
Digital TVs<br />
Smart Card Electronics<br />
Automotive Electronics<br />
Personal Communications<br />
* Measured in dollars<br />
© 1988 Dataquest Incorporated July<br />
5-Year<br />
CAGR*<br />
53.0%<br />
30.0%<br />
60.0%<br />
10.7%<br />
26.0%<br />
Sourcei Dataquest<br />
ESAM Newsletter
(Slide 33)<br />
(Slide 34)<br />
EUROPEAN ELECTRONICS INDUSTRY<br />
Future Trends<br />
• Europe will become a urrified market after 1992<br />
• Restrictive trade barriers will disappear<br />
• Size of population will be 330 million<br />
• New European standards will emerge in consumer.<br />
telecommunications, computer<br />
• Scale of economy will drive down costs<br />
• Europe will be more competitive in its own market<br />
EUROPEAN ELECTRONICS INDUSTRY<br />
Future Trends<br />
• Europe will have state-of-the-art processing capability<br />
- Esprit. Eureka. Megaproject. Jessi<br />
• European Community will ensure.<br />
- Multinationals sourcing components locally<br />
- Collaborative R & D on all fronts<br />
- Maintaining strong manufacturing base<br />
• Europe<br />
- Still strong in consumer, automotive<br />
- Telecommunications will get stronger<br />
- Stability in military market<br />
ESAM Newsletter © 1988 Dataquest Incorporated July 29
(Slide 35)<br />
(Slide 36)<br />
ARE WE FACING EVOLUTION OR<br />
REVOLUTION?<br />
If we decide the 1992 opportunity will<br />
substantially change the "rules" under which<br />
we operate - then it must be "revolution".<br />
The methods of managing revolution are<br />
clearly different from evolution!<br />
HOW TO ORGANISE A REVOLUTION<br />
1. Get rid of old guard<br />
2. Build a new team<br />
3. Explain the new reality<br />
4. Develop a new philosophy and culture<br />
5. Implement a new strategy<br />
6. Declare a general mobilisation<br />
7. Keep the revolution going!<br />
Source: Marx, Lein, Mao<br />
30 © 1988 Dataquest Incorporated July ESAM Newsletter
(Slide 37)<br />
THE 1992 CHALLENGE<br />
HIGH STAKES FOR EUROPE -<br />
THE PRIZE WITHIN THE GRASP<br />
ESAM Newsletter © 1988 Dataquest Incorporated July 31
V^^'^'-'V'^'^K^<br />
•^TIH^^^-®:<br />
Dataoyest<br />
acomparnrcrf<br />
itKDunDi^fadsticcti Corporation<br />
Research Newsletter<br />
SUMMARY<br />
FAR EAST MARKET OVERVIEW<br />
ESAM Code: Vol. II, Newsletters<br />
1988-5<br />
0000387<br />
The year 1987 was full of major changes for Japanese printer manufacturers. The<br />
dollar-to-yen exchange rate reached the highest point in history, antidumping pressures<br />
from Western Europe became a reality, and Japan was asked to change its exportoriented<br />
economic structure.<br />
This newsletter focuses on several topics relating to the Japanese printer industry,<br />
including the following:<br />
• Japanese worldwide printer shipments<br />
• The Japanese domestic market<br />
• Trade friction<br />
• Japanese overseas manufacturing trends<br />
(The material in this newsletter was derived from a presentation given by Kenji<br />
Muto, an Industry Analyst at Dataquest Japan. Mr. Muto gave his presentation at<br />
Dataquest's thirteenth annual Electronic Printer Industry Conference in April 1988.)<br />
JAPANESE WORLDWIDE PRINTER SHIPMENTS<br />
As shown in Figure 1, Japanese printer shipments for the past five years have grown<br />
at a compound annual growth rate (CAGR) of 22 percent. In 1983, 4.8 million units were<br />
shipped; in 1987, 10.4 million units were shipped with an export ratio of 90 percent.<br />
Dataquest expects that Japanese local printer production will drop below 10 million units<br />
in 1988. This expected decline in local Japanese production will result from the<br />
production shift to Western Europe due to EEC protectionist actions.<br />
© 1988 Dataquest Incorporated June—Reproduction Prohibited<br />
77K contatt cfthis report rept^sents our interpretation and analysis ofir^rnuOion generally available to the fmblic or released by responsible individuals in the subject companies, but<br />
is not guaranteed as to accuracy or completeness. It does not a)ntain material provided to us in cor^dence by our clients. Individual companies retorted on and analyzed by Dataquest<br />
may be cUenis cfthis and/or other Dataquest services. This informatitm is notfitmi^ied in amnection with a sale or offer to sell securities or in connection with the solicitation cfan<br />
c^r to buy securities- This firm and its parent and/or their c^icers, stoddiolders, or members of their families may, from time to time, have a long or short position in the securities<br />
mentioned and may sell or buy sudi securities.<br />
Dataquest Incorporated, 1290 Ridder Park Drive, San Jose, CA 95131-2398 / (408) 437-8000 / Telex 171973 / Fax (408) 437-0292
Millions of Units<br />
12-<br />
10-<br />
8-<br />
6-<br />
4-<br />
2<br />
0-<br />
4.8<br />
Figure 1<br />
Total Japanese Printer Shipments<br />
1SS3 19B4 19SS 1986 1987<br />
Souice: Dacaquest<br />
June 19Sa<br />
The 1987 Japanese printer shipments by world region are shown in Figure 2. The<br />
10.4 million units shipped are broken out into the following regions:<br />
• 5.55 million, 53 percent, shipped to the United States<br />
• 2.95 million, 28 percent, shipped to Western Europe<br />
• 0.63 million, 6 percent, shipped to the Rest of World countries<br />
• 1.30 million, 12.5 percent, remained in the Japanese domestic market<br />
Table 1 illustrates the 1987 Japanese printer shipments for the overseas and<br />
domestic markets, by printer technology. For the 1987 overseas market, the combined<br />
serial, impact, dot matrix (SIDM) and page, nonimpact, plain paper (PNPP) printers<br />
represented more than 90 percent of total units shipped. For the 1987 Japanese<br />
domestic market, however, the serial, nonimpact, thermal transfer (SNTT) and serial,<br />
impact, dot matrix printers accounted for more than 90 percent of the shipments.<br />
In terms of units, Epson is the world's leading printer shipper with its products under<br />
the Epson brand name. The second leading exporter is TEC, which is an OEM-oriented<br />
company. Following TEC is Oki. For the Japanese domestic market however, NEC is<br />
the leading shipper because of its 40 percent personal computer market share. Total<br />
Japanese domestic computer shipments for 1987 were estimated at 1.3 million units,<br />
with PCs accounting for 1.2 million units. Following NEC in the domestic printer market<br />
are Epson and Oki.<br />
© 1988 Dataquest Incorporated June ESAM Newsletter<br />
i
Western Europe<br />
Technology<br />
Serial, Impact, Dot Matrix<br />
Page, Nonimpact, Plain Paper<br />
Serial, Nonimpact, Thermal Transfer/<br />
Direct Thermal<br />
Serial, Impact, Fully Formed<br />
Serial, Nonimpact, Ink Jet<br />
Line, Impact, Fully Formed/<br />
Dot Matrix<br />
Line, Nonimpact, Thermal Transfer/<br />
Direct Thermal<br />
Total<br />
Figure 2<br />
1987 Japanese Printer Shipments by Region<br />
Japan<br />
< ^ ^ ><br />
Rest of World<br />
Table 1<br />
1987 Japanese Printer Shipments, by Technology<br />
Ovei rseas<br />
Units(M) Percent<br />
7.61<br />
1.14<br />
0.08<br />
0.23<br />
0.04<br />
83.5%<br />
12.5<br />
0.9<br />
2.5<br />
0.4<br />
United States<br />
^"S/-^<br />
Source: Dataquest<br />
June 1988<br />
Domestic<br />
Units(M) Percent<br />
0.94<br />
0.03<br />
0.27<br />
0<br />
0.02<br />
72.1%<br />
1.9<br />
21.0<br />
0.1<br />
1.6<br />
0.01 0.1 0.03 2.6<br />
0.01<br />
9.12<br />
0.1<br />
100.0%<br />
ESAM Newsletter © 1988 Dataquest Incorporated June<br />
0.01<br />
1.30<br />
Source:<br />
0.7<br />
100.0%<br />
Dataquest<br />
June 1988
Most of the Japanese firms are quite diversified. Consequently, printer sales are a<br />
small portion of their total business. For Epson, TEC, and Oki, 40, 25, and 20 percent of<br />
their total sales, respectively, are attributed to printers, and only 4 percent of NEC's<br />
sales are attributed to printers.<br />
Japanese Domestic Market<br />
The 1987 Japanese domestic printer market represented 1.3 million units<br />
(12.5 percent) of the total worldwide Japanese shipments. Dot matrix printers accounted<br />
for 940 thousand units (72.1 percent) and thermal transfer printers accounted for<br />
270 thousand units (21 percent). Shipments of other printer technologies represented<br />
rather small shares of the market.<br />
Shipments of the 24-wire, dot matrix printers in Japan accounted for 93 percent of<br />
all serial, dot matrix printer shipments, whereas the 18-wire printers accounted for only<br />
a few thousand units shipped. This imbalance is a result of the high resolution offered by<br />
24-wire printers, which is needed when printing kanji characters. It is interesting to<br />
note that Epson recently introduced a $2,500, 48-wire, 300-dpi dot matrix printer, to the<br />
domestic market, the VP-4800.<br />
The previously discussed Japanese domestic printers are those that are connected to<br />
computers. In the thermal transfer market, there is another market segment, the<br />
built-in Japanese word processor market (JWP). In 1987, more than 2 million JWP units<br />
were sold, of which at least 1.5 million were lap-top type printers. The JWP lap-top<br />
configuration consists of the following:<br />
• A keyboard<br />
• An LCS 4 X 10-inch display<br />
• A 3.5-inch flexible disk drive<br />
• An 80-column serial, nonimpact, thermal transfer (SNTT) printer<br />
If this shipment segment were counted, the total serial, thermal transfer market<br />
would consist of 1.8 million units. In terms of resolution, JWP printers are increasing to<br />
36, 42, and even 56 elements per printhead.<br />
Table 2 shows the Japanese domestic printer market rankings segmented by<br />
technology. As noted in the table, NEC is strong in the serial, dot matrix technology.<br />
The most popular speed range is 120 to 180 cps, accounting for 40 percent, followed by<br />
181 to 250 cps, accounting for 25 percent. Printing kanji takes approximately one-third<br />
to one-half the time required for printing the Japanese alphabet—alphanumeric Kana<br />
(ANK).<br />
© 1988 Dataquest Incorporated June ESAM Newsletter
•<br />
SIDM<br />
1. NEC<br />
2. Epson<br />
3. Oki<br />
49%<br />
Table 2<br />
Japanese Domestic Market Share<br />
(Based on Units)<br />
SNTT<br />
1. NEC<br />
2. Epson<br />
3. Hitachi<br />
80%<br />
PNPP<br />
1. Canon<br />
2. TEC<br />
3. NEC<br />
90%<br />
Source: Dataquest<br />
June 1988<br />
For the serial, thermal transfer technology, NEC is again the top market<br />
participant. The personal computer market affects this segment because the printers<br />
used are for the low-end PCs. The top three participants hold 80 percent of the market<br />
and offer speeds of less than 120 cps.<br />
In 1987, Japanese page printers were in the introductory stage, and only 28 thousand<br />
units were shipped to the domestic market. However, we expect the Japanese domestic<br />
page printer market to soar in 1988. The desktop publishing market is also expected to<br />
grow in the third quarter of 1988.<br />
TRADE ISSUES<br />
Our trade friction analysis is based on our Japanese printer manufacturer survey in<br />
the first quarter last year. The survey results are based on 27 of the major Japanese<br />
printer manufacturers. Seventeen companies responded to the survey. Our survey<br />
covered the following topics:<br />
• The movement of overseas production and its related problems<br />
• The exchange rate issue and its effect on overseas production<br />
• The Japanese printer manufacturers' response to trading difficulties<br />
As previously stated, the major Japanese printer production technology is serial, dot<br />
matrix. The survey respondents accounted for over 70 percent of the entire serial, dot<br />
matrix production. We believe that this percentage qualifies the validity of the survey<br />
results.<br />
Table 3 illustrates the respondents' offshore printer production plans. As shown for<br />
1987, the actual production was 300 thousand units, of which 200 thousand were produced<br />
in North America and 92 thousand were produced in Western Europe. We project that in<br />
1988, production units will increase to 500 thousand for North America and 1.25 million<br />
for Western Europe.<br />
ESAM Newsletter © 1988 Dataquest Incorporated June
Western Europe<br />
North America<br />
Rest of World<br />
MOVE TO WESTERN EUROPE<br />
Table 3<br />
Japanese Printer Manufacturers' Projections for<br />
Estimated Offshore Printer Production<br />
(Thousands of Units)<br />
1987 1988 1990<br />
92<br />
205<br />
_2<br />
1,245<br />
500<br />
5<br />
1,740<br />
850<br />
10<br />
Total 300 1,750 2,600<br />
Source: Dataguest<br />
June 1988<br />
The primary reason for Western Europe's production growth stems from the<br />
expected EEC antidumping duty expected to be levied on serial, dot matrix printers. In<br />
1987, Japanese printer exports to Western Europe were 2.9 million units and both serial<br />
dot matrix and fully formed printers were produced in Western Europe by Japanese<br />
companies. We expect that in 1988, 38 percent of the Western European market<br />
shipments will be produced locally by Japanese firms. Page printers will also be<br />
manufactured in Western Europe. By 1990, the number of locally produced units is<br />
predicted to increase to 1.74 million units.<br />
The situation is different for Japanese production in North America, however.<br />
Production growth is moderate in North America compared with Western Europe.<br />
The locations of Japanese printer factories in Western Europe are shown in<br />
Figure 3. These factories have commenced operations within the last 15 months and<br />
should expand production this year. We believe that the expected monthly run rate will<br />
reach 160 thousand units. The average factory size is anticipated to be 8,000 square<br />
meters with 1,200 total employees for this factory expansion.<br />
© 1988 Dataquest Incorporated June ESAM Newsletter
1.<br />
2.<br />
3.<br />
4.<br />
5.<br />
6.<br />
7.<br />
8.<br />
9.<br />
10.<br />
11.<br />
12.<br />
Figure 3<br />
Location of Japanese Printer Manufacturers<br />
in Western Europe<br />
Brother<br />
Citizen<br />
Epson<br />
Star<br />
NEC<br />
Oki<br />
Panasonic<br />
Canon<br />
Epson<br />
Canon<br />
Fujitsu<br />
TEC<br />
Wrexham<br />
Scunthorpe<br />
Telford<br />
Tredagar<br />
Tekfird<br />
Glasgow<br />
Newport<br />
Littre<br />
Paris<br />
Aglie<br />
Malagre<br />
Braunschweig<br />
Source: Dataquest<br />
June 1988<br />
ESAM Newsletter © 1988 Dataquest Incorporated June
Local Content<br />
In June 1987, the EEC passed legislation to control local content of new factories<br />
set up by companies with products subject to EEC antidumping duties. Essentially, the<br />
law states that products assembled in the EEC to escape antidumping duties must have<br />
40 percent local content. The EEC group investigating local content in European<br />
factories has recently completed its investigation of electronic typewriter factories, and<br />
it is currently evaluating local content in copier factories. The investigation of SIDM<br />
factories will begin in the fall of 1988.<br />
How soon can Japanese printer manufacturers meet with local content<br />
requirements? Table 4 focuses on this issue. As shown, within the next two years, a<br />
50 percent local content goal is possible, but it will pose a challenge for manufacturers.<br />
Number<br />
of Years<br />
0.5<br />
1.0<br />
1.5<br />
2.0<br />
Table 4<br />
Japanese Printer Manufacturers' Projections for<br />
Meeting Local Content Requirements<br />
(Western Europe)<br />
% Content<br />
22<br />
41<br />
45<br />
50<br />
Part<br />
Case Mechanism<br />
Case PCB<br />
Motor PCB<br />
PCB<br />
Electronic, PWB<br />
Manual Book<br />
Mechanism, Electronic<br />
Source: Dataquest<br />
June 1988<br />
Japanese manufacturers indicated that it would take twice as long to reach a<br />
50 percent goal, compared with 40 percent, which is the requirement mandated by the<br />
EEC. Table 5 illustrates the key concerns of Japanese manufacturers regarding overseas<br />
production in both North America and Western Europe. The three primary problems for<br />
Japanese companies manufacturing overseas are:<br />
• Parts procurement<br />
• Quality control<br />
• Production costs<br />
In the past, these problems were advantageous for Japanese manufacturers,<br />
however, but now, production and local content requirements are making overseas<br />
production disadvantageous. Production cost is a key element in manufacturing.<br />
© 1988 Dataquest Incorporated June ESAM Newsletter
Table 5<br />
Japanese Printer Manufacturers'<br />
Key Concerns in Overseas Production<br />
Concern Points*<br />
Parts Procurement 91<br />
Quality Control 82<br />
Production Cost 71<br />
Delivery 40<br />
Worker Education 36<br />
Local Government 35<br />
Domestic Employment 31<br />
Research and Development 23<br />
*Maximum points possible = 100<br />
Source: Dataguest<br />
June 1988<br />
This year, Japanese manufacturers have projected the dollar-to-yen exchange rate<br />
as $1 to ¥123.8. The projected range is relatively small: between ¥120 and ¥130. If<br />
the yen rises to 100, the expected overseas production ratio increases by nearly<br />
50 percent. Changes in the dollar-to-yen exchange rate will primarily affect overseas<br />
production in North America.<br />
Table 6 illustrates the Japanese printer manufacturers' projected actions toward<br />
government dumping charges. The top three answers to our survey question were factory<br />
set up, joint ventures with local manufacturers, and rationalization of production. In the<br />
case of Western Europe, factory set up has already taken place due to the European<br />
community movement.<br />
One-half of the survey respondents said they believe that some sort of trade<br />
restriction action will be taken by the U.S. government. The reasons they gave dealt<br />
with inconclusive trade laws and the U.S. manufacturers' appeal regarding dumping of<br />
serial, dot matrix printers.<br />
Regarding the high yen exchange rate, the respondents said they believe that a<br />
decrease in sales will occur. To maintain revenue, either price or volume will have to<br />
increase, resulting in either a value-added product or low-cost, high-volume production.<br />
Japanese manufacturers indicate they will focus on the following value-added areas, by<br />
technology:<br />
• PNPP—Higher functionality, dependability, software, controller, and color<br />
• SIDM—Paper handling, increased copies and speed, lower noise level, and<br />
special paper capabilities<br />
• SNIJ and SNTT—Regular paper, color, and high resolution<br />
ESAM Newsletter © 1988 Dataquest Incorporated June
Activity<br />
Factory Set Up<br />
Change Export Item<br />
Lobby Japanese Government<br />
Withdraw from Market<br />
Local Joint Venture<br />
Lobby Local Government<br />
Rationalize Production<br />
Review Marketing Channel<br />
Table 6<br />
Japanese Printer Manufacturers'<br />
Projected Actions from Government Dumping Charges<br />
*Maximum points possible = 100<br />
North America*<br />
90<br />
31<br />
46<br />
17<br />
72<br />
39<br />
73<br />
42<br />
Western Europe'<br />
89<br />
32<br />
50<br />
20<br />
83<br />
37<br />
71<br />
55<br />
Source: Dataquest<br />
June 1988<br />
The characteristics of the Japanese manufacturers in the printer business include<br />
the following:<br />
• No Japanese company manufactures printers exclusively.<br />
• Diversification of business is the mission for Japanese manufacturers.<br />
• Capturing market share is a prime strategy. Adequate market share,<br />
low-cost, and mass-quality production can provide enough investment return.<br />
Even among Japanese manufacturers, these characteristics lead to highly<br />
competitive environments. On the other hand, both Western Europe and the U.S. SIDM<br />
producers' governments are focused on local production and niche markets.<br />
DATAQUEST ANALYSIS<br />
We expect 15 percent of Japan's 1988 production capacity to move overseas. This<br />
trend is likely to continue because Japanese players are not only questioning the world<br />
economy, they are also realizing that cooperation and peaceful coexistence is imperative<br />
in order to maintain their prior levels of success. Thus many Japanese manufacturers<br />
are now seeking new ways of becoming recognized international companies by adding<br />
value to their products and contributing to the local economy.<br />
(This document is reprinted with the permission of Dataquest's Western European<br />
Printer Industry Service.)<br />
Jennifer Berg<br />
Robert Fennell<br />
10 © 1988 Dataquest Incorporated June ESAM Newsletter<br />
f
W^ Dataoyest<br />
acompanypf<br />
I1K DonKBnidsticct Corporation<br />
Research Newsletter<br />
SUMMARY<br />
ESAM Code: Vol. 11 Newsletters<br />
1988-4<br />
FAX MARKET SURGES AHEAD; JAPAN LEADS THE PACK<br />
The year 1987 proved to be another period of major growth for the worldwide<br />
facsimile market. In regional terms, the European market grew the fastest, with a<br />
compound annual growth rate (CAGR) of 110 percent (1987 versus 1986), The Japanese<br />
market, which is more mature, increased at a CAGR of 49 percent, while the U.S.<br />
market grew by a significant CAGR of 102 percent.<br />
In terms of unit shipments, the Japanese still led in 1987 with 1.1 million units. The<br />
number of European shipments (421,000 units) was slightly higher than U.S. shipments<br />
(417,000 units) for the second year running (see Table 1).<br />
Asia<br />
Europe<br />
Japan<br />
France<br />
Italy<br />
Sweden<br />
United Kingdom<br />
West Germany<br />
Rest of Europe<br />
North America<br />
United States<br />
Canada<br />
Rest of World<br />
Total<br />
Table 1<br />
Estimated Worldwide Facsimile Shipments<br />
(Thcnisands of Units)<br />
1995<br />
40<br />
199<br />
21<br />
21<br />
11<br />
50<br />
24<br />
72<br />
738<br />
227<br />
206<br />
21<br />
25<br />
1,229<br />
1987<br />
60<br />
420<br />
45<br />
60<br />
20<br />
100<br />
60<br />
135<br />
1,100<br />
456<br />
417<br />
39<br />
45<br />
2,081<br />
1991<br />
329<br />
1,876<br />
256<br />
211<br />
64<br />
340<br />
340<br />
665<br />
2,280<br />
1>500<br />
1,380<br />
120<br />
136<br />
6,121<br />
Source:<br />
© 1988 Dataquest Incorporated May—Reproduction Prohibited<br />
CAGR<br />
1987-1991<br />
53.0%<br />
46.0%<br />
54.5%<br />
37.0%<br />
34.0%<br />
35.8%<br />
54.3%<br />
49.5%<br />
22.0%<br />
34.5%<br />
35.0%<br />
34.0%<br />
32.0%<br />
31.0%<br />
Dataquest<br />
May 1988<br />
The amera of this report rqwsems our ir^rpret^ion and analysis cfinfonrnitum generally available to the public or released by responsible individuals in the subject companies, but<br />
is not guaranteed as k> accuracy or comf^eness, b does not (xmtain material pmvided to us in cor^ideriix by our cUents. Individual conqxmies reportai on and analyzed by Dataquest<br />
may be clients of this and/or other Dataquest services. This i^irmation is not furnished in connection with a sale or q^ lo sell securities or in conneaion wth the solicitation of an<br />
c^rto buy securities. This firm and its parent and/or tfwir cheers, stockholders, or members cf their families may, from time to time, have a Umg t^ short position in the securities<br />
merttimted and may sell or buy such securities.<br />
Dataquest Incorporated, 1290 Ridder Park Drive, San Jose, CA 95131-2398 / (408) 437-8000 / Telex 171973 / Fax (408) 437-0292
All this activity is of great interest to Japan, where 98 percent of the world fax<br />
manufacturing is currently taking place.<br />
In this newsletter, we will review the present fax market and the Japanese<br />
manufacturing phenomena. In addition, we will look at some development factors<br />
affecting the market into the 1990s.<br />
MARKET OVERVIEW<br />
A facsimile (fax) machine is a telecommunications product that must meet the<br />
stringent and often restrictive requirements of local PTTs and operating companies in<br />
order to receive approval for connection to the public switched telephone network<br />
(PSTN). Given that fact, it is a remarkable phenomenon that, in 1987, more than<br />
98 percent of the approved fax machines were of Japanese origin. Furthermore, as the<br />
market continues to grow, Dataquest expects the proportion of Japanese fax machines to<br />
exceed 99 percent in 1988. The following factors contribute to this situation:<br />
• Although the fax machine was initially developed in Europe by Muirhead and in<br />
the United States by Xerox, these western manufacturers were unable to<br />
maintain high volumes of commercially attractive products; they had stopped<br />
manufacturing fax machines by 1975.<br />
• The fax machine was then found to fulfill a major user requirement in the<br />
Japanese market as a mean of communicating kanji characters. Consequently,<br />
the Japanese domestic fax market grew rapidly; local production became<br />
firmly established, helped by this strong internal demand.<br />
• The fax machine proved to be a product ideally matching Japan's skills in<br />
high-volume electronic production, based on the country's abilities in<br />
improved productivity and electronic miniaturization.<br />
• By 1987, Alcatel of France was the only non-Japanese manufacturer producing<br />
its own fax equipment (sold under the brand name Thomfax).<br />
Alcatel had trouble manufacturing products to the same price margins as<br />
the Japanese, however. Consequently, during 1987, Alcatel made an<br />
agreement to manufacture equipment in France under license from<br />
Toshiba.<br />
Alcatel will continue to manufacture the high-end "feature machines"<br />
but will only partly manufacture and assemble Toshiba products for the<br />
low end of its product portfolio.<br />
• Sagem, another French manufacturer, has reached a similar agreement with<br />
Murata of Japan. However, under this agreement, Murata will supply all the<br />
products of the Sagem portfolio.<br />
• These two agreements permit continued fax manufacturing in France and an<br />
increased dependence on Japan as the low-end fax product market share<br />
continues to increase.<br />
© 1988 Dataquest Incorporated May ESAM Newsletter
• Dataquest believes that as Japanese manufacturers proceed further along the<br />
learning curve of high-volume fax production, it will become much more<br />
difficult for any other country to successfully compete in the production of<br />
facsimile equipment.<br />
Tariffs and Import Restrictions<br />
Having noted the domination of the fax market by Japanese manufacturers, we must<br />
also consider the issue of trade barriers. Similar situations of overwhelming Japanese<br />
production superiority have developed in both the copier and the electronic printer<br />
industries. A review of these industries may help to explain the international reaction.<br />
During the last 12 months, action has been taken by the European Commission and a<br />
number of individual countries to impose severe penalties on products that are not at<br />
least assembled within relevant trade zones such as Europe or America. In the case of<br />
fax products, the issue of PTT approval further complicates free access to a market.<br />
Dataquest believes that the Japanese manufacturers should take note of this<br />
international trend to require local manufacturing and should make appropriate plans. In<br />
fact, a number of Japanese manufacturers have already positioned themselves to meet<br />
such market restrictions. Most notable is Canon, which has reached a marketing and<br />
manufacturing agreement with Olivetti in Italy and has established its own fax<br />
manufacturing facilities in France.<br />
Ricoh with Kalle Infotec, NEC, and Toshiba also have local manufacturing facilities<br />
that could commence fax operations, if required.<br />
The 1987 Fax Market<br />
Table 1 presents the initial Dataquest estimates of worldwide facsimile shipments<br />
for 1986, 1987, and 1991.<br />
Table 2 shows the initial Dataquest market share estimates for the top suppliers in<br />
the European facsimile market for 1987.<br />
Table 3 provides a breakdown of 1987 shipments into the major European countries.<br />
ESAM Newsletter © 1988 Dataquest Incorporated May
Table 2<br />
European Facsimile Market Share by Siq^lier<br />
(Actual Units)<br />
Percent<br />
Supplier Units Share<br />
Panasonic<br />
NEC<br />
Canon<br />
Infotec<br />
Alcatel<br />
Toshiba<br />
Oki<br />
Sharp<br />
Xerox<br />
Murata<br />
Hitachi<br />
Fujitsu<br />
Pitney Bowes<br />
Others<br />
Total<br />
70,800<br />
45,274<br />
73,900<br />
38,727<br />
39,200<br />
31,650<br />
39,995<br />
20,670<br />
8,610<br />
17,765<br />
13,604<br />
10,013<br />
4,750<br />
6.905<br />
421,863<br />
Table 3<br />
16.8%<br />
10.7%<br />
17.5%<br />
9.2%<br />
9.3%<br />
7.5%<br />
9.5%<br />
4.9%<br />
2.0%<br />
4.2%<br />
3.2%<br />
2.4%<br />
1.1%<br />
1.7%<br />
100.0%<br />
Estimated 1987 EuF(q>ean Facsimile Placements<br />
(Actual Units)<br />
Percent<br />
Country Units Share<br />
United Kingdom<br />
France<br />
West Germany<br />
Italy<br />
The Netherlands<br />
Norway<br />
Sweden<br />
Switzerland<br />
Belgium<br />
Greece<br />
Finland<br />
Denmark<br />
Spain<br />
Turkey<br />
Ireland<br />
Austria<br />
Portugal<br />
Others<br />
Total<br />
102,951<br />
45,032<br />
59,294<br />
57,391<br />
21,593<br />
17,392<br />
21,530<br />
16,727<br />
18,393<br />
1,839<br />
7,784<br />
15,577<br />
18,827<br />
3,755<br />
3,030<br />
6,582<br />
2,725<br />
1.449<br />
421,871<br />
Source:<br />
24.4%<br />
10.7%<br />
14.1%<br />
13.6%<br />
5.1%<br />
4.1%<br />
5.1%<br />
4.0%<br />
4.4%<br />
0.4%<br />
1.8%<br />
3.7%<br />
4.5%<br />
0.9%<br />
0.7%<br />
1.6%<br />
0.6%<br />
0.3%<br />
100.0%<br />
Dataquest<br />
May 1988<br />
© 1988 Dataquest Incorporated May ESAM Newsletter
Market Analysis and Forecast<br />
From 1984 through 1986, most facsimile shipments in Europe and in the United<br />
States were aimed at businesses' communication rooms, in which the fax machine<br />
typically stood next to the telex machine. In 1986 and 1987, the low-end facsimile<br />
products began to penetrate smaller business organizations and started to find their way<br />
into department-level applications.<br />
Dataquest believes that shipments through 1992 will show the greatest growth in the<br />
low-end product sectors. The low-end products are becoming increasingly popular in<br />
Japan; now they are becoming known by the alternative name, "personal fax." Using<br />
innovative production techniques, the Japanese manufacturers are making these products<br />
even more compact, progressively decreasing the footprint size, and integrating a<br />
telephone handset with the box.<br />
Personal faxes are beginning to penetrate very small businesses now, in addition to<br />
being targeted for executive desktops. As the average selling price (ASP) of these<br />
machines continues to decline, two questions arise:<br />
• What proportion of desktops and homes of business executives will become<br />
populated by faxes? In other words, what is the personal fax total available<br />
market (TAM)?<br />
• What channels of distribution should be used for these products as the cost of<br />
sales becomes a proportionally more significant factor in the product price?<br />
The Japanese fax market, which is one to two years ahead of the European and U.S.<br />
markets in maturity, is already beginning to face these issues. Retail channels are being<br />
tried, and Dataquest recently noted personal fax machines on sale in Tokyo stores for as<br />
little as ¥79,000 ($640).<br />
Focusing on retail channels, however, ignores the issue that the fax machine<br />
remains, in principal, a business tool with the need for effective supplier provisions and<br />
maintenance contracts. Thus, the retail channel is less attractive to the business<br />
purchaser. Home, door-to-door salespeople are finding resistance for similar reasons.<br />
Dataquest speculates whether improved advertising techniques, combined with<br />
toll-free call facilities for more accurate prospective customer identification prior to<br />
sales calls, would reduce direct sales costs (i.e., through achieving a higher percentage<br />
sales close rate). Other low-cost sales channels may exist, including office-related<br />
electronics retail stores and mail order sales.<br />
TECHNOLOGY TRENDS<br />
Personal Fax Machines<br />
Personal fax machines that are compatible with CCITT Group III standards certainly<br />
show much growth potential in the short to medium term.<br />
ESAM Newsletter © 1988 Dataquest Incorporated May
Color Facsimile Machines<br />
The Japanese, however, are also working on new facsimile developments, and one<br />
specialized development is color facsimile. NEC recently demonstrated a prototype of<br />
such a machine; however, the technology is still very expensive at this time. We believe<br />
that color facsimile certainly could become a very successful niche market sector in the<br />
future. Two-color-image (red and black on white) faxes are also becoming available, and<br />
Ricoh recently demonstrated a prototype of such a product. These machines are likely<br />
to be used in editing applications such as highlighting or making corrections to areas of<br />
text and graphics.<br />
Group in Facsimile Machines<br />
High-end Group III fax machines with store-and-forward capabilities, although<br />
currently representing only 5 percent of all fax units sold, are expected to show strong<br />
growth, with a 70 percent CAGR through 1992. This segment is less price sensitive and<br />
is aimed at placements within the headquarters of large companies. Consequently, we<br />
believe that many extra new functions and technology advancements will be seen in this<br />
area. Other capabilities that we expect to become available with machines in this<br />
segment are fax networking and switching functions.<br />
A further advancement that is currently receiving a lot of research and development<br />
attention is error correction for secure transmission. The CCITT has put together a<br />
preliminary specification for such a facility, and a number of manufacturers are working<br />
to have this feature available with their products by the end of 1988.<br />
Plain Paper Facsimile Machines<br />
Much effort continues in the area of plain paper facsimile (PPF) machines. At this<br />
stage, these machines are at least twice as expensive as thermal paper machines. Such a<br />
high price effectively makes PPF products unacceptable in a market where the user<br />
usually has a plain paper copier not far from the fax machine, which means that if<br />
required, a PPF copy can be produced easily and at minimal extra cost. The Japanese<br />
are currently working on technologies that may eventually drop the price of a PPF<br />
machine much nearer to that of a thermal machine. If such a price reduction is<br />
achieved, Dataquest expects the PPF market to open up quite rapidly.<br />
Group IV Facsimile Machines<br />
Looking forward, the big question is about Group IV facsimile machines. These<br />
products will require an ISDN or compatible 64K digital network to operate. We do not<br />
believe that they will be widely available before 1995, even in countries with advanced<br />
telecommunications infrastructures. Although Group IV faxes will be capable of sending<br />
messages at approximately 3 seconds per page, this capability is already being achieved<br />
through improved Group III coding techniques such as Modified Modified Read (MMR),<br />
which currently has reduced the transmission time from about 20 seconds to 9 seconds.<br />
Further transmission improvements are under development. The recent advancements of<br />
Group III clearly reduce the advantage of Group IV. Furthermore, the fax machine<br />
became attractive as a text-transmission medium only once a solid user base had been<br />
established. The same problem will be encountered by Group IV machines until they gain<br />
acceptance and establish a worldwide user base.<br />
6 © 1988 Dataquest Incorporated May ESAM Newsletter
Although Group IV will certainly establish its market niche, particularly within large<br />
internal network applications, we do not expect it to take a dominant position over<br />
Group III in terms of shipments until well into the 21st century.<br />
JAPANESE MANUFACTURING<br />
Japan's success in the realm of facsimile is due to the country's formidable record<br />
of achieving economy of scale in electronic manufacturing techniques. Although one<br />
South Korean manufacturer has recently entered the facsimile market, its product is<br />
comparatively much lower in quality. We believe that this prc^uct will need<br />
considerable improvement before it becomes a serious contender against Japanese<br />
products in world markets.<br />
Factory Automaticm<br />
Meanwhile, Japan continues to improve its electronic production techniques through<br />
advances in semiconductor technology as well as increasingly sophisticated production<br />
robots, such as pick-andrplace semiconductor component assembly systems.<br />
The Oki Honjo (North of Tokyo) is one of the most modem automated facsimile<br />
assembly facilities in Japan. Following a recent refurbishment program, it uses<br />
300 assembly and quality-inspection robots linked to a fully computerized<br />
stores-and-supplies system in what is known as an FA (factory automation)<br />
environment. Nevertheless, the facility still employs 900 direct workers involved in the<br />
fax manufacturing area, as well as a number of subcontractor companies that deliver<br />
completed and tested subassemblies and other components to the plant at least twice<br />
daily.<br />
Oki insists that all the subcontractors are in the area, close to the Honjo plant to<br />
ensure secure product delivery. The subcontractors themselves all work in a typically<br />
Japanese manner, with timely deliveries of high-quality products. The stores area is<br />
thus minimized, and the reject rate is extremely low. Subassembly and other partly<br />
finished components are shuttled around the facility on computerized delivery vehicles<br />
that beep and flash warning lights whenever humans cross their paths.<br />
In order to address new target markets, Japanese manufacturers also plan to design<br />
fax products with an ever-decreasing footprint size. One of the factors contributing to<br />
this effort is a new and extremely compact image-scanning system.<br />
To achieve this smaller footprint, Oki, like a number of other Japanese<br />
manufacturers, has recently introduced the direct-contact technology for the<br />
image-scanning mechanism. Although not particularly less expensive than the older<br />
charged couple device (CCD) technology, it is able to achieve a significant reduction in<br />
the equipment size. This size reduction results in an implied saving in material cost, as<br />
well as a machine with a more attractive user footprint.<br />
A second route to achieving smaller product size is through the ever-increasing<br />
miniaturization of electronic components. For example, a number of manufacturers<br />
have started using the new Rockwell single-chip modem, replacing the four IC chips used<br />
in previous generations of facsimile modems.<br />
ESAM Newsletter © 1988 Dataquest Incorporated May
Productivity Race<br />
The facsimile output capacity of the Honjo plant is currently 460 units per day. The<br />
final assembly is done on two parallel lines, each with an indicator of the daily<br />
production target and a second counter to show performance against the target. As each<br />
finished machine comes off the assembly lines, the daily tally is incremented and the<br />
performance counter adjusted. The two production-line staffs essentially race against<br />
each other, as much for the honor of being ahead as for the small bonus that they can<br />
win at the end of the month.<br />
Even the computerized delivery vehicles seem to be in an hurry, competing with one<br />
another to raise the daily production quota. At 460 fax units per day, the Honjo plant<br />
output is running at approximately $1.5 million daily. This output is far from the plant's<br />
ultimate capacity. The factory management anticipates easily reaching more than<br />
700 units daily through shift work at the current facilities. Management further claims<br />
that even higher output could be reached through additional improvement in production<br />
techniques.<br />
Such increased production capacity will be critical to Harris/3M, Oki's largest<br />
worldwide OEM customer. Indeed, in 1987, Harris/3M ramped up its production<br />
requirement with Oki by more than 168 percent against its 1986 shipments and is now<br />
responsible for more than 55 percent of Oki's total worldwide facsimile output.<br />
Clearly, any restrictions applied on facsimile imports into Europe would have a<br />
major impact on Oki and its OEM partners alike. Should such restrictions be applied,<br />
however, Oki does have a European manufacturing facility in Scotland and would be able<br />
to move fax production there within six months.<br />
DATAQUEST ANALYSIS<br />
Dataquest anticipates that the worldwide fax market will remain one of the<br />
fastest-growing telecommunications market segments over the next few years. In terms<br />
of unit shipments, we estimate that the worldwide fax market will increase by a<br />
30 percent CAGR from 1988 through 1993. In telecommunications, only the cellular<br />
radio handset market is expected to grow as rapidly during this period. Here, again, the<br />
Japanese have significant presence.<br />
Dataquest believes that Japanese manufacturing skills, combined with a closely<br />
affiliated semiconductor technology and the current level of R&D spending to maintain<br />
technical innovation, will make Japanese manufacturers a tough team to beat. This will<br />
be particularly true in product areas where production volumes are high and the software<br />
content is low. A typical product of this kind is the facsimile machine. Central office<br />
switching technology, however, is an example of a product requiring specialized<br />
software. In the case of central office switching, we do not expect the Japanese to<br />
make a significant market impact in Europe.<br />
© 1988 Dataquest Incorporated May ESAM Newsletter
Dataquest anticipates that with the continuation of worldwide telecommunications<br />
market deregulation, governments and PTT authorities in many countries will be<br />
assessing the increasing impact of Japanese products on their markets. We believe that<br />
Japan does have an excellent chance for success in the U.S. and European markets with<br />
its current and future products in areas such as facsimile. However, we also believe that<br />
Japanese manufacturers should seriously consider strategies that would give them a local<br />
manufacturing presence in the U.S. and European markets. Dataquest considers such a<br />
capacity to be an essential requirement for Japanese facsimile manufacturers hoping to<br />
avoid the imposition of future punitive trade restrictions.<br />
(This document is reprinted with the permission of Dataquest's European Telecommunications<br />
Industry Service.)<br />
ESAM Newsletter © 1988 Dataquest Incorporated May<br />
Jennifer Berg<br />
Anne Barbancon
mm Dataoyest<br />
aconwanyof<br />
The Diin& Bradsticet Corporation<br />
Research Newsletter<br />
INTRODUCTION<br />
ESAM Code: Vol. IV, Newsletters<br />
1988-3<br />
YEAR-END EUROPEAN PROCUREMENT SURVEY: THE ISSUES<br />
ARE AVAILABILITY. PRICING, AND SUPPLY<br />
This newsletter presents the results of our second European Semiconductor<br />
Application Markets (ESAM) procurement survey conducted across a wide range of major<br />
Europe-based electronic equipment manufacturers in the fourth quarter of 1987. The<br />
first European purchasing survey, conducted during the second quarter of 1987, revealed<br />
the then global concern of pricing. Since then, the emphasis has moved away from the<br />
issue of pricing and toward that of the availability of components.<br />
The object of the survey was to determine the major concerns of semiconductor<br />
buyers in Europe. One major concern is the resulting shortage of memory parts that is<br />
due to the export license requirements imposed by MITI on Japanese suppliers. Other<br />
issues that were important to buyers included possible price increases on selected<br />
products in short supply, increasing demand, and longer lead times.<br />
Table 1 shows the primary concerns emphasized by our respondents.<br />
Table 1<br />
Semiconductor BiQrer Concerns<br />
Concern<br />
Availability<br />
Pricing<br />
Supply<br />
Quality<br />
Lead Times<br />
Tariffs<br />
Surface-Mount Technology<br />
ASICs<br />
Memory<br />
Currency Exchange Hates<br />
Total Respondents<br />
Source:<br />
Percent of<br />
Respondents<br />
20.4%<br />
16.3<br />
12.2<br />
12.2<br />
12.1<br />
10.3<br />
6.1<br />
4.1<br />
4.1<br />
2.2<br />
100.0%<br />
Dataquest<br />
March 1988<br />
© 1988 Dataquest Incorporated March—Reproduction Prohibited<br />
The amt&jt cfthis report represents our interpretation and analysis cfir^rmation generally available to //w [mblic or released by responsible individual in the subject companies, bia<br />
is not guaranteed as to accuracy or con^jleteness. It does not amtain material provided to us in cor^dence by our dients. Individual amtpanies reportai on and aruUyzed by Dataquest<br />
may be clients cfdus andtor txher Dataquest services This inprmmion is notfitmished in connection tviift a sale or c^r to sell securities or in connection wUh dK solicitation cfan<br />
q^rto Iwy securities. This firm and its parent and/or Uieir t^ficers, stoddiolders, or members of their families may, from time to time, have a long or ^wrt position in the securities<br />
menticmed and may sell or buy such securities.<br />
Dataquest Incorporated, 1290 Ridder Park Drive, San Jose, CA 95131-2398 / (408) 437-8000 / Tfelex 171973 / Fax (408) 437-0292
SURVEY STRUCTURE<br />
Dataquest selected survey participants from the top electronics manufacturers in<br />
Europe, successfully repolling the majority of manufacturers that participated in our<br />
first data- and trends-gathering project. We surveyed manufacturers that are actively<br />
purchasing semiconductors for electronic systems and subassemblies, interviewing<br />
individuals who are purchasing managers and directors, or who are involved in material<br />
or corporate contract management.<br />
Subsequently, we compared our survey data on the semiconductor purchase mix with<br />
our 1986 European estimates; Figure 1 shows how closely they correspond. The survey<br />
results show a higher percentage of bipolar logic purchases than Dataquest's market<br />
share estimate of this segment. In the MOS market, however, the situation is reversed,<br />
with purchases lower than expected. Overall, the survey results demonstrate that our<br />
sample of purchasers closely reflects the total European demand.<br />
Figure 2 shows the geographic distribution of our survey respondents. Although we<br />
tried to achieve an even distribution of respondents throughout Europe, the results show<br />
that there was a bias toward the United Kingdom. This bias was probably due to the fact<br />
that the survey was conducted from the United Kingdom; however, we do not believe<br />
that it detracts from the validity of our analysis.<br />
Figure 1<br />
Semiconductor Purchase Mix<br />
Survey Results Compared with 1986 Estimates<br />
(Percent of U.S. Dollars)<br />
kXN MOS<br />
^W Discrete<br />
[isC.#1 Linear<br />
I I Bipolar<br />
^ H Opto<br />
Market Estimates Survey Audience<br />
Source: Dataquest<br />
March 1988<br />
© 1988 Dataquest Incorporated March ESAM Newsletter
Figure 2<br />
Geographic Distributi
Table 2 shows the currently perceived worldwide shift in supplier base compared<br />
with our previous survey's results.<br />
Supplier Base<br />
Europe<br />
United States<br />
Japan<br />
ROW<br />
Table 2<br />
Worldwide Shift in Supplier Base<br />
Q2 1987<br />
Survey Results<br />
32.9%<br />
50.0<br />
14.9<br />
2.2<br />
Q4 1987<br />
Survey Results<br />
32.0%<br />
46.0<br />
18.9<br />
3.1<br />
Total 100.0% 100.0%<br />
Source; Dataguest<br />
March 1988<br />
Figures 1 and 2 indicate a shift in the buying patterns of these equipment<br />
manufacturers. Most of the surveyed companies would prefer to buy locally<br />
manufactured semiconductor devices. Unfortunately, local suppliers still have to go<br />
some way in order to deliver the breadth and depth of the required product range. The<br />
increase in Japanese preference for procurement was partially due to a switch to<br />
higher-density memories, but it also was moderated by the effects of the U.S.-Japan<br />
Semiconductor Trade Arrangement.<br />
The survey also confirmed the penetration of rest of world (ROW) suppliers (such as<br />
those based in Korea, Taiwan, and Singapore), with some equipment manufacturers<br />
relying on up to 10 percent of their semiconductor requirements from these suppliers.<br />
ASSESSING INVENTORY LEVELS<br />
Dataquest clients have frequently asked us to assess inventory levels. However, it is<br />
very difficult to estimate inventory levels because of the varied product mix for<br />
discrete, linear, memory, and logic. Table 3 shows our respondents' estimates of their<br />
inventories relative to target. Overall, 42.4 percent reported that their inventories were<br />
above target. Only 12.1 percent indicated below-target levels. The trend that began<br />
two years ago to reduce the excessive levels of 1984 has continued, and we believe that<br />
inventories have now reached stable levels. The majority of respondents indicated that<br />
their inventories are expected to increase from an average of 6 weeks to 8 to 10 weeks,<br />
as the expected demand and growth will create temporary shortages in key areas such as<br />
DRAMs and some 32-bit microprocessors.<br />
© 1988 Dataquest Incorporated March ESAM Newsletter
Table 3<br />
Semiconductor Inventories Relative, to Target<br />
(Percent of Total Respondents)<br />
Inventory Level<br />
Extremely Low<br />
Somewhat Low<br />
On Target<br />
Above Target<br />
In Significant Excess of Target<br />
Percent of<br />
Respondents<br />
3.0%<br />
9.1<br />
45.5<br />
39.4<br />
3.0<br />
Total 100.0%<br />
Source: Dataquest<br />
March 1988<br />
PROCUREMENT TRENDS BY SEMICONDUCTOR APPLICATION SEGMENT<br />
Figure 3 shows Dataquest's estimates for 1986 European electronic equipment<br />
production by application.<br />
Figure 3<br />
Electronic Equipment Producticm by Aj^licatioh Segment<br />
(Percent of U.S. Dollars)<br />
1986<br />
Source: OaUqueit<br />
March 1988<br />
ESAM Newsletter © 1988 Dataquest Incorporated March
Consumer Ai^lication Market<br />
The purchasing pattern in the consumer segment still favors the Europe-based<br />
supplier. This segment is a relatively large user of discrete and optoelectronics devices,<br />
a market of which Europe-based suppliers have a substantial share.<br />
Most buyers expect these discrete devices to be customized to achieve better<br />
price/performance integration, and for this they require close, long-term relationships<br />
with local suppliers. They also expect the number of ICs used in consumer products to be<br />
substantially reduced in favor of a semicustom/custom approach, which will require a<br />
major shift toward surface-mount devices.<br />
Surprisingly, major consumer manufacturers are purchasing up to 30 percent of their<br />
requirements from offshore sites rather than from the local sales offices of these offshore<br />
suppliers. This situation could be explained by the consumer market requiring<br />
close links with the supplier manufacturing site to interface on all levels—design, test,<br />
quality, shipping, and logistics.<br />
Major Japanese consumer manufacturers in Europe have started to procure locally,<br />
especially with discrete and opto devices. Most of these manufacturers complain that<br />
local suppliers do not have the right manufacturing technology to supply their special<br />
needs. However, they face increasing pressure from the EEC to source more components<br />
locally.<br />
Overall, consumer manufacturers in Europe reported a healthy growth in 1987<br />
compared with 1986, but indicated that they expect to further reduce inventory levels<br />
and start engaging more JIT (just-in-time) programs with their suppliers.<br />
Automotive Application Market<br />
Purchasing managers in the automotive segment responded very positively about<br />
their inventory levels, as most of them have ongoing JIT programs that have passed the<br />
learning-curve period. They reported that suppliers failing to meet their specification<br />
and delivery commitments do not win future contracts for supply.<br />
Major concern is still shown over the long-term reliability of semiconductor devices,<br />
fault coverage, and incoming test correlation. Very few suppliers are able to meet more<br />
than 80 percent of these purchasers' requirements. The suppliers' concern is amplified<br />
when dealing with the purchasers' ASIC requirements. Among the major European<br />
automotive electronic equipment manufacturers, preference is shown toward<br />
Europe-based suppliers or foreign suppliers with a manufacturing base in Europe.<br />
In general, the automotive market anticipates greater IC use in the future as more<br />
features are added to standard models.<br />
Military Application Market<br />
Purchasers in the military segment are prepared to hold relatively large inventories<br />
for parts that are prohibitively expensive at low volumes. This segment shows heavy<br />
reliance on the semiconductor distribution network for standard military-grade parts.<br />
Most purchasers indicate above-average inventory levels. North American suppliers are<br />
© 1988 Dataquest Incorporated March ESAM Newsletter
heavily used over their European counterparts, except for ASIC requirements. Major<br />
military contractors prefer in-house suppliers for ASICs because of the complex nature<br />
of meeting as yet undefined military-standard specifications for these parts.<br />
Major concern was shown about U.S. versus European military specification issues<br />
and specifications for surface-mount devices.<br />
Computer Ai^lication Market<br />
This segment showed the most volatility, with purchasing managers expressing much<br />
concern about the availability of 256K and 1-Mbit DRAMS and the impact of MITI export<br />
licensing requirements. This segment is heavily dependent on Japanese suppliers for its<br />
memory devices. The supply shortage of these devices, coupled with price rises, is<br />
starting to hurt some manufacturers, with the exception of those manufacturers with<br />
steady in-house supplies.<br />
Most U.S. multinationals based in Europe procure, on average, 30 percent from<br />
European manufacturing sites, including U.S. suppliers manufacturing in Europe.<br />
We believe that 1988 will be a big year for surface-mount devices, as most<br />
purchasers reported substantial increases in their purchases of these devices.<br />
Inventory levels of computer manufacturers are, on average, down to 6 weeks, but<br />
most manufacturers expect this time to increase to 8 to 10 weeks as a result of<br />
shortages of leading-edge products such as 1-Mbit DRAMs and 32-bit processors.<br />
The computer segment also showed a substantial increase in the use of gate arrays<br />
and programmable logic. Most purchasers indicated requirements for higher-speed PALs<br />
and high-density gate arrays.<br />
Regional preference in this group is still for U.S. suppliers because of the large<br />
presence of U.S.-based computer manufacturers in Europe. CMOS now accounts for<br />
more than 50 percent of total pxjrchases in the computer segment.<br />
Telecommunications Application Maii^et<br />
Most purchasing managers in the telecommunications segment indicated healthy<br />
growth in the amount of semiconductor purchases when expressed in U.S. dollars, but<br />
showed a virtually flat pattern when the purchases were expressed in local currency.<br />
They expect prices to decrease with the increasing volumes. The use of surface-mount<br />
devices is somewhat erratic: Some major manufacturers use surface-mount devices up<br />
to 10 percent, while others, at 2 percent, barely use them.<br />
Most purchasers reported inventories on target, but they also expected to further<br />
reduce their levels. Some purchasers in this segment have started JIT programs, and<br />
many others are moving in this direction.<br />
Purchasers expressed uncertainty about recent mergers in the telecommunications<br />
industry, focusing on the issues of plant location, products, and personnel rationalization.<br />
ESAM Newsletter © 1988 Dataquest Incorporated March
It appears that the telecommunications segment, like the other industry segments,<br />
has been unable to reduce the number of its suppliers because of the diverse range of<br />
semiconductor devices required. A supplier with a broad product line and the right<br />
telecommunications products stands a better chance than one with a narrow product line.<br />
The major concerns shown in this segment are procurement logistics and<br />
management of ASIC supplies.<br />
DATAQUEST CONCLUSIONS<br />
The buyers' responses to Dataquest's second European procurement survey primarily<br />
indicate concern over availability and cost-related issues. The emphasis on availability,<br />
pricing, supply, and quality leads us to believe that this concern is indeed a positive<br />
signal for steady growth in the industry. Quality was not at all mentioned in our second<br />
quarter 1987 survey; however, this issue ranks high on the list of concerns generated by<br />
our latest survey. European semiconductor buyers' mindfulness of ASICs and surfacemount<br />
technology reflects the fact that these two product areas are now impacting the<br />
marketplace with their cost-competitive and overall system design advantages.<br />
We believe that there is a pressing need for semiconductor vendors to better<br />
educate the purchasing community on changing technology and product trends. A large<br />
proportion of the respondents indicated that they were swamped with product<br />
specifications; however, the information from maunufacturers concerning key areas of<br />
interest, such as packaging, quality, and cost benefits, was insufficient.<br />
Bipin Parmar<br />
Mike Williams<br />
© 1^88 Dataquest Incorporated March ESAM Newsletter
Dataqyest<br />
acomranyof<br />
ihcDSnlTBradsbccti Cfxpoiation<br />
Research Newsletter<br />
INTRODUCTION<br />
IS THERE A TRANSPUTER IN YOUR FUTURE?<br />
ESAM Code: Vol. II, Newsletters<br />
1988-2<br />
In the last few years, both Intel and Motorola have introduced microprocessors that<br />
have changed the face of the PC industry. However, a third company, Inmos<br />
Corporation, has introduced the transputer, a microprocessor designed to bring the power<br />
of a supercomputer to desktop computing.<br />
This newsletter examines some of the products utilizing transputer technology and<br />
discusses the implications of the transputer for the personal computer industry.<br />
BACKGROUND<br />
In November 1986, Inmos Corporation, a subsidiary of United Kingdom-based Thorn<br />
EMI, introduced the T800 transputer, a 32-bit microprocessor capable of achieving<br />
performance ratings of 10 to 12 mips. Since this announcement, the T800 transputer and<br />
its predecessors, the T212 and T414, have been catching the eye of many computer<br />
product manufacturers.<br />
The transputer is not a coprocessor. The T800 transputer combines a 32-bit CPU;<br />
standard IEEE, 64-bit, floating-point processor; 4KB of fast RAM; and four<br />
communications links that are used to connect transputers into networks.<br />
The transputer is designed for high-performance single-microprocessor applications;<br />
however, the real power of the transputer is in its capability to be linked with other<br />
transputers to provide ultrahigh-performance multiprocessor applications ranging from<br />
PC workstation accelerators to supercomputers.<br />
© 1988 Dataquest Incorporated March—Reproduction Prohibited<br />
The contents of this report represent our interpretation and analysis of information generally available to the public or released by responsible individuals in the subject companies but is<br />
not guaranteed as to accuracy or completeness It does not contain material provided to us in confidence by our clients. Individual companies reported on and analyzed by Dataquest<br />
may be clients of this and/or other Dataquest services. This information is not furnished in connection with a sale or offer to sell securities or in connection with the solicitation of an<br />
offer to buy securities. This firm and its parent and/or their officers, stodcholders, or members of their families may, from lime to time, have a long or short position in the securities<br />
mention^ and may sell or buy such securities.<br />
Dataquest Incorporated, 1290 Ridder Park Drive, San Jose, CA 95131-2398, (408) 437-8000, Telex 171973, Fax (408) 437-0292
The Inmos T800 competes directly with microprocessors manufactured by Intel and<br />
Motorola. The Inmos T800 is the first microprocessor to offer a' processor and a<br />
floating-point processor on a single VLSI device. This combination is ideal for<br />
applications such as high-end graphics and artificial intelligence.<br />
TRANSPUTER APPLICATIONS<br />
The Atari Abaq<br />
At the fall Comdex, Atari Corporation demonstrated a prototype of the Abaq, a<br />
32-bit transputer-based workstation. The Abaq uses the Inmos T800 and is capable of<br />
operating at 10 to 12 mips. This level of performance would give the Abaq the ability to<br />
operate at speeds 10 times greater than the IBM AT. The Abaq is equipped with 4MB of<br />
RAM and 1MB of display RAM. The Abaq supports four graphics modes: 1,280 x 768<br />
pixels in 16 colors or monochrome; 1,024 x 768 pixels in 256 colors; 640 x 480 pixels in<br />
256 colors with two screens; and 512 x 480 pixels in 16 million colors plus overlay.<br />
Perihelion Software is currently developing Helios, a UNIX-like operating system<br />
for the Abaq. In addition, an MS-DOS emulator is currently being developed for the<br />
Abaq by a third-party developer.<br />
Apple Macintosh Enhancement<br />
Levco has announced an add-on board for the Macintosh II and Macintosh SE, based<br />
on the Inmos T800 transputer. The Levco TransLink transputer card will range in price<br />
from $2,000 to $12,000, depending on the number of transputers installed on the board<br />
and the amount of memory allocated to each transputer. A transputer card with four<br />
T800 processors, C compiler and assembler, and 1MB of RAM dedicated to each<br />
processor will provide 20 times the performance of the Mac II. Pricing for this<br />
configuration will range from $11,000 to $12,000.<br />
Microport V/TT System<br />
Microport Inc., a supplier of UNIX software, recently announced the Microport V/TT<br />
System, a UNIX-based implementation of the Inmos T800 transputer.<br />
The system runs on an IBM AT and is equipped with the Inmos BOOS transputer<br />
module board. The BOOS board utilizes four T800 transputers, and it is claimed that this<br />
combination can deliver 50 times the power of UNIX running on the IBM PC AT itself.<br />
© 1988 Dataquest Incorporated March ESAM Newsletter
DATAQUEST ANALYSIS<br />
Prior to the introduction of the PC, users were forced to share the same processor.<br />
With the advent of the PC, users now have their own dedicated processors. Transputers<br />
linked within a network take the one person/one processor concept a step further by<br />
providing a user with access to several processors at a time. Application tasks are<br />
distributed among the processors in order to optimize the total application performance.<br />
The problem facing vendors of transputer technology is that very few software<br />
applications have been written with the capability of utilizing multiple processors. In<br />
order for this technology to gain a foothold in the PC marketplace, we believe that<br />
Inmos must persuade software developers to adapt their applications to a multiprocessor<br />
environment.<br />
Parallel processing is not a new concept in the computer industry as a whole;<br />
however, for the PC industry, it represents the ultimate solution for power-intensive<br />
applications. It opens the door to having mainframe computing power on the desktop and<br />
is the next logical step for the PC of the future. The embodiment of this capability in<br />
IBM's Micro Channel and Apple's Nubus is a reaffirmation of this philosophy.<br />
Although multitasking is the current topic of conversation in the PC industry, we<br />
believe that multiprocessing will have a significant impact on the future of the<br />
PC industry. How significant an impact the Inmos transputers will have in the area of<br />
multiprocessing will ultimately be decided by software developers.<br />
(This document is reprinted with the permission of Dataquest's Personal Computer<br />
Industry Service.)<br />
ESAM Newsletter © 1988 Dataquest Incorporated March<br />
Jennifer Berg<br />
Bill Lempesis
'^^•f^::m<br />
Dataoijest<br />
aconujanyt^<br />
The DtinSTBradsbcet Corporadon<br />
Research Newsletter<br />
SUMMARY<br />
ESAM Code: Vol. II, Newsletters<br />
1988-1<br />
ERICSSON GETS LEANER WHILE NOKIA CONTINUES ACQUISITIONS<br />
Ericsson's pending sale of its Data System Division to Nokia will put Nokia in a<br />
commanding position as the number two European supplier of computer terminals after<br />
Olivetti.<br />
This event is of major significance in the European telecommunications market, as<br />
it reverses the trend of the early 1980s when telecommunications companies created<br />
and/or acquired computer companies due to the pending fusion of communication and<br />
information technologies. In the majority of these cases, the ventures have been major<br />
drains in financial and management resources.<br />
ERICSSON<br />
The newly acquired Data System Division manufactures terminals, personal<br />
computers, minicomputers, and banking and business systems, and has a turnover of<br />
SKr 4 billion (US$631 million.) It will be merged with Nokia's existing Information<br />
Division, Nokia Data. The merged division will have a turnover of SKr 7 billion<br />
(US$1.1 billion).<br />
Ericsson's strategy has been to offload business units that do not form part of its<br />
core business, i.e., telecommunications. In October 1987, Ericsson sold off its Office<br />
Equipment Division, which manufactures typewriters and office furniture, to Design<br />
Funktion of Norway.<br />
Ericsson's sale of its Data System Division and its Office Equipment Division will<br />
stem the flow of red ink that has plagued its Information Division since its inception.<br />
This division reported a loss of SKr 284 million (US$45 million) on a turnover of<br />
SKr 10 billion (US$1.6 billion) in 1986.<br />
© 1988 Dataquest Incorporated February—Reproduction Prohibited<br />
The contents of this report represent our irUerpretation and analysis of inprmatUm generally available to the public or released by responsible individuals in the subject amipanies but is<br />
not guaranteed as to accuracy or completeness. It does not contain material provided to us in confidence by our clients. Individual companies reported on and analyzfd by Dataquest<br />
may be clients of this and/or other Dataquest services This information is not furnished in connection with a sale or offer to sell securities or in connection with the solicitation of an<br />
offer to buy securities. This firm and its parent and/or their officers, stockholders, or members of their fcunilies may, from time to time, have a long or short position in the securities<br />
mentioned and may sell or buy such securities.<br />
Dataquest Incorporated, 1290 Ridder Park Drive, San Jose, CA 95131-2398, (408) 437-8000, Telex 171973, Fax (408) 437-0292
NOKIA<br />
As shown in Figure 1, the Nokia Group of companies' total 1986 sales were<br />
Fmk 12 billion (US$2.5 billion), with almost 60 percent coming from the export market.<br />
The group's 1986 profit was Fmk 675 million (US$141 million), or 5.6 percent of sales.<br />
The Electronics Group represented 43 percent of the Nokia Group's net sales in 1986,<br />
before its recent acquisition of Ericsson's Data System Division and the consumer<br />
division of Alcatel N.V. (formerly the consumer division of ITT).<br />
Electronics Group Activities—1986<br />
Figure 1<br />
Nokia Group Major Activities<br />
Net Sales by Division<br />
1986 Net Sales = $2.5 Billion<br />
Source: Nokia Corp.<br />
Oataquest<br />
February 1988<br />
The group achieved net sales of Fmk 3.7 billion ($843 million) in the first<br />
eight months of 1987, compared with Fmk 2.9 billion ($572 million) in the corresponding<br />
period in 1986, and represented a local currency growth of 27 percent (47 percent growth<br />
in U.S. dollars).<br />
Information Systems<br />
This division represented Fmk 1.6 billion ($334 million) of the company's 1986 sales.<br />
The division consisted of a Data Processing Systems Unit (computer systems and<br />
equipment). Data Transmission Unit (modems and multiplexers). Business<br />
Communications Unit (digital PABX and key telephone systems), Components Unit (thick<br />
film hybrids and PCBs), and a Control and Instrumentation Unit (automation equipment<br />
in wood pulping and energy sectors).<br />
© 1988 Dataquest Incorporated February ESAM Newsletter
V- ,<br />
Telecommunications<br />
Net sales for this division totaled Fmk 939 million ($196 million) in 1986. The<br />
division consisted of a Transmission Systems Unit (PCM equipment and radio relay links),<br />
Dedicated Networks Unit (for energy and railway sectors), and Telenokia Ltd. (digital<br />
FABXs).<br />
Nokia-Mobira<br />
This division's net sales totaled Fmk 847 million ($177 million) in 1986. The division<br />
consisted of an NMT Unit (Nordic Mobile Telephones for the 450- and 900-MHz system)<br />
and a USA Unit (mobile telephones for the U.S. Advanced Mobile Phone System (AMPS),<br />
and the Tandy Mobira Corp. (TMC) joint venture with sales via Radio Shack). There was<br />
also a Euro Unit (mobile telephones for the Total Access Communications System<br />
(TACS), R200, and Netz-C networks), an Oulu Unit (base stations for cellular and paging<br />
networks), and a PMR (Private Mobile Radio) Unit.<br />
Salora-Luxor<br />
Net sales for this division totaled Fmk 2.1 billion ($439 million) in 1986. The Group<br />
consisted of a Consumer Electronics Unit (TV and video recorders). Monitors Unit (color<br />
and high resolution), Components Unit (hybrids, TV tuners and power supplies), Satellite<br />
Systems Unit (receivers and transmitters, plus cable and pay TV), and an Industrial<br />
Electronics Unit (customer-specific components for the automotive, engineering, and<br />
plastics industries).<br />
Electronics Group Restructuring—1987<br />
InfcH'mation Systems<br />
This division is a combination of the former Information Systems Division and the<br />
Telecommunications Division. It comprises the Data Processing Systems Unit, the Data<br />
Transmission Unit, the Business Communications Unit, the Public Telecommunications<br />
Networks Unit, the Dedicated Networks Unit, Nokia Cellular Systems, and Telenokia.<br />
Net sales from this division for the first eight months of 1987 amounted to<br />
Fmk 1.1 billion ($250 million), a growth in local currency of 19 percent compared with<br />
the same period in 1986 (37 percent growth in U.S. dollars). This growth can be<br />
attributed to increased sales, particularly in Sweden and West Germany, and deliveries of<br />
electronic point-of-sales systems to retailers in Finland.<br />
Consumer Electronics<br />
This division was mainly created from the former Salora-Luxor Division, and<br />
comprises the Video/Audio Unit, the Monitors Unit, the Components Unit (formerly the<br />
Information Systems Division and the Salora-Luxor Division), and the Industrial<br />
Electronics Unit.<br />
ESAM Newsletter © 1988 Dataquest Incorporated February
Net sales from this division for the first eight months of 1987 amounted to<br />
Fmk 1.4 billion ($319 million), a growth in local currency of 17 percent compared with<br />
the same period in 1986 (35 percent growth in U.S. dollars). This growth can be<br />
attributed to the company's successful penetration of the French consumer electronics<br />
market, where it holds a 10 percent market share, and its continuing leadership in<br />
Scandinavia as a supplier of color television sets and video recorders. The recent<br />
purchase of Oceanic S.A., a French consumer electronics manufacturer (part of the<br />
Swedish Electrolux Group), has given Nokia two more recognized brand names, Oceanic<br />
and Sonolor. The division has significantly enhanced Nokia's position in the European<br />
Economic Community.<br />
Nokia-Mobira<br />
This division is restructured internally, and now comprises the NMT Unit, the<br />
AMPS/TACS Unit, the Euro Unit, the Paging Equipment Unit, and the Cordless Unit.<br />
Net sales from this division for the first eight months of 1987 amounted to<br />
Fmk 613 million (US$140 million), a growth in local currency of 22 percent compared<br />
with the same period in 1986 (41 percent growth in U.S. dollars). Operations overseas<br />
accounted for 75 percent of 1987 sales, and included the acquisition of Diversicom in the<br />
United States (the only nationwide long-range paging service for the U.S. market).<br />
Agreements also were made with McCaw Cellular Equipment (which owns and operates<br />
40 mobile telephone networks in the United States), Mobile Telephone Systems (based in<br />
Kuwait), and Shaye Communications (based in the United Kingdom).<br />
DATAQUEST ANALYSIS<br />
Nokia's recent acquisition of the Consumer Electronics Division of Alcatel (formerly<br />
ITT) makes Nokia the third-biggest consumer electronics manufacturer in Europe after<br />
Philips and Thomson. This will allow Nokia to consolidate and rationalize its European<br />
manufacturing and marketing base arid allow it to gain further market share while<br />
competing effectively against Japanese suppliers. The recent rise in the value of the<br />
Japanese yen, together with Nokia's manufacturing synergy with computer monitors and<br />
its number two position in the corporate microcomputer market, will allow the company<br />
to raise its value-added contribution in these markets. Another significant factor is that<br />
Nokia will now be able to make inroads into the European Community through its new<br />
acquisitions, as Finland is a nonmember of the EEC.<br />
Dataquest estimates that Nokia-Mobira was number one in the rapidly expanding<br />
European cellular radio market in 1987, although the five different standards for cellular<br />
radio used in Europe has hindered its growth. Nokia will be able to leverage its<br />
number one position when the new GSM (Group Speciale Mobile) European Cellular<br />
Network Standard is established, which should be by 1991. Nokia has already taken steps<br />
to address the base station market by forming a consortium with Alcatel and AEG, in<br />
which Nokia has a 35 percent share.<br />
Together with its strength in cellular subscriber equipment and base station<br />
equipment, Nokia will become a commanding force in the European cellular radio<br />
market, estimated to reach $3.5 billion by 1995.<br />
© 1988 Dataquest Incorporated February ESAM Newsletter<br />
•<br />
I
Nokia was already the largest manufacturer of microcomputers in Scandinavia prior<br />
to its acquisition of Ericsson Data System. These combined forces put Nokia in the<br />
number two position in Europe after Olivetti. The relatively successful market<br />
penetration in the United Kingdom and the United States of the Ericsson Data System's<br />
banking terminals, together with Nokia's microcomputer and digital PABX technologies,<br />
will allow Nokia to leverage itself into the lucrative market for fully integrated<br />
information systems. Nokia already has an agreement with the Honeywell-Bull-NEC<br />
consortium in the midrange computer market.<br />
Although the European market for systems integration already has numerous<br />
participants, the biggest potential for growth lies in the North American market. It is<br />
not obvious how Nokia will consolidate its position in this important market; but, it<br />
already has a head start with its joint venture with the Tandy Corporation and its<br />
numerous sales outlets via Radio Shack.<br />
Dataquest believes that because of its leading position in consumer, cellular radio,<br />
and business microcomputer markets, which require highly automated volume<br />
manufacturing and continuous technological advances, Nokia will become a significant<br />
participant in the European market and will join the ranks of Philips, Siemens, and<br />
Thomson. This represents a new challenge and potential for the suppliers of<br />
semiconductors that previously considered Nokia a small niche player.<br />
ESAM Newsletter © 1988 Dataquest Incorporated February<br />
Byron Harding<br />
Bipin Parmar<br />
Anne Barbancon
^m<br />
DataQuest<br />
a company of<br />
TneDun& BradsticetCoqxHation<br />
Research Newsletter<br />
INTRODUCTION<br />
EUROPEAN CD MAfiKET SYNOPSIS<br />
ESAM Code: Vol. II, Newsletters<br />
1987-1<br />
For a nianber of years, optical storage has been regarded as the mass<br />
memory storage technology of the future. One product, the compact disk (CD),<br />
has emerged as the technology driver, gaining mass acceptance with devotees<br />
of hi-fi sound. Compact disks and players became the darlings of the<br />
European audio world in 1986. In this watershed year, CDs gained broad<br />
acceptance by music lovers as the medium of choice for the enjoyment of jazz,<br />
rock, and classics. Approximately 5 percent of householders in Europe owned<br />
CD players in 1986. Half of the current CD players owned were purchased in<br />
1986.<br />
Dataquest's European semiconductor analysts have researched the<br />
production and marketing of CD players in Europe between 1984 and 1992, and<br />
have estimated the semiconductor content of the players produced in 1987. As<br />
indicated in Figure 1, we believe that 1987's European CD market will reach<br />
$447 million, a 226 percent increase over 1986. We estimate that this<br />
represents a $73 million semiconductor opportunity for 1987 alone.<br />
© 1987 Dataquest Incorporated June—Reproduction Prohibited<br />
77M? coments qfrhis repon represent our interpretation and analysis cf inprmiuion generally available to the public or released by responsible individuals in the subject companies but is<br />
not guaranteed as to accuracy or completeness It does not contain material provided to us In confidence by our clients [ndlvidaal companies reported on and analyzed by Dataquest<br />
may be clients cf this and/or other Dataquest services This inprmation is not jumished in connection with a sate or offer to sell securities or in connection with the solicitation of an<br />
offer to buy securities. This firm and its parent and/or their officers, stockholders, or members of their families may, from time to time, have a long or short position in the securities<br />
metuioned and may sell or buy such securities<br />
Dataquest Incorporated, 1290 Ridder Park Drive, San Jose, CA 95131-2398, (408) 971-9000, Telex 171973
Millions of Dollars<br />
900<br />
CD Production<br />
BOO<br />
Semiconductor Consumption<br />
70d-(<br />
900<br />
500-<br />
400-<br />
300-<br />
200<br />
100<br />
0<br />
$193<br />
BACKGROUND<br />
$31<br />
$447<br />
5^<br />
Figure 1<br />
ESTIMATED EUROPEAN CD PLAYER PRODUCTION<br />
'^SS' $73<br />
1986 1987 1988 1989 1990 1991 1992<br />
Source: Dataquest<br />
June 1987<br />
Developed jointly by Philips of the Netherlands and the Sony Corporation<br />
of Japan, compact disk players were the first commercially available digital<br />
audio systems to offer far more accurate sound reproduction than conventional<br />
analog systems. CD players were introduced to Europe in February 1983 and<br />
quickly caught the consumer's attention because of their compact size, easy<br />
handling, and superior sound reproduction. However, initial sales were slow<br />
because of the CD player's high retail price compared with that of its analog<br />
counterpart.<br />
COMPACT DISK PLAYER PRODUCTION IN EUROPE<br />
CD player production is highly competitive in Europe. In order to avoid<br />
large import tariffs (19 percent) placed on the goods, many Japanese manufacturers<br />
have set up production facilities here. Table 1 lists the major<br />
manufacturers, which we believe account for approximately 100 percent of the<br />
total CD player production.<br />
1987 Dataquest Incorporated June ESAM Newsletter
Country<br />
West Germany<br />
France<br />
United Kingdom<br />
Italy<br />
Belgium<br />
Denmark<br />
Switzerland<br />
Turkey<br />
Table 1<br />
CD PLAYER MAMUFACTUSERS IN EUROPE<br />
*Assembly only<br />
••Production to start in 1987<br />
SEMICONDUCTOR CONTEHT<br />
Company<br />
Dual (Thomson subsidiary)*<br />
Grundig*<br />
Aiwa<br />
Akai<br />
JVC<br />
Pioneer<br />
Sony<br />
Aiwa<br />
Pioneer<br />
Autovox**<br />
Philips<br />
Bang and Olufsen*<br />
Studer-Revox<br />
Crown**<br />
Source: Dataguest<br />
June 1987<br />
We have examined a medium-scale CD player and its components and have<br />
estimated the semiconductor value as shown in Table 2. The component values,<br />
based on contract-volume prices, result in an input-output ratio<br />
(semiconductor value as a percentage of equipment average selling price) of<br />
16.3 percent.<br />
ESAM Newsletter 1987 Dataguest Incorporated June
Table 2<br />
ESTIMATED SEMICONDUCTOR CONTENT OF A COMPACT DISK PLATER<br />
Components<br />
Integrated Circuits<br />
Standard Logic (SSI/MSI)<br />
Microcontroller (8-bit)<br />
D/A Converter (16-bit)<br />
Digital Filter<br />
Signal Conditioner<br />
Servo Control Unit<br />
Subtotal<br />
Optoelectronic<br />
Laser Diode<br />
Optical Sensor<br />
LED Lamp<br />
Subtotal<br />
Discrete Components<br />
Total<br />
Semiconductor Value _ $ 45.00<br />
Retail Value ~ $276.00<br />
CD TECHNOLOGY AS A CATALYST<br />
Quantity<br />
13<br />
1<br />
1<br />
1<br />
1<br />
1<br />
1<br />
19<br />
1<br />
1<br />
3<br />
15<br />
47<br />
= 0.163 = 16.3%<br />
Cost<br />
$24.50<br />
$17.50<br />
$ 3.00<br />
$45.00<br />
Source: Dataguest<br />
June 1987<br />
Consiimer acceptance of CD players will act as a catalyst in the<br />
development of other optoelectronic products. CD-ROM technology is virtually<br />
the same as that found in audio CD players, with the exception of more<br />
stringent error-correcting demands for data applications. Potential<br />
applications for CD technology include the following:<br />
• Computer data storage<br />
• Video disks<br />
• Publishing<br />
1987 Dataquest Incorporated June ESAM Newsletter
• Road map directories in automobile dashboards<br />
• Medical records<br />
• Laser smart cards<br />
The potential applications for CD technology represent numerous<br />
attractive markets. They could all gain widespread use by the consumer, in<br />
part because of the enthusiastic acceptance of CD players.<br />
DATAQUEST ANALYSIS<br />
Digital audio disks offer better sound than conventional records and<br />
tapes and put an end to noise and signal degradation over time. This is<br />
because a laser pickup eliminates direct contact with the disk surface;<br />
hence, disk wear is avoided. Using error-detection and -correction circuitry<br />
together with software, the conventional analog filtering techniques are<br />
eliminated. This provides audio that is free of noise and that has concert<br />
hall dynamic range. Digital audio tapes (DAT) and DAT players also offer<br />
perfect sound reproduction with virtually no deterioration regardless of the<br />
number of times the tape is played.<br />
The supply of integrated circuits to CD or DAT player manufacturers is a<br />
significant market opportunity for semiconductor manufacturers in the late<br />
1980s and early 1990s. Dataquest believes that as prices for players, CDs,<br />
and DATs come down, and as older music systems wear out, owners will replace<br />
their combination LP/cassette music libraries with CDs and DATs.<br />
ESAM Newsletter © 1987 Dataquest Incorporated June<br />
Kathleen Killian<br />
Jennifer Berg
.'"^m^M Dataoyest<br />
a company of<br />
The Dun & Bradsbcct CorpOTabon<br />
Research Newsletter<br />
SUMMARY<br />
TELECOMMUNICATIONS—SNAPSHOT OF '87<br />
ESAM Code: Vol. II, Newsletters<br />
1987-2<br />
Dataquest forecasts that the European Communications Equipment<br />
marketplace will increase from $17,871 million in 1986 to $19,914 million in<br />
1987, representing an increase of 11.4 percent (see Table 1). The European<br />
semiconductor consumption for communications equipment is forecast to<br />
increase from $1,411 million in 1986 to $1,700 million in 1987. The purpose<br />
of this newsletter is to provide our summary outlook for customer premise<br />
equipment in 1987 (see Tables 2 and 3). We estimate that customer premise<br />
equipment sales accounted for $7,084 million in revenue and represented<br />
39.6 percent of European communications equipment sales in 1986.<br />
© 1987 Dataquest Incorporated June-Reproduction Prohibited<br />
Jim Beveridge<br />
Jennifer Berg<br />
The conlenls of this report represent our inlerpretalion and aitalysis of inprmalion getterally available to the public or released by responsible individuals in the subject companies but is<br />
not guaranteed as to accuracy or completeness It does not contain material provided to us in confidence by our clients. Individual companies reported on and analyzed by Dataquest<br />
may be clients of this and/or other Dataquest services. This inprmation is not furnished in connection with a sale or q^r to sell securities or in connection with the solicitation of an<br />
qfpr to buy securities. This firm and its parent and/or their officers, stockholders, or members of their families may, from time to time, have a long or short position in the securities<br />
mentioned and may sell or buy such securities.<br />
Dataquest Incorporated, 1290 Ridder Park Drive, San Jose, CA 95131-2398, (408) 971-9000, Telex 171973
Table 1<br />
EUROPEAN COM^aJNICATIONS EQUIPMENT MARKET FORECAST<br />
(Millions of Dollars)<br />
Equipment 1984 1985 1986 1987 1988<br />
Customer Premise<br />
Public Telecommunications<br />
Radio<br />
Broadcast and Studio<br />
Other<br />
391<br />
125<br />
790<br />
305<br />
693<br />
$ 5,860<br />
5,571<br />
1,946<br />
1,418<br />
753<br />
1. 085<br />
5, 292<br />
2, 594<br />
1, 891<br />
1,009<br />
1. 850<br />
5> 960<br />
2> 882<br />
2. 101<br />
1,121<br />
$ 8,482<br />
6,504<br />
178<br />
319<br />
1.284<br />
Total $14,304 $15,548 $17,871 $19,914 $21,767<br />
Equipment<br />
Customer Premise<br />
Public Telecommunications<br />
Radio<br />
Broadcast and Studio<br />
Other<br />
Total<br />
1989 1990 1991 1992<br />
$ 9,088<br />
6,965<br />
3,425<br />
2,480<br />
1,411<br />
$23,369<br />
$10,187<br />
7,649<br />
3,806<br />
2,747<br />
1,561<br />
$25,950<br />
$11,562<br />
8,245<br />
4,165<br />
3,150<br />
1,705<br />
$28,827<br />
Source:<br />
$12,524<br />
8,442<br />
4,205<br />
3,157<br />
1,776<br />
$30,104<br />
Dataquest<br />
June<br />
Ref.<br />
1987<br />
0587-05<br />
© 1987 Dataguest Incorporated June ESAM Newsletter<br />
\
I<br />
Table 2<br />
1987 EUROPEAN CUSTOMER PREMISES EQUIPMENT FORECAST<br />
(Millions of Dollars)<br />
Equipment Type<br />
Terminal Equipment<br />
Single-Line Telephones<br />
Integrated Voice/Data Wkstn.<br />
Facsimile Machines<br />
Telex Machines<br />
Teletex Terminals<br />
Videotex Terminals<br />
Other<br />
Data Communications Equipment<br />
Modems<br />
Statistical Multiplexers<br />
TDM Multiplexers<br />
Data Network Control Systems<br />
Data PBX<br />
Packet Switching Networks<br />
Local Area Networks<br />
Business Communication Systems<br />
Key Telephone Systems<br />
PBX<br />
Centrex<br />
Automatic Call Distributors<br />
Attached Network Functions<br />
Voice Messaging<br />
Call Accounting<br />
Video Teleconferencing<br />
1987<br />
$3,680<br />
2,019<br />
7<br />
470<br />
477-<br />
139<br />
314<br />
254<br />
$ 992<br />
580<br />
72<br />
196<br />
43<br />
4<br />
55<br />
42<br />
$3,156<br />
1,073<br />
1,948<br />
1<br />
134<br />
$ 22<br />
Total $7,850<br />
11<br />
3<br />
8<br />
Source: Dataquest<br />
June 1987<br />
Ref. 0587-05<br />
ESAM Newsletter 1987 Dataquest Incorporated June
Application<br />
Telex<br />
Teletex<br />
Videotex<br />
Table 3<br />
EUROPEAN CUSTOMER PREMISE APPLICATION SUMMARY<br />
End Equipment<br />
Percentage<br />
Growth Rate<br />
1976-1987<br />
(6.3%)<br />
57.9%<br />
9.0%<br />
1987 Market<br />
Estimate ($M)<br />
$ 477<br />
$ 139<br />
$ 314<br />
Facsimile 63.7% $ 470<br />
European Market Outlook<br />
The market up to present has been<br />
characterized by its stability.<br />
A modest decline will be<br />
experienced during 1987 as the<br />
reduction in standalone terminals<br />
is not quite compensated for by the<br />
increased production of PC telex<br />
adapter cards produced by Hasler,<br />
(Germany), DCE, (U.K.)<br />
Growth will be mainly confined to<br />
Germany. Production is by Siemens<br />
and Triumph-Adler.<br />
The product has not gained<br />
acceptance in the mass market.<br />
Except for France, it is confined<br />
to use by the business user groups<br />
such as the financial markets and<br />
travel agents. Within France, it<br />
is enjoying success in the form of<br />
Minitel terminals supplied free to<br />
PTT subscribers in some regions.<br />
Minitel production is running at<br />
1.5 million sets per year.<br />
Production is by Alcatel and Matra.<br />
This is a fast-growing market where<br />
supply is dominated by Japanese<br />
vendors, NEC and Canon. European<br />
production is confined to France<br />
where Alcatel Thomson produced<br />
20,000 sets during 1986.<br />
(Continued)<br />
© 1987 Dataquest Incorporated June ESAM Newsletter<br />
f
•<br />
Application<br />
Single-Line<br />
Telephones<br />
PBX<br />
Modems/<br />
Multiplexers<br />
Local Area<br />
Networks<br />
Table 3 (Continued)<br />
EUROPEAN CUSTOMER PREMISE APPLICATION SUMMARY<br />
End Equipment<br />
Percentage<br />
Growth Rate<br />
1976-1987<br />
15.2%<br />
1987 Market<br />
Estimate (£M)<br />
$2,019<br />
2.5% $1,948<br />
16.9%<br />
55.6%<br />
European Market Outlook<br />
Despite the increasing number of<br />
Far Eastern imports, European<br />
manufacturers continue to dominate<br />
production and supply of the<br />
standard device. Major manufacturers<br />
include Autophon, Comdial,<br />
Ericsson, HPF, ITT, Matra, Siemens,<br />
and Televerket.<br />
Low-end PBX LlOO lines are becoming<br />
commodity items. Dataquest<br />
estimates that 85 percent of the<br />
1986 market in Europe is supplied<br />
by local industry:<br />
100 lines = 1.8 million<br />
$ 580 The major proportion of growth<br />
during 1987 will be accounted for<br />
by PC modems. These are manufactured<br />
by companies such as Racal,<br />
Doughty, and Dacom. The growth<br />
area in the multiplexer marketplace<br />
is in the installation of private<br />
and megabit multiplexers for large<br />
companies. Timeplex, (Ireland) and<br />
CASE, (England) manufacture for<br />
this marketplace.<br />
$ 42 The market is still in an early<br />
growth phase. At present, it is<br />
dominated by U.S. manufacturers<br />
supplying Europe through distribution.<br />
Producers in Europe<br />
include Siemens, (Germany), and<br />
Philips, (Holland).<br />
ESAM Newsletter © 1987 Dataquest Incorporated June<br />
Source: Dataquest<br />
June 1987<br />
Ref. 0587-05
Dataquest<br />
a company of<br />
The Dun & Bradstieet Corporation<br />
Research Newsletter<br />
INTRODUCTION<br />
ESAM Code: Vol. II, Newsletters<br />
1987-3<br />
EUROPEAN CONSUMER EQUIPMENT—SEMICONDUCTOR MARKET ANALYSIS<br />
As the range of semiconductor applications continues to become increasingly<br />
complex, so too has the task of examining and forecasting semiconductor<br />
consumption from an electronic equipment perspective.<br />
Dataquest European Semiconductor Division (ESD) has developed a new<br />
module called European Semiconductor Application Markets (ESAM) that provides<br />
a complete analysis of semiconductor consumption by application market<br />
segment. This product is intended to assist decision makers who must take a<br />
tactical or strategic approach in their analysis of the semiconductor market,<br />
from either an application, demand-side, or end-use perspective.<br />
This newsletter provides ESAM clients with a brief look at the methodology<br />
and offers an example of the research and analyses that can be found in<br />
this new module.<br />
METHODOLOGY<br />
Market Segmentation<br />
Dataquest's European Semiconductor Industry Service has traditionally<br />
broken its end-use analysis into six market segments:<br />
• Automotive<br />
• Computer<br />
• Consumer<br />
© 1987 Dataquest Incorporated June—Reproduction Prohibited<br />
The contents of this report represent our interpretation and analysis of information generally available to the pttblic or released by responsible individuals in the subject companies but is<br />
not guaranteed as to accuracy or completeness. It does not contain material provided to us in confidence by our clients. Individual companies reported on and onalyTgd by Dataquest<br />
may be clients of this and/or other Dataquest services. This information is not furnished in connection with a sale or offer to sell securities or in connection with the solicitation cfan<br />
offer to buy securities. This firm and its parent and/or their ofpcers, stockholders, or members of their families may, from time to time, have a long or short position in the securities<br />
mentioned and mtty sell or buy such securities<br />
Dataquest Incorporated, 1290 Ridder Park Drive, San Jose, CA 95131-2398, (408) 971-9000, Telex 171973
• Industrial<br />
• Government and military<br />
• Telecommunications<br />
The ESAM module uses a slightly different market segmentation, splitting<br />
the electronic equipment into the following markets:<br />
Data processing<br />
Communications<br />
Industrial<br />
Gonsiimer<br />
Military<br />
Transportation<br />
Data processing comprises all equipment whose main function is flexible<br />
information processing. Included in this segment are all personal computers,<br />
regardless of price, distribution, or use in the office, education, or home<br />
environments.<br />
Within the communications market, Dataquest classifies telecommunications<br />
as a subsegment that consists of customer premises and public telecommunications<br />
equipment. The other communications categories include radio,<br />
studio, and broadcast equipment.<br />
The industrial segment comprises all manufacturing-related equipment,<br />
including scientific, medical, and dedicated systems.<br />
The consumer segment comprises equipment that is designed primarily for<br />
home or personal use and whose primary function is not flexible information.<br />
processing. Audio and video equipment and appliances are typical examples of<br />
equipment that is classified in the constimer application market.<br />
Military equipment is primarily defense-oriented electronic equipment and<br />
is classified by major budget area. It does not include all electronic<br />
equipment procured by the government because such a breakout would doublecount<br />
equipment that logically belongs in other market segments.<br />
Finally, transportation consists mainly of automotive and light truck<br />
electronics. This designation leaves room to analyze other markets, such as<br />
off-highway equipment, that are potentially large users of semiconductors.<br />
Full definitions of these segments are included in the ESAM binder.<br />
© 1987 Dataquest Incorporated June ESAM Newsletter
Research<br />
Depth of research includes:<br />
• Information on electronic equipment manufacturers in Europe,<br />
including revenue and semiconductor consumption<br />
• European electronic equipment forecasts by application market,<br />
including equipment type and year<br />
* European semiconductor consumption forecasts by application market:<br />
by product, technology, and region<br />
• Detailed service sections covering market trends and semiconductor<br />
analyses within each of the major application markets<br />
ANALYSIS<br />
The following section is an example of the type of information that is<br />
available as part of the ESAM module.<br />
Table 1 shows Dataquest's forecast for the European consumer equipment<br />
market. The appliance market is the largest portion of the European consumer<br />
segment. Dataquest estimates that the European market for appliance equipment<br />
will reach $13,546 million by 1991, declining slightly at a compound annual<br />
growth rate (CAGR) of negative 0.6 percent for 1987 through 1991.<br />
Table 2 shows Dataquest's forecast for European semiconductor consumption<br />
for consumer equipment. The consumer semiconductor market is estimated to<br />
grow at a CAGR of approximately 2.1 percent between 1987 and 1991. This is<br />
lower than the overall semiconductor market, which Dataquest estimates to be<br />
growing at a CAGR of 12.3 percent between 1987 and 1991.<br />
Table 3 shows Dataquest's forecast for European input/output (I/O) ratios<br />
• for consumer equipment. The I/O ratio represents the value of the semiconductors<br />
divided by the value of the electronic equipment and expressed as a<br />
percentage.<br />
Table 4 shows Dataquest's estimates for the European appliance market.<br />
The European home appliance industry (manufacturing such items as refrigerators,<br />
washers, dryers, dishwashers, and microwave ovens) is currently<br />
severely depressed and has been so for several years. The saturation point<br />
has been reached for several products. Notable exceptions to this are<br />
microwave ovens, ranges, ovens, dishwashers, and disposals.<br />
ESAM Newsletter © 1987 Dataquest Incorporated June
Audio<br />
Video<br />
Personal<br />
Electronics<br />
Appliances<br />
Other<br />
Table 1<br />
EUROPEAN CONSUMER EQUIPMENT PRODUCTION<br />
(Millions of Dollars)<br />
1985 1986 1987 1988 1989 1990 1991<br />
$ 791<br />
3,746<br />
1,190<br />
10,648<br />
227<br />
$ 897<br />
3,910<br />
1,220<br />
11,803<br />
222<br />
$ 1,166<br />
4,280<br />
1,284<br />
13,880<br />
232<br />
$ 1,101<br />
4,047<br />
1,213<br />
13,115<br />
219<br />
$ 1,295<br />
5,069<br />
1,581<br />
12,770<br />
260<br />
$ 1,338<br />
5,256<br />
1,742<br />
13,011<br />
257<br />
$ 1,485<br />
5,540<br />
1,828<br />
13,546<br />
285<br />
Total $16,602 $18,052 $20,842 $19,695 $20,975 $21,604 $22,684<br />
Audio<br />
Video<br />
Personal<br />
Electronics<br />
Applismces<br />
Other<br />
Table 2<br />
EUROPEAN SEMICONDUCTOR CONSUMPTION<br />
CONSUMER<br />
(Millions of Dollars)<br />
Source: Dataquest<br />
June 1987<br />
Ref. 0587<br />
1985 1986 1987 1988 1989 1990 1991<br />
$ 68<br />
426<br />
33<br />
201<br />
5<br />
$ 87<br />
448<br />
34<br />
238<br />
6<br />
$133<br />
529<br />
39<br />
230<br />
7<br />
$ 133<br />
584<br />
46<br />
274<br />
7<br />
$ 134<br />
588<br />
49<br />
271<br />
7<br />
$ 142<br />
592<br />
49<br />
270<br />
7<br />
$ 157<br />
641<br />
Total $733 $812 $938 $1,044 $1,049 $1,059 $1,163<br />
54<br />
303<br />
8<br />
Source: Dataquest<br />
June 1987<br />
Ref. 0587<br />
1987 Dataquest Incorporated June ESAM Newsletter
Table 3<br />
EUROPEAN INPUT/OUTPUT RATIOS<br />
CONSUMER<br />
(Percent Based on Dollar Values)<br />
1985 1986 1987 1988 1989 1990 1991<br />
Audio 8.6% 9.7% 11.4% 12.1% 10.3% 10.6% 10.6%<br />
Video 11.4% 11.5% 12.4% 14.4% 11.6% 11.3% 11.6%<br />
Personal Electronics 2.8% 2.8% 3.0% 3.8% 3.1% 2.8% 3.0%<br />
Appliances 1.9% 2.0% 1.7% 2.1% 2.1% 2.1% 2.2%<br />
Other 2.4% 2.5% 3.0% 3.2% 2.6% 2.7% 2.8%<br />
Average I/O Ratio 4.4% 4.5% 4.5% 5.3% 5.0% 4.9% 5.1%<br />
Air Conditioners<br />
Microwave Ovens<br />
Washers and Dryers<br />
Refrigerators<br />
Dishwashers and<br />
Disposals<br />
Ranges & Ovens<br />
Vacuum Cleaners<br />
Food Processors<br />
Heaters<br />
Table 4<br />
ESTIMATED EUROPEAN APPLIANCE MARKET<br />
(Millions of Dollars)<br />
Source; Dataquest<br />
June 1987<br />
Ref. 0587<br />
1985 1986 1987 1988 1989 1990 1991<br />
192 $ 196<br />
8 60<br />
2,793 3,044<br />
219 $ 207 $ 181 $ 184 $ 192<br />
138 130 162 165 171<br />
3,556 3,360 3,100 3,158 3,288<br />
1,737 1,862 2,139 2,021 1,774 1,808 1,882<br />
599 702 845 798 1,052 1,072 1,116<br />
1,933 2,175 2,581 2,439 2,461 2,509 2,613<br />
1,029 1,134 1,325 1,252 1,099 1,120 1,165<br />
1,162 1,278 1,492 1,410 1,239 1,262 1,314<br />
870 963 1.117 1.056 927 943 822<br />
Total $10,648 $11,803 $13,880 $13,115 $12,770 $13,011 $13,546<br />
ESAM Newsletter 1987 Dataquest Incorporated June<br />
Source; Dataquest<br />
June 1987<br />
Ref. 0587
The full advantage of the methodology detailed above is realized by<br />
applying I/O ratios to these appliance estimates. This demonstrates that the<br />
estimated semiconductor consumption of European appliances will grow from<br />
$230 million in 1987 to $303 million in 1991, a CAGR of 7.1 percent. In the<br />
appliance market, Europe's leading producers are now stepping up their<br />
development of electronic controls and timers, although only for more<br />
sophisticated machines. However, Dataguest believes that it will be<br />
necessary for them to display a faster rate of innovation in order to avoid<br />
being overtaken by the new Japanese products that should be available on the<br />
market in the next five years.<br />
Jennifer Berg<br />
© 1987 Dataguest Incorporated June ESAM Newsletter
Dataoyest<br />
k^ i m a company of<br />
^ W D The Dun &Bradstreet Corporation<br />
Research Newsletter<br />
ESAM Code: Vol. II, Newsletters<br />
1987-4<br />
A WORLDWIDE SMART CARD OUTLOOK: EUROPE PIONEERS PRODUCTION<br />
The most dramatic change in the smart card market over the last year is<br />
that the market appears more application-driven and likely to grow from a<br />
demand-pull. For years the smart card has been a great concept in search of<br />
a market—a technology push. Today, smart card technology is able to provide<br />
solutions to many problems. This newsletter highlights recent worldwide<br />
smart card market activities, Dataquest's current unit production<br />
projections, and key developments occurring across the globe.<br />
EUROPE—THE BACKDROP FOR MARKET ACTIVITY<br />
The IC credit card or smart card was pioneered in 1976 by French citizen,<br />
Ronald Moreno. Three years later, in 1977, the concept became a reality as a<br />
result of collaborative work between Cii Honeywell Bull and Motorola<br />
Semiconductors (Europe). Initial production started in 1981 using a singlechip<br />
8-bit microcontroller with 1,026 bytes of EPROM. Today, 10 years on<br />
from the first development work, IC cards are running in volume production in<br />
Europe in addition to undergoing nijmerous field trials in a variety of<br />
applications.<br />
Table 1 lists Dataquest's world unit production estimates for 1987:<br />
nearly 50 million units. Of this 50 million, we expect 45 million or<br />
90 percent of the production to take place in Europe. We estimate that this<br />
45 million will comprise 22 million units of the financial card CP8 and<br />
23 million units of the telephone E^PROM card being marketed by the<br />
French PTT.<br />
Production of the telephone card is exclusively by Thomson Semiconductors<br />
and takes place in its Rousset Plant, Southern France. Thomson recently<br />
moved a number of MOS processes from the Grenoble Plant to Rousset in order<br />
to focus key MOS process development in one center. The development of E^,<br />
EPROM, and HCMOS processes at this site allows the company to rationalize the<br />
production and development resources associated with the telephone and<br />
© 1987 Dataquest Incorporated February—Reproduction Prohibited<br />
The cotaents of this report represent our interpretation and analysis of infi}rmation generally available to the public or released by responsible individuals in the subject companies but is<br />
not guaranteed as to accuracy or completeness. It does not contain material provided to us in confidence fty our clients. Individual companies reported on and analyzed by Datatjuest<br />
may be clients of this and/or other Dataquest services. This information is not furnished in connection with a sate or offer to sell securities or in connection with the solicitation of an<br />
ciffer to buy securities. This firm and its parent and/or their officers, stocidtolders, or members of their families may, from time to time, have a long or short position in the securities<br />
mentioned and may sell or buy such securities<br />
Dataquest Incorporated, 1290 Ridder Park Drive, San Jose, CA 95131-2398, (408) 971-9000, Telex 171973
CP8 cards. Dataquest estimates that Thomson will supply approximately<br />
20 percent of worldwide demand on CP8 (8.8 million units) during 1987. The<br />
other participants during 1987 are Motorola (Scotland) and Philips (RTC<br />
France) with 40 percent and 20 percent of the worldwide production,<br />
respectively.<br />
Dataquest expects that the present E^pROM telephone credit card will be<br />
phased out during 1987/1988 to be replaced by a variant of CP8. By 1992,<br />
Dataquest estimates that worldwide IC card production will be 525 million<br />
units, Europe accounting for 35 percent of the TAM.<br />
Financial<br />
Telephone<br />
Other<br />
Total<br />
Table 1<br />
ESTIMA.TED WORLDWIDE SMART CARD PRODUCTION*<br />
(Millions of Units)<br />
1985<br />
X<br />
'^:<br />
N/A<br />
4<br />
1986<br />
T<br />
10<br />
N/A<br />
17<br />
1987<br />
25<br />
22<br />
-1 '<br />
50<br />
1988<br />
45<br />
50<br />
7<br />
102<br />
1990<br />
70<br />
95<br />
3Q<br />
195<br />
1991<br />
*Assumes financial cards have a life cycle of approximately two years.<br />
Other cards have a life cycle of six years. Telephone card life cycle is<br />
three months.<br />
N/A = Not Available<br />
U.S. SMART CARD MARKET ACTIVITY<br />
135<br />
185<br />
55<br />
375<br />
1992<br />
155<br />
260<br />
110<br />
525<br />
Source: Dataquest<br />
May 1987<br />
In the United States the smart card market has centered around<br />
entrepreneurial activity and alternative technologies such as that of<br />
Datakey, Inc., a Minnesota company focusing on nonfinancial smart card<br />
applications. The much-touted financial arena (the most traditionally<br />
thought of application for smart cards) had too many barriers to entry—<br />
namely ISO packaging requirements and smart card cost. (Other ISO standards<br />
activities for the smart card, for example, communications protocols, are<br />
still emerging.) Some confuse the unclear standards as a major market<br />
barrier. While smart card standards are more complex than for the mag<br />
stripe, it is encouraging to note that it took seven years before standards<br />
© 1987 Dataquest Incorporated May ESAM Newsletter
for mag stripe technology were adopted; today nearly a decade later, over<br />
1 billion mag stripe cards are in circulation—for financial transactions<br />
alone.<br />
In the past, Dataquest has noted that nonfinancial applications would be<br />
the driving force behind smart card development, particularly in the<br />
United States because nonfinancial applications:<br />
• Would not be restricted by ISO packaging and communication standards<br />
for plastic cards<br />
• Would not be limited by the current infrastructure and manner in<br />
which business is currently performed (i.e., working around the<br />
already heavy investment in automatic teller machines)<br />
MasterCard International and Visa International, both with very different<br />
philosophies, strategies, and approaches to the market, have begun to change<br />
this. The nonfinancial market legitimized the technology to a certain extent<br />
and acted as a proving ground for smart card technology. Just as Dataquest<br />
originally expected, these applications appear to have inspired the financial<br />
community to analyze smart card technology with a view toward applications<br />
within the financial arena.<br />
MasterCard—Leading the Way<br />
Things changed in 1985 when MasterCard International formally announced<br />
its market test, setting off a flurry of interest including a smart card<br />
approach announced shortly thereafter by Visa International. Both MasterCard<br />
and Visa are outspoken about their approaches to smart card solutions.<br />
We believe that MasterCard has been actively qualifying and discussing<br />
vendor participation and we expect an announcement in the first half of 1987<br />
as to who will be the program's major participants and how the program will<br />
expand. We believe that MasterCard has been working with as many as six<br />
IC manufacturers including NEC and Motorola whose chips are in the cards<br />
currently being tested. We believe Motorola is the only U.S. IC manufacturer<br />
among the six or so companies. Requirements for multiple sourcing and<br />
MasterCard's requirement for state-of-the-art technology are fostering<br />
numerous discussions. Another potential boon to semiconductor manufacturers<br />
is that MasterCard is considering the testing of biometric identification as<br />
a less cumbersome solution than PIN codes. Proposed methods include<br />
digitized signatures or finger characteristics.<br />
We believe that MasterCard will begin testing and using a production IC<br />
card by the second or third quarter of 1987. MasterCard views the semiconductor<br />
industry as a vital support link, necessary to effectively<br />
implement the technology. Unconfirmed estimates place MasterCard IC card use<br />
at the low hundreds of thousands by mid-1987, the low millions by 1988, and<br />
high volume in the late 1989 to early 1990 time frame.<br />
ESAM Newsletter © 1987 Dataquest Incorporated May
The Visa Approach<br />
Visa International's strategy for smart cards is quite different from<br />
that of its counterpart. Visa believes that the current need for the<br />
technology comes from improving current bankcard services and providing new<br />
services that can produce incremental income. They believe that the current<br />
system works and that operating costs and losses through fraud can be<br />
reduced. Visa believes that current services are highly profitable and it<br />
disagrees with MasterCard that today's bankcard business can justify smart<br />
card technology. MasterCard justifies implementation based on reducing<br />
losses and authorization costs.<br />
Visa believes that in order to take advantage of new technologies and new<br />
services and improve existing services there must be an increase in terminal<br />
penetration because different terminals accept different cards. Therefore,<br />
by putting the terminal on the card, the industry has a readable card that<br />
also becomes the delivery system—no need for a variety of terminals,<br />
especially with a single vendor that accepts more than one card.<br />
For the financial community this is truly forward thinking, because the<br />
history of banking holds that authority lies in more than one place—to use<br />
the analogy of the safety deposit box, the customer brings a key, the banker<br />
brings a key, and together they unlock the box. Visa believes that the key<br />
and the lock do not have to be in two different places. MasterCard, on the<br />
other hand, is approaching the system from a traditional banking operation<br />
perspective. In short. Visa views the concept as pocket banking as compared<br />
to controlled banking.<br />
Visa's different perspective, namely its cost justification, view toward<br />
providing new services, and pocket banking concept has thrust it toward<br />
development of the next generation of smart card technology—a card utilizing<br />
E^ technology, which Visa refers to as a super card and which falls at the<br />
high end of the card evolution spectriun.<br />
Visa is currently testing a small number of cards developed by Smart Card<br />
International and manufactured by General Instrument's Microelectronics<br />
Division. The main purpose is to evaluate users' needs and attitudes toward<br />
the technology. Meanwhile, Visa has commissioned Toshiba to make a production<br />
version of the card with the charter of putting the technology on a card<br />
that meets ISO standards of 30 mils in thickness. The time frame for<br />
completion is the fall of 1987 to spring of 1988.<br />
We applaud Visa's strategy to seek "a gradual transition to the smarter<br />
cards of the future while supporting the coexistence of several technologies,"<br />
and we believe that E^ technology is the long-term answer to<br />
most future smart card applications. MasterCard, however, is taking a more<br />
realistic approach in its attempt to use current technology within the<br />
current financial infrastructure.<br />
E^ technology for financial applications is still not as technically<br />
feasible. MasterCard's testing of the technology in a large-scale pilot is a<br />
manageable approach to making the technology realistically meet the needs of<br />
today's bankcard environment. We believe that smart cards can work in the<br />
© 1987 Dataquest Incorporated May ESAM Newsletter
financial community today, without having to wait for E^ technology in the<br />
late 1980s time frame. Testing the system as it exists appears most feasible<br />
from a smart card market perspective. MasterCard is chartering U.S. market<br />
development in financial applications.<br />
JAPAN'S FOOTS OH SMART CARDS<br />
There has been a surge in Japanese smart card activity over the last<br />
year. Dataguest's semiconductor market analysts in Japan have kept abreast<br />
of smart card market trends and we believe that there is no question that<br />
this market is being assessed and targeted very seriously by many sectors of<br />
the Japanese economy—much of this activity appears coordinated and<br />
orchestrated at a government level. The development of the smart card market<br />
is a lesson in Japanese industrial policy at work; competition is said to be<br />
fierce. There are as many as 50 to 75 small tests actively being observed.<br />
Applications are numerous and a myriad of technologies are being used.<br />
Consensus holds that a large number of small tests will provide the best<br />
window on market opportunities.<br />
The most striking aspect of Japan's involvement has been the pace with<br />
which the Japanese have taken an active interest in the market. In terms of<br />
manufacturing technology, smart cards are similar to calculators and digital<br />
watches. Smart cards lend themselves to assembly and production by Japan's<br />
large electronic watch and calculator manufacturers.<br />
In Japan, partnerships and alliances appear integral to the market's<br />
early development. Manufacturers are aligning with users to secure volume<br />
sales of products that conform to a worldwide or manufacturer's standard.<br />
This is all part of the coordination and cooperation that is being brought to<br />
bear on the Japanese focus on this market.<br />
COHCLUSIOWS<br />
We are encouraged by smart card activity overall, and in particular the<br />
surge of activity seen in 1986. We believe 1987 will bring continued market<br />
opportunities and growth as the market begins its early shift into high<br />
gear. Market participants should be positioning themselves now; waiting much<br />
longer may mean that the market will be closed just as it begins to ramp up.<br />
There are opportunities for many types of IC manufacturers because the market<br />
has needs in large scale, high-volume applications as well as within the<br />
niches. The smart card market will not be only for those who are capable of<br />
withstanding the tremendous competition of commodity markets.<br />
ESAM Newsletter © 1987 Dataquest Incorporated May<br />
Jennifer Berg<br />
Jim Beverige<br />
Anthea C. Stratigos
^ ^<br />
^iW:^^' ^ Dataoyest<br />
^ ^ ^ ^ BBfl<br />
rj&?.f f<br />
^<br />
-comianyof<br />
TheDun& Corporation<br />
Research Newsletter<br />
OVERVIEW<br />
ESAM Code: Vol. II, Newsletters<br />
1987-5<br />
EUROPEAN MANTTFACrnBING ADTCMATION STATUS—SUMMER 1987<br />
Development and installation of manufacturing automation in Europe is<br />
continuing on an aggressive scale relative to the rest of the world. Key<br />
factors that are sustaining investments in industrial plant modernization<br />
include:<br />
• Pressure to reduce manufacturing costs as local currencies rise in<br />
comparison with the U.S. dollar<br />
• Rising confidence in the value of automation based upon results of<br />
pioneering efforts of innovative industry leaders<br />
• Cooperative programs between governments, universities, and<br />
individual companies for investments in technology development<br />
• Focus of management upon strategic manufacturing as a vital element<br />
for European economic strength in a global economy<br />
Dataguest believes that Europe is currently leading the rest of the world<br />
in implementation of automated work cells. Figure 1 shows the relative<br />
positions of Western Europe, Asia, and the United States as of early 1987.<br />
The growth of strategic partnerships between European companies both within<br />
and across national borders is enabling this technology to spread rapidly.<br />
The 1987 world market for manufacturing automation, excluding design<br />
automation and automation services, is estimated to be US$35.0 billion.<br />
Europe is expected to purchase US$7.2 billion, or 22.5 percent of the world<br />
total. Figure 2 shows the relative shares of the European total that<br />
Dataguest estimates will be consumed by individual European countries in 1987.<br />
1987 Dataguest Incorporated August—Reproduction Prohibited<br />
The contents of this report represent our interpretation and analysis of injbrmation generally avaihble to the public or released by responsible individuals in the subject companies but is<br />
not guaranteed as to accuracy or conq>leteness. It does not contain material provided to us in confidence by our clients. Individual companies reported on and analyzed by Dataguest<br />
may be clients of this and/or other Dataguest services. This information is not furnished in connection with a sale or c^r to sell securities or in connection with the solicitation of an<br />
c^er to buy securities This firm and its parent and/or their officers, stockholders, or members of their families may, from lime to time, have a long or short position in the securities<br />
mentioned and may sell or buy such securities<br />
Dataquest Incorporated, 1290 Ridder Park Drive, San Jose, CA 95131-2398, (408) 971-9000, Telex 171973
•'95%<br />
Figure 1<br />
MANUFACTURING AUT(»IATION IMPLEMENTATION<br />
Early 1987<br />
Western Europe<br />
Automating Equipment<br />
Linl
WESTERM EUROPEAN MMnTFACTORIHG DEVELOPMEMT TREHDS<br />
During the spring of 1987, Dataquest toured four of the major industrial<br />
countries in Western Europe and attended the Hannover Industrial Fair in West<br />
Germany and the SICOB and Convention Automatique Productique exhibits in<br />
Paris. Dataquest visited factories of both automation users and vendors, and<br />
held press conferences with members of the technical press in London and<br />
Hannover regarding the status of manufacturing automation developments and<br />
trends for the immediate future.<br />
The Hannover Industrial Fair is a massive display. Taking place in<br />
buildings encompassing a total of 380,000-square-meters with more than<br />
6,000 companies, universities, and research institutes from 50 countries<br />
exhibiting, it attracted nearly half a million attendees.<br />
Although the Fair had a strong West German vendor flavor, the signs of<br />
European unity were clearly discernible from the opening address by the<br />
vice-president of the European Economic Communities (EEC) commission.<br />
Examples of this unity were programs such as ESPRIT (European Strategic<br />
Program for Research and Development in Information Technology) and joint<br />
exhibits such as the "Initiatives for the Factory of the Future." The latter<br />
consisted of 194 individual stands, encompassing 10,000 square meters, that<br />
presented production-related automation technology in an overall, integrated<br />
context.<br />
Dataquest believes that a major industrial trend in Western Europe is the<br />
emergence of a European community that is replacing the old internecine wars<br />
and conflicts that characterize much of European history. According to the<br />
Treaty of Rome, signed in 1957, a large common European market and<br />
technological community is expected to emerge by 1992. The primary objective<br />
is to create a market size for European industry that is comparable to what<br />
exists for North American and Japanese firms. The market area is expected to<br />
result from the planned dismantling of all trade, monetary, and technology<br />
barriers between members of the EEC.<br />
The concept of a united Europe has a high acceptance level, according to<br />
surveys that have been taken by members of the community. There is a broad<br />
awareness of changing international circumstances and a consequent change in<br />
priorities for responding to the new international environment.<br />
Manufacturing automation development and implementation is high on the list<br />
of priorities.<br />
Governments already are pooling funds in technology development and<br />
research via such projects as ESPRIT. The EEC has spent $120 million since<br />
1982 developing ideas for the factory of the future. It is now proposed that<br />
$1.2 billion be spent on computer-integrated manufacturing (CIM) research<br />
over the next 5 years. In addition, the EEC expects to invest over<br />
$900 million in communications research with the Race program and<br />
$140 million for the Brite program on industrial technologies.<br />
Manufacturing automation protocol (MAP) is well on the way towards<br />
development with a distinctly European flavor. Standards are viewed as a<br />
means for widening market opportunities for European automation systems<br />
vendors. For example, instead of producing machine tools with Italian<br />
ESAM Newsletter © 1987 Dataquest Incorporated August
standards to serve the Italian market, machine tool builders can address<br />
world markets if their machines conform to international standards. European<br />
users are involved in the MAP development through the ESPRIT program and<br />
through membership in EMUG, the European MAP Users Group.<br />
Another trend is toward joint ventures, strategic alliances, and mergers<br />
across borders. An example is the agreement between France's Thomson<br />
Semiconducteurs and Italy's SGS Semiconductors. This merger will involve the<br />
creation of a Netherlands-based company, owned 50 percent by Thomson-CSF and<br />
50 percent by STET, the Italian group. Other examples of noteworthy<br />
cooperative efforts include a joint R&D effort for digital switches by<br />
France's CIT-Alcatel, Italy's Italtel, Plessey of Britain, and West Germany's<br />
Siemens AG; ICL, Siemens, and Bull cooperating on technology for the next<br />
generation of computers; and Philips and Siemens working together to develop<br />
megabit chips.<br />
The mood of the European manufacturing automation vendors at the Hannover<br />
Fair was one of optimism. The same attitude was expressed by both vendors<br />
and end users of automation systems during Dataguest visits to factory sites<br />
in Europe. Manufacturing competitiveness on a global scale is viewed as a<br />
major factor in the economic well-being of European society. Automation is<br />
seen as a key element in the ability of manufacturers to sell products on a<br />
worldwide basis.<br />
Installation of automated systems and processes in Europe has progressed<br />
to a greater extent than might be realized. Experience with successful<br />
automation projects has tended to make both systems vendors and end users<br />
highly receptive to further investments in manufacturing systems. Dataguest<br />
further believes that the Western European region is taking a back seat to no<br />
one in such areas as work cell integration, use of expert systems in<br />
manufacturing, robotics, automated material handling systems, and factory<br />
floor simulation software.<br />
WEST GERMANY<br />
West Germany leads the world in per capita exports, with 60 percent of<br />
its gross national manufactured products exported. This level is twice as<br />
high as Japan's and four times that of the United States. German<br />
manufacturing managers tend to be technically trained with factory operations<br />
experience. These executives view manufacturing operation efficiency as one<br />
of the key elements to maintaining worldwide competitiveness. Thus,<br />
investments in manufacturing technology are strong.<br />
The recent rise in the value of the deutsche mark relative to the dollar<br />
has added additional incentive toward investments in manufacturing<br />
automation. Since the United States often represents 30 percent or more of<br />
the West German market, every attempt to hold product prices down in the<br />
United States is being made. Because the price must be lowered to counter<br />
the rising mark value, profit margins can be retained only if product costs<br />
are reduced. How is this being accomplished? Through increased automation,<br />
say German representatives.<br />
© 1987 Dataguest Incorporated August ESAM Newsletter
Interviews with West German manufacturing executives reveal that the<br />
annual rate of automation systems investments will grow between 15 and<br />
20 percent per year for at least the next two years. This rate is the<br />
highest in Europe. Particularly strong are purchases of robotics, material<br />
handling automation, and industrial sensors. West Germany has more flexible<br />
manufacturing systems (FMS) installations than any other country in the<br />
world, with approximately 100 such installations as of the end of 1986.<br />
West German industry has close cooperation with universities. Dataguest<br />
saw at least 12 universities that exhibited their state-of-the-art technology<br />
developments at the Hannover Fair. In contrast to the U.S. students, the<br />
highly motivated West German students were looking forward to careers in<br />
manufacturing operations or research in manufacturing technology development.<br />
FRANCE<br />
France is the second-largest market for manufacturing automation systems<br />
in Europe, with an estimated total of nearly $1.3 billion to be spent in<br />
1987, as shown in Figure 2. Applications of automation are concentrated in<br />
the largest companies. The market has been slow in developing for the<br />
following reasons:<br />
In an alliance with EMUG, 30 French companies have been working since<br />
June 1986 on development of a factory network standard called Factory<br />
Information Protocol (FIP). This network is intended to be implemented at<br />
the equipment and workstation level below the factory MAP network. The<br />
objective of this standard is to provide analog, nondedicated, low-cost<br />
communications at the lowest levels in the factory. FIP would be connected<br />
to the MAP network via bridges.<br />
Dataguest attended both the Convention Automatique Productique and the<br />
SICOB computer fair in Paris. In conjunction with SICOB, Bull held a<br />
separate show where it exhibited its capabilities in both design and process<br />
automation. All of these events, while not on the scale of the Hannover<br />
Fair, were well attended. The French are determined not to be left behind in<br />
the European surge toward manufacturing automation developments. They place<br />
particular emphasis on software development, modeling of automated structures<br />
and organizations, design automation, and workstation scheduling and control<br />
innovations.<br />
Concerted efforts are being made to ensure that workers and executives<br />
alike are well trained in the developments that are occurring in<br />
manufacturing. For example, Peugeot/Citroen advertises that 3.5 percent of<br />
the annual turnover of the combined companies is spent on employee training.<br />
ITALY<br />
Italy is currently experiencing the best economic environment that it has<br />
seen in a decade. Always strong in engineering capabilities, Italy is at the<br />
forefront of European manufacturing automation technology development. There<br />
is a new emphasis on worldwide business alliances and product development.<br />
An important example of this trend is Olivetti, which has formed alliances<br />
with AT&T in the United States, and with European and Asian firms. In<br />
addition, Olivetti is actively pursuing its role as a leading vendor of<br />
manufacturing information systems development on a worldwide basis. Comau's<br />
acquisition of three French machine tool companies is another example of<br />
Italian expansion into European markets.<br />
The automotive, apparel, and appliance industries have gained significant<br />
penetration into global markets. According to the Italian Economic Study<br />
Office, the export-import balance of trade for machine tools has climbed<br />
steadily upward since 1975 to an estimated positive level of nearly<br />
1,000 million liras in 1986. Exports of machine tools exceed domestic<br />
consumption by nearly 400 million liras. Nineteen eighty-six machine tool<br />
revenue increased by 17 percent over 1985. Italy is the world's fifth<br />
largest producer of this class of automation systems.<br />
Turnkey plant installations by Italian firms lead the rest of Europe,<br />
with 80 percent of their turnover coming from installations outside Italy,<br />
according to the chairman of Italimpianti. Evidence of Italian manufacturing<br />
technology prowess can be seen from recent contract awards to Italian firms.<br />
For example, Mitsubishi has signed an agreement to market rolling mill<br />
technology developed by Pomini Farrel throughout Asia. For the Soviet<br />
© 1987 Dataguest Incorporated August ESAM Newsletter
government's ZAZ towncar, Geico of Milan will provide design and construction<br />
of the entire painting structure, including pretreatment, catphoresis, and<br />
robotized lines for primer and final coats for vehicle interior and exterior<br />
bodywork. This car will be produced and marketed throughout the USSR<br />
beginning in 1990.<br />
There are 70 robot manufacturers in Italy. The majority of these are<br />
simple pick-and-place devices that do not qualify as robots under the<br />
Dataguest or Robotics Industry Association (RIA) definition. For example, in<br />
1985, Italy had an installed base of 5,000 industrial and 15,000 additional<br />
pick-and-place machines. Dataguest estimates that robot use in Italy is<br />
growing at 25 to 30 percent per year. Major suppliers include Comau, DEA,<br />
and Olivetti. Major users include Fiat and its newly acquired subsidiary,<br />
Alpha Romeo, and Olivetti—which supplies 90 percent of its robots itself.<br />
UNITED KINGDOM<br />
The weakest link in an otherwise upbeat European manufacturing automation<br />
market appears to be the United Kingdom. The London Financial Times has<br />
reported that in 1987, Italy's GNP is expected to surpass that of the United<br />
Kingdom for the first time in modern history. The United Kingdom will be<br />
last in terms of GNP size of the major EEC countries.<br />
Even so, Dataguest believes that there are some signs of encouragement<br />
for the future of U.K. manufacturing developments. For example, some<br />
50 Japanese companies have set up factories in Britain, putting it<br />
neck-and-neck with West Germany as the European nation of choice for Japanese<br />
enterprises. Currently, Japanese firms such as Nissan, Sony, NEC, Hitachi,<br />
Komatsu, Svunitomo, and Ricoh employ about 13,000 workers.<br />
At the $650 million Nissan plant in Sunderland, evidence of changes to<br />
England's class-ridden industrial past are reported to have resulted in a<br />
steady increase in output levels, with quality reportedly equal to that of<br />
cars produced in Japan. Further, there have been no union grievances to<br />
date. A just-in-time system of scheduling the arrival of parts, the<br />
utilization of groups of spot-welding robots, and the emphasis of employee<br />
teamwork are fundamental changes in British industrial style.<br />
Other areas of British leadership in European manufacturing automation<br />
development are that the chairman of EMUG, Colin Hoptroff, is an executive at<br />
Jaguar, and that British Aerospace is the prime contractor for CNMA<br />
(Communications Network for Manufacturing Applications). CNMA, a parallel to<br />
MAP, is a European initiative funded by EEC as one of the ESPRIT<br />
developments. MAP and CNMA have the same objective, which is to get<br />
suppliers and users of automation systems to use the open network<br />
communications standards as defined by the ISO (International Standards<br />
Organization).<br />
ESAM Newsletter © 1987 Dataguest Incorporated August
In spite of these bright spots, Dataquest believes that the United<br />
Kingdom lacks the intensity of development that is occurring elsewhere in<br />
Europe. Too many developments appear to be academic, with low levels of<br />
acceptance in the mainstream of manufacturing industries. The recent<br />
reelection of the Thatcher government is more likely to produce a<br />
continuation of the present level of development than it is to produce any<br />
revolutionary changes in British industry.<br />
DATAQUEST ANALYSIS<br />
In summary, Dataguest finds the status of European manufacturing<br />
automation to be as follows:<br />
• European business is generally good and growing for most<br />
manufacturers. Exports to the United States continue in spite of<br />
the falling U.S. dollar.<br />
• Technology development is being emphasized throughout Europe,<br />
especially in applications software and the integration of<br />
programmable equipment into automated work cells.<br />
• Dataquest estimates that Europe is spending 25 percent of its total<br />
investment in manufacturing automation for integration of equipment<br />
into work cells, 4 percent for integrating entire factory systems,<br />
and 71 percent for automating individual pieces of equipment. The<br />
level of work cell integration is the highest as a percent of the<br />
total automation investment in the entire world.<br />
« Generally, European governmental support for manufacturing<br />
automation development is clearly evident. Although governments may<br />
not be as enthusiastic about the formation of a single European<br />
economic community as is industry, Dataquest believes that<br />
developments to this end may well occur at a faster pace than is<br />
currently anticipated, both within and outside Europe; this will be<br />
particularly true if the United States appears to begin to reduce<br />
its Western European military support after 1988.<br />
« Worldwide alliances, as well as intra-European alliances, joint<br />
ventures, the pruning of unprofitable products and factories, and<br />
the implementation of automation in manufacturing, are well under<br />
way in Europe.<br />
9 Manufacturing competitiveness is a high-priority item in Europe.<br />
There is no debate about becoming a service economy or a postindustrial<br />
society. Europe intends to continue to be very much a<br />
world industrial power.<br />
• Since exports represent a high percentage of the GNP of European<br />
manufacturers, the increase in their currency values relative to the<br />
U.S. dollar provides additional impetus to reduce the cost of goods<br />
sold. Automation is seen as a major element in meeting this<br />
objective.<br />
8 © 1987 Dataquest Incorporated August ESAM Newsletter
• Europe enjoys good academic support for technical developments in<br />
manufacturing automation. Universities are providing a source of<br />
highly qualified and motivated human resources for long-term growth<br />
in European manufacturing technologies.<br />
• Dataquest's contacts with European manufacturers confirm that most<br />
companies throughout Europe intend to focus on specific market<br />
niches rather than expand across broad market areas. They are in the<br />
process of strategic consolidation and streamlining of their<br />
internal organizations in order to become experts in particular<br />
areas with products focused upon global market needs.<br />
• The European industrial leaders are solidly behind the development<br />
of world standards/ such as MAP. However, Europeans are also intent<br />
upon improving standards that are developed in the United States.<br />
Dataquest estimates that implementation of the MAP standard in<br />
Europe will parallel U.S. efforts.<br />
(This newsletter is reprinted with the permission of Dataquest's<br />
Manufacturing Automation Service.)<br />
ESAM Newsletter © 1987 Dataquest Incorporated August<br />
Jennifer Berg<br />
David C. Penning
m^m Dataquesl<br />
T^^Suj-iA^^'-fT'i^v f<br />
^.-^:H^^^^^V'^%? IlO llKDun^BiadsticctCofpon<br />
'^i^-^^ri-:.<br />
Research Newsletter<br />
INTRCMJOCTION<br />
ESAM Code: Vol. II, Newsletters<br />
1987-6<br />
NIXDOKF COKPDTER AG—REACHING FOR THE WORLD<br />
Nixdorf Computer AG has long been one of the most successful computer<br />
companies in Europe, particularly in its native Germany. However, the<br />
company's success in other important markets in the world, particularly<br />
in the United States, has been less than spectacular. In 1987 we may see<br />
a positive change in the company's worldwide sales picture as management<br />
rededicates itself to the original company goal: to provide standard and<br />
tailored vertical programs for small- and medium-size companies in a<br />
variety of markets.<br />
This newsletter discusses Nixdorf's growth, examines its overall<br />
product line and its position as a vendor of integrated office systems,<br />
and evaluates its marketing strategy in the light of changing end-user<br />
requirements.<br />
COMPANY HISTORY<br />
The rise of Nixdorf Computer AG can be considered a success story by<br />
any standard. The company was founded in Germany in 1952 by Heinz<br />
Nixdorf, and today is represented in more than 44 countries with over 600<br />
branches and service organizations. As shown in Figure 1, revenue has<br />
increased steadily by approximately 20 percent per year to DM 4.51<br />
billion (or $2.1 billion) in 1986. More than 89 percent of this revenue<br />
is from Europe, the rest from international markets (the United States<br />
and Asia). Profits climbed 29 percent in 1986.<br />
@ 1987 Dataquest Incorporated August—Reproduction Prohibited<br />
The contents of this report represent our interpretation and analysis of information generally available to the public or released by responsible individuals in the subject companies but is<br />
not guaranteed as to accuracy or completeness. It does not contain material provided to us in confidence by our clients Individual companies reported on and analyzed by Dataquest<br />
may be clients cf this and/or other Dataquest services. This information is not furnished in connection with a sale or offer to sell securities or in connection with the solicitation of an<br />
cffer to buy securities. This firm and its parent and/or their officers, stockholders, or members of their families may, from time to time, have a long or short position in the securities<br />
mentioned and may sell or buy such securities.<br />
Dataquest Incorporated, 1290 Ridder Park Drive, San Jose, CA 95131-2398, (408) 971-9000, Telex 171973
Revenue (Billions)<br />
5-:<br />
Figure 1<br />
Revenue and Profit—1980 to 1986<br />
Profits (Millions)<br />
240-<br />
210<br />
160<br />
150<br />
120<br />
eo<br />
to<br />
30<br />
t94<br />
1121<br />
*JI^"<br />
i:22<br />
f .;<br />
*• t<br />
P^f&Mli u<br />
1930 19S1 1SB2 1983 ISM tSBS 198S<br />
iwmm i m<br />
1SB0 1S81 1982 1981 1984 1985 198«<br />
Source: Nixdorf Computer AG<br />
But Nixdorf measures its success based upon more than just the bottom<br />
line. The company takes its social responsibility seriously and regards<br />
people and innovative technology as important as an increase in profits.<br />
At press and stockholder meetings, Nixdorf always emphasizes two points:<br />
• The size of its research and development budget, which has<br />
consistently remained at approximately 10 percent of revenue<br />
• The number of additional people that the company employs each<br />
year. In 1986, for example, Nixdorf added 2,300 positions.<br />
This increased worldwide personnel to 25,600 people, with<br />
approximately 17,000 of them working in Germany.<br />
Mr. Nixdorf died prematurely in 1986 at the age of 60. Mr. Klaus<br />
Luft, the Vice Chairman of the Board, assumed the position of Chairman of<br />
the Board, and Mr. Arno Bohn took the position of Vice Chairman. No<br />
other management changes were made. The company continues to be run by<br />
the seven board members, five of whom have been with Nixdorf since 1970.<br />
Foreign Markets<br />
As represented in Figure 2, approximately 52 percent of total revenue<br />
comes from sales within West Germany, 40 percent from the rest of Europe,<br />
and 8 percent from other countries. Excluding Germany, Nixdorf is<br />
represented in 325 cities in 17 countries in Europe. Outside of its<br />
native Germany, Nixdorf has been most successful in England, France, and<br />
Spain. In England, for example, Nixdorf has an 8 percent market share in<br />
the retail industry and an 11 percent market share in the banking<br />
industry. In addition to Europe and the United States, Nixdorf is<br />
represented in 54 cities in 24 countries in South America and Asia.<br />
© 1987 Dataquest Incorporated August ESAM Newsletter
Figure 2<br />
Revenue by Region<br />
Source: Nixdorf Computer AG<br />
In the United States, Nixdorf has established subsidiaries and<br />
service organizations in 110 cities. However, penetrating the U.S.<br />
market has proved to be a formidable task. Although Nixdorf is the<br />
largest non-American computer business in the United States, its market<br />
share after 19 years is 1 percent of midrange computer sales. But<br />
several large orders in 1986 (Montgomery Ward, for example) indicate that<br />
the trend may be reversing now that Nixdorf has switched from a productoriented<br />
to a solution-oriented approach, the strategy to which it owes<br />
its success in Europe.<br />
In its continuing push into international markets, Nixdorf has<br />
established software centers in Holland, Ireland, Japan, the United<br />
States, and Singapore to develop application programs appropriate to<br />
local market requirements. Production facilities have been established<br />
in the United States, Ireland, Spain, and Singapore.<br />
Corporate Objectives<br />
Until his death in 1986, Heinz Nixdorf "was" Nixdorf Computer AG to<br />
the public and one of the most prominent personalities in the European<br />
computer industry. Yet, when he died unexpectedly in Hannover, the<br />
transition to new leadership was untroubled and smooth, largely due to<br />
Mr. Nixdorfs vision and long-range planning. Corporate policies had<br />
always been set by Mr. Nixdorf in conjunction with the board of<br />
directors, and so no changes in corporate strategy were considered<br />
necessary.<br />
ESAM Newsletter<br />
© 1987 Dataquest Incorporated August
This includes Nixdorf's determination to remain independent rather<br />
than merge with another company. Equity capital is now more than 60<br />
percent, and all voting shares remain in the hands of the Nixdorf family.<br />
Nixdorf's' approach to domestic and international business is perhaps<br />
best exemplified by the company's traditional corporate objectives as<br />
outlined in Figure 3. Nixdorf has always emphasized (and has built its<br />
success on) its role as a partner to its customers, its employees, and<br />
its shareholders. In its role as partner, Nixdorf has paid primary<br />
attention to end-user needs and to the necessary innovation in developing<br />
programs for its domestic and international customers.<br />
Corporals Objectives<br />
End-User<br />
Orlantatlon<br />
Figure 3<br />
Corporate Objectives<br />
Partnership with Customers,<br />
Employees, and Shareholders<br />
Innovation<br />
Intvmattonal<br />
Pr««anca<br />
Quality Productivity<br />
Proritafola<br />
Growth<br />
Source: Nixdorf Computer AG<br />
To achieve these objectives, Nixdorf's main strategy has been to<br />
penetrate small- and medium-size companies by providing them with<br />
tailor-made vertical application programs for solving specific problems.<br />
Nixdorf was one of the first to address the needs of vertical markets.<br />
In order to produce the numerous tailored, solution-oriented<br />
applications, the company established its own 3,500-person software<br />
development staff and formed strong alliances with numerous software and<br />
system houses. As a result, approximately 36 percent of Nixdorf's<br />
revenue comes from sales to small- and medium-size companies as outlined<br />
in Figure 4.<br />
© 1987 Dataquest Incorporated August ESAM Newsletter
Strategic Changes<br />
Figure 4<br />
Worldwide Revenue by Custoaer Group<br />
Source: Nixdorf Computer AG<br />
Although Nixdorf's basic tenets have not changed over the years,<br />
there have been several shifts in the company's strategy that should<br />
improve its appeal to multinational companies and international markets.<br />
The first shift is in its attitude toward IBM; the second is its attitude<br />
toward office automation, reflecting the recent shift from standalone<br />
business application solutions to an emphasis on integrated solutions,<br />
which include office applications.<br />
Nixdorf initially believed that it could continue to provide its own<br />
proprietary hardware and tailored software solutions. Over time, Nixdorf<br />
realized that it could be more successful if its products were compatible<br />
with IBM and other vendors from large hosts to personal computers. After<br />
initial hesitation, Nixdorf added IBM-compatible PCs to its product<br />
line. The company's strong support of DISOSS on its primary products<br />
(the 8860, the 8890 and the TARGON Series) is additional proof of this<br />
change in strategy.<br />
ESAM Newsletter © 1987 Dataquest Incorporated August
Initially, Nixdorf also viewed office systems as closed solutions<br />
appropriate for specific departments of an organization. With its<br />
support of the 88BK system, the company paid a high price to recognize<br />
that this approach did not work. Nixdorf now believes that office<br />
applications are needed throughout an organization and that these<br />
products can be cohesive elements tying together the entire<br />
organization. If implemented, this approach should make Nixdorf more<br />
competitive with other integrated office system vendors such as Digital<br />
Equipment, Data General, and Wang.<br />
The shift from standalone, tailored business applications solutions<br />
to a more integrated approach has resulted in what Nixdorf calls the<br />
Computer Integrated Office (CIO) and Computer Integrated Manufacturing<br />
(CIM). CIO consists of three areas: telecommunication, text processing,<br />
and data processing/business applications. The three components can be<br />
found in each Nixdorf product line, and they are developed to maximize<br />
the capabilities of each product family. CIO will be described more<br />
fully later on in this newsletter.<br />
Nixdorf is also a proponent of international standards and continues<br />
to work with organizations such as the X/Open Group (UNIX standards);<br />
CCITT to promote the X.400 electronic mail standards; X.21 and X.25, with<br />
ISO/OSI, ANSI, ECMA, IEEE (Ethernet and Nixdorf Broadband Network) and<br />
others.<br />
THE NIXDORF PRODOCT LINE<br />
A brief overview of the product line may be helpful in providing<br />
perspective to Nixdorf's offerings. With the exception of large hosts,<br />
Nixdorf Computer AG offers an array of hardware and software products for<br />
every type of user and application: small- and mid-range computers,<br />
personal computers, local area networks, videoconferencing systems,<br />
digital PBX systems, image scanners, laser printers, videotex systems,<br />
point-of-sales systems, and automatic cash dispensers. Figure 5 outlines<br />
Nixdorf's products for the office automation environment.<br />
© 1987 Dataquest Incorporated August ESAM Newsletter
Terminals<br />
Figure 5<br />
Pyramid of Products<br />
Source: Nixdorf Computer AG<br />
Nixdorf supports character-oriented data processing (DAP) terminals,<br />
the personal computer, and the Professional Workstation (PWS). Both PCs<br />
and PWS systems function either as standalone workstations or as<br />
intelligent workstations to most Nixdorf systems. Through a set of soft<br />
keys, the unintelligent DAP 4 terminals offer a user interface similar to<br />
the PWS systems.<br />
The Nixdorf 8810 Personal Computer Product Family<br />
Nixdorf models 8810 M 25 and 8810 M 35 IBM compatibles can function<br />
as standalone personal computers or they can be attached to other Nixdorf<br />
products as workstations. All personal computer models support standard<br />
industry software, including the Window Manager from Microsoft and GSX<br />
graphics. The 8810/55 is an AT compatible with specific Nixdorf<br />
enhancements that is likely to function as Nixdorf's primary desktop<br />
publishing system using Page software from Island Graphics.<br />
ESAM Newsletter © 1987 Dataquest Incorporated August
Professional Workstation (PWS)<br />
The PWS is Nixdorf's primary strategic office workstation. It is a<br />
high-resolution (820 x 615 pixels), multifunction workstation with<br />
programmable soft keys for use as a videotex terminal, PC, data<br />
processing terminal, teletext system, or intelligent workstation to the<br />
Series 8840, 8850, 8860, 8862, 8864 BNC (Banking Network Computer), 8870,<br />
and 8870 Quattro. Nixdorf markets several, models of the PWS: the PWS WP,<br />
a low-cost, intelligent, but diskless word processing system terminal;<br />
the PWS-D, with diskette; and the PWS-E, the expandable Tower version.<br />
The PWS is modular and supports external and internal communications, as<br />
well as emulation of the 8840, 8850, 8860, 8870, TARGON, and a variety of<br />
host systems from other vendors. It is deeply integrated into each<br />
Nixdorf server system for file transfer and remote file access. It<br />
supports a wide range of peripherals. Its eight windows permit several<br />
applications to run simultaneously, for example MS-DOS (2.11 and 3.2) as<br />
well as AT or UNIX software. The PWS can be connected directly, or<br />
through the PABX 8818, Ethernet, or the Nixdorf Broadband Network (NBN).<br />
The Nixdorf 8840<br />
Nixdorf's traditional standalone (8840/3) or shared logic (8840/5 to<br />
8840/45) word processing system is expandable to 512K of main memory and<br />
264Mb storage capacity) and supports up to 14 workstations (including<br />
personal computers and PWS systems) and 8 printers. The 8840 is designed<br />
to handle the integration of text (unstructured) and data (structured) as<br />
well as paragraph assembly. The 8840 text software includes mathematical<br />
capabilities, teletext capabilities, and communication to a variety of<br />
hosts.<br />
Nixdorf has expanded the capabilities of the traditional 8840 text<br />
system by providing numerous communication capabilities as outlined in<br />
Figure 6. This includes access to the vertical business application<br />
capabilities of the larger 8860, 8870, and 8870 Quattro systems. It is<br />
also possible for 8840 users to integrate information from the 8870<br />
proprietary data base into the 8840 text program. Editable document<br />
exchange is already available between the 8840 and the 8860 text<br />
program. Document conversion with the 8870 and the 8870 Quattro text<br />
software is planned for 1987.<br />
S © 1987 Dataquest Incorporated August ESAM Newsletter
The Nixdorf 8850<br />
Figure 6<br />
Communication Capabilities of the Nixdorf 8840<br />
ISM<br />
Hon. Bun<br />
NCAQ Mtx<br />
W«ng<br />
«i<br />
T»l*x Comp<br />
CAE<br />
FotOMtZ<br />
Compugrafk TECOM<br />
Unotyp*<br />
Bcrthold<br />
AMV<br />
BS7Q<br />
teSO 3TM<br />
•ino'<br />
Men III<br />
IBM<br />
Source: Nixdorf Computer AG<br />
The 8850 is a 16-bit decentralized data acquisition and distributed<br />
data processing system that is sold primarily to commercial markets. It<br />
supports the operating system DIDOS (Distributed Data Processing<br />
Operating System), up to 32 workstations including PCs, and a<br />
workstation for the blind. The 8850 supports teletext and DETAS<br />
(Decentralized Textverarbeitung am Sachplatz), a simple text processing<br />
program that merges structured data with addresses and text for mass<br />
mailings. The 8850 is able to transfer data and files to the traditional<br />
8840 text system for integration into the more complex text editing<br />
programs.<br />
The Nixdorf 8860<br />
The 8860 with Models 60 (industry and public administration), 62<br />
(hotels and wholesale organizations), and 64 BNC (banking systems) is one<br />
of Nixdorf's most important and successful products. In the past it was<br />
used primarily for distributed data processing applications such as order<br />
processing, inventory control, time recording, and recording of<br />
production data, and competed with the old IBM 8100. In contrast to the<br />
8870 with its many standard applications, the 8860 fits into environments<br />
where tailored systems are needed or where the user develops vertical<br />
software.<br />
ESAM Newsletter © 1987 Dataquest Incorporated August
with the addition of NIOS-TOP at the end of 1986, the 8860 has moved<br />
into the office environment and competes against IBM's low-end S/370<br />
line. More than 40,000 processors have been installed: 30,000 in main<br />
offices and ' branches of financial institutions (8864 BNC) and 10,000<br />
(Models 60 and 62) in factories or large organizations as a centralized<br />
and distributed information processing system, and more recently, also<br />
with terminals for business and office applications. In West Germany,<br />
the 8864 is the market share leader in financial institutions.<br />
The 16-bit 8860 with a Nixdorf proprietary operating system consists<br />
of modular hardware that provides a user with upgradable systems from<br />
standalone micros to MCS, the Multi-Computer System 886X with up to 100<br />
terminals.<br />
The 8860 Mrilti-Computer SystcM<br />
The MCS was introduced in January 1987 as the most powerful version<br />
of the 8860 family. An MCS consists of up to eight autonomous processors<br />
coupled with an extremely fast MCS-Bus. Each processor has its own<br />
operating system and a copy of the application programs, and each MCS can<br />
function as either application or file server. Several Multi-Computer<br />
Systems 8860 can be clustered using Ethernet as a local area network.<br />
All 8860 software is compatible with the new family.<br />
The application and file server concept of the MCS system provides<br />
8860 users with unlimited growth, and positions Nixdorf to compete<br />
directly in the market for major accounts, particularly in the office<br />
environment.<br />
The most versatile workstation for the 8860 in an office environment<br />
is the Professional Workstation (PWS). Because of its multifunction and<br />
windowing capabilities, the PWS can support 8860 emulation in one window,<br />
MS-DOS or UNIX software in another, and the NIOS text program (loaded<br />
from the 8860) in yet another.<br />
In the office environment, the 8860 supports NIOS-TOP, the Nixdorf<br />
Integrated Office Software. NIOS-TOP Word is similar to Quadratron's<br />
Q-Office software, and consists of text processing software (including<br />
the integration of data processing information), communication<br />
(electronic mail, teletext, videotex, and telex), information (calendar,<br />
directory, calculator), and document management (filing, retrieval).<br />
NIOS-TOP also supports SNA, NCN (Nixdorf Communication Network, and<br />
Ethernet, as well as DISOSS DCA/DIA.<br />
10 © 1987 Dataquest Incorporated August ESAM Newsletter
The Nixdorf 8870<br />
The 8870 product family is more than 10 years old and has an<br />
installed ba"se of more than 50,000 units worldwide. It and the 8860<br />
family are considered by Nixdorf as its "bread and butter" products. The<br />
system is primarily sold with standard application programs into small<br />
and medium-size organizations as well as into branch offices of large<br />
companies.<br />
The Nixdorf 8870 Quattro<br />
The 8870 Quattro family was introduced in early 1987 and offers twice<br />
the performance of the 8870 while retaining software compatibility with<br />
all 8870 programs. The increased power of the 8870 Quattro is due to the<br />
new operating system NIROS 7.0 and its parallel processor architecture<br />
with a maximum of four processors. Approximately 50 programs can be run<br />
at the same time.<br />
The Micro 7 is the smallest model with two workstations; the high-end<br />
Quattro/75 supports up to 30 workstations and 15 printers.<br />
Both the 8870 and the 8870 Quattro support hundreds of standard<br />
software programs (bookkeeping, accounting, and so forth) for specific<br />
markets under the generic name COMET. As part of Nixdorf's Computer<br />
Integrated Office (CIO) approach, the company developed COMET TOP Word,<br />
which consists of word processing, filing, archiving, and document<br />
creation, as well as COMET data base, telebox, teletext and videotex.<br />
COMET TOP Word and COMET Calc can be accessed from all other COMET<br />
vertical applications such as bookkeeping, inventory, and so on.<br />
The 8870 and the 8870 Quattro can be networked through the 8818,<br />
Nixdorf's digital PABX. Personal computers can be attached through COMET<br />
PC-LINK and can support file transfer of business applications<br />
information into personal computer programs such as Open Access or<br />
Symphony.<br />
The Nixdorf 8890 Product Faaily<br />
This Nixdorf product competes directly with the IBM 9370 announced in<br />
1986. The Series 8890 (models 32, 13, 18, 23, and 28) is Nixdorf's<br />
largest system and ranges from 0.25 mips to 2.8 mips. Together with the<br />
8870 and the 8870 Quattro, it offers a complete modular range, from<br />
standalone systems up to the 64-workstation model of the 8890 under<br />
VM-Basic. Nixdorf's own PCs, as well as other IBM-compatible PCs, can be<br />
attached as intelligent workstations through Ethernet and either in-house<br />
or telecommunication lines.<br />
ESAM Newsletter © 1987 Dataquest Incorporated August 11
In addition to business application software specific to the 8890,<br />
the system supports 8870 and 8870 Quattro compatible COMET TOP commercial<br />
software. For the office environment, the 8890 supports COMET TOP Word<br />
text processing, electronic mail, resource scheduling (meeting rooms,<br />
meeting times, etc.), and meeting facility (videoconferencing). Nixdorf<br />
also provides its own relational data base. Reflex.<br />
Reflex is compatible with IBM's Structured Query Language (SQL), a<br />
standard set by IBM for its data base products. SQL is portable,<br />
independent of application environments, and exchangable. For Nixdorf<br />
customers, this means that programs developed under SQL are supported by<br />
Reflex. At present. Reflex is available on the 8860, the 8890, and the<br />
TARGON systems under Nixdorf's own operating system DIPOS, as well as<br />
DOS, VM, and UNIX. Nixdorf is developing Reflex versions for IBM (MVS)<br />
and Digital (VMS).<br />
The 8890 systems support IBM's S/370 Office as well as a DISOSS<br />
gateway for final-form and revisable-form document exchange.<br />
The Nixdorf TARGON Product Family<br />
Nixdorf has long been a supporter of UNIX V as the standard UNIX<br />
implementation. TARGON supports UNIX V, and Nixdorf regards this system<br />
as a strategic product, particularly in the public sector. Nixdorf<br />
recently received the largest order in its history for more than DM 300<br />
million ($150 million) in TARGON systems from the Bundesanstalt fuer<br />
Arbeit (Federal Unemployment Agency). This organization uses Reflex as a<br />
distributed data base for its unemployment records and TARGON-Office with<br />
teletext and word processing.<br />
The TARGON systems consist of a standalone, the PWS-X (Figure 7) with<br />
graphics capabilities, the TARGON/31 M 10 30/50 based on the 86020<br />
processor (8 to 32 users), the TARGON/35 RISC system Models 30 and 50<br />
with 12 mips (32 to 200 users), and the fault-tolerant TARGON/32 (16 to<br />
250 users). PCs and the versatile PWS systems function as workstations<br />
to the TARGON system.<br />
12 © 1987 Dataquest Incorporated August ESAM Newsletter
Figure 7<br />
PHOTO OF PWS-X<br />
Source: Nixdorf Computer AG<br />
In addition to numerous business applications, TARGON supports TARGON<br />
Office software. TARGON Office is the Q-Office program from Quadratron,<br />
but it has been enhanced by Nixdorf with soft keys and includes<br />
integration of graphics and image. TARGON Office consists of text<br />
processing (word processing, text/business applications), notebook,<br />
calendar, telephone directory, electronic mail, data base, and<br />
calculator. TARGON Calc will be released in 1987. In addition,<br />
Nixdorf's TARGON Office supports X.400-Mail, the relational data base<br />
Oracle, SQL, and Nixdorf's own data base Reflex in a UNIX coprocessor<br />
TARGON Office also permits access to hosts and networks.<br />
The Nixdorf 8818 PBX<br />
In 1982, Nixdorf launched Germany's first digital PABX, the 8818, a<br />
vitally important module in the company's integrated office strategy.<br />
According to Nixdorf, the PABX is already being marketed in eleven<br />
countries and more than 3000 systems (30 to 3000 users) have been<br />
shipped. The 8818 can be integrated into data processing systems to<br />
support applications relating to factory data capture (building security,<br />
energy management, time recording), charge recording, and wholesale<br />
applications. The 8818 also transmits data, text, voice, and graphics<br />
within office applications, and will be connected to all Nixdorf<br />
products.<br />
All Nixdorf terminals can be attached to the 8818, including the BTOl<br />
videotex terminals and the Digifon, a digital telephone used for data<br />
switching and telephony. The 8818 permits switching of data from the<br />
PC/PWS to personal computers and to midrange computers, as well as from<br />
terminals with teletext capabilities to midrange computers.<br />
ESAM Newsletter © 1987 Dataquest Incorporated August 13
Voice Box<br />
Nixdorf's Voice Box is a voice store-and-forward system based on<br />
80186 and 80286 Intel microprocessors with the RMX operating system.<br />
Voice messages are integrated into electronic mail and appear in the<br />
electronic mail directory. Table 1 shows the worldwide installed<br />
processor units of the major Nixdorf systems as of the end of 1986:<br />
Table 1<br />
WORLDinDE INSTAUATimiS OF NIXDORF SYSTEMS<br />
Nixdorf 8840 4,500<br />
Nixdorf 8850 14,500<br />
Nixdorf 8860 40,000<br />
Nixdorf 8870 50,000<br />
Nixdorf 8870 Quattro released 1987<br />
Nixdorf 8890 700<br />
Nixdorf TARGON 500<br />
Nixdorf 8818 PABX 3,000<br />
Source: Nixdorf Computer AG<br />
CIO, THE CX)MPIITKR-INTEGRATED OFFICE<br />
The CIO concept was developed almost two years ago. To Nixdorf, CIO<br />
represents the "informative infrastructure" of an organization, while CIM<br />
represents the "productive infrastructure." The CIO concept encompasses<br />
all of Nixdorf's hardware products and all data, text, and communication<br />
software capabilities, including the digital PBX 8818, Ethernet, and the<br />
Nixdorf Broadband Network (NBN).<br />
With CIO, Nixdorf pledges to combine both hardware and software in a<br />
number of ways to support managers, secretaries, and knowledge workers in<br />
a variety of environments. Through the CIO concept, Nixdorf hopes to<br />
show its existing customers that they are already participating in office<br />
automation. At the same time, Nixdorf wants to assure them that the<br />
investments they have made in Nixdorf products will always be upgradable<br />
to state-of-the-art technology without loss of hardware or stored<br />
information, and without having to perform duplicate work.<br />
Under the CIO concept, Nixdorf intends to integrate its products<br />
according to specific in-house and international standards, perhaps<br />
similar to IBM's System Application Architecture that was announced in<br />
1987. In a statement of direction, Nixdorf has formulated rules for each<br />
of six main areas:<br />
• Communication with the host<br />
Rules: RJE (remote job entry), 3270, 8160, SNA, DISOSS/DIA<br />
14 © 1987 Dataquest Incorporated August ESAM Newsletter
Communication between Nixdorf products<br />
Rules: IHSS in-house communication; remote connection/public<br />
networks; Ethernet for server connections; ISDN for workstation<br />
connections<br />
Rules: Ethernet and ISDN<br />
External postal services:<br />
Data services: dedicated lines and switched networks; Datex L;<br />
Datex P<br />
Information services: telex, videotex, teletext, telefax,<br />
telebox, all according to ISDN standards<br />
Internal postal services:<br />
electronic mail according to X.400 and the CCITT standards<br />
Rules: ISDN standards<br />
Information management: business applications, word processing,<br />
integrated word and business applications, filing and archiving,<br />
personal computing, including voice, image and graphics<br />
Rules: Uniform Information Management (internal Nixdorf<br />
standards for uniform integration and user interface)<br />
Application integration: file transfer, dialog access,<br />
multifunctionality (dp + wp + pc + host access and postal<br />
services)<br />
Rules: Multifunctional solutions using standardized interfaces<br />
Dataquest's View of an Integrated Systan<br />
Dataquest defines an integrated office system as a composite of<br />
computer hardware and integrated software that supports and enhances the<br />
productivity of work groups. The core functions that have evolved over<br />
the years are document management, administrative support, decision<br />
support, end-user computing tools, and gateways to other systems.<br />
Vendors must provide for integration, particularly in the area of<br />
text, data, image, and voice, and must form them into one compound<br />
document. The following capabilities should be available in a tightly<br />
integrated system.<br />
• Move data from one application to another without exiting the<br />
program or using a conversion utility.<br />
• Move data between applications and files without losing the<br />
character of the information (e.g., spreadsheet data inserted<br />
into a word processing document retains its spreadsheet<br />
identity); when data are changed in one application, the same<br />
change is automatically reflected in the second application.<br />
• Store different types of data (such as in compound documents) in<br />
one filing system.<br />
ESAM Newsletter © 1987 Dataquest Incorporated August 15
Jt Present a consistent user interface across all applications.<br />
i Run the same software on all proprietary hardware products.<br />
The Wixdorf View of an Integrated Syste«<br />
Nixdorf holds two views of an integrated system. The first one is<br />
called CIO, the Computer Integrated Office. CIO champions global<br />
integration of data processing, office, and communication applications.<br />
This view includes the addition of office and communication capabilities<br />
(electronic mail, teletex) to application programs in specific vertical<br />
markets, for example, or the addition of those capabilities to already<br />
existing installations. Nixdorf has committed to provide this level of<br />
integration for all of its products, and is able to deliver many of these<br />
capabilities today. For example, many vertical programs access text<br />
processing or electronic mail capabilities, or are able to integrate<br />
structured data from business applications.<br />
The second view of integration is that of information media: text,<br />
voice, graphics, and data. This level of integration provides for the<br />
close integration of individual programs in the classical Dataquest<br />
definition. Since Nixdorf has never committed to develop a pure<br />
integrated office system in the classical sense of Digital's All-in-1 or<br />
Wang Office, it must now work to bring its NIOS and COMET office software<br />
to the level of these systems. For example, in most Nixdorf systems,<br />
spreadsheet information can be integrated into the text program in print<br />
mode, but graphic and image data are still stored separately and<br />
indicated through a pointer.<br />
However, at the same time. Digital, Data General, and Wang have<br />
recognized the need for vertical programs and are working to integrate<br />
their office systems software with vertical applications. But even here<br />
Nixdorf is more application-oriented and provides this level of<br />
integration where its is indicated by customer need and where it provides<br />
an enhancement to the existing system.<br />
DATAQOEST ANALYSIS<br />
Nixdorf in the Office Environ»ent<br />
In order to evaluate its office system approach, Nixdorf insists that<br />
one must always remember that the company is foremost one that sells into<br />
business environments with specifically tailored business applications.<br />
This approach has been the primary reason for Nixdorf's success: the<br />
ability to give small- and medium-size companies the numerous hardware<br />
and software products that solve specific industry-related problems.<br />
16 © 1987 Dataquest Incorporated August ESAM Newsletter
The business orientation continues today. Neither in Europe nor<br />
internationally does Nixdorf market its systems primarily as office<br />
systems. However, in order to compete with companies offering both<br />
business and office applications, Nixdorf has added office systems<br />
software to most of its systems. In addition, Nixdorf continues to<br />
provide its traditional 8840 word processing system in Europe:<br />
• The Series 8860 with NIOS TOP office software<br />
• The Series 8870, 8870 Quattro, and 8890 with COMET TOP office<br />
software<br />
• The TARGON Series with TARGON Office<br />
When viewed simply in an office context (a market in which Nixdorf<br />
traditionally has not competed), several drawbacks are apparent:<br />
• For Nixdorf, office applications have always been an add-on to<br />
business applications. As a result, neither NIOS TOP nor the<br />
COMET TOP components are comparable in their depth of<br />
integration to the integrated solutions offered by Digital, Data<br />
General, Wang, and other competitors.<br />
However, Nixdorf's strength lies in the numerous specific<br />
vertical software programs that the company offers for<br />
particular industries. For example, the 8860 is sold primarily<br />
into the operating areas of financial and insurance industries,<br />
and the office system companies compete primarily in the<br />
administrative departments of these organizations. Although<br />
NIOS TOP office applications are not as feature-rich or as<br />
integrated among themselves as those of its competitors, they<br />
can be accessed from NIOS TOP business applications. European<br />
customers often prefer this level of integration to office<br />
software that is richer in functionality but that lacks<br />
integration into business applications.<br />
• The office software programs vary in their ease of use and<br />
degree of integration, and some product families consist of<br />
incompatible hardware and business applications. This may force<br />
users to choose between a strong business application or a<br />
strong office application.<br />
•: Editable document exchange is possible only from the 8840 to the<br />
8860 and from the 8860 to TARGON. COMET TOP Word is available<br />
on the 8870, 8870 Quattro, and 8890, but there is no bridge to<br />
the other systems. The document exchange between other products<br />
is possible only through teletext.<br />
ESAM Newsletter © 1987 Dataquest Incorporated August 17
• The older DAP 4 terminals support only DETAS, an older text<br />
processing program well integrated into numerous vertical<br />
applications. The newer DAP 4X terminals support COMET TOP<br />
Word, but there is no document conversion from DETAS to Word.<br />
All new installations are sold only with DAP 4X, leaving DETAS<br />
as island applications in specific vertical markets.<br />
However, end-user requirements everywhere have been changing from<br />
specific feature/function orientation to an overall systems approach, and<br />
from general office solutions to specific vertical applications. In a<br />
solution-oriented market, Nixdorf's drawbacks are balanced by an equal<br />
number of advantages:<br />
• By positioning itself as the present and future provider of<br />
integrated information, Nixdorf has its special emphasis on the<br />
integration of business applications, office technology, and<br />
communication of all of its products. This means that Nixdorf<br />
users can expect continued development of integration<br />
capabilities between its major commercial and office software<br />
products.<br />
• Nixdorf provides both a digital PABX and computer systems, and<br />
intends to integrate them with future ISDN orientation.<br />
• Nixdorf already has strong internal and external communication<br />
capabilities and is a strong supporter of international<br />
communication standards. These international communication<br />
standards are outlined in Nixdorf's statement of direction.<br />
#: The company's emphasis on solution-oriented software provides<br />
users with a large number of business programs not easily<br />
matched by other companies.<br />
• Nixdorf's commitment to software compatibility should assure<br />
customers of the longevity of its software programs and company<br />
data.<br />
• The TARGON systems now provide Nixdorf with a product that will<br />
support truly integrated programs. Nixdorf intends to build on<br />
existing programs and to develop an office system that will<br />
compete in the office systems market, for example in<br />
organizations that already use the 8860 for business<br />
applications.<br />
• Nixdorf has announced DISOSS, MAP, and TOP support for the<br />
TARGON systems, as well as SNA host functionality and a new<br />
24-mips TARGON system. This expands the TARGON line even farther<br />
and positions it as one of Nixdorf's major products.<br />
18 © 1987 Dataquest Incorporated August ESAM Newsletter
Nixdorf intends to exploit the strengths of its PWS systems for<br />
all product families and to position it as the workstation of<br />
choice. Nixdorf expects to provide the PWS with the more<br />
powerful 80386 Intel processor to increase speed and<br />
performance.<br />
Inteimational Markets<br />
Europe is Nixdorf's primary market. In Germany and in the rest of<br />
Europe, Nixdorf's products are well established and will continue to be<br />
readily accepted. However, much remains to be done to assure their<br />
international competitiveness, primarily in the office systems market. A<br />
prime factor aiding Nixdorf in its renewed push into international<br />
markets is an increasing emphasis worldwide on vertical applications and<br />
solution-oriented software, rather than on the traditional generalized<br />
office systems approach.<br />
In order to compete in emerging Asian markets, Nixdorf is busy<br />
adapting and translating its COMET TOP vertical software into Japanese,<br />
Chinese, and Korean.<br />
One of the largest international markets for Nixdorf could be the<br />
United States. However, the office world there is dominated by IBM,<br />
Digital, Data General, and Wang; NCR will be a formidable opponent in the<br />
vertical application and cash register market.<br />
Several years ago, Nixdorf attempted to compete in the office market<br />
with its Nixdorf 8840, designed for predominantly German-oriented<br />
integrated text and data applications (for example, merging client<br />
addresses resident in a data base with an offer letter originated in word<br />
processing, and automatically calculating unit prices). The 8840 was not<br />
successful in the United States, and the system was discontinued.<br />
Nixdorf is making another assault on the U.S. marketplace with its<br />
8870, and in particular with its TARGON systems. However, as a pure<br />
office systems vendor, Nixdorf at present cannot compete with available<br />
integrated office systems from Wang, Digital, and others. Although<br />
Nixdorf has rededicated itself to doing what it does best—provide<br />
vertical programs for specific U.S. markets—the company is aware that it<br />
must continue to deepen the integration level of its office software. In<br />
addition, Nixdorf must provide gateways to other vendors and integrate<br />
competitors' office software into Nixdorf's vertical business<br />
applications.<br />
This is no small task, but Nixdorf is in this business for the<br />
duration and realizes that revenue cannot be improved in the short term.<br />
Now that the company has moved from a product to a solution approach in<br />
the United States, first successes are becoming apparent in the banking,<br />
insurance, and retail markets. Nixdorf expects major orders from large<br />
companies in 1987, similar to the $100 million order it received from<br />
Montgomery Ward & Co.<br />
ESAM Newsletter © 1987 Dataquest Incorporated August 19
One of Nixdorf's long-range plans is to bring its ISDN-based<br />
products, the 8818 PBX and its Digifone, into the United States. This<br />
will put .the company not only in direct competition with U.S. vendors of<br />
PBX systems, but also with European companies like Philips and Ericsson<br />
who intend to garner a share of that market. The 8818 PBX is already<br />
sold in Germany, Austria, Belgium, Ireland, Switzerland, Italy, Greece,<br />
Portugal, Japan, China, Hong Kong, and Turkey; telephone systems now<br />
account for 10 percent of all new orders. In this market, Nixdorf also<br />
offers particular vertical applications for hospitals (patient status)<br />
and hotels (automatic wake-up calls). Just recently, Nixdorf supplied the<br />
renovated Queen Elizabeth II with 1500 digital telephones, to be followed<br />
shortly by cash registers connected to the hotel computer 8862 Rio and<br />
the 8818 PBX. Again, Nixdorf competed successfully because of its<br />
vertical hotel application.<br />
Mr. Luft expects revenue to reach DM 9 billion in five years. As<br />
long as Nixdorf retains its market-driven focus (expressed in vertical<br />
applications for specific market niches and excellent customer care)<br />
Dataquest believes that the company will continue to perform as one of<br />
the consistently successful computer companies in Europe and to gain<br />
market share in the United States.<br />
(This newsletter is reprinted with the permission of Dataquest's<br />
Office Systems Industry Service.)<br />
Jennifer Berg<br />
Hilde Uhler<br />
20 © 1987 Dataquest Incorporated August ESAM Newsletter
s^^^s-^f<br />
^^^li^^^^^ DataQuest<br />
acompanytrf<br />
The Dun& Bradstreet Corporation<br />
Research Newsletter<br />
ESAM Code: Vol. II, Newsletters<br />
1987-7<br />
CONVERGENCE AND CONNECTIVITY IN EUROPE: THE RACE HEATS UP<br />
Now that many desktop computing devices in Eiirope have achieved significant<br />
market penetration, the focus is changing to making these devices communicate. It is<br />
widely accepted that desktop devices are more useful when connected than when used as<br />
standalone units.<br />
Dataquest has combined the resources of several of its European industry programs<br />
to focus on the issues of work group computing. This research provides our clients with a<br />
context in which to consider how all these pieces of the information processing puzzle<br />
interrelate. (Appendices A and B define the terminal types and connection technologies<br />
referred to in this analysis.)<br />
Tables 1 through 6 show the estimated installed base of terminals in Europe for<br />
1986, 1987, and 1991, and their connection methods. Tables 1 through 3 show the actual<br />
numbers for each connection method, and Tables 4 through 6 show the percentage of use<br />
of each connection method.<br />
This newsletter has the following objectives:<br />
• To define the installed base of desktop terminals<br />
• To identify the important connection technologies employed and analyze the<br />
trends in types of connection from 1986 to 1991<br />
• To outline the implications for suppliers<br />
© 1987 Dataquest Incorporated October—Reproduction Prohibited<br />
The contents of this report represent our interpretation and analysis of information generally available to the public or released by responsible individuals in the subject corr^>anies but is<br />
not guaranteed as to accuracy or completeness. It does not contain material provided to us in confidence by our clients, bidividual comparues reported on and analyzed by Dataquest<br />
may be clients of this and/or other Dataquest services This information is not furnished in connection with a sale or q^r to sell securities or in connection with the solicitation of an<br />
q^r to buy securities. This firm and its parent and/or their officers, stockholders, or members of their families may. from time to time, have a long or short position in the securities<br />
mentioned and may sell or buy such securities,<br />
Dataquest Incorporated, 1290 Ridder Park Drive, San Jose, CA 95131-2398, (408) 971-9000, Telex 171973
Type of<br />
DesktOD Device<br />
Display Terminal<br />
Word Processor<br />
IVDT<br />
Electronic Typewriter<br />
Personal Computer<br />
CAO/CAM<br />
Telex<br />
Teletez<br />
Facsimile<br />
Videotex<br />
Total<br />
Type of<br />
Desktop Devi«.i.<br />
Display Terminal<br />
Word Processor<br />
IVDT<br />
Electronic Typewriter<br />
Personal Computer<br />
CAD/CAM<br />
Telex<br />
Teletax<br />
Facsimile<br />
Videotex<br />
Total<br />
Table 1<br />
Dataquest Connection Matrix—1986 Estimated Units<br />
(Thousands of Units)<br />
Installed<br />
Base at<br />
Year End<br />
6,630.5<br />
295.3<br />
15.7<br />
140.1<br />
4,325.7<br />
100.4<br />
772.4<br />
41.8<br />
344.1<br />
?>99«.2<br />
15,652.2<br />
L&S<br />
379.3<br />
29.2<br />
0.0<br />
0.0<br />
298.5<br />
10.0<br />
0.0<br />
0.0<br />
0.0<br />
QxA<br />
717.0<br />
EBS<br />
33.2<br />
0.3<br />
11.8<br />
0.0<br />
1.7<br />
0.0<br />
0.0<br />
0.0<br />
0.0<br />
sua<br />
47.0<br />
Table 2<br />
Data<br />
EBX<br />
186.8<br />
7.1<br />
0.0<br />
0.0<br />
110.4<br />
0.0<br />
0.0<br />
0.0<br />
0.0<br />
0.0<br />
304.3<br />
Units Connected Via:<br />
Hard-<br />
Wired Remote<br />
4,918.6<br />
77.1<br />
0.0<br />
0.7<br />
558.0<br />
40.2<br />
0.0<br />
0.0<br />
0.0<br />
149.3<br />
5,743.9<br />
1,112.6<br />
17.4<br />
3.9<br />
2.1<br />
372.0<br />
5.0<br />
772.4<br />
41.8<br />
344.1<br />
2r93«.9<br />
5,508.3<br />
Dataquest Connection Matrix—1987 Estimated Units<br />
(Thousands of Units)<br />
Installed<br />
Base at<br />
Year End<br />
,268.<br />
306,<br />
25,<br />
203,<br />
,000.<br />
179,<br />
811.<br />
73.<br />
658.<br />
*-S71.1<br />
20,098.7<br />
LAM<br />
567.0<br />
36.8<br />
0.0<br />
0 0<br />
534 0<br />
18 0<br />
0 0<br />
0 0<br />
0 0<br />
JUl<br />
94,<br />
2,<br />
19,<br />
0,<br />
36,<br />
0.<br />
0.<br />
0.<br />
0.<br />
JLJI<br />
Data<br />
£BX<br />
225.<br />
8.<br />
0.<br />
0.<br />
155.<br />
0.<br />
0.<br />
0.<br />
0.<br />
JLJl<br />
anita Connected Via;<br />
Hard-<br />
Wired Remote<br />
,753.<br />
83.<br />
0.<br />
1.<br />
978.<br />
71.<br />
0.<br />
0.<br />
0.<br />
_22L.<br />
1,628.1<br />
18.1<br />
6.4<br />
3.1<br />
606.0<br />
9.0<br />
811.1<br />
73.9<br />
658.4<br />
4.342.5<br />
Not<br />
Connected<br />
0.0<br />
164.2<br />
0.0<br />
137.3<br />
2,985.0<br />
45.2<br />
0.0<br />
0.0<br />
0.0<br />
0.0<br />
3.331.8<br />
Total<br />
6,630.5<br />
295.3<br />
15.7<br />
140.1<br />
4,325.7<br />
100.4<br />
772.4<br />
41.8<br />
344.1<br />
2.986.2<br />
15,652.2<br />
Source: Dataquest<br />
October 1987<br />
Not<br />
Connected<br />
0,<br />
157.<br />
0.<br />
199.<br />
,690.<br />
80.<br />
0.<br />
0.<br />
0.<br />
JUi.<br />
1,155.8 152.3 388.8 6,116.4 8,156.6 4,128.9<br />
Total<br />
,268.6<br />
306.8<br />
25.<br />
203.<br />
,000.<br />
179.<br />
811.<br />
73.<br />
658.<br />
4.571.1<br />
20,098.7<br />
Source: Dataquest<br />
October 1987<br />
© 1987 Dataquest Incorporated October ESAM Newsletter
Type of<br />
Deflktoo DevicB<br />
Display Terminal<br />
Nord Processor<br />
IVDI<br />
Electronic Typewriter<br />
Personal Computer<br />
CAD/CAM<br />
Telex<br />
Teletex<br />
Facsimile<br />
Videotex<br />
Total<br />
Type of<br />
DeaktOD Device<br />
Display Terminal<br />
Word Processor<br />
IVDT<br />
Electronic Typewriter<br />
Personal Computer<br />
CAD/CAM<br />
Telex<br />
Teletex<br />
Facsimile<br />
Videotex<br />
Total<br />
Table 3<br />
Dataquest Connection Matrix—1991 Estimated Units<br />
Installed<br />
Base at<br />
Year End<br />
9.667.9<br />
251.7<br />
107.6<br />
655.1<br />
12.814.6<br />
776.1<br />
946.8<br />
376.2<br />
3,073.5<br />
10.752.5<br />
39.422.0<br />
LAH<br />
2,030.3<br />
42.7<br />
0.0<br />
0.0<br />
1,922.2<br />
77.6<br />
0.0<br />
0.0<br />
0.0<br />
0.0<br />
4,062.8<br />
•<br />
PBX<br />
290.0<br />
3.8<br />
80.7<br />
0.0<br />
76.9<br />
0.0<br />
0.0<br />
0.0<br />
0.0<br />
0.0<br />
451.4<br />
Table 4<br />
Data<br />
PBX<br />
290.0<br />
6.2<br />
0.0<br />
0.0<br />
291.8<br />
0.0<br />
0.0<br />
0.0<br />
0.0<br />
0.0<br />
588.0<br />
Units Conne fcted Via:<br />
Hard-<br />
Hicsd Remote<br />
5,259.4<br />
167.9<br />
0.0<br />
3.3<br />
2,703.9<br />
310.4<br />
0.0<br />
0.0<br />
0.0<br />
537. S<br />
8,885.3<br />
1,798.2<br />
20.7<br />
26.9<br />
9.8<br />
1,671.0<br />
38.8<br />
946.8<br />
376.2<br />
3,073.5<br />
UUZIA^<br />
18,284.0<br />
Dataqiffist CcnuKcticm Matrix—1986 Estimated Percentages<br />
•<br />
Installed<br />
Base at<br />
Tear End<br />
6,630.5<br />
295.3<br />
15.7<br />
140.1<br />
4,325.7<br />
100.4<br />
772.4<br />
41.8<br />
344.1<br />
2.986.2<br />
15,652.2<br />
LAH<br />
5.7\<br />
9.9\<br />
0.0\<br />
0.0\<br />
6.9%<br />
10.0\<br />
0.0\<br />
0.0%<br />
0.0%<br />
0.0%<br />
4.6%<br />
PBX<br />
0.5%<br />
0.1%<br />
75.0%<br />
0.0%<br />
0.0%<br />
0.0%<br />
0.0%<br />
0.0%<br />
0.0%<br />
0.0%<br />
0.3%<br />
Percantaue Connert-ml VI •<br />
Data<br />
EB<br />
2.8%<br />
2.4%<br />
0.0%<br />
0.0%<br />
2.6%<br />
0.0%<br />
0.0%<br />
0.0%<br />
0.0%<br />
0.0%<br />
1.9%<br />
Hard-<br />
Wired<br />
74.2%<br />
26.1%<br />
0.0%<br />
0.5%<br />
12.9%<br />
40.0%<br />
0.0%<br />
0.0%<br />
0.0%<br />
5.0%<br />
36.7%<br />
gemote<br />
16.8%<br />
5.9%<br />
25.0%<br />
1.5%<br />
8.6%<br />
5.0%<br />
100.0%<br />
100.0%<br />
100.0%<br />
95.0%<br />
35.2%<br />
ESAM Newsletter © 1987 Dataquest Incorporated October<br />
Not<br />
Connected<br />
0.0<br />
10.4<br />
0.0<br />
642.0<br />
6,148.8<br />
349.2<br />
0.0<br />
0.0<br />
0.0<br />
0.0<br />
7,150.5<br />
Total<br />
9,667.9<br />
251.7<br />
107.6<br />
655.1<br />
12,814.6<br />
776.1<br />
946.8<br />
376.2<br />
3.073.5<br />
10.752.5<br />
39,422.0<br />
Source: Dataquest<br />
October 1987<br />
Hot<br />
CffBBgtti?^<br />
0.0%<br />
55.6%<br />
0.0%<br />
98.0%<br />
69.0%<br />
45.0%<br />
0.0%<br />
0.0%<br />
0.0%<br />
0.0%<br />
21.3%<br />
Total<br />
100.0%<br />
100.0%<br />
100.0%<br />
100.0%<br />
100.0%<br />
100.0%<br />
100.0%<br />
100.0%<br />
100.0%<br />
100.0%<br />
100.0%<br />
Source: Dataquest<br />
October 1987
Type of<br />
Desktop Device<br />
Display Teminal<br />
Vford Processor<br />
IVDT<br />
Electronic Typewriter<br />
Personal Computer<br />
CAD/CAM<br />
Telex<br />
Telates<br />
Facsimile<br />
Videotex<br />
Total<br />
Type of<br />
Desktop Device<br />
Display Terminal<br />
Word Processor<br />
IVDT<br />
Electronic Typewriter<br />
Personal Computer<br />
CAD/CAM<br />
Telex<br />
Teletex<br />
Facsimile<br />
Videotex<br />
Total<br />
Table 5<br />
Dataquest Connection Matrix—1987 Estimated Percentages<br />
Installed<br />
Base at<br />
Year EB4<br />
7.268.7<br />
306.8<br />
25.4<br />
203.4<br />
6,000.2<br />
179.8<br />
811.1<br />
73.9<br />
658.4<br />
4.$71.1<br />
20.098.8<br />
LAN<br />
7.8\<br />
12.0\<br />
0.0\<br />
0.0\<br />
8.9\<br />
10.0\<br />
0.0\<br />
0.0\<br />
0.0\<br />
0.0\<br />
5.8\<br />
PB3C<br />
1.3%<br />
0.9%<br />
75.0%<br />
0.0%<br />
0.6%<br />
0.0%<br />
0.0%<br />
0.0%<br />
0.0%<br />
0.0%<br />
0.8%<br />
Table 6<br />
Data<br />
PB3C<br />
Percentaote Connected Via<br />
3.1%<br />
2.6%<br />
0.0%<br />
0.0%<br />
2.6%<br />
0.0%<br />
0.0%<br />
0.0%<br />
0.0%<br />
0.0%<br />
1.9%<br />
Bard-<br />
Hired<br />
65.4%<br />
27.1%<br />
0.0%<br />
0.5%<br />
16.3%<br />
40.0%<br />
0.0%<br />
0.0%<br />
0.0%<br />
5.0%<br />
30.4%<br />
Remote<br />
22.4%<br />
5.9%<br />
25.0%<br />
1.5%<br />
10.1%<br />
5.0%<br />
100.0%<br />
100.0%<br />
100.0%<br />
95.0%<br />
40.6%<br />
Hot<br />
Cpnnectad<br />
Dataquest Connection Matrix—1991 Estimated Percentages<br />
Installed<br />
Base at<br />
Year End<br />
9.668.<br />
251.<br />
107.<br />
655.<br />
12,814.<br />
776.<br />
946.<br />
376.<br />
3,073.<br />
10.752.5<br />
39,422.1<br />
LAH<br />
21.0%<br />
17.0%<br />
0%<br />
0%<br />
15.0%<br />
10.0%<br />
0%<br />
0%<br />
0%<br />
0.0%<br />
10.3%<br />
ESSt<br />
3.0%<br />
1.5%<br />
75.0%<br />
0.0%<br />
0.6%<br />
0.0%<br />
0.0%<br />
0.0%<br />
0.0%<br />
0.0%<br />
Data<br />
PBX<br />
Pgrcentaoe Connected Via<br />
0%<br />
5%<br />
0%<br />
0%<br />
3%<br />
0%<br />
0%<br />
0%<br />
0%<br />
0%<br />
1.1% 1.5%<br />
Hard-<br />
Wlred<br />
54.4%<br />
66.7%<br />
,0%<br />
,5%<br />
21.1%<br />
40.0%<br />
0%<br />
0%<br />
0%<br />
5.0%<br />
22.5%<br />
gemote<br />
18.6%<br />
8.2%<br />
25.0%<br />
1.5%<br />
13.0%<br />
5.0%<br />
100.0%<br />
100.0%<br />
100.0%<br />
95.0%<br />
46.4%<br />
0.0%<br />
51.5%<br />
0.0%<br />
98.0%<br />
61.5%<br />
45.0%<br />
0.0%<br />
0.0%<br />
0.0%<br />
0.0%<br />
20.5%<br />
Ifital<br />
100.0%<br />
100.0%<br />
100.0%<br />
100.0%<br />
100.0%<br />
100.0%<br />
100.0%<br />
100.0%<br />
100.0%<br />
100.0%<br />
100.0%<br />
Source: Dataquest<br />
October 1987<br />
Not<br />
Connected<br />
0%<br />
1%<br />
0%<br />
98.0%<br />
48.0%<br />
45.0%<br />
0.0%<br />
0%<br />
0%<br />
0%<br />
18.1%<br />
Total<br />
100.0%<br />
100.0%<br />
100.0%<br />
100.0%<br />
100.0%<br />
100.0%<br />
100.0%<br />
100.0%<br />
100.0%<br />
100.0%<br />
100.0%<br />
Source: Dataquest<br />
October 1987<br />
© 1987 Dataquest Incorporated October ESAM Newsletter
INSTALLED BASE OF DESKTOP TERMINALS<br />
Figures 1 and 2 show the estimated installed base of terminals for 1986 and 1991 in<br />
Europe. The trends are reviewed below:<br />
• While the number of terminals is growing at a 26.1 percent compound annual<br />
growth rate (CAGR), the number of potential desks is estimated to grow at<br />
only a 3 percent CAGR. Suppliers will have to fight hard for greater<br />
penetration into the existing installed base of desktops.<br />
• The replacement market is expected to be low because many users do not<br />
discard desktop devices. They simply pass them on to someone else.<br />
• Many suppliers are e3q)ected to move toward offering desktop systems (for<br />
example, 3Com, which offers LAN connections as well as terminals). Digital<br />
Equipment and IBM have been doing this for some years already.<br />
Personal Computers and Di^lay Terminals<br />
• The wide availability of personal computers (PCs) at prices similar to display<br />
terminals will obviously have an impact on the sale of display terminals. The<br />
installed base of PCs will have overtaken that of display terminals by the end<br />
of 1988.<br />
• The launch of IBM's PS/2 range of PCs will lead to a further decline in the<br />
price of PCs. Also, the differences between applications supported by PCs and<br />
display terminals is fast eroding. The success of PC plug-in terminal<br />
emulation boards such as the IRMA board from DCA is leading this trend.<br />
Integrated Voice/Data Terminals<br />
• Dataquest expects the integrated voice/data terminal (IVDT) to have a limited<br />
penetration in the European market. These products are often not standards<br />
sold as compatible and sold as part of PBX. The Siemens Hicom PBX with its<br />
proprietary IVDT is a typical example.<br />
• IVDTs are generally relatively expensive and, being proprietary, are a less<br />
flexible solution. Since IVDTs are rarely compatible with PCs, they<br />
consequently are limited in the number of application programs they can run.<br />
ESAM Newsletter © 1987 Dataquest Incorporated October
PC 27.8%<br />
Videotex 27.3%<br />
Figure 1<br />
European Desktop Terminal<br />
P(^iilation—1986 Estimate<br />
Display Terminal 42.4%<br />
Figure 2<br />
Videotex 19.1«<br />
Word Processor 1.9%<br />
Others 1.9%<br />
Facsimile 2.2%<br />
Telex 4.9%<br />
£urc^)ean Desktc^ Terminal<br />
Population:—1991 Estimate<br />
Display Terminal 24.5%<br />
Source: Dataquest<br />
October 1987<br />
^niTTTTTTTrmTfrrs. PC 32.5%<br />
Telex 2.4%<br />
Others 5.5%<br />
Facsimile 7.8%<br />
Source: Dataquest<br />
October 19S7<br />
© 1987 Dataquest Incorporated October ESAM Newsletter
Word Processors<br />
Shipments of standalone word processors will quickly decline. Dedicated<br />
minicomputer-based word processor systems are experiencing little growth. Dataquest<br />
expects these products to be overtaken by "office systems" that, in addition to text<br />
processing, will encompass various levels of voice, data, and graphics integration.<br />
The differences between applications supported by PCs and traditional word<br />
processors, like those between word processors and display terminals, are also eroding.<br />
CONNECTION TECHNOLOGIES<br />
This section describes how the installed base of terminals connects. Figure 3 shows<br />
the spread of connection technologies for all terminals. The trend is clearly toward<br />
greater connectivity, using more than one of the connection methods in Table 1.<br />
A standalone PC today may be connected to a local area network (LAN) soon, which<br />
will extend to a remote gateway (e.g., a modem) through a wide area network, an<br />
international link, and then to another LAN across the world. In consequence, the<br />
percentage of standalone terminals will drop to 18.1 percent of terminals in use by 1991.<br />
The main beneficiaries will be LANs and remote connection technologies. Data PBX,<br />
voice/data PBX, and hard-wired connections will not make significant gains. Figures 4,<br />
5, and 6 show the spread of connection technologies for PCs, dumb terminals, and word<br />
processors in 1986, 1987, and 1991.<br />
LAN<br />
We believe that connections via LANs will show a tremendous growth rate, from<br />
4.6 percent of all connections in 1986 to 10.3 percent by 1991.<br />
Apart from the resource sharing offered by LANs (e.g., storage or printer sharing),<br />
one of their key benefits to large organizations is that they provide a flexible cabling<br />
solution. When users move around on a LAN, it is simple to unplug a terminal from the<br />
network and insert it elsewhere. With a hard-wired connection, such moves require<br />
recabling, which is both disruptive and expensive.<br />
LAN connections to PCs and dumb terminals are expected to show significant<br />
growth. This will limit the growth of hard-wired and data PBX connections.<br />
ESAM Newsletter © 1987 Dataquest Incorporated October
Percentage of connections<br />
60%<br />
Figures<br />
European Terminal Connection Trends<br />
(All Terminals)<br />
1986<br />
N/C not oomwoted<br />
aher ^Z LAN<br />
Percentage of connections<br />
80%<br />
60%<br />
40%<br />
;?o%<br />
N/C * not oonnooled<br />
1987 1991<br />
M/C EZ2 Hard Wired ^3 Remote<br />
Figure 4<br />
Euroepan Terminal Connection Trends<br />
(Personal Computers)<br />
" " ^ ^ • ^<br />
S^N"-^"^<br />
MS<br />
pv/^V-.<br />
^xlJL^^x^-<br />
1966 1987 1991<br />
Source: Dataquest<br />
October 1987<br />
Other EZl LAN SS Remote E2Z Hard Wired S3 N/C<br />
Source: Dataquest<br />
Ociobur 19S7<br />
© 1987 Dataquest Incorporated October ESAM Newsletter
:oo«<br />
80%<br />
60% -<br />
40%<br />
20%<br />
Figures<br />
European Terminal Connection Tremls<br />
(Display Terminals)<br />
Percentage of connections<br />
1986<br />
Other 23 LAM<br />
Figure 6<br />
1987 1801<br />
Remote E23 Hard Wired<br />
European Terminal Connecti(»i Treiuis<br />
(Word ProcKsors)<br />
Percentage of connections<br />
70% r<br />
N/C • not<br />
1986 1987 1991<br />
Source: Dataquest<br />
October 19S7<br />
Other EIEI23 Remote EiB LAN E223 Hard Wired ^3 N/C<br />
ESAM Newsletter © 1987 Dataquest Incorporated October<br />
Source: Dataquejt<br />
October 1987
PBX<br />
PBXs will continue to be the main connection means for FAX, teletex, and videotex<br />
in 1991. Dataquest expects, though, that PBX or voice/data PBX solutions in Europe will<br />
show limited growth in data connections for the following reasons:<br />
• The relatively high cost of connecting a terminal to a digital PBX compared to<br />
a data PBX<br />
• The low data throughput (up to 64 Kbits per second for local connections on<br />
current products) compared to 1 Mbit per second for even a low-speed LAN<br />
• Their low functionality (file handling and printer sharing facilities like<br />
PC LANs) for resource sharing compared to that of LANs<br />
• The slow acceptance by data processing managers of traditional<br />
communications solutions to data communications connectivity<br />
However, wide area gateways from LANs through a PBX represents a potential<br />
growth area.<br />
Data PBX<br />
Data PBX connections are expected to decline in importance for the following<br />
reasons:<br />
• Users are migrating to LANs to achieve higher throughput speeds.<br />
• The size and cost of low-end data PBXs precludes their use in new small<br />
networks, where LANs provide a cheap entry solution for as few as three<br />
users. These systems then grow into large LAN-based networks.<br />
• Although data PBXs are very economic solutions for asynchronous connections<br />
when compared to LANs, users are more inclined toward LANs, which are seen<br />
to be the vogue in networking. (A typical cost per connection for a data PBX<br />
is $185, as opposed to $640 for a LAN.)<br />
• The data PBX market has never gained any large momentum in Europe.<br />
Hardr-Wired<br />
The hard-wired connections segment represents direct connections from data<br />
terminal equipment to multiuser minicomputers or mainframes. The high cost of<br />
reconfiguring a hard-wired network is leading customers to opt for more flexible<br />
solutions such as LANs, especially in new installations. The need to switch between<br />
resoiirces (mainframes, etc.) in the hard-wired environment requires costly equipment<br />
compared to LANs.<br />
10 © 1987 Dataquest Incorporated October ESAM Newsletter
Dataquest expects that by 1991, the large installed base of hard-wired connections<br />
will decline overall, from 36.7 percent to 22.5 percent of connections. The percentage<br />
of PC hard-wired connections will grow, however, from 12.9 percent to 21.1 percent.<br />
This represents the rapid growth of PC-to-mainframe connectivity by users who are not<br />
ready to use LANs.<br />
Remote<br />
A key growth trend will be in PC remote links; the PC is quickly becoming the focus<br />
for office systems technology. A significant growth area in remote lines will be X.25,<br />
while X.21 and modem links will also increase in percentage terms. The penetration of<br />
the X.400 standard for electronic mail will add to the growth in remote connections over<br />
the next three to five years.<br />
ISDN<br />
The connection technologies discussed so far raise important issues about the role of<br />
ISDN in local communications. The IEEE 802.9 standard for LANs could provide for<br />
2-Mbit per second connections to the desktop on unshielded, twisted-pair cables. This<br />
could support voice/text and image on a distributed system. If IEEE 802.9 becomes a<br />
significant standard, the relative merits of ISDN connectivity will be reduced. While the<br />
merits of ISDN are being debated, LAN technology is making significant advances.<br />
IMPUCATIONS FOR SUPPLIERS<br />
Dataquest expects to see the following trends in supplier strategies:<br />
• A conscious effort to understand previously imfamiliar markets, for example,<br />
communications suppliers moving into the computing area and vice versa.<br />
Digital Equipment in the United States recently made public its plans for wide<br />
area networking. This surprising move foreshadows the rapid changes to come<br />
in the connectivity race.<br />
• An increase in joint ventures, mergers, and takeovers. Suppliers are finding<br />
this to be an attractive way of entering new markets and catching up with<br />
technology.<br />
• More suppliers offering integrated communications hardware and office<br />
applications software as systems solutions. Although this is currently achieved<br />
by dealers, we expect to see suppliers use it as a product differentiation<br />
strategy.<br />
• A prominence of vertical market offerings. More and more suppliers are<br />
beginning to identify specific segments like retailing rather than simply selling<br />
into general markets.<br />
ESAM Newsletter © 1987 Dataquest Incorporated October 11
• Higher functionality and new features being offered on existing products In an<br />
effort to achieve product differentiation. What was once a plain old telephone<br />
can now be bought with IVDT functions (the Qwerty phone from British<br />
Telecom is an example).<br />
• A plethora of new products, especially in the PC plug-in board market, like<br />
plug-in fax, telex, or voice store-and-forward cards. The recent launch of the<br />
Orator (voice/data card) from Lion Systems in the United Kingdom is an<br />
example of this rapid evolution.<br />
• A significant price erosion across markets. Suppliers will fight to penetrate an<br />
installed base of desktops that is showing little growth.<br />
DATAQUEST CONCLUSIONS<br />
Dataquest expects the trends described in this newsletter to result in suppliers<br />
fighting for market share in Europe, not only with their traditional competitors, but also<br />
with organizations from previously separate areas. Hence computer, telecom, data<br />
communications, and LAN suppliers will be in competition with each other for the same<br />
business. The market will be characterized by numerous offerings from suppliers of<br />
incompatible desktop solutions. In these conditions, suppliers with standards-compatible,<br />
user-friendly, systems-based products will have an advantage.<br />
Rapid changes in technology and sharp price competition will mean that market<br />
share will be more expensive to achieve and brand loyalty will be difficult to maintain,<br />
Dataquest believes that, despite the steady growth in the European data communications<br />
market, many suppliers will find themselves working very hard to maintain profitability<br />
in an increasingly fierce environment.<br />
This newsletter shows that, after many years of talk about the convergence of<br />
computing and communications, and the integration of voice and data, these areas are<br />
finally beginning to merge, albeit at the transmission level at the moment. Integrated<br />
voice/data products or applications on the desktop have yet to succeed.<br />
(This document is reprinted with the permission of Dataquest's European<br />
Telecommunications Industry Service.)<br />
Jennifer Berg<br />
Michael D'Souza<br />
12 © 1987 Dataquest Incorporated October ESAM Newsletter
Appendix A<br />
DEFINITIONS OF<br />
KEYBOARD INFORMATION DEVICES<br />
Display terminals are desktop electronic devices that are dependent upon a data<br />
communications link to a computer system. They have the following characteristics:<br />
• They provide an interface between a human operator and a computer system<br />
or a communications network.<br />
• They deliver a visual presentation of incoming data to the operator.<br />
• They allow the operator to enter or modify information in the computer<br />
system via a keyboard, media reader, or other local device.<br />
Personal computers (PCs) are computer systems that have the following characteristics:<br />
• They are human-orientated, meaning they are intended to meet individual<br />
business, professional, educational, and personal data processing needs, and<br />
they do not generally act as instrument controllers or automation devices.<br />
• They are single-user-orientated, meaning that, although communications may<br />
be involved, the systems are intended for the data processing needs of<br />
individuals and involve only one interactive device. PCs can generally be<br />
purchased, operated, and used by an individual rather than by an organization.<br />
• They have full alphanumeric keyboards, which distinguishes them from<br />
programmable calculators, video games, and dedicated special-function<br />
computers.<br />
• They have local programming capabilities using high-level programming<br />
languages, with most personal computers supporting BASIC, or a derivative of<br />
it. Other languages such as Pascal, FORT AN, and COBOL are also available<br />
on personal computers.<br />
• They have a resident operating system in ROM or magnetic media. This<br />
distinguishes PCs from terminals.<br />
• They are able to run general-purpose applications. This distinguishes PCs<br />
from systems that are dedicated through permanent hardware or firmware<br />
adaptation to functions such as word processing and financial analysis.<br />
• For this study, PCs used in hobby or educational environments are not<br />
included. PCs that have integrated voice capability are also not included.<br />
A-1
Integrated voice/data workstation (WDT) products are desktop or board-level devices<br />
that integrate the functionality of a telephone and a terminal. This integrated<br />
functionality includes, at a minimum, simultaneous voice and data transmission. These<br />
devices are not double-counted in the display terminal or personal computer categories.<br />
Word processors are workstations that are designed for entering, manipulation, filing,<br />
and printing text documents only. Workstations are defined as computer-based products<br />
that perform specifically defined fvmctions as an aid to a user in completing a<br />
specifically defined task or series of tasks.<br />
Full-size electronic typewriters are letter-quality printing devices that can be activated<br />
by depressing the keys of an electronically (iiven keyboard (flat or movable keys). This<br />
action causes type characters to be selected for printing by solid-state electronic logic<br />
and circuitry. These are desktop devices; this definition does not include portable or<br />
compact electronic typewriters. Nor does it include half-screen electronic typewriters.<br />
A-2
Appendix B<br />
CONNECTION TECHNOLOGIES<br />
Generally speaking, a connection is defined as what the device is directly connected to,<br />
not what the device ultimately communicates with. Therefore, any device that has both<br />
a remote connection and another type of connection is counted under the other type of<br />
connection. Further, if a device has two types of connections, neither of which is<br />
remote, the most heavily used type is counted.<br />
Private branch exchanges fPBXs) are customer premises telephone-switching systems<br />
that, by the dialing of an access code, permit telephones to interface to the public<br />
telephone central exchange of office. A PBX includes desktop end-user terminals,<br />
attendant consoles, switching cabinets, and interconnections between switching<br />
cabinets. An integrated voice/data PBX can switch both voice and data through the<br />
same equipment.<br />
Local area network (LAN^ Connections are combinations of hardware and software that<br />
enable connection of a device to a cable-based network system that serves a building or<br />
campus environment. Excluded are connections that are point-to-point, through PBXs or<br />
through data PBXs or data-over-voice products.<br />
Data PBXs are digital electronic switches that allow terminals to switch and contend for<br />
computer ports by providing RS-232-C connections. Data PBXs do not provide for voice<br />
switching as a PBX or voice/data PBX would.<br />
Hard-wired connection is a point-to-point connection from a device to a CPU, either<br />
directly or via a direct or nonintelligient intermediate communication controller or a<br />
multiplexer,<br />
Remote connection is a connection to a modem, packet assembler/disassembler (PAD),<br />
wide area network or other device for transmitting data over remote-communication<br />
lines.<br />
B-1
DataQuest<br />
aconipanvpf<br />
The Dun SBiadstieet Oxpocatn<br />
Research Newsletter<br />
ESAM Code: Vol. IV, Newsletters<br />
1987-8<br />
EUROPEAN PC PRODUCTION CAPABILITY SHOWS EMERGING STRENGTH<br />
INTRODUCTION<br />
Dataquest estimates that PC production in Europe grew, in unit terms, 12 percent in<br />
1987, reaching an estimated 2 million units. More than 75 percent of all PCs sold in<br />
Europe are manufactured locally; approximately 275,000 units produced in Europe will be<br />
exported outside the Continent.<br />
Dataquest's wholly owned subsidiary. Intelligent Electronics Europe, shares its<br />
perspective of this strengthening commitment by PC manufacturers to produce in Europe.<br />
PC MANUFACTURERS<br />
Two broad categories of PC makers have a presence in Europe: the non-European<br />
multinational PC vendors that operate iin Europe and the European companies.<br />
Currently, of the m& PC manufacturers in Europe. 11 are non-European; of these, the<br />
only non-American ^ .idor is the Japanese company Fujitsu, which manages a microcomputer<br />
plant in Malaga, Spain. Fujitsu Spain operates through a joint venture, Fesa,<br />
with a government-controlled agency. This is fairly typical of the Spanish computer<br />
industry, whereby the company can be considered a local company—and all the more<br />
valuable—since its microcomputer production is targeted essentially at the Spanish<br />
market.<br />
Table 1 shows the main PC manufacturers in Europe, the location of their<br />
production facilities, and their product ranges.<br />
Many U.S. multinational computer companies with ambitions to have significant<br />
presence throughout the world have established wholly owned PC-manufacturing plants<br />
in Europe. Companies such as Apple, Commodore, Hewlett-Packard, IBM, NCR,<br />
NorthStar, Unisys, Wang, and Zenith have all expressed their dedication to the European<br />
countries through their direct investments. Compaq is the latest to follow suit, and its<br />
plant located in Scotland will be operational this month. This European production<br />
facility should give the company a more committed image in the minds of the European<br />
end users.<br />
© 1987 Dataquest Incorporated December—Reproduction Prohibited<br />
77K coiUenIs of this repon represeia our interpretatUm and analysis of information generally available u the public or released by responsible individuals in the subjea companies but is<br />
not guaranteed as to accuracy or completeness h does not contain material provided to us in confidence by our clients. Individual companies reported on and analyzed by Dataquest<br />
may be clients of this and/or other Dataquest services This information is not furnished in connection with a sale or offer to sell securities or in connection with the solicitation of an<br />
qf^r to buy securities This firm and its parent and/or their officers, stockholders, or members of their families may, from time to time, have a long or short position in the securities<br />
mentioned and may sell or buy such securities.<br />
Dataquest Incorporated, 1290 Ridder Park Drive, San Jose, CA 95131-2398, (408) 437-8000, Tfelex 171973, Fax (408) 437-0292
Manufacturer<br />
APD<br />
Apple<br />
Apricot<br />
Bull<br />
Bull<br />
Bull<br />
Commodore<br />
Compaq<br />
Dava<br />
Ericsson<br />
Ferranti<br />
Fesa<br />
Forum<br />
HP<br />
IBM<br />
ICL<br />
ICL<br />
Leanord<br />
NCR<br />
Nixdorf<br />
Nokia Luxor<br />
Nokia Luxor<br />
Normerel<br />
NorthStar<br />
Olivetti<br />
Olivetti<br />
Philips<br />
Regencentralen<br />
Siemens<br />
Siemens<br />
SMT Goupil<br />
SMT Goupil<br />
SMT Goupil<br />
SMT Goupil<br />
Telenova<br />
Tikidata<br />
Triumph Adler<br />
Tulip<br />
Unisys<br />
Wang<br />
Zenith<br />
Country of<br />
Origin<br />
Spain<br />
United States<br />
United Kingdom<br />
France<br />
France<br />
France<br />
United States<br />
United States<br />
Finland<br />
Sweden<br />
United Kingdom<br />
Spain/Japan<br />
France<br />
United States<br />
United States<br />
United Kingdom<br />
United Kingdom<br />
France<br />
United States<br />
West Germany<br />
Finland<br />
Finland<br />
France<br />
United States<br />
Italy<br />
Italy<br />
The Netherlands<br />
Denmark<br />
West Germany<br />
West Germany<br />
France<br />
France<br />
France<br />
France<br />
Sweden<br />
Norway<br />
West Germany<br />
The Netherlands<br />
United States<br />
United States<br />
United States<br />
Table 1<br />
European PC Manufacturers<br />
Madrid, Spain<br />
Plant<br />
Location<br />
Cork, Ireland<br />
Glenrothes, Scotland<br />
Villeneuve, France<br />
D'Ascg, France<br />
Barcelona, Spain<br />
Braunschweig,<br />
West Germany<br />
Erskine,<br />
Helsinki, Finland<br />
Sweden<br />
Withershaw,<br />
United Kingdom<br />
Malaga, Spain<br />
Longwy, France<br />
Grenoble, France<br />
Greenock, Scotland<br />
United Kingdom<br />
United Kingdom<br />
Aubourdin, France<br />
Augsburg, West Germany<br />
Padenborn,<br />
West Germany<br />
Espoo, Finland<br />
Rodja, Finland<br />
Granville, France<br />
Cork, Ireland<br />
Italy<br />
Spain<br />
Vienna, Austria<br />
Presto, Denmark<br />
Augsburg, West Germany<br />
Karlsruhe, West Germany<br />
Montpelier, France<br />
Redon, France<br />
Granville, France<br />
Soisson, France<br />
Nynashamm, Sweden<br />
Nuremberg, West Germany<br />
Nuremberg, West Germany<br />
Den Bosch, The Netherlands<br />
Vi].lers Scale, France<br />
Stirling, Scotland<br />
Kells, Ireland<br />
© 1987 Dataquest Incorporated December<br />
Product<br />
Range<br />
Europa, APD Uno<br />
32/4, 32XX, 32/40<br />
Apple II, Macintosh<br />
Apricot Xen<br />
PC range, terminals<br />
PC range, terminals<br />
Micral<br />
PCs, home computers,<br />
Amiga<br />
PCs<br />
PCs 286 & 386<br />
Ericsson PCs<br />
PC AT, PCs 1860<br />
& 2860<br />
Secorusa 20, Senda<br />
Multiuser systems<br />
Vectra 150, PCs<br />
PCs, ATs, PS/2<br />
Multiuser system<br />
Series 25, 39<br />
System 2966<br />
Silz Elan, PCs<br />
PCs 710/810/916,<br />
NCR 3390, 3392<br />
Nokia PC, ABC<br />
Terminals, Nokia PC<br />
Vectra 150, PCs<br />
Multiuser system<br />
PC series<br />
PC series<br />
PCs<br />
Piccoline-Partner<br />
PCD, PCX, PCM<br />
PC 16<br />
G40, G65<br />
G4, G40, G5<br />
65<br />
G4 Club<br />
Scandis/Compis<br />
PC Tiki<br />
Alphatronics PCs<br />
PC, Compact, 8386<br />
B20, B25<br />
Wang PC<br />
Desktop PCs<br />
Source: Intelligent Electronics Europe<br />
Dataquest<br />
December 1987<br />
ESAM Newsletter
The U.S. multinational companies have integrated worldwide corporate production<br />
strategies, with the assignment of each of their plants to specific regions. Production<br />
facilities in Europe usually serve the European markets. Often, they also serve the<br />
Middle East and Africa, or, like the Wang factory in Scotland, the non-European<br />
Commonwealth countries such as New Zealand and Australia.<br />
More rarely, as with both NorthStar and NCR, the European manufacturing bases of<br />
the U.S. corporations cater to worldwide markets. Since the NorthStar operation in<br />
Ireland now houses the company's only manufacturing facility, it supplies the whole<br />
world. The NCR plant, located in the southern German town of Augsburg, ships nearly<br />
half of its PCs outside Europe. The German NCR company is also responsible for most<br />
of the R&D activities in the PC area. Together with the European manufacturers<br />
Olivetti and Ericsson, NCR is the only Europe-based PC manufacturer to have produced<br />
significant volumes for the OEM markets. Through OEM contracts with the German<br />
companies Nixdorf, Olympia, and Siemens, and with HISI, now Honeywell Bull, from<br />
Italy, the firm has realized a large share of its sales through the OEM business.<br />
A major effect of this large investment in Europe-based PC plants by foreign firms<br />
has been the relative absence of protectionism in the field of PCs by either the national<br />
and local governments or from the EEC. France is possibly the main exception, in that,<br />
until recently, the French national manufacturers have enjoyed almost a monopolistic<br />
position within the French government-controlled markets. In spite of this, there have<br />
been no protectionist moves to halt imports of PCs. In addition, as Europe has a positive<br />
trade balance as far as PCs are concerned, no real efforts have been made to institute<br />
any protectionist measures like those undertaken in the fields of typewriters,<br />
photocopiers, and, more recently, printers.<br />
Olivetti is still the leading European PC manufacturer. After recently having<br />
stopped the production of PCs at its French Logabax factory in Meaux, the Italian<br />
company now has only two PC plants: one in Scarmagno, Italy, and one in Barcelona,<br />
Spain. In addition, Olivetti now uses some of its existing production capacity near<br />
Naples to manufacture its new home computer model, the PCI.<br />
SEMICONDUCTOR ANALYSIS<br />
Dataquest estimates that personal computers will consume approximately 7 percent<br />
of the $6,780 million semiconductor market in Europe. Table 2 shows a comparison of<br />
the integrated circuit content of an IBM PC AT, a Compaq 386, and the IBM PS/2<br />
Model 50.<br />
Overall, the growth of semiconductor revenue for the computer marketplace looks<br />
healthy. The ratio of semiconductor revenue to computer revenue is expected to remain<br />
relatively constant from 1988 through 1990, at about 5 percent for the market as a whole<br />
and at about 6 percent for just PCs. Dataquest believes that the greatest opportunities<br />
for IC manufacturers serving the PC market lie in separate areas. The first is a<br />
continued growth in application-specific ICs. As PC manufacturers attempt to introduce<br />
smaller, faster, and less expensive machines, the demand for highly integrated chips is<br />
inevitable. Those ASICs directed at integrating traditional motherboard logic and also at<br />
maximizing peripheral controller functions and high-resolution graphics capabilities hold<br />
great promise. Second, along with the growth of application-specific logic chips, there<br />
are opportunities for dedicated processors and microcontrollers, particularly in the areas<br />
ESAM Newsletter © 1987 Dataquest Incorporated December
of computer graphics and storage subsystems. Additionally, as notorious "memory<br />
munchers," these 32-bit machines will require ICs that are faster and have denser<br />
memories than their predecessors. Static RAMs and static column RAMs, as well as<br />
traditional DRAMs with densities of 1 megabit and above, will be consumed in<br />
ever-greater ratios within the PC market.<br />
Standard Logic<br />
Memory<br />
RAM<br />
EPROM<br />
Description<br />
Microdevices<br />
Microprocessor<br />
Interrupt Control<br />
DMA. Control<br />
Counter/Timer<br />
I/O Port<br />
CRT Control<br />
Floppy Disk Control<br />
Asyncronous Communications<br />
Control<br />
RTC plus RAM Upgrade<br />
RAM Control<br />
Peripheral Control<br />
Table 2<br />
The Integrated Circuit Content of PCs<br />
Number of Integrated Circuits<br />
128<br />
41<br />
N/A<br />
IBM<br />
9<br />
80286<br />
X<br />
X<br />
X<br />
X<br />
X<br />
X<br />
X<br />
PC<br />
(6<br />
AT<br />
MHz)<br />
ASICs 10<br />
Compaq 386<br />
115<br />
36<br />
2<br />
14<br />
80386<br />
X<br />
Note: X means that the chip is included in that model.<br />
N/A = Not Available<br />
X<br />
X<br />
X<br />
X<br />
X<br />
82<br />
21<br />
5<br />
IBM PS/2<br />
Model 50<br />
4<br />
80286 (10 MHz)<br />
X<br />
X<br />
Source: Dataguest<br />
December 1987<br />
© 1987 Dataquest Incorporated December ESAM Newsletter
DATAQUEST CONCLUSIONS<br />
Although several of the European PC manufacturers already have built up markets<br />
outside their own countries, or even outside Europe, more European companies are now<br />
strengthening their activities in order to boost their export performances. In some<br />
cases, European companies have started to become significant worldwide players. A<br />
major reason for this change in marketing strategy is directly associated with production<br />
issues. Considering the high fixed costs of a manufacturing facility, it has become<br />
necessary, in order to remain competitive, to realize high sales volumes, which in turn<br />
require a deeper penetration of the home market and/or an increased marketing and<br />
sales effort aimed toward export markets. Companies such as APD, Bull, Ericsson,<br />
Goupil, Nixdorf, Nokia, Siemens, and Tulip are all increasing their marketing investments<br />
outside their home countries or traditional regional bases.<br />
ESAM Newsletter © 1987 Dataquest Incorporated December<br />
Jennifer Berg