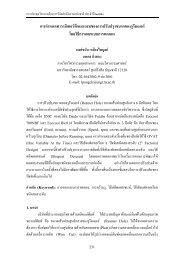
ดาวน์โหลด All Proceeding - AS Nida
ดาวน์โหลด All Proceeding - AS Nida
ดาวน์โหลด All Proceeding - AS Nida

Create successful ePaper yourself
Turn your PDF publications into a flip-book with our unique Google optimized e-Paper software.
D(t p )<br />
=<br />
H(t p )Tf<br />
+ Tp<br />
t p + Tp<br />
When, Tf is the mean downtime required to make a failure<br />
replacements, Tp is the mean downtime required to make a preventive<br />
replacement.<br />
This is a model of problem relating replacement interval tp to<br />
total downtime D(tp). 3.5 Implement and Refine the maintenance plan<br />
The maintenance plan developed in section 3.4 is<br />
implemented and the results are reviewed to determine if the plan needs<br />
to be refined or modified to ensure its effectiveness.<br />
Implementation of RCM requires the formation of a<br />
multidisciplinary team with members knowledgeable in day-to-day<br />
operations of the plant and equipment, as well as in the details of the<br />
equipment itself. This demands at least one operator and one<br />
maintainer. Members with knowledge of planning and scheduling and<br />
overall maintenance operations and capabilities are also needed to<br />
ensure that the tasks are truly doable in the plant environment. Thus,<br />
senior-level operations and maintenance representation is also needed.<br />
Finally, detailed equipment design knowledge is important to the team.<br />
This knowledge requirement generates the need for an engineer or<br />
senior technician/technologist from maintenance or production [3].<br />
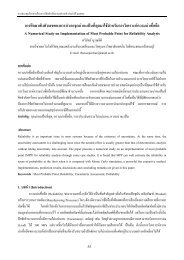
4. Case Study<br />
4.1 Paper Production System<br />
The sample paper machine is the middle manufacturing that<br />
operates paper production category CA and M (brown paper). There are<br />
paper machines MC1 with capacity 40 tons per day, MC2 with capacity<br />
18 tons per day and MC3 with capacity 85 tons per day. The production<br />
processes of the paper production system are discussed hereunder:<br />
1. Stock (pulp + water) preparation unit<br />
2. Forming unit<br />
3. Press unit<br />
4. Dryer unit<br />
5. Rewinder unit<br />
6. Steam Handling System<br />
7. Power Supply unit<br />
The machine downtime is illustrated as Table 1 below:<br />
(4)<br />
241<br />
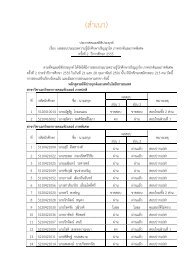
Table 1 Production line downtime<br />
Month<br />
Operating Time<br />
(min)<br />
Downtime (%) Availability (%)<br />
MC1 MC2 MC3 MC1 MC2 MC3<br />
Jul-09 43,200 25.84 32.70 15.34 74.16 67.30 84.66<br />
Aug-09 40,320 27.89 32.10 22.86 72.11 67.90 77.14<br />
Sep-09 43,200 25.80 24.29 24.65 74.20 75.71 75.35<br />
Oct-09 43,200 26.57 29.63 19.73 73.43 70.37 80.27<br />
Nov-09 41,760 24.86 36.70 25.88 75.14 63.30 74.12<br />
Dec-09 40,320 26.18 33.92 18.53 73.82 66.08 81.47<br />
Jan-10 41,760 23.28 26.32 28.49 76.72 73.68 71.51<br />
Feb-10 40,320 26.18 35.22 26.93 73.82 64.78 73.07<br />
Mar-10 44,640 20.1 29.96 30.33 79.81 70.04 69.67<br />
Apr-10 40,320 26.60 35.28 24.76 73.40 64.72 75.24<br />
May-10 43,200 25.44 23.15 29.06 74.56 76.85 70.94<br />
Jun-10 41,760 26.94 21.02 20.70 73.06 78.98 79.30<br />
By taking data from machine MC1, MC2 and MC3 to<br />
calculate into average downtime rate are 25.48%, 30.02% and 23.94%<br />
respectively. The rate is exceed from target goal which is 20% and<br />
machine availability rate is 74.52%, 69.98% and 76.06% respectively<br />
which can divide into each process per figure 2.<br />
400000<br />
300000<br />
200000<br />
100000<br />
0<br />
Units STOCK FORMING PRESS STEAM DRYER POWER REWINDER<br />
Count 208442 80185 50471 22156 18677 13717 6279<br />
Percent 52.1 20.1 12.6 5.5 4.7 3.4 1.6<br />
Cum % 52.1 72.2 84.8 90.3 95.0 98.4 100.0<br />
Figure 2 Pareto chart<br />
Figure 2 illustrated the highest downtime is from stock<br />
preparation unit which will be selected to be study. Next is to defined<br />
machines using in stock preparation unit in order to indentify the critical<br />
machine rank.<br />
4.2 Identify the critical machine<br />
Refer section 4.1, stock preparation unit was selected as a<br />
system to research by categorize machine to subsystem production<br />
process as follow figure 3-5:<br />
100<br />
80<br />
60<br />
40<br />
20<br />
0