Link - AquaFish CRSP - Oregon State University
Link - AquaFish CRSP - Oregon State University
Link - AquaFish CRSP - Oregon State University

You also want an ePaper? Increase the reach of your titles
YUMPU automatically turns print PDFs into web optimized ePapers that Google loves.
AQUAFISH <strong>CRSP</strong><br />
TECHNICAL REPORTS<br />
INVESTIGATIONS 2009–2011<br />
VOLUME 1<br />
AUGUST 2012<br />
Aquaculture & Fisheries<br />
Collaborative Research Support Program<br />
Management Entity<br />
<strong>Oregon</strong> <strong>State</strong> <strong>University</strong><br />
418 Snell Hall Corvallis, OR 97331-1643 USA<br />
aquafish@oregonstate.edu
AQUAFISH <strong>CRSP</strong> TECHNICAL REPORTS:<br />
INVESTIGATIONS 2009–2011, VOLUME 1<br />
Program activities are funded by Cooperative Agreement No. EPP-A-00-06-00012-00 from the<br />
United <strong>State</strong>s Agency for International Development (USAID), and by participating US and<br />
Host Country institutions.<br />
Disclaimers<br />
The contents of this document do not necessarily represent an official position or policy of the<br />
United <strong>State</strong>s Agency for International Development (USAID). Mention of trade names or<br />
commercial products in this document does not constitute endorsement or recommendation for<br />
use on the part of USAID or the <strong>AquaFish</strong> Collaborative Research Support Program (<strong>CRSP</strong>).<br />
The accuracy, reliability, and originality of work presented in this report are the responsibility<br />
of the individual authors.<br />
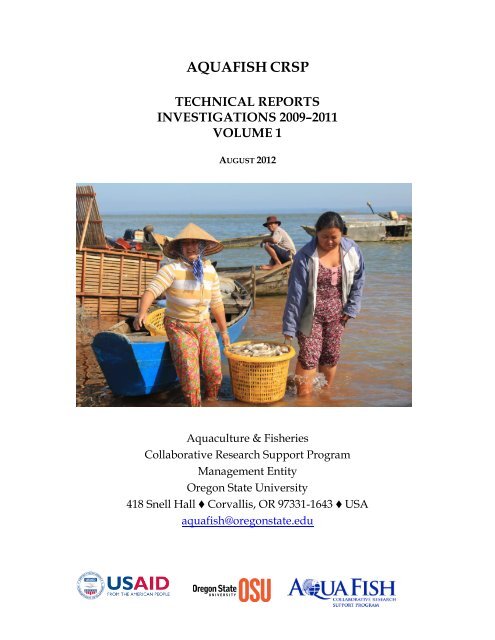
Cover Photo<br />
Buyers haul off a basket of freshly caught fish from Tri An Reservoir in Vietnam, where<br />
<strong>AquaFish</strong> <strong>CRSP</strong> researchers are assessing the impacts of fish stocking on wild fish populations.<br />
Photo by Peg Herring, Extension & Experiment Station Communications, <strong>Oregon</strong> <strong>State</strong><br />
<strong>University</strong>.<br />
This publication may be cited as:<br />
<strong>AquaFish</strong> Collaborative Research Support Program. August 2012. Technical Reports 2009–2011,<br />
Volume 1. <strong>AquaFish</strong> <strong>CRSP</strong>, <strong>Oregon</strong> <strong>State</strong> <strong>University</strong>, Corvallis, <strong>Oregon</strong>, 573 pp.<br />
<strong>AquaFish</strong> <strong>CRSP</strong> Management Entity<br />
<strong>Oregon</strong> <strong>State</strong> <strong>University</strong><br />
418 Snell Hall Corvallis, OR 97331-1643 USA
Table of Contents: Volume 1<br />
Production System Design & Best Management Alternatives<br />
Evaluation and Improvement of Production Technology in Uganda: Case Studies of<br />
Small-Holder Cage Culture in Watershed Reservoirs and as an Alternative Livelihood<br />
for Fishers (09BMA01AU) ........................................................................................................................ 1<br />
Training and Outreach in Uganda and Surrounding Nations (09BMA02AU) .............................. 25<br />
Incorporation of Tilapia (Oreochromis niloticus) and Sahar (Tor putitora) into the Existing Carp<br />
Polyculture System for Household Nutrition and Local Sales in Nepal (09BMA03UM) ...……..38<br />
Study on the Effectiveness of a Pond-Based Recirculating System for Shrimp Culture<br />
(Production System Design and Best Management Alternatives (09BMA04UM) ......................... 53<br />
Development of Indoor Recirculating Culture Systems for Intensive Shrimp<br />
Production in China (09BMA05UM) .................................................................................................... 60<br />
Identifying Best Practices to Improve the Giant River Prawn Industry in<br />
Thailand (09BMA06UM) ........................................................................................................................ 82<br />
Assessment of <strong>AquaFish</strong> <strong>CRSP</strong> Discoveries (09BMA07OR) ............................................................. 87<br />
Sustainable Feed Technology<br />
Alternative Feeds for Freshwater Aquaculture Species in Vietnam (09SFT01UC) ..................... 145<br />
Assessment of Integrated Pond-Cage System for the Production of Nile Tilapia for<br />
Improved Livelihood of Small-Scale Fish Farmers in Kenya (09SFT02PU) ................................. 180<br />
Expansion of Tilapia and Indigenous Fish Aquaculture in Guyana: Opportunities for<br />
Women (09SFT03UA) ............................................................................................................................ 195<br />
Feeding and Feed Formulation Strategies to Reduce Production Costs of Tilapia<br />
Culture (09SFT04NC) ............................................................................................................................ 202<br />
Develop Feeding Strategies for Moringa oleifera and Leucaena leucocephala as Protein<br />
Sources in Tilapia Diets (09SFT05PU) ................................................................................................ 227<br />
Impact Assessment of <strong>CRSP</strong> Activities in the Philippines and Indonesia (09SFT06NC) .............. 240<br />
Sustainable Feed and Improved Stocking Densities for Gar (Atractosteus spp.)<br />
Culture (09SFT07UM) .............................................................................................................................. 259<br />
Indigenous Species Development<br />
Developing Hatchery Methods for the Mangrove Oyster, Crassostrea corteziensis for<br />
the Pacific Coast of Mexico (09IND01UH) ........................................................................................ 280
Sustainable Snakehead Aquaculture Development in the Lower Mekong River Basin of<br />
Cambodia and Vietnam (09IND02UC) .............................................................................................. 289<br />
Induced Spawning and Larval Rearing of the “Chame” Dormitator latifrons in<br />
Laboratory Conditions (09IND03UH) ............................................................................................... 344<br />
Stock Assessment of “Chame” Dormitator latifrons in Nayarit and South of Sinaloa<br />
México (09IND04UH) ............................................................................................................................ 362<br />
Consolidation of Native Species Aquaculture in Southeastern Mexico: Continuation of<br />
a Selective Breeding Program for Native Cichlids and Snook Aquaculture (09IND05UA)…....373<br />
Development and Diversification of Species for Aquaculture in Ghana (09IND06PU) ............. 401<br />
Prospects and Potential of the African Lungfish (Protopterus spp): An Alternative Source of<br />
Fishing and Fish Farming Livelihoods in Uganda and Kenya (09IND07AU) ................................ 417<br />
Effects of Environmental Conditions on Gills and Gas Bladder Development in Bimodal-<br />
Breathers, Gar (Lepisosteus sp.), Pirarucu (Arapaima gigas) and Bowfin<br />
(Amia calva) (09IND08UH) ..................................................................................................................... 432<br />
Quality Seedstock Development<br />
Nile Tilapia Broodstock Selection, Seed Quality and Density-Dependent Growth in the<br />
Philippines (09QSD01NC) ................................................................................................................... 461<br />
Sustainable Integrated Tilapia Aquaculture: Aquaponics and Evaluation of Fingerling<br />
Quality in Tabasco, Mexico (09QSD02UA) ....................................................................................... 503<br />
Development of Polyculture Technology for Giant Freshwater Prawns (Macrobrachium<br />
rosenbergii) and Mola (Amblypharyngodon mola) (09QSD03UM) ..................................................... 529<br />
Evaluation of Performance of Different Tilapia Species (09QSD04PU) ........................................ 546<br />
Training Program in Propagation and Hatchery Management of tilapia (Oreochromis niloticus)<br />
and catfish (Clarias gariepinus) in Ghana (09QSD05PU) ..................................................................... 553<br />
Human Health Impacts of Aquaculture<br />
Co-management and Bivalve Sanitation for Black Cockles (Anadara spp.) in<br />
Nicaragua (09HHI01UH) ..................................................................................................................... 558<br />
Capacity Building in Aquaculture, Fisheries Management and Coastal Management<br />
for Coastal Women Workshop: “Opportunities for Coastal Women in Fisheries,<br />
Aquaculture and Coastal Management” (09HHI02UH) ................................................................. 571
Evaluation and Improvement of Production Technology in Uganda:<br />
Case Studies of Small-Holder Cage Culture in Watershed Reservoirs and as<br />
an Alternative Livelihood for Fishers<br />
Production System Design and Best Management Alternatives/Study/09BMA01AU<br />
Emily Stutzman Jones and Joseph J. Molnar<br />
Auburn <strong>University</strong><br />
Auburn, Alabama, USA<br />
Gertrude Atukunda and John Walakira<br />
National Fisheries Resources Research Institute<br />
Kajjansi, Uganda<br />
ABSTRACT<br />
Aquaculture development commentary supports the formation of fish farmer associations or producer<br />
organizations as avenues for cultivating small- and medium-scale commercial farmers. However, little is<br />
known about the types of associations that facilitate commercialization. This research presents four<br />
qualitative case studies, based on semi-structured interviews, profiling existing associations of<br />
commercial fish farmers in Uganda. We conclude that the umbrella organizations under which local fish<br />
farmer associations vertically align themselves have important implications for fish farmer production.<br />
Aquaculture-specific umbrella organizations contribute to the success of local member associations more<br />
than general umbrella organizations do. Successful fish farmer associations accept government assistance<br />
only when it directly improves their fish farm operations. Other farmer groups seemed to wait for direct<br />
subsidization. Training fish farmers, providing quality information, cost sharing, and advocating for the<br />
aquaculture sector, not donor seeking, are the top priorities in productive fish farmer associations. Part I<br />
of this report summarizes the four case studies; Part II summarizes the results of the cage culture trials.<br />
INTRODUCTION<br />
Improving the livelihoods, nutrition, and opportunities of the rural poor is a central goal of development<br />
efforts, particularly the aquaculture sector. These efforts target smallholder farmers, who make up 70<br />
percent of the African continent’s population. Most rural farmers make their livelihoods from small-scale,<br />
mixed enterprises, producing first for home consumption and second for sale (Brummett et al. 2008:375).<br />
The prevailing approach to aquaculture development in Sub-Saharan aquaculture between the 1970s<br />
through the 1990s targeted the rural poor mainly by supporting tilapia and the African catfish as culture<br />
species. The FAO, the Peace Corps, and USAID largely centered their efforts on small-scale, limited<br />
input, integrated fish farming for improved household fish consumption and income with often<br />
disappointing or inconsistent results (Brummett et al. 2008:375, Moehl 2006:v). Currently, 90 percent of<br />
African fish farmers fall into this small-scale or artisanal category (Brummett et al. 2008:380).<br />
Gains from small-scale, integrated fish farming systems generally are not captured in official statistics.<br />
Nevertheless, rural food security advances through increasing small farm production levels (Brummett et<br />
al. 2008:375). However, small-scale, integrated fish farming operations realize little cash gain due to the<br />
small quantities and low production intensity, that is, the weight of fish produce per unit area (Brummett<br />
et al. 2008:375). Increasing production intensity is a central goal in aquacultural development. Several<br />
factors work against the continued promotion of subsistence-level fish farms, including the expense of<br />
training and extension and the low expectations for economic returns from this diversified farming system<br />
(Brummett 2008:383).<br />
1
TECHNICAL REPORTS: INVESTIGATIONS 2009–2011<br />
Technical aquaculture experts have long understood that success in aquaculture hinges on human factors<br />
(Moehl 2006). Sociologists involved in aquaculture development find that personal commitment to fish<br />
farming is perhaps a more vital predictor of success than technical knowledge (Molnar et al. 1985). We<br />
have learned how commitment supports sustained attention to technical matters for individual farmers,<br />
but increasingly groups are used as mechanisms for extending technical knowledge, engendering mutual<br />
support, and sharing burdens such as surveillance to prevent theft and harvest of ponds. The purpose of<br />
this paper is to describe organizational and sociological factors that influence the success of commercial<br />
aquaculture in Uganda by examining four existing fish farmer associations. Each association relies on<br />
different coping strategies and mechanisms of affiliation to realize its fish farming objectives, albeit with<br />
different degrees of success.<br />
PART I: CASE STUDIES OF SUBSISTENCE AQUACULTURE<br />
Subsistence aquaculture is being re-evaluated and the commercialization of agriculture as a whole is the<br />
present focus of the Food and Agriculture Organization of the United Nations (FAO) in Sub-Saharan<br />
Africa and the Ugandan government’s national policy as well. Several donor organizations and the FAO,<br />
are working to transform selected farmers from small-scale to commercial fish farm operators. The<br />
premise is that fish farmers who operate mainly for profit and can be the driving force behind aquaculture<br />
infrastructure development, including the production of quality fish fingerlings or “seed” and the use<br />
formulated feed in production (as opposed to reliance on pond fertilization and generally inadequate farmproduced<br />
feeds). The abiding characteristics of these profit-oriented farmers are yet to be realized, as<br />
there are currently only 200 such Ugandan fish farmers. A focus on commercial operators coincides<br />
coinciding with the Ugandan government’s promotion of fish exports (Mwanja 2005). 1<br />
Fish farmer associations are a key factor in establishing a viable commercial aquaculture sector in Sub-<br />
Saharan Africa (de Selingy 2006, Moehl 2006, Hecht 2005). A farmer association is defined as a<br />
conglomeration of individual farmers and/or fish farming groups joined for the purpose of more effective<br />
coordination of activities, and for established capacities to address several constraints and limitations<br />
faced by members. They are primarily social organizations and members of an association do not own<br />
joint fish ponds under the umbrella of the association (Moehl 2006). Some beneficial roles which fish<br />
farmer associations can play include influencing policy and regulations, providing technical services,<br />
facilitating market access, aiding in aquaculture research programs, providing extension services,<br />
developing and encouraging adherence to codes of conduct or better management practices, extending<br />
credit to member farmers, and facilitating knowledge-sharing (Hecht 2005, de Selingy 2006, Mosher<br />
1966). In Africa, such entities are often the beginning points for developing a national industry.<br />
Despite the long lists of roles for fish farmer associations to perform, no framework or set of guidelines<br />
exists for how effective associations can be created (Moehl 2006). In fact, many fish farmer associations<br />
are described as ineffective or short-lived, and links between donor funding and association creation are<br />
common, as promises of gifts often accompany injunctions to form farmer associations; in these cases,<br />
1 Aquaculture now is seen as a private-sector led enterprise that is technically sound, economically profitable,<br />
socially acceptable, and environmentally sustainable with the state playing a role as a facilitator and monitor<br />
(Brummett et al. 2008, de Seligny 2006). Commercialization of aquaculture need not exclude small holders; the<br />
distinction is more a reflection of motivation, goals, and business and management practices than scale (Brummett et<br />
al. 2008:375, Moehl 2006). In comparison to artisanal, integrated fish farmers, the small-to medium-scale<br />
commercial farmers typically build more ponds, use more technology, employ laborers, purchase fingerlings, use<br />
commercial feeds, and employ nonlocal business strategies. Commercial operators transport fish to urban markets<br />
where customers pay cash for fish (Brummet et al. 2008:380). Producers and consumers benefit from the<br />
commercialization of aquaculture.<br />
2
3<br />
TECHNICAL REPORTS: INVESTIGATIONS 2009–2011<br />
associations commonly disintegrate after incentives disappear (Hecht 2005, Moehl 2006, Harrison 1996).<br />
There are few surviving instances of thriving fish farmer associations to cite as examples (Moehl 2006).<br />
Nonetheless, government and donor interest in fish farmer associations remains strong because of the<br />
need to reach large numbers of adopters, using farmer field schools and other extension models to<br />
leverage the efforts of trainers and extension personnel (Moehl 2006). Larger numbers of beneficiaries<br />
participate in investments in pond construction, feed subsidies, and seed stock supply. A growing focus<br />
on commercialization necessitates that farmers have all available tool for success, as the financial stakes<br />
are higher than with previous subsistence efforts. Associations can provide some of the tools, in the form<br />
of knowledge, access to quality inputs, and relationships with aquaculture technicians, which individuals<br />
need to succeed as commercial fish farmers. Emerging commercial fish farmers, who have the desire to<br />
learn new techniques and improve production, are a target group for successful fish farmer association<br />
development (Hecht 2005). The case studies elucidate the way these efforts actually are realized in rural<br />
African communities.<br />
PART II: CAGE CULTURE TRIALS<br />
Cage culture is a new aquaculture technology in Uganda that involves the utilization of lakes, rivers and<br />
large water reservoirs. Most of these natural resources are over exploited due to the massive fishing<br />
pressure aimed at maximizing catches. As a result, many of the aquatic resources are being depleted.<br />
Therefore, cage culture can play the role of providing an alternative form of livelihood for fisher<br />
communities in order to practice aquaculture alongside sustainable fishing. Its advantages include ease<br />
with handling fish, high stocking densities, ease of controlling predators, utilizes less labor and higher<br />
turnover of profits. Some of the barriers of successful cage culture include: high investment costs<br />
combined with difficulties in access to credit and/ necessary materials, unavailability of cost effective<br />
high quality fish seed, theft of fish, problems concerning use of areas considered as public domain and<br />
challenges in marketing of cage reared products (FAO, 2004).None the less, cage culture is a venture that<br />
is attracting investment interest by a cross section of actors right from community based fisher groups to<br />
foreign commercial investors in Uganda. This is largely because it has the potential to produce large<br />
quantities of fish for domestic markets and for export.<br />
USAID supported research as well as the fisheries section of National Agricultural Research organization<br />
conducted initial cage culture trials and demonstrations. Results of the research showed the possibility of<br />
small holder groups to engage in cage culture. In particular, fishers showed keen interest in engaging in<br />
cage culture mainly because many of them were losing employment due to reduced wild fish caged that<br />
were no longer viable. Towards the end of the FISH project, at least two groups of fishers had started the<br />
required formal process to enable them obtain permits for engaging in cage culture on L. Victoria. By the<br />
year 2007, the groups had obtained the permits. Permits for cage culture have to be obtained from the<br />
Ministry of Agriculture Animal industry and Fisheries (MAAIF), the National Environment Management<br />
Authority (NEMA) and the Directorate of Water Resource management of the Ministry of Water Lands<br />
and Environment.<br />
Although the project initially planned to work with four farmer groups in four different localities, only<br />
one group (Jinja United) was finally eliminated due to financial limitations. In addition, one group got<br />
into another arrangement with government while the other two faced problems of group cohesion and<br />
could not continue with the activities.<br />
Following acquisition of the permits, the group members were ready to start but did not have enough<br />
money to cover the key cost i.e. cages. One group obtained financial support from government so<br />
<strong>AquaFish</strong> <strong>CRSP</strong> investigators opted to work with the other group that had raised some capital from their<br />
own savings. Discussions were held with group members and a Memorandum of Understanding was
TECHNICAL REPORTS: INVESTIGATIONS 2009–2011<br />
drawn and signed by the two parties. It was agreed that the project would provide the cages and technical<br />
advice while the group members would provide the some of the fingerlings at stocking and all the labor<br />
required in feeding, sampling and ensuring security. The Memorandum of Understanding (MoU) also<br />
spelled out details of responsibilities of the two parties and their expectations. With technical assistance<br />
by <strong>AquaFish</strong> <strong>CRSP</strong> investigators, a financial management plan and draft enterprise budget were<br />
developed with the group.<br />
During the investigation and demonstration, emphasis was put on cash flow management. This was in<br />
order to demonstrate that the group can source capital and with good management be able to make profits<br />
from cage culture.<br />
As result of the increasing fishing pressure, aquatic resources are at a risk of depletion. Therefore,<br />
evidence that cage culture is a profitable venture is a key aspect in providing information that can<br />
transform fisher communities to practicing aquaculture as an alternative form of livelihood. The study<br />
aimed at providing evidence of cage culture as a profitable venture and information on some of the<br />
management aspects that should be emphasized.<br />
The number of fishers on Lake Victoria has increased tremendously since 2000 and the increased pressure<br />
on the fishery has led to adoption of illegal and highly destructive fishing methods. Moving traditional<br />
fishers to farming has often been cited as near impossible. However, many of Uganda’s fishers are new<br />
comers to fishing because they were not able to subsist on agriculture. This group of people could more<br />
easily be moved into fish farming compared to groups who have been fishing for several generations.<br />
METHOD<br />
PART I: CASE STUDIES OF SUBSISTENCE AQUACULTURE<br />
Case studies of four fish farmer organizations in diverse areas of Uganda were conducted during January<br />
and February 2010. Yin defines a case study as an “… empirical inquiry that investigates a contemporary<br />
phenomenon within its real-life context, especially when the boundaries between phenomenon and<br />
context are not clearly evident” (2008:13). Multiple case study analysis is a research method that looks<br />
carefully at persons and operations at several locations in order to understand a complex situation (Stake<br />
2006). Evidence from multiple case studies is likely to be stronger than that of single case studies (Yin<br />
2008:19).<br />
’ previous professional connections the associations had made with the Aquaculture Research and<br />
Development Centre, Kajjansi (KARDC), a branch of The National Fisheries Resources Research<br />
Institute (NaFIRRI). Recruiting focus group research participants from associations where potential<br />
participants seek services is one method for recruiting research participants (Hennink 2007:102). All three<br />
associations have donor project relationships. We intended to conduct focus group interviews with a<br />
sample of members from each aquaculture group. However, in the cases of “The Unaccountable Leaders”<br />
and “The Helping Hands,” this was not possible, as the fish farmer association leaders were not<br />
cooperative in arranging focus group meetings. In these situations, data emanate from semi-structured<br />
interviews with the fish farmer association’s leaders, extension officers, and other informants.<br />
We identified “The Cooperative Society,” an organization without direct development project ties or<br />
previous contact with the collaborating fishery officers. Contact with this organization came through a<br />
fish farmer organizer met at Uganda’s Annual Fish Farmer Symposium and Trade Show. The case<br />
provides a contrasting comparison, as the other groups are representative of the type of fish farmer<br />
associations that maintain contact with government researchers, and “The Cooperative Society” does not.<br />
Events, meetings, and conferences are also useful venues for recruiting focus group research participants<br />
(Hennink 2007:101). The contact is the organizer and chairman of the Uganda Fish Farmers Cooperative<br />
Alliance. “The Cooperative Society” is one of the groups organized under the Uganda Fish Farmers<br />
4
5<br />
TECHNICAL REPORTS: INVESTIGATIONS 2009–2011<br />
Cooperative Alliance umbrella. We examine each case in the context of the guiding issues of internal<br />
dynamics and relative success in the targeted technical activities.<br />
PART II: CAGE CULTURE TRIALS<br />
Initial work was to verify the appropriateness of the site allocated to the farmer group. GPS readings were<br />
taken and water quality parameters of Oxygen and temperature were also recorded. The site is close to<br />
Kirinya prisons, Jinja at the shore of Lake Victoria.<br />
Table 1. Parameters of cage sites<br />
Distance<br />
from shore<br />
line<br />
Elevation GPS readings Temperature Oxygen Cloud cover<br />
193M 1143 N0.41346 E033.23247 26 0 C 3.5 Mg/l 80%<br />
Cage installation. Two cages (2M by 2M by 2M) were installed on the selected site. Each cage was<br />
stocked with 2030 Sex reversed Oreochromis niloticus of average 4g that were obtained From Source of<br />
the Nile Fish farm. The initial plan to have the fry nursed in ponds was not performed because the<br />
farmers’ ponds were not in good condition.<br />
Management. Training in the management of cages was conducted a day before stocking the cages. The<br />
training was attended by Jinja United farmer group members (4 women and 6 men). The training was<br />
delivered by the <strong>AquaFish</strong> <strong>CRSP</strong> project team supplemented with technical assistance by a technician at<br />
SoN fish farm. The training covered the following topics:<br />
Feeding techniques<br />
Collecting and recording mortalities<br />
Record keeping (technical and financial)<br />
Group dynamics<br />
The second training was conducted at the time of sampling fish at month three (March 2011. Besides Jinja<br />
United farmer group members, this training included some members of the Masese NAADS farmers<br />
group and some members from the surrounding community. Besides discussing sampling results, the<br />
issue of the need to use a stronger net cage was discussed since it had been realized that fish had escaped<br />
from one of the cages. Feed amounts were administered based on fish size and adjusted depending on fish<br />
response.<br />
Data collection. Group discussion interviews were initially held with the farmer group member to obtain<br />
information about the history and organization of the group. This exercise was part of the field work<br />
carried out by Masters student from Auburn <strong>University</strong>. The next round of group discussions involved<br />
farmer group members (4 women and 6 men) and some members from the surrounding community.<br />
Sampling of fish was carried out to monitor fish growth and to determine the right amount of feed to be<br />
administered during the subsequent month. Members of the farmer group kept records of cost of feed fed<br />
to the fish, feeding response and any fish mortalities encountered. Other records the group kept included<br />
members’ cash contributions to the expenses and a roster of members’ personal visits and activities<br />
carried out at the site.
TECHNICAL REPORTS: INVESTIGATIONS 2009–2011<br />
RESULTS<br />
Two associations are beginning to operate cage culture aquaculture systems, one is a fingerling producer,<br />
and the members of a fourth farm fish in ponds. In order to facilitate comparisons and analyses of factors<br />
that make fish farmer associations successful at improving their member farmers’ fish production, the<br />
cases have been ordered from fish farmer associations with the lowest fish production to the entity whose<br />
members produce the most fish.<br />
CASE STUDY ONE: “THE UNACCOUNTABLE LEADERS”<br />
In western Uganda, bordering Queen Elizabeth National Park is a group of individuals who operate cages<br />
on the deep inland waters known as Uganda’s crater lakes. They operate under a regional environmental<br />
conservation umbrella group. The environmental conservation umbrella group has 69 members and nine<br />
people in leadership positions, including a chairperson, vice chairperson, treasurer, secretary, project<br />
coordinator, and committee members.<br />
The environmental conservation organization became involved in fish farming with cages through the<br />
project coordinator in 2008. As part of a five-year countrywide aquaculture development project, a subset<br />
of this association received some training, and project staff conducted water quality tests for 13 lakes,<br />
which demonstrated eight viable for fish farming based on indicators including dissolved oxygen and<br />
hydrogen sulfide levels. One lake was selected as an experiment and five cages were placed on the lake.<br />
Cage culture. Of 70 people who came to learn about fish farming (some of whom maintain their own fish<br />
ponds), ten were selected to manage the cages on the selected lake. This operation was designated as a<br />
model farm. The group maintained the tilapia fish in the cages through two production cycles. But, due to<br />
a lack of feeds, the cages are currently empty.<br />
In the view of the project coordinator, the first harvest was a success, though two of the five cages had<br />
problems just before harvest, which rendered them useless. One cage’s top had not been latched correctly,<br />
so the fish escaped. Another’s net was torn, possibly by otters. The other three cages were harvested and<br />
given to the people participating in the project in order to demonstrate the success of the venture as well<br />
as to establish that farmed fish tastes like wild-caught fish, as many people were skeptical of farmed fish.<br />
The second harvest was also a success, though only two cages were in use. After harvest, the fish were<br />
salted and sun-dried, a low-cost preservation and value-addition method, and sold to traders from the<br />
Democratic Republic of the Congo. The project coordinator said, “We only had two cages because we<br />
had no feeds and the cages were getting old, and the feeds we were using were expired. Feeds are very<br />
expensive.” The cages have since been repaired.<br />
Resources necessary for production are currently the problem, as members cannot afford the investment.<br />
The chairman said, “People are willing to participate, but pooling resources is not affordable for the<br />
members, though a few members can.”<br />
Leadership. The honesty of the two leaders of the association was called into question during the<br />
discussion of the group’s first harvest. It remains unclear why the fish from two of the five cages in the<br />
second production cycle disappeared. When asked if theft rather than an animal predator or unlatched lid<br />
could have led to the empty cages, the project coordinator said, “They don’t steal from the cages because<br />
there is 24/7 monitoring.” Theoretically, a full-time guard would have seen problems with an unlatched<br />
lid and an animal. Additionally, it became clear that the project coordinator never asked the members<br />
involved in fish culture to come to participate in interviews. A collaborating researcher conjectured that<br />
the project coordinator’s actions reflect the members’ distrust of him as a leader. Also, as the government<br />
research station plans to provide financial assistance to the fish farmers of this organization, the project<br />
6
7<br />
TECHNICAL REPORTS: INVESTIGATIONS 2009–2011<br />
coordinator sought to prevent his members from meeting the actual source of the funding, perpetuating<br />
the allusion that the project coordinator himself is the supply line of assistance. The project coordinator<br />
spearheaded the fish farming efforts and is an aspiring politician, though currently not holding office.<br />
There is little evidence of meaningful interaction between the fish farming members of this association<br />
and its leaders. The general meeting scheduled to take place once a year did not occur last year or this<br />
year. Executive meetings attended by those in leadership positions occur as necessary. Technical<br />
meetings, which include the people involved in a specific project such as fish farming, took place once a<br />
week during production. During these technical meetings topics such as feed issues, the age and size of<br />
the fish, and problems that have arisen are discussed. Transparency with this core group of people<br />
involved in the fish farming is a challenge, especially as other members see the profits and become<br />
jealous. The inequality of benefit distribution is a source of members’ jealousy. The project coordinator,<br />
who facilitated the donations of feed and equipment as well as invested some of his own money, explains<br />
the distribution of benefits. He says, “People who have put in big investments must have the lion’s share.”<br />
It also seems that the leaders are intentionally unaccountable to the members. When asked if members<br />
pay dues, the chairman said, “They are doing voluntary work hoping to get a share of the proceeds. We<br />
have people who are ready to pay money to be members but we are not signing them up because we<br />
cannot take their money when there are no feeds because they will be asking ‘What is happening with our<br />
money?’ We have a very big number [who are interested] but we cannot accommodate [more members].”<br />
Thus, the members take no financial risk to purchase the necessary feeds and reap no reward. The project<br />
coordinator has a vested interest in limiting the risk that his members take: To have a failed harvest into<br />
which members invested their own resources would harm the project coordinator’s reputation and<br />
potentially decrease his political support in future elections.<br />
CASE STUDY TWO: “THE HELPING HANDS”<br />
The umbrella regional poverty alleviation organization has a fish farmer association of 88 members. The<br />
group’s formation was stimulated by the chairman’s enthusiasm for fish farming. Additionally, the<br />
chairman expressed that he organized the group to meet members’ needs and to access funding for<br />
projects. Some members own and maintain fish ponds, and others assist with a group pond. Several other<br />
charitable organizations have fish pond projects under the umbrella of the regional poverty alleviation<br />
organization. The fish farming members of “The Helping Hands” organization are preparing for a<br />
transition of emphasis from individually- and group-managed fish ponds to group management of a fish<br />
cage culture operation on Lake Victoria. The focus of our study was the structure of effort towards the<br />
potential transition to cage culture. Most of the interviewees were leaders of “The Helping Hands.”<br />
The fish farmer group typically holds meetings four times a year but gathers more frequently when<br />
preparing for a workshop or another unusual event. Currently, the fish farmer subset of “The Helping<br />
Hands” is not managing fish production collectively, but the chairman says they are ready to begin as<br />
soon as funds are available for that purpose. The chairman says, “As a management structure we have<br />
people in place but they are not functional (currently functioning). So the people are ready for when we<br />
have the money.” The chairman appoints leaders and their responsibilities are based on the individual<br />
leaders’ expertise. “Whoever has the ability of doing something does it voluntarily for the benefit of the<br />
group,” states the chairman. This commitment to community service is shared among the group, though<br />
to some degree each executive member stands to benefit financially or politically through their<br />
involvement in the group’s poverty alleviation projects.<br />
Political connections. Under the umbrella of “The Helping Hands,” and hence under its chairman, is a<br />
regional fish farmers association that encompasses local associations from four districts in eastern<br />
Uganda. The chairman unified them, saying, “These groups weren’t capacitated (empowered) because
TECHNICAL REPORTS: INVESTIGATIONS 2009–2011<br />
they were singular (working in isolation).” This integration followed a large fish farmer meeting with<br />
over 300 attendees organized by the chairman. At the meeting, the President’s assistant announced that<br />
the chairman would be the one to distribute information and assistance to the fish farmers in this region.<br />
Two aspects of this fish farmer meeting reflect the chairman’s political pull: the presence of the president<br />
of Uganda’s assistant and his pronouncement that the chairman of “The Helping Hands” will channel<br />
assistance to area fish farmers. Other examples further illustrate the chairman’s political power.<br />
The goal of “The Helping Hands” cage culture operation on Lake Victoria is to be a demonstration or<br />
model farm, which is a political status, and an achievement for which the chairman will potentially be<br />
credited and financially rewarded. In addition, the local government provided the group funds to acquire<br />
the necessary permits for operating cages on the lake. The minister of fisheries wrote on “The Helping<br />
Hands” behalf to the executive director of NAADS. Each achievement reflects the chairman’s access to<br />
influential politicians, the essence of political power.<br />
There are at least two perspectives on the political affiliation of the chairman and his fish farming<br />
aspirations. In a short-term view, political connections can lead to resources otherwise very difficult to<br />
procure, including permits, funding, and support for aquaculture activities. On the other hand, considering<br />
goals of sustainability, politicians’ goals are often incongruous with the goals of the development of<br />
commercial fish farmers.<br />
Cages first. The management approach that “The Helping Hands” organization uses for fish farmer<br />
development is rooted in its origins as a collectivity. The chairman says, “After all, it is up to everyone to<br />
look after the structure. Management is organized by the group and owned by the group.” The group<br />
manages community fish ponds and hopes to operate cages with the expectation that profits from these<br />
operations will be used to purchase additional cages and inputs for individuals to own their own cages.<br />
The chairman says, “At the beginning we feel like we should work as a team. As we grow and begin<br />
realizing profits we should support individuals in owning cages. They will be then capable of owning and<br />
managing their own cages.”<br />
The goal of “The Helping Hands” umbrella group is poverty alleviation and economic development. It<br />
appears that the activities and goals of the group are more charity-based than business-oriented. When the<br />
chairman was asked why he and his members wanted to be fish farmers, he said, “It is the farming that<br />
can help people of different abilities. Fish farming gives a chance to vulnerable groups including women<br />
who can’t go fishing by boat on the lake but can fish farm. It is an opportunity for the disabled, orphans,<br />
and the elderly. Also, fish farming can be done in teamwork. After all, it is up to everyone to look after<br />
the structure.”<br />
When asked what would evidence the success of his cage culture operations on Lake Victoria, the<br />
chairman said, “Being that cage culture is new, we expect that people will realize that it is good. We want<br />
to show a demonstration project. In the process of time, people, after learning from us, will apply<br />
knowledge on an individual level. They will arrange for their own permits. Success will be proved by<br />
individuals owning their own permits and cages.” At no point did the chairman mention profits as a goal<br />
or of evidence of success. Also, fish farming is discussed as a project, not as a business or an enterprise.<br />
This organization does not yet have a definite business plan, though they anticipate creating one.<br />
The chairman’s answers suggests that developing commercial fish farming enterprises is not a goal, but<br />
that his members are vulnerable people who want to add a fish farming project to their already long list of<br />
development projects. This attitude is reflected in the group members’ unwillingness to invest their own<br />
financial resources. The chairman says, “There have been no good examples of cage culture in lakes. So<br />
the members don’t want to invest their money.”<br />
8
9<br />
TECHNICAL REPORTS: INVESTIGATIONS 2009–2011<br />
The piecemeal approach to aiding vulnerable people seems to manifest itself in members of “The Helping<br />
Hands” who are involved in multiple operations to varying degrees, gaining some benefit from each. It is<br />
an example of development thinker Robert Chambers’ (1997) explanation that, for the poorest of the<br />
poor, livelihoods are “local, complex, diverse, dynamic, uncontrollable, or unpredictable.” Being a<br />
specialized, capital and input intensive, risky, long-term enterprise, commercial cage culture does not fit<br />
productively into this type of livelihood strategy.<br />
Uppers and lowers. Chambers’ (1997) discussion of “uppers” and “lowers” provides helpful terminology<br />
for describing and understanding the relationships of two types of members of “The Helping Hands.”<br />
“Uppers are people who in a context are dominant or superior to lowers. A person can be an upper in one<br />
context and a lower in another” (Chambers 1997 xvi). Conversely, “Lowers are people who in a context<br />
are subordinate or inferior. A person can be a lower in one context and an upper in another” (Chambers<br />
1997 xv). There appears to be a strong dichotomy between “upper” and “lower” members of “The<br />
Helping Hands”. Having the opportunity to spend time with members of both types, evidence of the<br />
interactions and expectations of the two groups emerge.<br />
There are members involved in “The Helping Hands” who can be termed “uppers;” they have more<br />
education (sometimes holding advanced degrees), their own fish farming operations, or have the<br />
resources to become fish farmers (including land, water, ponds, and money). We visited several of their<br />
fish farms, including one owned by a physician. These elite members see fish farming as an incomegenerating<br />
enterprise that they manage while hiring someone to provide the day-to-day management of<br />
ponds. They also see themselves as aiding members who are “lowers” in gaining income from fish<br />
culture. For these “uppers,” involvement in “The Helping Hands” organization introduced them to fish<br />
farming and provides access to training and some inputs for their fish farming enterprises as well as an<br />
opportunity to assist “lowers” in their community.<br />
Several of these “uppers” see a fish farming operation as part of an income-generating farm to which they<br />
will retire. One woman, also a physician, stated, “I will do pond culture when I retire. This will be good<br />
because I can employ people at home.” Her statement demonstrates the dual goals of personal income<br />
generation and providing economic options for local “lowers.” It also illustrates a conception of fish<br />
farming as a sideline activity or a hobby for the wealthy (Moehl 2006).<br />
“Uppers” in “The Helping Hands” are responsible for the management of the fish farms that the “lowers”<br />
operate on a day-to-day basis. In this way, “uppers” use their resources to aid “lowers” in the project work<br />
and potentially bring the “lowers” out of poverty. The avenues “uppers” use to aid “lowers” is in the<br />
procurement of funds for the group’s projects, the translation of technical information from English into<br />
Lusoga, the local language, and helping “lowers” procure and repay group-sourced credit. The chairman<br />
spoke to these relationships when responding to a question about the literacy levels of the members<br />
involved in fish farming, saying, “There are those (“uppers”) who are capable to help others, to explain in<br />
the language that they (“lowers”) understand. We are putting the literate at the forefront. A few should<br />
manage it (“uppers”). They do this on behalf of others (“lowers”).”<br />
Not surprisingly, we had much more interview time with the “uppers” of the group. When conducting<br />
interviews with “lowers,” “uppers” were always present and sometimes even attempted to guide the<br />
“lowers’” responses to questions. This occurred during interviews with the “lowers” who currently<br />
manage three very small lakeside ponds and potentially will manage cages on Lake Victoria. These group<br />
members live in a markedly poor lakeside community. When I asked why they want to be fish farmers<br />
and what they hope to gain from the fish farming enterprise, I received answers such as “The training<br />
interested me,” and “It is a business enterprise which will bring me money.” An “upper,” a physician,<br />
who will be assisting in managing the cage culture operation, interrupted the “lowers” and answered the<br />
question for them: “You get a cross section of people from the local community involved. They will be
TECHNICAL REPORTS: INVESTIGATIONS 2009–2011<br />
able to send their children to school, address the problem of malnutrition, and sell the fish for money.<br />
They all show interest and everyone benefits. There are two purposes: to grow food and sell fish for<br />
money.” The physician attempted to broaden the “lowers” limited, though pragmatic, views of benefits<br />
from fish farming to a view reflecting community-development goals. In the process, she silenced them<br />
and reinforced her superior social position.<br />
Patronage and paternalism. Further reinforcing the evidence of “uppers” and “lowers” embedded in this<br />
group’s dynamics is the distinct language of patronage that emerged in this case study alone. The first<br />
example is from the conversation between a fishery specialist and the chairman of “The Helping Hands”.<br />
After hearing that his project would be partially funded, he said, “I am so grateful that Madame<br />
(government specialist) has agreed to fund the project. I am grateful in this regard because we are<br />
becoming babies of Madame.” The uses of the supremely polite title “Madame” and the mother/children<br />
metaphor reflect a patronage relationship couched in deference, appreciation, and inferiority.<br />
Later, I observed the chairman in the opposite relationship in a strikingly similar conversation. The<br />
chairman of “The Helping Hands” and the middle-aged female chairman of the Uganda Society of the<br />
Disabled were speaking together among a group. The Uganda Society of the Disabled is a group that “The<br />
Helping Hands”’ chairman has aided in establishing pond culture as an income-generating project. The<br />
chairman of the Uganda Society of the Disabled said, “I can only thank [the chairman] for his effort. He<br />
offered us training and seed stock. I thank him very much. He is a loving father and is caring for us very<br />
much.” The man previously expressing becoming a “baby” of his own patron, a government fisheries<br />
employee, becomes a “father” of the group of disabled people to whom he provides assistance.<br />
Interestingly, in these patron relationships there is no discussion of or question as to the original source of<br />
the funds. To the one at the end of the assistance chain, it does not seem to matter if the money came<br />
from U.S. taxpayers, a private endowment, or a government agency. What emerges supreme is the<br />
deference to the individual immediately passing on financial assistance, reflecting the relational nature of<br />
assistance chains (Maranz 2001).<br />
Besides expressing appreciation, applying maternal and paternal vocabulary to relationships of patronage<br />
can be understood as a diplomatic, desirous strategy on the part of “lowers,” who employ this language to<br />
access resources available through patron relationships with uppers (Chambers 1997).<br />
CASE STUDY THREE: “THE FAMILY AFFAIR”<br />
In northern Uganda near the town of Gulu, the center of longtime civil strife is a fish farmer organization<br />
that operates a hatchery, produces fingerlings, and maintains a few grow out ponds. This fish farmer<br />
association began in 2004, though the chairman has been farming fish on his land since 1973, beginning<br />
with a small pond and adding another large pond in 1984. The chairman is a patriarch and is known to his<br />
family and his fish farmer association as “Mzee,” the Swahili word for “old and wise man.”<br />
In 2004, Mzee acted on the local fisheries officer’s suggestion to apply to a regional development fund to<br />
expand his ponds and build a hatchery. The assistance was specifically designated for farmer groups, not<br />
individual farmers. The original fish farmer association formed with 17 people, with 11 males and six<br />
females, significantly, all relatives of Mzee. Since then, the fish farmer association has grown to include<br />
more than 30 members, including non-relatives. In 2008, the president of Uganda visited the farm and<br />
gave money for the construction and management of grow-out ponds, where fingerlings are raised to a<br />
marketable size.<br />
Currently, five members own and manage their own ponds in addition to operating “The Family Affair’s”<br />
farm. Twelve of the fish farmer association’s members are Mzee’s relatives. The executive members<br />
10
11<br />
TECHNICAL REPORTS: INVESTIGATIONS 2009–2011<br />
include Mzee, who has been the chairman since the group’s inception in 2004, Mzee’s wife, who is the<br />
treasurer, a secretary, and five committee members. The group operates several bank accounts to<br />
safeguard and segregate money received from the fish farm’s operation, donors and other enterprises.<br />
Other enterprises include operating an orphanage, beekeeping, and cattle production.<br />
It is an understatement to say that the recent history of northern Uganda has resulted in a population with<br />
considerable needs. The challenge of developing commercial fish farmer associations is great. The<br />
fisheries value chain manager for an external aid project sums it up, saying, “In the north, people have<br />
been receiving handouts for 20 years. It is a difficult pattern to break.” However, the linking of<br />
prospective producers to their home land can be a positive characteristic of fish farming over enterprises<br />
that are not place-based. The secretary of “The Family Affair” PO and an external aid project employee<br />
says about the members of the new fish POs, “They are constructing their own ponds so they feel as if<br />
they own them.” Ownership and land improvement may facilitate these new fish farmers’ success. Still,<br />
given the recent devastation of this entire region and the obvious physical and emotional needs of its<br />
inhabitants, our conversations about business plans, feed conversion ratios, and pond construction seemed<br />
surreal and totally irrelevant. The proposition of rebuilding a region that had little in the way of economic<br />
and infrastructure resources even before the decades-long reign of civil terror is a formidable one.<br />
Orphan care. “The Family Affair” PO formed in 2004 when violence in the region was raging and many<br />
children were in need. Over half of the population of Uganda is under age 15, and only 2.1 percent of<br />
Ugandans are over the age of 65 (CIA World Factbook 2010). The chairman speaks of the challenges of<br />
that time, saying, “In that time we felt some difficulties to care for the young ones.” Mzee’s brothers died<br />
of HIV/AIDS, leaving him to care for their orphaned children. “Many houses in the community are left<br />
with orphans.” Two systems simultaneously demand that the chairman cares for his orphaned nieces and<br />
nephews: one is a system of traditional responsibility, where the duty of caring for a deceased brother’s<br />
children falls to brother, and one is an incentive system where receiving donor or government funds<br />
depends on performing the role of orphan-caretaker. Mzee says, “We chose to work with orphans because<br />
these government structures of assistance require that we reach cross-cutting issues. It is the first step to<br />
get the money.”<br />
Financial returns from the fish farm’s operations are invested into the orphans who receive training in<br />
marketable skills, as well as contribute to the farm’s operations. “We’ve paid (school) fees for the orphan<br />
children. Some of them are now doctors and teachers,” says the chairman’s wife. It is unclear whether the<br />
fish farm revenues or development assistance received paid the orphans’ tuition. Job skills are another<br />
benefit the orphans receive. Mzee says, “One of our targets is to get some machines to employ orphans.<br />
We can build a workshop. We give them school fees and during the breaks we keep them busy making<br />
bricks and training them in that skill.” Orphans are also employed to dig fish ponds, an activity that<br />
dovetails nicely with the WFP “food for work” approach. This approach requires that the community do<br />
the manual labor by digging the ponds, and the WFP supplies the inputs of seed and feeds.<br />
Meetings and records. “The Family Affair’s” executive committee meets monthly. The chairman says,<br />
“In these meetings we plan, distribute roles, plan for training of other farmers, see what work is done, and<br />
see difficulties in the communities within the two districts (Amuru and Gulu). During these meetings the<br />
executive committee makes decisions allocating their funds, giving money to the most urgent need,<br />
whether that is school fees, fish ponds, feeds, or another need.” The entire group of over 30 meets two<br />
times per year. Several files are kept by the executive committee and the farm manager, including money<br />
received from donors and fish farming operations, fry sales, feeds, and a record of each meeting’s events.<br />
The chairman comments on the records kept for pond management, saying, “For the feeds file, for<br />
example, we record amount of feeds bought, their cost, the source, and quantity daily given to the fish.”
TECHNICAL REPORTS: INVESTIGATIONS 2009–2011<br />
Development agencies. One large donor-funded project uses a Farmer Field School (FFS) approach to<br />
provide technical assistance. This extension mechanism is an interactive, on-farm learning experience<br />
designed to educate farmers, enhancing their ability to make informed decisions concerning their own<br />
farm’s management (van den Berg 2004).<br />
“The Family Affair” PO will conduct a FFS on every topic of fish production and sale, including value<br />
addition, with two members from each PO attending each training session. In addition to educational<br />
services that “The Family Affair” PO has been entrusted to provide the groups, the chairman describes the<br />
inputs that “The Family Affair” PO will supply to the other POs in kind; “We will help them with money<br />
for feed and fry, for every group. For each group we will want to have 3,000 square meters of ponds.”<br />
“The Family Affair” PO employs extension personnel to provide on-farm advising to the 22 POs.<br />
It is clear that “The Family Affair” PO’s activities in developing producer associations and using the<br />
farmer field school approach are dictated by donor project goals and requirements. A representative of an<br />
external donor project said, “We are trying to look at farmers as our entry point, but not individual<br />
farmers. If we worked with individual farmers it would take us 70 years to accomplish our goals. That is<br />
why we are looking at farmer groups – we call them producer organizations – of those who are<br />
commercially minded and commercially oriented.” Commenting on the farmer field school approach, he<br />
says, “We bring farmers together for the farmers to identify their own problems and identify solutions<br />
together and help link them to other farmers.” The “linking” of farmers through “The Family Affair” PO<br />
would not have occurred without direction from the donor agency. A Family Affair PO member and<br />
donor project technician says, “We are currently working with groups because it is easier for outreach and<br />
accessing government assistance.”<br />
This service that “The Family Affair” PO provides to the regional POs will prospectively perpetuate “The<br />
Family Affair” PO’s business model. The secretary said, “We hope to train 600 fish farmers, create<br />
demand for our seed, our feeds, and our factory that we hope to build… We need all those we train to<br />
become commercial fish farmers so they will come in by themselves and continue to buy feed and fry<br />
from us.” When the secretary was asked for his assessment of the POs that “The Family Affair” PO is<br />
developing, he said, “We believe they will stand on their own after (the large donor-funded project).<br />
According to our vision, all the groups will still continue getting fingerlings from us.”<br />
The secretary of “The Family Affair” PO is also the project manager employed by a donor project, and he<br />
provided insight on previous problems encountered with working with fish farmer groups. “(Pond)<br />
management is not done well. There is variation in feeding because many people are feeding.” He also<br />
speaks of the challenges associated with people transitioning from Internally Displaced Persons (IDP)<br />
camps back to their homes, where they attempt to establish farming enterprises, saying, “One of the<br />
problems was that some of the groups were formed in the camps where people are together but not<br />
necessarily from the same area. So when they leave the camps they are living in distant places. This was a<br />
problem in 2007 with the NAADS groups.” NAADS, Uganda’s National Agricultural Advisory Service,<br />
provides financial assistance and training to a spectrum of agricultural producer groups. Also, he sees<br />
problems with individuals joining groups without a commitment to fish farming: “All of them should<br />
have an interest in fish farming, not just the project.”<br />
Goals. When asked about the goals of their producer organization, all executive members interviewed<br />
listed construction or infrastructure-based goals that they aim to achieve if donor funding is ascertained.<br />
The treasurer, Mzee’s wife, cited their need for a water heater for the hatchery, as the solar heater does<br />
not supply heat at night. When asked when he hopes to build more ponds, Mzee replied, “You will tell me<br />
when you say if you support me.” Currently, the hatchery built in 2004 is being renovated through<br />
assistance from the external donor project. The chairman stated their three year goal, which is to build a<br />
feed mill, and a five year goal, which is to build a fish processing factory for exporting fish to Sudan.<br />
12
13<br />
TECHNICAL REPORTS: INVESTIGATIONS 2009–2011<br />
They also anticipate building dormitories and a guest house for those who come to be trained, as well as a<br />
structure to house a formulated feed outlet. They would like to build a workshop where the orphans can<br />
learn job skills, as well as construct a swimming pool for recreation. Construction of ponds is currently<br />
undertaken in anticipation of future donor funds, both for ponds currently under construction and a<br />
reservoir. The chairman says, “For us, we keep on making ponds. We are still looking for phase two of<br />
NUSAF.” NUSAF stands for Northern Uganda Social Action Fund, the regional funding agency that first<br />
encouraged “The Family Affair” to form a group.<br />
“The Family Affair” PO’s fingerling sales goals are secondary to their infrastructure development goals.<br />
This is partially a result of a decreased fingerling market and partially a result of a distorted incentive<br />
system inherent in development assistance. Aid programs favor construction projects rather than<br />
profitability of enterprises in natural markets.<br />
Fingerling sales. “Between 2004 and 2006 fish farming in northern Uganda had gone down and is now<br />
beginning to increase,” says a Family Affair PO member and a LEAD-employed fish farming technician.<br />
In 2009, “The Family Affair” PO produced 40,000 fingerlings, 30,000 of which were purchased by<br />
organizations, including the Food and Agriculture Organization of the United Nations (FAO), AT Uganda<br />
Ltd, a national NGO, and the African Development Bank (ADB). Only one producer organization<br />
purchased fingerlings from “The Family Affair” PO in 2009.<br />
Since 2004 “The Family Affair’s” business structure has been built on accessing donor funds. This<br />
requires that “The Family Affair” align their producer organization’s goals to the donor’s goals. Even the<br />
sales of the fingerlings they produce demonstrate the donor saturation in this region of Uganda: 75<br />
percent of “The Family Affair’s” fingerlings are sold to aid organizations. Natural markets are not at work<br />
here, but given the social and recent-historical context of this region, it may be some time before natural<br />
markets emerge as driving economic forces.<br />
CASE STUDY FOUR: “THE COOPERATIVE SOCIETY”<br />
“The Cooperative Society”, located in western Uganda, began in 2004 when several members were<br />
invited by the minister of fisheries for training at the Fisheries Training Institute (FTI) in Entebbe. The<br />
commissioner told them to form groups “in order to be heard and known by government and NGOs.” Ten<br />
members went for training and upon returning spoke with interested friends and neighbors and began<br />
organizing. First, the group registered as an association but changed their registration to a cooperative<br />
society at a minister’s recommendation. The group is currently registered at all levels, from the local<br />
council one, or village level, up to national level, with the Uganda Cooperative Alliance (UCA). This<br />
cooperative society is overseen by the head of the Uganda Fish Farmers Cooperative Union and receives<br />
technical assistance from the county fisheries officer, who attends gatherings, answers farmers’ questions,<br />
addresses fish farming problems, and makes farm visits. “The Cooperative Society” also receives some<br />
assistance from Uganda Cooperative Alliance and the Ugandan government in the form of fingerlings and<br />
training.<br />
“The Cooperative Society’s” 90 members include men, women, and youth, with members coming from<br />
four sub-counties within the district. Leadership offices are elected positions, and include chairman, vice<br />
chairman, treasurer, general secretary, publicist secretary, advisors, and committee members.<br />
Differences between the leaders and members. Two focus group interviews, one with the positional<br />
leaders and one with a subset of the members, indicate that there are differences between the members<br />
and leaders concerning benefits received from their cooperative society activities and involvement in<br />
other types of farming groups and cooperative societies. For example, when asked what other agricultural<br />
producer groups they were involved in, the leaders listed beekeeping, dairy production, banana wine<br />
processing, organic pineapple, coffee production, poultry production, tree planting, and animal husbandry
TECHNICAL REPORTS: INVESTIGATIONS 2009–2011<br />
as the principle activities of other groups of which they are a part. The members listed poultry production,<br />
beekeeping, and banana production, which are agricultural activities that require less up-front capital and<br />
with less value-addition components than the leaders’ activities.<br />
There are also differences between the leaders and the members of “The Cooperative Society” concerning<br />
sources of motivation for joining the group, level of satisfaction with their fish farming enterprises, and<br />
extent to which their expectations of the group, the government, and NGOs have been realized. Leaders<br />
showed higher levels of satisfaction with their fish farming operations, which is probably related to the<br />
fact that leaders had been fish farming longer and had larger fish farming operations than the members, on<br />
average. Throughout the discussion leaders’ and members’ often disparate attitudes are noted.<br />
Importantly, leaders were significantly older individuals than the members.<br />
Benefits of membership. One of the primary goals of fish farmer associations is to meet member<br />
farmers’ technical shortcomings. Therefore, an assessment of farmers’ perceived deficiencies in fish<br />
culture practice and how these are addressed by fish farmer organizations is a good measure of the<br />
viability of a producer organization, especially as it pertains to long-term farmer involvement and growth.<br />
Farmers in “The Cooperative Society” identified deficiencies in several areas crucial to their fish farming<br />
operations.<br />
First, farmers acknowledged lack of inputs, specifically feed and fingerlings. “The Cooperative Society,”<br />
through connections with the government and Uganda Cooperative Alliance (UCA), are sometimes given<br />
fingerlings for distribution to members. However, these have been given in insufficient quantities or are<br />
of low quality and promises of fingerlings are often not met. When farmers purchase their own<br />
fingerlings, “The Cooperative Society” also plays a beneficial role by decreasing each farmer’s cost<br />
through bulk purchase of fingerlings and sharing transportation costs.<br />
Farmers also require fingerlings of high quality, which refers to each fingerling’s size, viability after<br />
stocking, and subsequent growth rate. In terms of procuring fingerlings of high quality, the collective<br />
knowledge, experience, and social capital of the individuals in the producer organization gives farmers<br />
access to better fingerling producers and excludes others who peddle poor quality fingerlings. In the same<br />
way, the member-farmers who purchase formulated feeds share transportation costs and collectively<br />
negotiate for bulk prices. In the future, “The Cooperative Society” aims to serve as a large poultry<br />
company's feed vendor for the western regions, which will provide income and further reduce feed costs<br />
for members. Member-farmers who are not yet at a scale of operation to purchase formulated feeds<br />
receive instruction in making feeds from locally-available ingredients.<br />
Financial shortcomings were at the forefront of member-farmers’ stated deficiencies. Many farmers have<br />
yet to realize profits from their fish farming operations, though all of them have harvested fish for<br />
household consumption. All fish farmers expect profits, and most members who have operated for two<br />
production cycles reported generating profits. In addition to teaching productive pond management, the<br />
producer organization aids farmer-members in achieving profits through collectively marketing farmers’<br />
fish, reducing the time the farmer must spend searching for buyers, as well as reaching the best possible<br />
price. Farmers also receive advice on marketing and pricing their fish.<br />
Farmers with a desire to expand their fish farming operations find access to capital to be a problem,<br />
especially in terms of credit and land; lack of capital is often an inhibiting factor in improving their fish<br />
farm’s productivity. The producer organization, while not currently aiding farmers in accessing credit,<br />
hopes to increase resources to the point of providing production-cycle loans to member farmers.<br />
One way that “The Cooperative Society” acts as a financial safety net is through an emergency fund that<br />
it maintains for its members. Farmers annually pay into this revolving fund and are able to access small<br />
14
15<br />
TECHNICAL REPORTS: INVESTIGATIONS 2009–2011<br />
loans to pay unexpected bills unrelated to fish farm operations, such as a death in the family or hospital<br />
bills. In this way, “The Cooperative Society” also functions as a burial society, one of many such societies<br />
to which farmer-members may belong. Burial societies serve an important function in terms of civil<br />
society and financial security (Makumbe 2002). Thus the cooperative provides broader social and<br />
economic benefits to its members beyond inputs and guidance for fish farming.<br />
In fish farming training, farmers were eager to learn environmental improvement techniques that they<br />
integrated into their fish farming operations. They mentioned water harvesting and decreasing erosion<br />
through pond side tree planting as conservation efforts they employ. Leaders in “The Cooperative<br />
Society” identified human capital-enhancing skills they developed while occupying elected positions.<br />
These included skills in business, leadership, communication, English, marketing, learning from one<br />
another in the group, hearing new ideas from outsiders, and growing in personal confidence.<br />
Fish farming as status symbol. A common benefit cited both the leaders and members of “The<br />
Cooperative Society” derived from their fish farming enterprises as well as through leadership positions<br />
they held in “The Cooperative Society” the status in the community. Farmers take great pride in their fish<br />
farming enterprises. This pride is reflected in the physical care and management of ponds, evidenced by<br />
the well-kept grass, as well as the ways the farmers use their fish. The act of a farmer serving fish he or<br />
she had raised at a special event, such as a child returning home from boarding school, or to important<br />
people, like visitors, is both a demonstration of achievement and status and a source of farmer pride.<br />
A special meal is usually served to children returning from boarding school and fish farmers who are able<br />
to serve fish are offering their children a treat: “Fish is something they never would have eaten at school.”<br />
Also, fish farmers discussed how their fish ponds improved the appearance of their homes. Ponds<br />
demonstrate the ability to develop their resources and this physical evidence increases their neighbors’<br />
perception of the farmers’ success. One fish farmer said, “A neat and well-organized home is a symbol of<br />
status.”<br />
The ability for fish farming households to feed fish to their families is also a source of pride as they<br />
actively provide nutritious, high-value foods for their children. Farmers who were receiving income from<br />
their ponds spoke of the increased prestige that their improved incomes brought as well as the ways they<br />
invested this income into land and education. One farmer mentioned expanding his land holdings as a<br />
result of fish-based income. Several spoke of the pride they felt from sending their children to boarding<br />
school with income from their ponds. Finally, farmers were proud to be able to share fish harvests with<br />
their disadvantaged neighbors, knowing that they had a nutritious, valuable food to offer. While farmers<br />
cited compassion and empathy as reasons for gifts of food to poor neighbors, sharing fish is also an<br />
important demonstration of agency and wealth.<br />
Leadership. Discussions with the leaders revealed the status conferred on elected cooperative society<br />
leaders. Being elected to a position in a society is public recognition of status and affords opportunities to<br />
further improve status. Fish farmers holding leadership positions in “The Cooperative Society” talked<br />
about the business and communication skills they had gained through their roles. One man who had<br />
limited schooling was able to improve his English through interchanges with more educated peers. Also,<br />
leaders are often nominated to go to training and bring back the information they received to share with<br />
the members. The opportunity of learning information first and presenting it to members at a meeting<br />
reinforces the leaders’ status.<br />
Several leaders are retired. In Uganda, government employees are required to retire at age 60. After<br />
retirement, their community involvement and status usually decreases. Involvement in “The Cooperative<br />
Society” is a means of maintaining their community-serving and active lifestyle. One woman, a retired<br />
teacher and committee member who proudly pointed out her former students among the members, shared
TECHNICAL REPORTS: INVESTIGATIONS 2009–2011<br />
the confidence and influence she maintains post-retirement through her involvement in this organization.<br />
She holds a leadership position and therefore a responsibility to be busy and engaged. She says, “I am<br />
able to pick up my nice dress, put it on, and I forget my old age.”<br />
Leaders articulated several key areas where networking and advocating for the fish farming sector are<br />
important responsibilities of their producer organization. Consistent with the society’s goal of addressing<br />
farmer deficiencies, the leaders seek to “Work together to solve the challenges of fish farmers with one<br />
voice.” In order to unite the fish farmers’ voices the leaders have sought out relationships with fish<br />
farmers outside their producer organization and thus built social capital. The president boasted, “Now we<br />
know all the fish farmers in the entire county.”<br />
The leaders interact with individuals and groups who have resources that their member famers need.<br />
These resources include fingerlings and training and are sought through relationships with government<br />
officials, foreign donors, and the UCA. With an understanding of the linkages between fish farming and<br />
other development arenas, the leaders have aligned their fish farming goals with goals such as poverty<br />
alleviation, environmental preservation, and malnutrition, especially as it is experienced by HIV/AIDS<br />
victims. Advocating for the fish farming sector includes recruiting new fish farmers, and “… spreading<br />
the message that households with land and water can earn good incomes through fish farming.” Thus the<br />
logic and objectives of the donor shape the direction of the cooperative.<br />
The Cooperative Society leaders actively plan to expand its presence as a locus of fish farming<br />
specialization. They state that the society’s success is built on the member-farmers’ success, which<br />
explains why their first goal is to increase all members’ fish production and thus, household income. For<br />
some, increases in income from fish farming have already lead to sums sufficient to purchase more land<br />
to expand fish farming operations and pay children’s school fees. Plans to rent an office space, sell<br />
formulated feeds, and offer production-cycle loans to members are all part of their vision to increase<br />
member-farmers,’ and therefore “The Cooperative Society’s,” success. Leaders also articulated several<br />
community-development goals, such as creating opportunities for local youth with little education to earn<br />
incomes from pond construction and a fish consumption goal for the community to which they belong.<br />
One leader cited the FAO nutritional recommendation that individuals eat fifteen kilograms of fish per<br />
year, and her vision is for the fish farmers in “The Cooperative Society” to supply that amount of fish for<br />
local consumption.<br />
PART II: CAGE CULTURE TRIALS<br />
Following group member meetings and training on stocking and management of the cages discussed<br />
above, the group was set out to grow their first lot of fish. The results presented below are based on the<br />
data collected up to day 84 following stocking of the cages. This is the last time sampling was carried out.<br />
The results thereafter are a projection based on the previous sampling.<br />
16
Weight(kgs)<br />
Biomass(kgs)<br />
grow th performance<br />
300.00<br />
250.00<br />
200.00<br />
150.00<br />
100.00<br />
50.00<br />
0.00<br />
0 42 63 84 105<br />
Time(days)<br />
C1 C2<br />
Biomass and carrying capacity of cage 1<br />
300.00<br />
250.00<br />
200.00<br />
150.00<br />
100.00<br />
50.00<br />
0.00<br />
0.00 42.00 63.00 84.00 105.00<br />
Time(days)<br />
25.00<br />
20.00<br />
15.00<br />
10.00<br />
wt Kg/m3<br />
Figure 2. Figure 3.<br />
5.00<br />
0.00<br />
Carrying capacity (Kg/m3<br />
17<br />
TECHNICAL REPORTS: INVESTIGATIONS 2009–2011<br />
Figure 1. Growth performance<br />
The graph shows growth performance of cage 1 (C1) and Cage<br />
2 (C2). The biomass of cage 1 and 2 increased exponentially<br />
for the first 2 weeks but later the biomass of cage 1 decreased<br />
on day 84 and eventually increased on day 105.<br />
The significant drop of biomass in cage 2 was due to fish that<br />
escaped through holes that were discovered on the net bag.<br />
However, the biomass of cage 2 increased at a relatively<br />
constant rate reflecting a steady fast growth up to day 105.<br />
This was an indication of normal growth.<br />
Weight(kgs)<br />
300.00<br />
250.00<br />
200.00<br />
150.00<br />
100.00<br />
50.00<br />
0.00<br />
Biomass and carrying capacity of cage 2<br />
0.00 42.00 63.00 84.00 105.00<br />
Time(days)<br />
wt Kg/m3<br />
The figures above compare the biomass of cages 1&2. Figure 2 shows an exponential increase in the<br />
biomass of cage1 together with its carrying capacity. However the biomass on day 84 decreased as well as<br />
its carrying capacity. This was because when fish escaped there was a reduction in numbers, total weight<br />
and the carrying capacity per m 3.<br />
40.00<br />
35.00<br />
30.00<br />
25.00<br />
20.00<br />
15.00<br />
10.00<br />
5.00<br />
0.00<br />
Standing crop(kg/m3)
TECHNICAL REPORTS: INVESTIGATIONS 2009–2011<br />
Figure 4 shows biomass and carrying capacity of cage 2 increasing at almost the same rate for a period<br />
105 days. This was because this cage experienced low mortalities and no fish escaped hence maintaining<br />
a favorable stocking density.<br />
Feed Conversion Ratio<br />
4.50<br />
4.00<br />
3.50<br />
3.00<br />
2.50<br />
2.00<br />
1.50<br />
1.00<br />
0.50<br />
0.00<br />
Abw(gms)<br />
160.00<br />
140.00<br />
120.00<br />
100.00<br />
80.00<br />
60.00<br />
40.00<br />
20.00<br />
0.00<br />
Feed Utilisation<br />
8.10 78.85 138.65 159.05 209.50<br />
Fish grow th<br />
Biomass<br />
C1 C2<br />
0.00 42.00 63.00 84.00 105.00<br />
Time(days)<br />
C1 C2<br />
Figure 4. Feed utilization: The graph shows utilization<br />
of feed by cage 1 & 2 with increasing average biomass.<br />
At average biomass 78.85 the FCR of cage 1 & 2 is less<br />
than 0.5 because the fish supplement their diet with<br />
natural food which is mostly phytoplankton.<br />
Cage 2 showed a steady increase in FCR together with increasing biomass from 78.85 to 209.5 kg. This<br />
indicated that almost all feed eaten by the fish was converted into body weight. This rendered them more<br />
efficient at digestion and utilization of feed as compared to cage 1.<br />
However, cage 1 shows a sharp increase in FCR with increasing biomass from 78.85 to 159.05 kg. This<br />
could have been due to fish escape to the wild. As a result, most of the feed administered during this<br />
period was in excess and wasted to the lake as uneaten feed.<br />
These graphs emphasize the importance of sampling as a key aspect in monitoring current fish biomass.<br />
This enhances determination of right quantities of feed that should be administered hence minimizing<br />
losses due to applying excess feed.<br />
Figure 5. Average body weight with time: The graph<br />
above compares size of fish in cage 1 & 2. Initially the<br />
growth of these two cages is almost the same. However,<br />
day 84 shows cage 2 with a faster growth than 1. The<br />
faster growth was due to lower stocking density in cage<br />
1 due to fish escapes. This resulted in less competition<br />
for available resources like food. As a result growth was<br />
accelerated in cage 1 than 2.<br />
18
19<br />
TECHNICAL REPORTS: INVESTIGATIONS 2009–2011<br />
The average weight attained in both cages within 84 days is about 100g. This size is more than most of<br />
the undersize capture fish sold at an informal landing site at Kirinya, an illegal fish business between<br />
fishers and wives of prison warders 2 .<br />
Small holder farmer group organization. Jinja United Group Initiative for Poverty Alleviation and<br />
Economic Development (JUGIPAED) secured most of the key requirements (water quality parameters,<br />
permit, site, market information), to start a project on cage fish farming on Lake Victoria. Later, the group<br />
entered into partnership with the Aquaculture Research and Development Centre, Kajjansi with funding<br />
from <strong>AquaFish</strong> <strong>CRSP</strong> to carry out cage fish farming at Kirinya. The partnership is on a cost sharing basis<br />
and it is intended to provide a kick start to implementation of cage culture project agreed upon by the<br />
group members while at the same time carrying out research in cage culture. The rationale for this<br />
approach is demonstration of fish farming as a business, hence the need for the group to contribute to the<br />
costs of the enterprise and learn how to manage their cash flow.<br />
Stutzman (2010) observes that aquaculture development commentary supports the formation of fish<br />
farmer associations or producer organizations as avenues for cultivating small- and medium-scale<br />
commercial farmers. Umbrella organizations under which local fish farmer associations vertically align<br />
themselves have important implications for fish farmer production. Formation of small holder farmer<br />
group organizations has been encouraged by government of Uganda in order to ease provision of various<br />
services particularly technical advice and inputs such as seed. Some of these farmer organizations have<br />
initiated self-help activities carried out as a group most notably savings and credit. When JUGIPAED<br />
decided to engage in cage culture, the members used their collective savings in the group’s account to<br />
cover their share of items that were agreed upon as per the MoU. These items included feed, labor, and<br />
any other expenses such as communication and transport costs to the site.<br />
However, as earlier noted by Stutzman (2010), group cohesion and participation by all group members<br />
seem to be a challenge. This stems from the fact that groups tend to front numbers in order to attract<br />
support from government or donors, hence actual group activates are often engaged in by just a few<br />
members and not all listed in the group’s register. However on the other hand, group managed activities<br />
are in themselves a challenge especially if there are uncertainties on issues such as the potential risks<br />
involved and benefit sharing. Consequently only a few members keep the work moving.<br />
Cash flow management. A draft enterprise budget to guide the trial was drawn by the project team and<br />
discussed with the group members. During the discussions, inputs to be contributed by either party were<br />
agreed upon and included in the MoU. During the trial, the chairman and treasurer of the group kept all<br />
the records pertaining to cash flow. The records showed sources of funds which are mainly members’<br />
contributions. The project team also availed group members with information on cost of items contributed<br />
by the project. Discussions were held with group members on the variable costs incurred for cage<br />
operations up to day 84.<br />
2 The business emerged shortly after the cages had been stocked.
TECHNICAL REPORTS: INVESTIGATIONS 2009–2011<br />
Table 2. Operating costs of managing the cages for 3 months<br />
Input description Unit cost (UGX) Total cost (UGX)<br />
2030 fry 80 162,400<br />
132 kg of feed 2167 286000<br />
Labor for feeding per month 50,000 150,000<br />
Transport by members 8,000 60,000<br />
Total 658,400<br />
Basing on UGX400 which is the average price of the 80-100g tilapia fish sold at Kirinya, we estimated<br />
that the anticipated revenue from the 209.5kg from cage 2 to have been UGX 836,000 culminating in a<br />
profit of UGX177,600. However, if the fish were to be sold by a kilo at UGX 3,500, the revenue would<br />
have been UGX731,500 making a profit of UGX73,100. This indicates that it is profitable to sell fish at<br />
the smallest market size as long as positive returns above variable costs can be attained.<br />
CONCLUSION<br />
Across cases, several similarities emerge. Each fish farmer association operates in an area of high<br />
potential for aquaculture in Uganda. Fish farmer associations are place-based, with members from a<br />
defined geographical region. Each operates in an umbrella group structure. That is, each fish farmer<br />
association has other farmer associations “under” it or has an organizational structure “over” it. Also, no<br />
full-time fish farmers emerged from the groups examined; all group members and leaders stated that they<br />
are involved in other agricultural producer groups, with many individuals involved in three or more<br />
agricultural producer groups. For only one fish farmer association, “The Family Affair”, is fish farming<br />
the primary economic enterprise for executive members, and even this fish farmer association is involved<br />
in other agricultural activities.<br />
The thread of misdirected development assistance runs through each of the following categories of<br />
discussion. It should go without saying that the primary goal of a fish-productive aquaculture producer<br />
organization cannot be orchestrating its activities to qualify for the most donor assistance possible.<br />
Nonetheless, there are multiple aspects at play in the relationships between each of the fish farmer<br />
associations examined and funding agencies (both governmental and NGO). These relationships are<br />
considered in light of the ways the structures they produce aid or inhibit fish farmer associations in<br />
strengthening profitable, commercial member farmers.<br />
Specifically, across cases, the catalyst for group formation influenced each producer organization’s goals<br />
and priorities, as well as members’ expectations. Members’ expectations are shaped by the promises of<br />
the government official encouraging the individuals to form a fish farmer association. Also, catalysts for<br />
group formation and subsequent priorities and goals are directly related to members’ fish production. Fish<br />
farmer association goals and priorities determine whether or not the member farmers and leaders view<br />
their activities and enterprises as successful. In instances where the goal of engaging in fish culture is to<br />
receive money rather than generate income, success is not measured in fish production, but in the amount<br />
of money received (Grivetti 1982).<br />
Across cases, every producer organization formed based on the advice or encouragement of government<br />
officials and group formation was related to receiving funding for the producer organization’s activities.<br />
Though no case besides “The Family Affair” kept concrete production records for their organization,<br />
based on farmers’ assessments of production and profitability, some conclusions can be drawn about the<br />
connection between donor support and fish production or fish farm profitability.<br />
20
21<br />
TECHNICAL REPORTS: INVESTIGATIONS 2009–2011<br />
“The Unaccountable Leaders” worked through an existing community based organization (CBO), an<br />
association dedicated to environmental conservation, in order to receive government support for their fish<br />
farming activities. However, there is no system or mechanism for equitable distribution of benefits among<br />
members of this group-managed fish farm, even though much of the funding comes from government<br />
agencies or donors. The fish farming project coordinator says, “People who have put in big investments<br />
must take the lion’s share,” implying that the project coordinator himself, who arranged for the funding,<br />
was the “lion.”<br />
“The Helping Hands” producer organization was made up of a subset of members of a regional<br />
organization focused on poverty alleviation. When the chairman was asked why this organization was<br />
formed, he replied, “The idea was to serve the needs of the members of the group and to get creditors.”<br />
This group works with cross-cutting issues, in response to donor goals; in order to receive funding from<br />
NAADS, the group must provide HIV/AIDS education to its members. This producer organization has<br />
received or sought funds from donor-funded projects, as well as local government agencies. Because this<br />
organization has not begun cage farming no assessments can be made about fish production.<br />
“The Family Affair” was a functioning fish farm for 30 years, from 1973-2004, and operated by an<br />
individual and his family, until a district fisheries officer advised the farmer to organize as a group in<br />
order to be eligible for regional, government-sourced funding. Still, many members of this producer<br />
organization are the chairman’s family. Besides accessing funding based on having a group structure, the<br />
name of the association includes the word “orphan,” which expands the chairman’s entitlement to donor<br />
funds. The chairman’s brothers died of AIDS, leaving him with the responsibility of providing for his<br />
nieces and nephews. When asked about the organization’s connection to orphans, the chairman said, “We<br />
choose to work with orphans because these government structures of assistance require that we reach<br />
cross-cutting issues. It is the first step to get the money.” This producer organization has received funds<br />
from a regional funding agency, WFP, and USAID.<br />
“The Cooperative Society” began as an association, but the leaders changed their organization’s<br />
registration after the minister of fisheries advised them to form a cooperative society. This registration<br />
change allowed them to receive assistance (or, the promise of assistance, as many promises have not been<br />
fulfilled) from the Uganda Cooperative Alliance (UCA).<br />
Each producer organization operated within a larger umbrella structure, where fish farmer associations are<br />
affiliated with a larger organization: “The Unaccountable Leaders” producer organization is under a<br />
regional association dedicated to conserving environmental resources; “The Helping Hands” is a sub-set<br />
of members of a poverty alleviation organization who share the goal of cage culture, as well as a regional<br />
administration and funding structure of fish farmer groups throughout the region; “The Family Affair”, at<br />
the mandate and expense of external donors, is overseeing the development of 22 other fish producer<br />
organizations s; and “The Cooperative Society” is a regional producer organization under the umbrella of<br />
the Uganda Fish Farmers Cooperative Union, and also registered with the Uganda Cooperative Alliance.<br />
The impacts of these “groups within groups” structures require further study, though some important<br />
elements emerge from our research.<br />
From the four cases examined, the most significant impact of the umbrella structures was that the goals of<br />
the “umbrella” organization color the goals of the groups they “cover.” When this “cover” is tied to<br />
financial support, the goals become mandates. Often, the goals of the funding agency do not include<br />
developing commercial fish farmers, though this may be a primary goal of the producer organization.<br />
Funding agencies’ directions can potentially distract producer organizations from their objective of<br />
developing productive fish farmers or promote strategies that are ineffective in practice. Part of the reason<br />
for this promotion is that fish farming is touted by government officials as a profitable farming enterprise
TECHNICAL REPORTS: INVESTIGATIONS 2009–2011<br />
that anyone can do. The perception is: men and women, able-bodied and disabled, wealthy and poor,<br />
widows and orphans, everyone can earn money from fish farming. While most successful fish farmers<br />
and technical experts seriously question the validity of that perception, government officials still design<br />
and fund projects to organize fish farming projects connected with reaching unrelated goals. Examples of<br />
funding agency goals unrelated to productive fish farmer development include reaching cross-cutting<br />
issues such as providing HIV/AIDS education and reaching vulnerable populations (i.e. women, orphans,<br />
and disabled people). An example demonstrates the ineffective strategies of one of these efforts: a fish<br />
farmer group made up of disabled people operating under “The Helping Hands” producer organization<br />
cited problems with physical mobility as one of their major constraints to operating a profitable fish pond.<br />
Their mobility-related disabilities prevented this group from efficiently managing their ponds. According<br />
to their production records, the group of disabled people found fish farming financially unsustainable and<br />
plans to abandon production.<br />
However, fish farmers’ ability to improve the lives of the poor is not only accomplished through training<br />
vulnerable people as fish farmers, and may not require funding agency dictates. The producer<br />
organization with the least donor support, “The Cooperative Society”, addressed cross-cutting issues<br />
quite differently than “The Helping Hands” or “The Family Affair”, the two most donor-involved<br />
producer organizations. “The Cooperative Society” members aided vulnerable people as individual<br />
farmers, not as a collectivity, by providing poor neighbors with on-farm employment opportunities and<br />
sharing nutritious, farm-raised fish.<br />
In the cases examined the umbrella structures that specialize in fish farming yield member fish farmer<br />
associations with higher production than umbrella structures that oversee a spectrum of projects. “The<br />
Cooperative Society,” under the umbrella of the Uganda Fish Farmers Cooperative Alliance, and “The<br />
Family Affair,” are the two highest-producing fish farmer associations examined.<br />
Fish production-based umbrella structures are better able to develop productive fish farmers partially<br />
because of the social capital these associations develop: bonding social capital, which unites the members<br />
of a producer organization and bridging social capital, which connects people and institutions. A host of<br />
relationships set these specialists associations apart, as they have long-term working connections with<br />
technical experts, government research stations, universities, international experts, fingerling producers,<br />
feed distributors, and development professionals. Through these relationships, fish production-based<br />
umbrella structures are better poised to advocate for the fish farming sector, broaden member farmers’<br />
resources, and develop productive fish farmers.<br />
Additionally, umbrella structures which specialize in fish producer organization development are less<br />
likely to seek funding for non-aquaculture related development projects, efforts which distract diversified<br />
umbrella associations from focusing on improving fish farmers’ successes.<br />
Several incentive systems designed to encourage the development of a profitable and commercial fish<br />
farming sector in Uganda have been distorted to the point that they inhibit the economic and humancapital<br />
growth they were conceived to foster. What were designed to be incentives to productive fish farm<br />
development have evolved into ends in themselves. When leaders profit from distorted incentive systems,<br />
members’ trust is seriously compromised and member attrition results.<br />
Two leaders of producer associations expressed that they wanted to operate model farms. The leaders of<br />
both “The Unaccountable Leaders” and “The Helping Hands” expressed this interest. Also, these two men<br />
are most politically ambitious and donor-seeking PO leaders. In Uganda, a model farm is a political<br />
distinction. Rather than recognizing farmers who have built up productive and economically successful<br />
farm enterprises through the farmer’s own long-term investment and expertise, model farms can be<br />
designated before one complete production cycle. In this context, a model farm is one that has been<br />
22
23<br />
TECHNICAL REPORTS: INVESTIGATIONS 2009–2011<br />
recognized by the president and designated as a demonstration farm for farmer field school education.<br />
With model farm distinction comes an inflow of government assistance. This system is well suited to<br />
limited funds and staff members but, as previously mentioned, ordinary farmers may perceive model<br />
farmers as a privileged group they are unable to mirror (Mangheni 2007). This understanding limits the<br />
application of information received during farmer field schools held on model farms. Both of the producer<br />
organization leaders interested in achieving model farm status are envisioning the rewards, in terms of<br />
money and influence, which are unrelated to fish farm profitability. Yet the rewards from donor money<br />
are often more tangible and immediate than proceeds from fish culture. Model farm distinction is a<br />
financial end in itself; it is tangentially related to farm commercialization.<br />
The reality of producer associations maintaining multiple bank accounts for categories of donor assistance<br />
offers an insight into a pattern of assistance-seeking. Related to the treadmill of development assistance,<br />
many producer organization leaders pursue a piecemeal approach to funding sources.<br />
This approach is borne out of the development paradigm of cost sharing, where assistance-receivers<br />
invest a percentage of their own financial resources into a project. The purpose of cost sharing is to<br />
encourage participant ownership of the project and thus, incentive to manage the project well, as to<br />
provide returns on the participant’s investment. Since a producer organization leader realizes that<br />
development agencies expect cost sharing, he pursues multiple donors. For example, if one donor will<br />
finance 80 percent of a project, and the group members are expected to contribute 20 percent of their own<br />
financial resources, the producer organization leader may not ask his members for the 20 percent but finds<br />
another donor, unbeknownst to the first, to finance the 20 percent that is the members’ responsibility.<br />
If the leader is also a local politician, or has political aspirations, this piecemeal approach becomes even<br />
more important, as the leader will lose popular support if his or her participants invest their own resources<br />
into a project that fails. With membership dues or participant investment come expectations of leaders’<br />
accountability and financial returns. In the words of the project coordinator of “The Unaccountable<br />
Leaders’” producer organization, “We have people who are ready to pay money to be members but we are<br />
not signing them up because we can’t take their money when there are no feeds because then they will be<br />
asking, ‘What is happening with our money?’”<br />
To clarify, this is not a greedy or underhanded approach to conducting business but a practical one. This<br />
approach was created (and is sustained) by the revolving door of donors and government programs<br />
designed to assist the poor farmers of Uganda. A half-century’s history has proven that in time, another<br />
donor will come; therefore investing personal financial resources is unwarranted, if not wasteful.<br />
However, the piecemeal approach to funding sources has a detrimental impact on the aquaculture<br />
development of Uganda as it perpetuates the idea that fish farming is only profitable if a donor pays for<br />
the fingerlings and feed.<br />
Though patterns of distorted incentive systems and piecemeal donor seeking were established by donor<br />
behavior, the effects damage the viability of fish farmer associations and undermine their ability to<br />
accomplish the goal of becoming profitable commercial fish farmers. As previously mentioned, with each<br />
donor comes that donor’s own aims, which may or may not align with the producer organization’s goals.<br />
In fact, government or donor goals may serve to hinder member fish farmers from focusing on<br />
production, profitability, and long-term organizational viability. Donor and governments’ requirements<br />
certainly threaten fish producer organization leadership development, as this pattern of goal displacement<br />
and distortion obstructs leaders from defining, working towards, and achieving goals and forming an<br />
organizational identity.<br />
In the current method of operations, leaders of donor-driven fish producer associations simply follow the<br />
dictates of donor organizations, dictates which change with the creation and completion of an endless
TECHNICAL REPORTS: INVESTIGATIONS 2009–2011<br />
stream of short-term projects conducted by an alphabet soup of donor organizations. Additionally, fish<br />
producer organizations model the donor’s short term project orientation. For fish producer organizations<br />
in Uganda to support a market-driven, thriving aquaculture sector sustained over time, producer<br />
organization leaders must recognize that current government and donor financial incentives are not<br />
serving their interests as commercializing fish farmers, and avoid them while demanding that these<br />
structures be reformed to serve the intended purposes of governments, donors, and fish farmers.<br />
LITERATURE CITED<br />
Brummett, R. E. 2008. African aquaculture: Realizing the potential. Food Policy, 33, 371-385.<br />
Chambers, R. 1997. Whose Reality Counts? Putting the First Last, Practical Action Publishing, Bourton<br />
on Dunsmore.<br />
de Seligny, P. J.-F., A. Gumy, R. Grainger, U. Wijkstrom and T. Farmer 2006. The state of world<br />
fisheries and aquaculture. in F. F. a. A. Department editor. Food and Agriculture Organization of the<br />
United Nations, Rome.<br />
Grivetti, L. E. 1982. The Rationale, Promise, and Realities of Aquaculture: A Cultural-Nutritional<br />
Perspective. in L. J. Smith, Susan Peterson editor. Aquaculture Development in Less Developed<br />
Countries: Social, Economic, and Political Problems. Westview Press, Boulder, Colorado.<br />
Harrison, E. 1996. Digging Fish Ponds: Perspectives on Motivation in Luapula Province, Zambia.<br />
Human Organization, 55, 270-278.<br />
Hecht, T., J. Moehl, M. Halwart and R. Subasinghe 2005. Regional review on aquaculture development 4.<br />
Sub-Saharan Africa -- 2005. FAO, Rome.<br />
Hennink, M. M. 2007<br />
International focus group research: A handbook for the health and social sciences, Cambridge <strong>University</strong><br />
Press, Cambridge.<br />
Makumbe, J. M. 2002. Is there a civil society in Africa? International Affairs, 74, 305 - 319.<br />
Mangheni, M. N., editor. 2007. Experiences, Innovations and Issues in Agricultural Extension in Uganda:<br />
Lessons and Prospects, Fountain Publishers, Kampala.<br />
Maranz, D. E. 2001. African Friends and Money Matters, SIL International Dallas.<br />
Moehl, J., R. Brummett, M. K. Moniface and A. Coche 2006. Guiding principles for promoting<br />
aquaculture in Africa: benchmarks for sustainable development. FAO, Accra.<br />
Molnar, J. J., N. B. Schwartz and L. L. Lovshin 1985. Integrated aquacultural development: Sociological<br />
issues in the cooperative management of community fishponds. Sociologica Ruralis, 25, 60-80.<br />
Mosher, A. T. 1966. Getting agriculture moving: Essentials for development and modernization,<br />
Frederick A. Praeger, Publishers, New York.<br />
Mwanja, W. W. 2005. National Aquaculture Sector Overview: Uganda. in F. F. a. A. Department editor.<br />
FAO, Rome.<br />
Stake, R. E. 2006. Multiple Case Study Analysis, The Guilford Press, New York.<br />
van den Berg, H. 2004. IPM Farmer Field Schools: A Synthesis of 25 Impact Evaluations. Global IPM<br />
Facility. Wageningen <strong>University</strong>, Amsterdam.<br />
Yin, R. K. 2008. Case study research: Design and methods, SAGE Publications, Thousand Oaks.<br />
24
25<br />
TECHNICAL REPORTS: INVESTIGATIONS 2009–2011<br />
Training and Outreach in Uganda and Surrounding Nations<br />
Production System Design and Best Management Alternatives/Activity/09BMA02AU<br />
Joseph J. Molnar and Karen Veverica<br />
Auburn <strong>University</strong><br />
Auburn, Alabama, USA<br />
Nelly Isyagi and Maurice Ssebisubi<br />
Aquaculture Management Consultants Ltd.<br />
Kampala, Uganda<br />
Monica Karuhanga Beraho<br />
Makerere <strong>University</strong><br />
Kampala, Uganda<br />
INTRODUCTION<br />
Research, extension and education can contribute greatly to enhancing aquacultural production in a<br />
sustainable way and to reducing poverty, but achievements have generally fallen short of expectations in<br />
Africa (Sanginga et al. 2008). Farmers trust the experience and knowledge of others who are in situations<br />
similar to their own. Their desire to meet and talk with each other has spurred the formation of groups and<br />
networks to foster informal gatherings and more formal mechanisms of association to facilitate peer-topeer<br />
learning. Such learning groups are most effective when they have a targeted membership like fish<br />
farmers. If member perspectives are too diverse, then participants tend to become disenchanted because<br />
the results do not apply to their situations (Barrett and Ewert 1998).<br />
Peer-to-peer learning and support systems become increasing important in the context of privatized<br />
extension (Klerkx and Leeuwis. 2009), but in Africa there is often little or no reliable extension system to<br />
privatize. External donors endeavor to foster private, non-profit mechanisms that will be sustainable and<br />
provide the information and organizational services that fish farmers need to build an industry.<br />
Farmer innovators appreciate exchange and study visits as ways of gaining new experience, knowledge<br />
and techniques, which they informally experiment on at home (van den Ban and Hawkins 1998). Farmerto-farmer<br />
communication is more effective when visitors and hosts are well prepared, and if both groups<br />
review the usefulness of the exchange and deliberate on the reporting of lessons learned.<br />
Previous experience with farmer innovators in agricultural development suggests that study tours and<br />
farmer-to-farmer interaction led to significant levels of advancement in production practice. The project<br />
encouraged innovators to organize themselves into clusters of farmers and exchange experiences within<br />
and between clusters. In Tanzania, some farmer innovators started forming local groups with neighboring<br />
farmers after returning from the exchange visits. It is not easy to fully integrate the farmer innovation<br />
approach to participatory research and extension into the regular activities of national institutions. The<br />
concept of farmers as innovators and researchers is still new for many decision-makers. Thus, there are<br />
manifold ways that innovator farmers that share a common interest in a focal enterprise such as fish<br />
culture will associate themselves to gain the benefits of mutual support and collaboration.<br />
Outreach is extension, and implies regular and purposeful communication with stakeholders and<br />
beneficiaries at the various intermediate and local levels (Kerrison 2005). When standard forms of
TECHNICAL REPORTS: INVESTIGATIONS 2009–2011<br />
literacy-based and electronic communication are no longer available, then outreach takes place in the<br />
traditional extension way, with physical visits, dialogues, community meetings etc. Where adequate mass<br />
communications, electronic or literacy-based media can be used, mobile phones, email etc. then the need<br />
for travel and face-to-face meetings is obviously reduced (Kerrison 2005). The results (and other<br />
information) are disseminated through a series of study tours and fish farmer symposiums that involve<br />
selected fish farmers from neighboring IEHA countries. We will organize and carry out several training<br />
events in Uganda.<br />
ANNUAL FISH FARMER SYMPOSIUM AND TRADE SHOW<br />
The annual fish farmers’ symposium and trade show has drawn participants from around the country and<br />
the region. The project will participate in organizing these symposiums by helping build the program and<br />
in some cases participating as speakers or resource persons. These events also provide a forum from<br />
which to disseminate the activities of the <strong>AquaFish</strong> <strong>CRSP</strong>. During the trials and particularly for the first<br />
cage harvested at each site, a site visit will be hosted by a fish farmers’ group that will present their<br />
findings and experiences. The annual fish farmers symposium and trade show begun in Uganda in 2007<br />
under the USAID funded Fisheries Investment for Sustainable Harvest (FISH) project. The project was<br />
small and operated in a focal pilot area of Central Uganda around Kampala operating in Iganga, Mukono,<br />
Wakiso Mpigi and Mityana Districts. Farmers and service providers around the country raised concern<br />
about the fact that they were unable to access information from the project, though the demonstration<br />
farms and training sessions on these farms were open to all.<br />
Among their concerns, was while they could come to these sessions, the costs of travel several times a<br />
year for a specific topic was costly/not cost effective for them given their finances and impact on<br />
production when they were not on farm/the effect of them spending too much time away from their farms.<br />
They would rather a session was organised for them over a day or two where all information and finding<br />
for that year were communicated to them, questions asked. Holding a symposium seen to be the most<br />
viable option. Thus the first fish farmers’ symposium where the first results of the FISH projects were<br />
disseminated to stakeholders in the fish farming across the country. The trade fair to demonstrate<br />
technologies and link farmers to suppliers of inputs for these technologies and sources of more<br />
information.<br />
The level of interest was high from farmers and service providers. And at the evaluation of the first<br />
symposium it was observed that having more farmers from other parts of the country also present would<br />
enable direct discussion and answer questions. At second symposium WAFICOS offered to play a more<br />
active role realising the benefits and that one of their objectives was to disseminate quality and vetted<br />
technical advice to their members as many farmers where victim of poor advice. They realised it was a<br />
place for obtaining good advice, a farmer lead forum where farmers could openly air their views and<br />
concerns, and not a technocrat lead event where farmers are often relegated to being passive participants.<br />
At the second symposium, WAFICOS undertook to conduct these annually however, was limited in<br />
resources. However, they realised that there was more than meets the eye regarding the organisation of<br />
the symposia. (which the <strong>CRSP</strong> project covered)<br />
Specifically, the purpose of the symposia and trade fairs are to:<br />
1. To share farmers experiences in overcoming constraints in fish farming practice in the transition from<br />
subsistence to viable market oriented commercial enterprises.<br />
2. To share the experiences of industry and other service providers of investing in and meeting the needs<br />
of a new emerging sector.<br />
3. To exchange information on status and local innovations to overcome challenges faced by farmers<br />
and those involved in the aquaculture value-chain.<br />
26
27<br />
TECHNICAL REPORTS: INVESTIGATIONS 2009–2011<br />
4. To promote collaboration among stakeholders in the aquaculture sector to enhance sustainable<br />
development.<br />
I.<br />
OBJECTIVES<br />
1. Conduct an annual Farmer to Farmer study tour for producers from Kenya and Tanzania.<br />
2. Organize Annual Fish Farmers' Symposium and Trade Show to disseminate project research results,<br />
provide reliable technical information, and share producer perspectives on fish farming industry<br />
trends and conditions.<br />
II.<br />
METHODS AND MATERIALS<br />
Conduct Farmer to Farmer Study Tour for Producers from Kenya and Tanzania<br />
The study tours organised for farmers from the neighbouring countries were linked to the Annual Fish<br />
Farmers Symposium and Trade fair as it was felt that the information and exchange of ideas with the<br />
wider sector of farmers/service providers at these venue would be beneficial to them. Thus, the study<br />
tours were organised for the day after the symposia and invitations sent out.<br />
Organisation of the Fish Farmers Symposium and Trade Show<br />
The farmers through WAFICOS took the lead role in the organisation of the event and identification of<br />
topics for the event. They solicited additional funding for the event, identified presenters, and approached<br />
participants for the trade fair. <strong>CRSP</strong> through the host PI and Aquaculture Management Consultants liaised<br />
with WAFIOCS to identify key areas, speaker’s issues.<br />
The support offered included reviewing and discussing topic lists and issues, identifying what sort of data<br />
would be required to bring out issues and illustrate key points the farmers wanted brought out or<br />
information on, collecting and analysing this/farmers’ data as not all farmers were able to do this<br />
themselves, compiling presentations, verification of information and sources, compiling and editing<br />
symposium, records of attendance, preparation and multiplication of hand-outs during the symposia<br />
including proceedings of previous symposia., making of CDS, analysing evaluation data and making<br />
evaluation reports, loading the information onto the internet. Arranging the study tour and logistics for the<br />
study tours. WAFICOS members and other farmers were made open to Uganda farmers. The previous<br />
symposia did not have study tour attached. Advertising, Aquaculture Management Consultants Limited<br />
made the websites for the symposia both for the announcements and of the proceedings. Proceedings then<br />
given to agencies that supported, and other stakeholders that included the government institutions and<br />
private sector.<br />
An optional one-day field tour to various aquaculture-related establishments was organized whose major<br />
objective was to expose farmers to successful aquaculture operations and establish contacts with input<br />
suppliers and vetted service providers (see Appendix 2).<br />
Other Seminars and Tours<br />
The outreach component collaborated with the other study teams of the Uganda project to organise<br />
seminars on specific aspects.<br />
RESULTS<br />
Conduct Farmer to Farmer Study Tour for Producers from Kenya and Tanzania<br />
Farmers from Kenya were invited to the 2010 and 2011 annual symposia. The <strong>CRSP</strong> Kenya coordinator<br />
was instrumental in passing on the invitations. However, it was at the 2011 symposium that Kenyan<br />
farmers responded. Two attended and appreciated the benefits of the symposium and accompanying study
TECHNICAL REPORTS: INVESTIGATIONS 2009–2011<br />
tour. On their return they passed word round and a special study tour was organised for a group of ten<br />
farmers and extension personnel.<br />
The farmers were asked their interests and the tour was tailor made to their needs. A special hand-out was<br />
made of the places they were to visit by Aquaculture Management Consultants Limited. WAFCIOS<br />
collaborated by linking up with farmers and accompanying the farmers around (their program<br />
coordinator, Ben Kiddu).<br />
Organisation of the Fish Farmers Symposium and Trade Show<br />
The 2010 and 2011 symposia were undertaken with the support of <strong>CRSP</strong>. A combined total of about 300<br />
participants attended and 34 presentations were made. Of these 4 of the presentations presented <strong>CRSP</strong><br />
results and they were in line of the farmers’ themes for that year. Most of the presentations were done by<br />
farmers regarding their experience.<br />
The 2010 Symposium: The theme of the Third Annual Fish Farmers Symposium and Trade Fair in 2010<br />
was “Dealing with the Challenges of Building an Aquaculture Industry”. This arose largely because<br />
during the year 2009, there were significant shortfalls in the supply of key inputs, notably feed and seed,<br />
yet farmers had increased their levels of investment into fish farming in view of the good performance<br />
they had obtained in 2007/08 with the formulated commercial feeds from Ugachick Poultry Breeders<br />
Limited and Source of Nile Limited and a general improvement in the quality of seed produced by local<br />
hatcheries. Levels of production and sales rose during that period.<br />
Thus 2009 was a difficult year as it was too late for farmers to pull out considering the fish in stocked<br />
units and additional number of ponds that had been constructed. The only alternative was to make it work<br />
to salvage their investments as particularly the feed supply situation was temporal while Ugachick was<br />
upgrading it fish feed producing facilities to produce floating fish feed.<br />
The focal points of discussion at this symposium were:<br />
1. Assessing the key production factors affecting the viability of fish farming enterprises.<br />
2. Identify and review challenges faced in accessing inputs and the implications on returns to investment<br />
and quality of service delivery.<br />
3. Assess the availability of potential markets, and market information for fish farming.<br />
4. Review the availability and quality of current support services to the aquaculture private-sector and<br />
factors affecting their accessibility.<br />
Papers Presented at the 2010 Symposium: Table 1 lists the papers presented at the 2010 symposium.<br />
The key points for discussion were water supply for production, pond construction, feed and seed<br />
availability, accessing finance and grants. The symposium runs for two days<br />
2010 Trade Fair: There were 12 exhibitors at the trade fair that run concurrently with the symposium for<br />
two days. The farms that displayed fish were members of WAFICOS. Fingerlings and table fish were<br />
displayed. The fingerlings were given as a door prize and table fish brought for display was sold to<br />
participants (see table 2). All the fish served at meal times during the symposium was farmed fish.<br />
28
Table 1. Papers and presentations at the 2010 Symposium<br />
29<br />
TECHNICAL REPORTS: INVESTIGATIONS 2009–2011<br />
Presentation Name and Institution<br />
First Session: Opening Remarks<br />
1. Welcome Remarks: A Brief About WAFICOS. P. Ssebinyansi, Chairman WAFICOS<br />
2. Opening Remarks: Hon. F. Mukisa, Minister of <strong>State</strong> for<br />
Agriculture<br />
3. Key Note Address: Aquaculture Technological Development - G. Atukunda,<br />
Developments and Challenges.<br />
4. General Discussion about Issues and Challenges Faced by Fish<br />
Farmers.<br />
Third Session: Challenges Affecting Fish Farmers Access to Inputs and the Implications on Enterprise Viability and<br />
Quality of Service Delivery.<br />
13. The Challenges Faced in Investing in Commercial Fish Feed<br />
Production: A New Industry in Uganda and the Potential Benefits of<br />
Floating Fish Feeds for the Developing Aquaculture Sector<br />
14. The Effect of Inadequate Seed Supply on Enterprise Viability:<br />
The Cost of ‘Come Tomorrow’<br />
Karen. L. Veverica,<br />
Ugachick Poultry Breeders Ltd.<br />
Kizito Ssentamu,<br />
Wakiso Fish Farm<br />
15. Accessing Finance to Meet Operational Costs Nafula Owori,<br />
21ACC, Ltd.<br />
16. Mechanisation: Adaptations for the Construction Commercial<br />
Fish Ponds<br />
17. The Challenges of Restarting Aquaculture and the Potential for its<br />
Commercialization in Previous War Affected Areas of Northern and<br />
North East Uganda: Farmers’ Perspective<br />
Head Aquaculture, NARO<br />
Hon. F. Mukisa, Minister of <strong>State</strong> for<br />
Agriculture and J. J. Otim, Presidential<br />
Advisor on Agriculture<br />
Second Session: Key Production Factors Affecting the Viability of Farming Fish Commercially.<br />
5. Water Supply and Availability for Fish Farms. E.W. Tollner, <strong>University</strong> of Georgia,<br />
USA/ Aqua<strong>CRSP</strong><br />
6. Quality of Pond Construction and its Influence on Production and<br />
Returns: Recommendations and Farmers Experience.<br />
7. Low Survival Rates in Grow-Out Fish Ponds: Common Causes and<br />
Solutions.<br />
Peter Ssebinyansi, Mpigi Fish Farm.<br />
Maurice Ssebisubi,<br />
Aquaculture Management Consultants,<br />
Ltd.<br />
8. Technical Information Sources for Fish Farmers. Gertrude Atukunda,<br />
Aquaculture Research and Development<br />
Center, Kajjansi (NAFIRRI-NARO.)<br />
9. Production of High Quality Tilapia Fingerlings Agnes Atuhaire,<br />
Source of Nile Fish Farm<br />
10. Criteria and Best Management Practice Requirements for the<br />
Production of High Quality Catfish Fingerlings<br />
11. Dealing with the Challenges of Transforming from Subsistence to<br />
Commercial Fish Farming: Experiences from Eastern Uganda<br />
Odhiambo Daniel,<br />
Kabeihura Fish Farm.<br />
A. Owori-Wadunde,<br />
Aquaculture Research and Development<br />
Center, Kajjansi (NAFIRRI-NARO)<br />
12. Production of Nile Tilapia (Oreochromis niloticus) in Lake Cages. Abudala Napuru, Source of Nile Fish<br />
Farm.<br />
Ssimbwa M.,<br />
AETREC, Namalere (NARO)<br />
John Walakira, for Farmers, Northern<br />
Uganda
TECHNICAL REPORTS: INVESTIGATIONS 2009–2011<br />
Fourth Session: Markets, Marketing and Market Information.<br />
18. Building Markets and Marketing of Farmed Table Fish: Successes<br />
and Challenges<br />
Simon Owani, WAFICOS<br />
19. Fish Safety - Quality Aspects Phillip Borel, Greenfields (U) Ltd.<br />
20. Regional Market Study for Farmed fish Christopher Dhatemwa, UFPEA<br />
21. The Benefits of Forming Cooperatives for Commercial Farmers Bernard Tayebwa,<br />
Uganda Cooperative Alliance<br />
22. Principles of Cooperation in Aquaculture Joseph Molnar, Auburn <strong>University</strong>/ <strong>CRSP</strong><br />
23. WAFICOS Proposed Way Forward Tom Musoke, WAFICOS<br />
Fifth Session: Public Services to the Aquaculture Sector.<br />
24. USAID-LEAD Project – Objectives and Approach to Improving<br />
Livelihoods through Commercial Aquaculture<br />
30<br />
Jacob Olwo, USAID LEAD<br />
25. WFP's Role in Uganda Aquaculture Pius Kwesiga, World Food Programme<br />
Closing Session.<br />
Wrap Up Open Discussion Professor J. J. Otim, Presidential Advisor<br />
on Agriculture<br />
Closing Remarks<br />
Door Prize
Table 2: Exhibitors during the Jan 2010 Symposium.<br />
Exhibitor Products<br />
31<br />
TECHNICAL REPORTS: INVESTIGATIONS 2009–2011<br />
1. Ugachick Poultry Breeders Limited Floating fish feeds<br />
2. Crest Tanks Ltd Water tanks and holding facilities<br />
3. Uganda Oxygen Oxygen cylinders and refills<br />
4. Pets Alley Fish aquaria and filter systems<br />
5. Aquaculture Management Consultants Fish farming guides and advisory products<br />
6. AETREC (NARO) Namalere Walking tractor for compacting ponds<br />
7. Edhron Enterprises Catfish fillets, processing and packaging<br />
8. WAFICOS Live fish sales<br />
9. NAFIRRI (NARO) Research journals<br />
10. SON Fish Farm Fish feeds and fingerlings sale<br />
11. Uganda Fish Net Manufacturers Fish seine nets and cages<br />
12. Ndejje Fish Farm Live fish<br />
The 2010 Study Tour<br />
One tour was organised that attracted 59 Ugandan participants. The overall objective of the study tour<br />
was to expose participants to developments in the sector as well as allow interactive contact between<br />
input suppliers, farmers and service providers. The places visited were Tende Innovation Fish farm and<br />
Training Center (TIFTC), a catfish hatchery that also operates as a farmer sponsored-and-run farmer field<br />
school, Greenfields (U) Limited a fish processing plant that processes farmed fish for local consumption<br />
and regional export and Uganda Fish Net Manufacturers Limited that manufactures netting, pond seines<br />
and cages.<br />
The 2011 Symposium and Trade Fair<br />
In the year 2010 the key challenges that affected farmers were associated with the use of commercial<br />
feeds (including the new floating feed), its use and obtaining good returns. The price of feed had gone up<br />
due to a general increase in the cost of ingredients as well as due to the costs of feed manufacture. On the<br />
other hand, the price of fish had remained stable. Thus there was an obvious need in improving the<br />
efficiency of production as well as obtaining the best price possible of the farmed product and having<br />
quick sales.<br />
Thus, the theme of the fourth 2011 symposium was ‘Viable Fish Farming’ and the following were the<br />
key issues discussed:<br />
1. Production Planning and Management<br />
2. Fish Feeds and Feeding.<br />
3. Value Addition and Marketing of Farmed Fish.<br />
4. Current Support Services to the Aquaculture Private-Sector.<br />
III.<br />
The 2011 Symposium: There were a total of 19 presentations under the above mentioned four specific<br />
objectives of this year’s symposium.
TECHNICAL REPORTS: INVESTIGATIONS 2009–2011<br />
Table 3. Papers Presented at the 2011 Symposium<br />
ID Topic Name of Presenter Institution<br />
SESSION ONE: OPENING<br />
1 Welcome Remarks Paul Ssebinayansi Chairman, WAFICOS<br />
Opening: Key Note Address Mr. Jackson Wadanya Assistant Commissioner of<br />
Fisheries, MAAIF<br />
General Discussion Mr. Tom Musoke Secretary, WAFICOS<br />
SESSION TWO: PRODUCTION PLANNING AND MANAGMENT<br />
2 Key Issues for Aquaculture Feasibility Analysis<br />
and Business Planning in Uganda<br />
32<br />
Dr. Nelly Isyagi Aquaculture Management<br />
Consultants, Ltd<br />
3 The Potential of Fish Farming in Central Uganda Dr. Theodora Hyuha Makerere <strong>University</strong><br />
4 Projecting Input and Production Requirements: A<br />
Necessity for Successful Commercial Fish farming<br />
and Quality Service Delivery<br />
Rita Amolo Aquaculture Management<br />
Consultants, Ltd<br />
5 The Practicalities of Mobilizing Resources to<br />
Establish a Commercial Group Owned Fish Farm;<br />
Implications on Returns and Viability.<br />
Mr. Nyanzi Abdul Farmer, Jinja<br />
General Discussion Mr. Tom Musoke Secretary, WAFICOS<br />
SESSION THREE: FISH FEEDS AND FEEDING<br />
6 Factors Affecting the Performance of Commercial<br />
Floating Fish Feeds<br />
Karen L Veverica Ugachick Poultry Breeders<br />
Ltd. / Auburn <strong>University</strong><br />
7 Why does Fish Feed Cost so Much? Karen L Veverica Ugachick Poultry Breeders<br />
Ltd. / Auburn <strong>University</strong><br />
8 The Benefits and Risks of Making and Using On-<br />
Farm Fish Feeds – A Farmer’s Experience<br />
Rhona Nabukeera Sustainable Commercial<br />
Aquaculture for Poverty<br />
Alleviation (SCAPA) Project<br />
9 Novus, Making a Difference in Nutrition David Nyagaka Novus International – Kenya<br />
Office.<br />
10 The Performance of Ugachick Floating Fish Feeds: Daniel Ojiambo Kabeihura fish farm,<br />
A Farmers Perspective<br />
Bushenyi<br />
11 2010 Enterprise Budgets Catfish Grow-Out Daniel Odhjiambo Kabeihura fish farm,<br />
Bushenyi<br />
12 2010 Enterprise Budgets Tilapia Grow-Out Biira Yazeri Kireka Fish Farm<br />
13 2010 Enterprise Budgets Tilapia Nursery Kiddu Ben WAFICOS<br />
General Discussion Mr. Tom Musoke Secretary, WAFICOS<br />
SESSION FOUR: VALUE ADDITION AND MARKETING OF FARMED FISH<br />
14 Creative Marketing Tom Musoke Kabaganda Fish Farm<br />
15 Value-Addition, Preservation and Marketing Dr. Margaret Maseette FBRC-Kawanda
33<br />
TECHNICAL REPORTS: INVESTIGATIONS 2009–2011<br />
ID Topic Name of Presenter Institution<br />
Discussion: Times when I Sold at a Profit and at a<br />
Loss.<br />
SESSION FIVE: SERVICES TO THE SECTOR<br />
16 Financing Aquaculture Ms. Sabano Mwaka<br />
Ann Marie.<br />
Mrs. Mary Zaramba Fish Farmer, WAFICOS<br />
Agricultural Credit Officer,<br />
Centenary Bank.<br />
17 Helping Build Aquaculture Enterprises, Success<br />
and Challenges<br />
Jacob Olwoo USAID LEAD<br />
18 Deep Blue Aquatic Systems Brynn Simpson Deep Blue Aquatic Systems,<br />
South Africa<br />
19 Certification for Aquaculture Professionals Karen Veverica, Auburn <strong>University</strong>, USA.<br />
20 EU Study on Promoting Commercial Aquaculture<br />
in Uganda<br />
Malcolm Dickson. EU Mission/COWI<br />
General Discussion Mr. Tom Musoke Secretary, WAFICOS<br />
SESSION SIX: CLOSING<br />
Question Answer Time and Wrap-up Discussions Mr. Tom Musoke Secretary, WAFICOS<br />
Prize Draws Mr. Paul Ssebinaynsi Chairman WAFICOS and<br />
and Mr. David Tilia Principal Fisheries Officer,<br />
MAAIF<br />
Closing Remarks Mr. David Tilia Principal Fisheries Officer,<br />
MAAIF<br />
Among the participants were two Kenyans and the EU Mission undertaking a study on ‘Promoting<br />
Commercial Aquaculture in Uganda’. The study was specifically scheduled so that the mission could<br />
attend the symposium and obtain up-date information on Ugandan aquaculture from farmers and other<br />
key stakeholders.<br />
The 2011 Trade Fair<br />
There were 11 exhibitors at the trade (see table 4). There was a strong emphasis on the marketing of<br />
farmed fish this year. The table fish and fish-products brought to the fair were all sold to participants and<br />
people from around the UMA show grounds who came to have a look at what was on display. All the fish<br />
and fish products served at this year’s symposium (both tilapia and catfish) were from WAFICOS farmed<br />
fish. One of the exhibitors, Deep Blue Aquatic Systems came in from South Africa.
TECHNICAL REPORTS: INVESTIGATIONS 2009–2011<br />
Table 4: List of Exhibitors<br />
Exhibitor Products<br />
1. Ugachick Poultry Breeders Limited Fish feeds and feeding guides.<br />
2. Green Fields Uganda Limited Fish fingers and fish burgers<br />
3. SON- Source of the Nile fish farm Whole fresh tilapia on ice.<br />
4. WAFICOS Live table size catfish and tilapia. Smoked whole<br />
catfish.<br />
5. Aquaculture Management Consultants Aquaculture equipment and aquaria<br />
6. Deep Blue Aquatic Systems (in collaboration with Aquaculture and live fish holding systems<br />
Aquaculture Management Consultants)<br />
7. Sun Fish Farm Live fish haulage truck<br />
8. Nile Crocodile Park. Books. The Best Options for Africa<br />
9. National Fisheries Resources Institute Research papers/journals<br />
10. Tende Innovation Fish Farm and Training Center Live catfish fingerlings.<br />
11. Uganda Fish Net Manufacturers Fish seine nets, predator nets and cages<br />
The 2011 Study Tour<br />
The farmers study tour in 2011 was expanded. In the previous year (2010) participants of the tour noted<br />
that there was a lot to learn from the sites visited and it was not worth it for them to visit several sites like<br />
‘tourists’ in a day. Thus the objectives of the 2011 were not just to show-case but demonstrate best<br />
practices that participants could pick up for adoption. The demonstrations were undertaken by farmers<br />
themselves with the assistance of technical personnel from WAFICOS and Aquaculture Management<br />
Consultants limited. Training hand-outs were prepared for distribution by Aquaculture Management<br />
Consultants Limited.<br />
The sites visited were:<br />
1. Route 1: Kabaganda Fish Farm and Ugachick Poultry Breeders Limited that demonstrated tilapia<br />
nursery management, commercial fish feed production and the processing of catfish fillets.<br />
2. Route 2: ARDC – Aquaculture Research and Development Center (ARDC) Kajjansi and Pearl<br />
Fishing and Aquaculture Limited. This tour showcased the new research facilities at the<br />
Aquaculture Research and Development Center and demonstrated feed-based tilapia and catfish<br />
pond grow-out management.<br />
3. Route 3: Living Waters Fish Farm and Kireka Fish Farm. This tour demonstrated feed-based<br />
tilapia and catfish pond grow-out management, siting and setting-out of new ponds, use of the<br />
commercial pond seine and catfish hatchery management.<br />
As a sequel attendance of the Kenyan farmers to the 2011 symposium was a study tour organised for a<br />
group of Kenyan fish farmers and extension agents. Table 5 gives an overview of the places visited.<br />
34
35<br />
TECHNICAL REPORTS: INVESTIGATIONS 2009–2011<br />
Table 5. Study Tour for Kenyan Farmers<br />
Day Venue Type of Farm<br />
One Arrival in Kampala<br />
Two Source of Nile Farm, Buikwe<br />
Living Waters, Mukon<br />
Kireka Fish Farm, Wakiso<br />
Three Kabaganda Fish Farm, Wakiso<br />
Ugachick Poultry Breeders Limited, Wakiso<br />
Travel to Bushenyi<br />
Four Kabeihura Fish Farm and fish farmer outgrowers<br />
, Bushenyi<br />
Five Travel Back to Kampala<br />
Mpigi Fish Farm, Mpigi<br />
Six Return to Nairobi<br />
Tilapia hatchery and cage culture.<br />
Catfish and Tilapia grow-out.<br />
Smallholder catfish hatchery.<br />
Tilapia Nursery<br />
Fish Feed Factory.<br />
Catfish hatchery<br />
Tilapia and Catfish grow-out<br />
Tilapia Nursery<br />
Other Seminars and Tours<br />
The outreach component participated in coordinating, offering technical support, preparation of training<br />
material and compiling documentation for the seminars and field visits:<br />
1. Review of the questionnaire for the marketing study.<br />
2. Seminar by Tollner at MUK and Kabanyolo.<br />
3. Field visits of Hydrology MUK to potential study sites in Gulu, Wakiso, MItyana, Mukono and<br />
Buikwe.<br />
4. Sourcing of cages, fingerlings, stocking and sampling of <strong>CRSP</strong> trial cages.<br />
IV.<br />
CONCLUSION<br />
Participants considered the symposia and study tours a general success. The key factors that were used to<br />
define success were the relevance of the presentations and demonstrations to the prevailing challenges<br />
that farmers and other stakeholder in the sector were facing. The effectiveness of farmer-to-farmer<br />
dissemination was fully realised as most of the presentation were by farmers, the discussions during the<br />
plenary session were led by the farmers themselves and the key facilitators on farms during the study<br />
tours, were the farmers themselves. The technical personnel only came in to supplement and explain the<br />
principals upon which the technologies were based and issues that affected their application on-farms.<br />
The role and capability of the private sector where appropriately supported in dissemination of technical<br />
information and training is also illustrated. WAFICOS, as producers and aquaculture service providers are<br />
the aquaculture private-sector. Participants paid attendance to the symposia and trade fair as did<br />
exhibitors. Likewise is the level of support the program has received from Aquaculture Management<br />
Consultants Limited. This shows that where quality services are provided that are result oriented, farmers<br />
and other service providers in the private sector can support these initiatives to make them sustainable.<br />
The outreach program has been able to disseminate information to stakeholders directly. Proceedings<br />
have been disseminated via CD to all attendees of the symposia as well as personnel in key government<br />
offices notably the Ministry of Agriculture, Ministry of Finance Economic Planning and Development,<br />
the National Agriculture Research Organisation 9head office and its centres involved in aquaculture),<br />
Makerere <strong>University</strong>, Fisheries Training Institute, District Fisheries Officers, FAO, USAID LEAD,<br />
Banks, etc. Proceedings of the symposia have also been disseminated via the internet to the wider African<br />
and international community via the SARNISSA website that is a widely consulted aquaculture<br />
interactive site in Africa.
TECHNICAL REPORTS: INVESTIGATIONS 2009–2011<br />
The outreach strategy adopted can be considered a success. Dissemination can be undertaken through<br />
direct contact training seminars between <strong>CRSP</strong> personnel and farmers, farmer-to-farmer and via mediabased<br />
PC tools.<br />
The project anticipated that major benefits of the project would be:<br />
1. Information and improved production for individual farmers and rural communities.<br />
2. Increase in the membership of fish farmer groups as a result of the symposia.<br />
3. Service providers and suppliers of inputs gaining recognition and possibly clients.<br />
The benefits that actually accrued based on the response of WAFICOS members (Quote):<br />
1. It has become a forum where farmers and others involved in the industry discuss up-to-date issues<br />
affecting them. The factors that influence performance are dynamic. If one is to stay in business, then<br />
problems have to be solved along the way and opportunities identified early and are taken advantage<br />
of. The papers presented and study tours focus at key issues that arose the previous year. Hence,<br />
farmers and service providers mention this as among the key benefits of the symposium<br />
2. WAFICOS membership has increased. So has the credibility of the association. Agencies notably<br />
NGO’s and NAADS (National agricultural advisory services) now cross-check with WAFICOS when<br />
vetting tenders (hatcheries) to supply fingerlings asking the association to verify whether the farm<br />
exists and what sort of fingerling quality the farms tend to produce.<br />
3. WAFICOS now asked officially by training institutions (Fisheries Training Institute and Makerere<br />
<strong>University</strong>) for placement of interns.<br />
4. The farms and other establishments visited during the study tours have registered increased sales.<br />
Such farms also have more visitors and training institutions seek to attach interns or conduct study<br />
tours on these establishments.<br />
5. More farmers demanding for services from WAFICOS which include information, technical services<br />
and inputs. Among the key success is WAFICOS office becoming an official outlet for Ugachick feed<br />
whereby farmers can buy the feed at wholesale price. This has enabled farmers identify loopholes and<br />
opportunities beyond the farm level. Several farmers have taken advantage of this and have<br />
established businesses (i.e. marketing, inputs) and are negotiating getting better prices for their fish.<br />
6. WAFICOS ties with other institutions, (Government, donor, NGO’s, training institutions) have been<br />
strengthened. The relationship is increasingly becoming two way as they realize that WAFICOS has<br />
useful information to give that they would otherwise have no access to, thus has a contribution to the<br />
sector. The relationship less of one where they look as the association as a ‘beggar’ that can only<br />
survive on their handouts.<br />
7. WAFICOS and other farmers have learnt more about what other farmers are doing from the<br />
symposium.<br />
8. Farmers have learnt new technologies and their application through the symposia and study tours.<br />
Adoption rates of appropriate technologies has consequently increased (e.g. use of feed, pond<br />
construction techniques) as has been observed when WAFICOS technical staff visit farm or when<br />
farmers come to the WAFICOS office to register and seek services. Farmers also now appreciate why<br />
certain things are the way they are because during the symposia different stakeholders’ discuss the<br />
issues affecting them not just services offered. The discussions get to the heart of the matter. Hence,<br />
there are more farmers who visit the WAFICOS who now realize the onus is on them to make their<br />
farms viable by adopting best techniques, improving efficiency of production rather than waiting for<br />
government/donor grants, asking for loans or complaining about feed prices being too high. They<br />
understand why things are the way they e.g. costs of ingredients, what is involved in getting loans and<br />
36
37<br />
TECHNICAL REPORTS: INVESTIGATIONS 2009–2011<br />
that one should only think once the business proves itself profitably and running. In essence, those<br />
who have attended the symposia are becoming aquaculture business men and women.<br />
9. WAFICOS is now known country-wide and membership has increased beyond the original stipulated<br />
geographical region of Mpigi, Wakiso, and Kampala. Membership is now country-wide and services<br />
delivered to members where-ever they are. Farmers pay for transport and are willing to do so because<br />
of the reliability and quality of services offered.<br />
ACKNOWLEDGMENTS<br />
Additional Funding was provided by USAID Livelihood and Enterprises for Agricultural Development<br />
(LEAD), Food and Agriculture Organisation (FAO), and World Food Program (WFP).<br />
Additional logistical support provided by: Aquaculture Management Consultants Limited, the National<br />
Agricultural Research Organisation (NARO) and Uganda Veterinary Association.
TECHNICAL REPORTS: INVESTIGATIONS 2009–2011<br />
Incorporation of Tilapia (Oreochromis Niloticus) and Sahar (Tor Putitora) into<br />
the Existing Carp Polyculture System of Nepal<br />
Production System Design and Best Management Alternatives/Experiment/09BMA03UM<br />
Madhav K. Shrestha and Ramesh Jaiswal<br />
Institute of Agriculture and Animal Sciences<br />
Rampur, Chitwan, Nepal<br />
Liu Liping<br />
Shanghai Ocean <strong>University</strong><br />
Shanghai, China<br />
James S. Diana<br />
<strong>University</strong> of Michigan<br />
Ann Arbor, Michigan, USA<br />
ABSTRACT<br />
An experiment was conducted for 180 days in 12 earthen ponds, 110-150 m 2 in surface area and 1.0 m in<br />
depth, at the Institute of Agriculture and Animal Science (IAAS), Rampur, Chitwan, Nepal to assess the<br />
growth, production, and productivity of carps, tilapia (Oreochromis niloticus), and sahar (Tor putitora) in<br />
different polyculture combinations. There were one control and three treatments with three replicates<br />
each: (1) Existing carp polyculture (silver carp, bighead carp, common carp, grass carp, rohu, and mrigal<br />
in the ratio of 3:2:2.5:0.5:1:1 and stocking density of 7000 fish ha -1 ) (control); (2) Control + tilapia (3000<br />
ha -1 ); (3) Control + tilapia (3000 ha -1 ) + sahar (500 ha -1 ); (4) Control + tilapia (3000 ha -1 ) + sahar (1000<br />
ha -1 ). The ponds were fertilized weekly at 4 kg N and 1 kg P ha -1 d -1 using diammonium phosphate (DAP)<br />
and urea. Fish were fed on alternate days at 0900–1000 h, with a locally made pelleted feed (20% crude<br />
protein) at rates of 2% body weight per day. Feed rations were adjusted monthly based on sampling<br />
weights.<br />
Survival of carps (68-89%), tilapia (69-83%) and sahar (43-49%) were not significantly different among<br />
treatments. All carp species showed better performance in all treatments than sahar or tilapia with a daily<br />
weight gain of 1.0 to 2.4 g d -1 . The combined net and gross yields of all carps in T1 and T2 were<br />
significantly higher than T3 and T4 (p
INTRODUCTION<br />
39<br />
TECHNICAL REPORTS: INVESTIGATIONS 2009–2011<br />
Inland aquaculture and fisheries are the only source of fish production in Nepal. Total fish production is<br />
48,230 mt, with 21,500 mt (about 45%) coming from capture fisheries (DoFD, 2010). Current annual fish<br />
production of Nepal aquaculture systems is about 3.3 t/ha (DoFD, 2010). Increasing fish productivity as<br />
well as total production in country is a challenging task and necessary in order to provide for increasing<br />
demand for fish as food without increasing import from neighboring countries. Nile tilapia (Oreochromis<br />
niloticus) was introduced in Nepal in 1985 (Pantha, 1993), however, it remained in government control<br />
for more than 10 years (Shrestha and Bhujel, 1999). We have worked on tilapia and sahar (Tor putitora)<br />
combinations in polyculture to control excessive recruitment of tilapia and also to provide additional<br />
species to increase productivity and to promote culture of high value fish that are indigenous. Sahar can<br />
control tilapia fry in mixed sex culture (Paudel et al., 2007; Rai et al., 2007; Yadav et al., 2007).<br />
Polyculture of sahar with mixed-sex tilapia increased fish yield significantly compared to tilapia<br />
monoculture (Shrestha et al., 2011). Growth of sahar is higher in tropical and subtropical ponds than in<br />
cages in lakes near Pokhara and also in suspended cages in ponds (Shrestha et al., 2005; 2007; Bista et al.,<br />
2001; 2007).<br />
Semi-intensive carp polyculture is an established and recommended system in tropical and subtropical<br />
region of Nepal using fertilized ponds with partial feed supplementation. The species are: common carp<br />
(Cyprinus carpio), silver carp (Hypophthalmichthys molitrix), bighead carp (Aristichthys nobilis), grass<br />
carp (Ctenopharyngodon idella), rohu (Labeo rohita), naini/mrigal (Cirrhinus mrigala), and Bhakur/Catla<br />
(Catla catla). Though all seven species are recommended in certain ratios with a combined density of<br />
7000 fish/ha (Pandey et al., 2007), fingerlings of all species are rarely available when needed for stocking.<br />
In most of the cases, the number of species cultured ranges from four to six. Addition of well proven<br />
species (such as tilapia and sahar) with increased stocking density into the existing carp production<br />
system can have a positive impact by increased productivity and economic value.<br />
The purpose of this study was to incorporate tilapia and sahar into carp polyculture to improve production<br />
in order to better develop the model for best production and to determine the costs and benefits of various<br />
polyculture combinations.<br />
The objectives of this study were:<br />
I. To assess the growth, production and productivity of carps, tilapia and sahar in different<br />
polyculture combinations;<br />
II. To assess nutrient recovery in each system<br />
III. To determine cost and benefits of fish production in each polyculture system;<br />
IV. To assess and compare water quality produced by each polyculture treatment;<br />
V. To promote those results in a workshop targeted on polyculture and family nutrition.<br />
METHODS AND MATERIALS<br />
This experiment was conducted in 12 earthen ponds, 110-150 m 2 in surface area and 1.0 m in depth, at the<br />
Institute of Agriculture and Animal Science (IAAS), Rampur, Chitwan, Nepal. The experiment was<br />
conducted in completely randomized design using one control and three treatments with three replicate<br />
each: (1) Existing carp polyculture (7000 fish ha -1 ) (control); (2) Control + tilapia (3000 ha -1 ); (3) Control<br />
+ tilapia (3000 ha -1 ) + sahar (500 ha -1 ); (4) Control + tilapia (3000 ha -1 ) + sahar (1000/ha -1 ). Ponds were<br />
drained and filled with canal water two weeks before fish stocking. They were fertilized at 4 kg N and 1<br />
kg P ha -1 d -1 for 7 days with diammonium phosphate (DAP) and urea. A feeding tray was placed in each<br />
pond to confine feeding. A wooden platform was constructed in the ponds for feeding and water<br />
sampling. Water depth was maintained 1.0 m in all ponds by biweekly topping with canal water to replace<br />
water loss due to evaporation and seepage. Fish were fed once on alternate days at 0900–1000 h, with a<br />
locally made pelleted feed (20% crude protein) at rates of 2% body weight per day. Feed rations were
TECHNICAL REPORTS: INVESTIGATIONS 2009–2011<br />
adjusted monthly based on sampling weights. Ponds were fertilized weekly using DAP and urea at rates<br />
of 4 kg N and 1 kg P ha -1 d -1 .<br />
Fingerlings of silver carp, bighead carp, common carp, grass carp, rohu, and mrigal (average weights<br />
24.1±2.2 g, 36.7±4.6 g, 20.4±2.9 g, 39.7±3.8 g, 9.7±1.4 g and 6.9±0.7 g, respectively) were stocked in all<br />
ponds. The stocking ratio was 3:2:2.5:0.5:1:1 in all ponds. Similarly, Nile tilapia and sahar (average<br />
weights 11.6±1.6 g and 3.4±0.4 g, respectively) were added in treatment ponds. Fish were stocked on 25<br />
February 2011 and harvested on 26 August 2011.<br />
Weekly and biweekly measurements of water quality parameters were conducted at 0600–0800 h starting<br />
from 25 February 2011. Water temperature, dissolved oxygen (DO), pH, and Secchi disk depth were<br />
measured in situ weekly using a Thermometer (Lutron TM-936 model), DO meter (Lutron DO-5509<br />
model), pH meter (Lutron YK-21 PH model), and Secchi disk, respectively. Water samples were<br />
collected biweekly from each pond using a column sampler and analyzed for total alkalinity, total<br />
ammonium nitrogen (TAN), nitrite nitrogen (NO2-N), soluble reactive phosphorous (SRP), and<br />
chlorophyll a using standard methods (APHA, 1985).<br />
A simple economic analysis was conducted based on farm-gate prices for harvested fish and market<br />
prices for all costs in Nepal (Shang, 1990). Farm gate prices of sahar, tilapia, carp were 300, 200 and 150-<br />
200 NRs kg -1 ($1 US = 73 NRs), respectively. Prices for sahar, tilapia, and carps fingerlings were 5, 2 and<br />
2 NRs piece -1 , respectively. Prices for feed, DAP, and urea were 20, 45, and 30 NRs kg -1 , respectively.<br />
The calculation for cost of working capital was based on an annual interest rate of 10%.<br />
Data were analyzed statistically by one way analysis of variance (ANOVA), using SPSS (version 16.0)<br />
statistical software (SPSS Inc., Chicago). Arcsine transformations were performed on percent data.<br />
Differences were considered significant at the 95% confidence level (P < 0.05). All means were given<br />
with ±1 standard error (S.E.).<br />
RESULTS<br />
The survival rate of stocked Nile tilapia ranged from 69.4 to 83.2%, without significant differences<br />
among treatments (Table 1). There were no significant differences in mean harvest weight, daily weight<br />
gain, net fish yield (NFY) and gross fish yield (GFY) of tilapia among treatments. The survival of sahar<br />
was very low, ranging from 42.9 to 48.5%, without significant differences among treatments (Table 1).<br />
The daily weight gain of sahar ranged from 0.3 to 0.4 g d -1 (Figure 1), also without significant differences<br />
among treatments. The GFY and NFY of sahar ranged from 0.03 to 0.06 and 0.02 to 0.03 t ha -1 yr -1 ,<br />
respectively and was significantly different (p
41<br />
TECHNICAL REPORTS: INVESTIGATIONS 2009–2011<br />
The combined net and gross yields of all species in a treatment were significantly higher in T2 than other<br />
treatments (p
TECHNICAL REPORTS: INVESTIGATIONS 2009–2011<br />
polyculture than in other treatments. Growth performances of carp species were not affected by addition<br />
of tilapia, and there was no competition between carp and tilapia for pond resources. We can add Nile<br />
tilapia to carp polyculture ponds up to a certain density to enhance overall production.<br />
Most water quality parameters in all ponds were within acceptable ranges for fish culture. Water quality<br />
was not drastically affected by stocking densities of fishes. However, frequent DO depletion was<br />
observed in the high stocking density treatments, T3 and T4. The FCRs recorded were fairly low, probably<br />
due to alternate day feeding.<br />
Income in these experiments was estimated by simple budget analysis. Fixed costs were not included in<br />
the analysis as we intended to only compare relative differences in efficiency between the treatments, and<br />
we assumed fixed costs to be similar for all the treatments. Cost estimation was based on local market<br />
prices of fingerlings, fertilizers, lime, and labor wages. Results showed that all treatments produced<br />
positive net returns ranging from 491,600 to 793,800 NRs. However, the carp-tilapia combination (T2)<br />
produced significantly higher net return than other treatments.<br />
This study clearly demonstrated that addition of Nile tilapia in the semi-intensive carp polyculture ponds<br />
increased production up to 57% and net returns up to 61% without affecting water quality. However, the<br />
addition of both tilapia and sahar in semi-intensive carp polyculture ponds caused some water quality<br />
problems, especially depleting DO in the pond. Thus, it is necessary to fine-tune the ratio of carps, tilapia,<br />
and sahar in polyculture if all of these species are stocked. This new polyculture system provides an<br />
alternative species for farmers and allows for diversification of species in carp polyculture ponds. Finally,<br />
further research on the improved survival rate and growth of sahar in carp polyculture ponds is needed.<br />
ANTICIPATED BENEFITS<br />
The results of this study will provide an additional species in polyculture systems of Nepal with increased<br />
productivity, production, and income. These changes will add high valued fish into the culture system and<br />
will supplement income. As carp polyculture is an established system, increasing species will be easy for<br />
fish farmers to adopt. If sahar and tilapia are cultured, it will also help in production of sahar and decrease<br />
fishing pressure in nature. These changes will benefit fish culturists in south Asia and other countries<br />
where carp culture is popular. Knowledge on polyculture and expansion to endemic species not only<br />
benefits Nepal, but sustainable aquaculture systems throughout the developed world as well. Immediate<br />
impact will be measured by increased production and economic returns in on-farm trials for the different<br />
polyculture systems.<br />
ACKNOWLEDGMENTS<br />
The authors wish to acknowledge the support from the Institute of Agriculture and Animal Science,<br />
Rampur, Chitwan, Nepal, and the Shanghai Ocean <strong>University</strong>, Shanghai, China. Mr. Narayan P. Pandit of<br />
IAAS is thanked for his contributions to data analysis and report preparation.<br />
LITERATURE CITED<br />
Acharya, D., D.K. Jha, M.K. Shrestha, and N.R. Devkota, 2007. Polyculture of sahar (Tor putitora) and<br />
mixed-sex Nile tilapia (Oreochromis niloticus) in Chitwan, Nepal. In: R.B. Thapa, and M.D. Sharma<br />
(Editors), IAAS Research Advances, 1, pp. 187–193.<br />
APHA, 1985. Standard Methods for the Examination of Water and Waste Water (16 th edition). American<br />
Public Health Association, Washington D.C. 1268 pp.<br />
Bista J.D., S.K. Wagle, M.K. Shrestha, and A.B. Thapa, 2007. Evaluation of growth performance of<br />
Himalayan sahar (Tor putitora) for aquaculture development in mid hills and southern plain of Nepal.<br />
Seventh National Workshop on Livestock and Fisheries Research, June 25-27, 2007. Abstracts, p. 12.<br />
42
43<br />
TECHNICAL REPORTS: INVESTIGATIONS 2009–2011<br />
Bista, J., B.R. Pradhan, A.K. Rai, R.K. Shrestha, and T.B. Gurung, 2001. Nutrition, feed, feeding of<br />
golden mahaseer (Tor putitora) for domestication and production in Nepal. Symposium on coldwater<br />
fishes in the trans Himalayan region, 10-14 July, Kathmandu, Nepal.<br />
DoFD (Department of Fisheries Development), 2010. Annual report. Directorate of Fisheries<br />
Development, Balaju. Department of Agriculture, Ministry of Agriculture and Co-operatives,<br />
Government of Nepal.<br />
Islam, M.S., 2002. Evaluation of supplementary feeds for semi-intensive pond culture of mahseer, Tor<br />
putitora (Hamilton). Aquaculture, 212:263–276.<br />
Pandey, C.M., M.K. Shrestha, C.N.R. Yadav, and S. Rai, 2007. Productivity of carp polyculture system<br />
under farmers’ pond condition in sub tropical Nepal. In: R.B. Thapa and M.D. Sharma (Editors),<br />
IAAS Research Advances Vol. 1. IAAS, Rampur, Chitwan, Nepal, pp. 175-179.<br />
Pandit, N.P., M.K. Shrestha, Y. Yi, and J.S. Diana, 2004, Polyculture of grass carp and Nile tilapia with<br />
napier grass as the sole nutrient input in the subtropical climate of Nepal. In: R. Bolivar, G. Mair, and K.<br />
Fitzsimmons (Editors), New Dimension in Farmed tilapia, Proceedings of 6 th International Symposium<br />
on Tilapia in Aquaculture (ISTA 6), pp. 558-573.<br />
Pantha, M.B., 1993. Aquafeeds and feeding strategy in Nepal. In: M. W. New, A.G.T. Tacon and I.<br />
Csavas (eds.) Farm Made Aquafeeds. Proceedings of the FAO/AADCP Regional Expert Consolation<br />
on Farm-Made Aquafeeds, 14-18 December 1992, Bangkok, Thailand. FAO-RAPA/AADCP,<br />
Bangkok. pp. 24-60.<br />
Paudel, J.K., D.K. Jha, M.K. Shrestha, and J.D. Bista, 2007. Growth performance of sahar (Tor putitora) in<br />
different culture systems in Chitwan, Nepal. In: R.B. Thapa and M.D. Sharma (Editors), IAAS<br />
Research Advances Vol 2. IAAS, Rampur, Chitwan, Nepal. pp. 195-200.<br />
Rai S., M.K. Shrestha, D.K. Jha, and D. Acharya, 2007. Growth performance of sahar and mixed-sex Nile<br />
tilapia in monoculture and co-culture system in Chitwan. In: R.B. Thapa and M.D. Sharma (Editors),<br />
IAAS Research Advances Vol 1. IAAS, Rampur, Chitwan, Nepal. pp. 187-193.<br />
Shang, Y.C., 1990. Aquaculture Economic Analysis: An Introduction. World Aquaculture Society, Baton Rouge,<br />
Louisiana, 211 pp.<br />
Shrestha, M.K., and R.C. Bhujel, 1999. A preliminary study on Nile tilapia (Oreochromis niloticus)<br />
polyculture with common carp (Cyprinus carpio) fed with duckweed (Spirodela) in Nepal. Asian<br />
Fisheries Science, 12: 83-89.<br />
Shrestha, M.K., J.D. Bista, and Y. Yi., 2007. Performance of Tor putitora in sub tropical climate of Nepal. 8 th<br />
Asian Fisheries Forum. Asian Fisheries Society and Asian Fisheries Society, Indian Branch, 20-23<br />
November 2007, Kochi, India. Fisheries and Aquaculture: Strategic Outlook for Asia, Book of Abstracts,<br />
pp. 250-251.<br />
Shrestha, M.K., N.P. Pandit, Y. Yi, J.S. Diana, and C.K. Lin, 2005. Integrated cage-cum-pond culture<br />
system with high-valued sahar (Tor putitora) suspended in carp polyculture ponds. In: J. Burright, C.<br />
Flemming, and H. Egna (Editors), Twenty-Second Annual Technical Report. Aquaculture <strong>CRSP</strong>,<br />
<strong>Oregon</strong> <strong>State</strong> <strong>University</strong>, Corvallis, <strong>Oregon</strong>. pp. 97-114.<br />
Shrestha, M.K., R.L. Sharma, K. Gharti and J.S. Diana, 2011. Polyculture of sahar (Tor putitora) with<br />
mixed-sex Nile tilapia. Aquaculture, 319: 284-289.<br />
Yadav, R.K., M.K. Shrestha, and N.P. Pandit, 2007. Introduction of sahar (Tor putitora) in cage-cum-pond<br />
integrated system of mixed-sex Nile tilapia (Oreochromis niloticus). Our Nature, 5:52-59.
TECHNICAL REPORTS: INVESTIGATIONS 2009–2011<br />
Table 1. Performance of Nile tilapia and sahar in different treatments. Data based on 100 m 2 pond<br />
size. Mean values with same superscript in the same row are not significantly different (p
45<br />
TECHNICAL REPORTS: INVESTIGATIONS 2009–2011<br />
Table 2. Performance of carps in different treatments. Data based on 100 m 2 pond size. Mean values with<br />
same superscript in the same row are not significantly different (p
TECHNICAL REPORTS: INVESTIGATIONS 2009–2011<br />
Parameters Treatment<br />
GFY (t ha -1 yr -1 )<br />
NFY (t ha -1 yr -1 )<br />
Mrigal Stocking<br />
Total weight (kg)<br />
Mean weight (g)<br />
Harvest<br />
Total weight (kg)<br />
Mean weight (g)<br />
Daily weight gain (g d -1 )<br />
Survival (%)<br />
GFY (t ha -1 yr -1 )<br />
NFY (t/ ha -1 yr -1 )<br />
Carps Combined<br />
Gross Fish Yield (t/ha/yr)<br />
Net Fish Yield (t ha -1 yr -1 )<br />
Survival (%)<br />
0.5±0.1 a<br />
0.5±0.1 a<br />
0.05±0.02 a<br />
6.3±2.4 a<br />
2.2±0.2 a<br />
366.0±9.9 a<br />
2.0±0.1 a<br />
80.0±10.0 a<br />
0.4±0.0 a<br />
0.4±0.0 a<br />
4.1±0.1 a<br />
3.7±0.1 a<br />
79.8±9.1 ab<br />
T1 T2 T3 T4<br />
46<br />
0.5±0.0 a<br />
0.5±0.0 a<br />
0.04±0.01 a<br />
5.6±1.7 a<br />
2.4±0.1 a<br />
353.2±17.2 a<br />
1.9±0.1 a<br />
86.7±3.3 a<br />
0.5±0.0 a<br />
0.5±0.0 a<br />
4.0±0.2 a<br />
3.7±0.1 a<br />
88.8±3.4 a<br />
0.3±0.1 b<br />
0.3±0.1 b<br />
0.06±0.00 a<br />
8.3±0.2 a<br />
2.2±0.3 a<br />
319.5±7.7 a<br />
1.7±0.0 a<br />
90.0±5.8 a<br />
0.4±0.1 a<br />
0.4±0.1 a<br />
3.4±0.1 b<br />
3.1±0.1 b<br />
75.2±0.6 ab<br />
0.4±0.0 ab<br />
0.4±0.0 ab<br />
0.06±0.00 a<br />
7.3±0.9 a<br />
2.7±0.3 a<br />
340.0±20.8 a<br />
1.8±0.1 a<br />
100.0±0.0 a<br />
0.5±0.1 a<br />
0.5±0.1 a<br />
3.6±0.3 ab<br />
3.2±0.2 b<br />
67.8±7.7 b<br />
Table 3. Tilapia recruitment from ponds (100 m 2 ) in different treatments during the experimental period<br />
of 180 days. Mean values with same superscript in the same row are not significantly different (p
Table 5. Overall mean and ranges of water quality parameters in each treatment.<br />
Parameter Treatments<br />
Temperature ( o C) 27.3±0.1<br />
(20.8-31.5)<br />
pH 7.5<br />
(7.2-8.7)<br />
DO (mg L -1 ) 2.9±0.8<br />
(0.6-7.2)<br />
Secchi depth (cm) 27.8±1.7 (16.7-<br />
45.7)<br />
Total alkalinity (mg L -1 ) 190.6±7.1<br />
(112.2-283.1)<br />
TAN (mg L -1 ) 0.37±0.01<br />
(0.09-0.73)<br />
Nitrite-N (mg L -1 ) 0.25±0.04<br />
(0.13-0.50)<br />
SRP (mg L -1 ) 0.42±0.01<br />
(0.24-0.64)<br />
Chlorophyll-a (mg m -3 ) 198.3±24.0<br />
(21.4-340.4)<br />
47<br />
TECHNICAL REPORTS: INVESTIGATIONS 2009–2011<br />
T1 T2 T3 T4<br />
27.3±0.1<br />
(20.7-31.7)<br />
7.6<br />
(7.2-8.9)<br />
3.2±0.7<br />
(0.8-7.1)<br />
25.9±0.8<br />
(15.3-42.2)<br />
183.2±9.1<br />
(130.1-267.5)<br />
0.39±0.04<br />
(0.08-0.82)<br />
0.22±0.03<br />
(0.13-0.38)<br />
0.44±0.02<br />
(0.21-0.73)<br />
156.0±3.0<br />
(34.7-242.4)<br />
27.3±0.1<br />
(20.7-31.9)<br />
7.5<br />
(7.1-9.0)<br />
2.7±0.4<br />
(0.3-6.7)<br />
28.4±2.5<br />
(15.7-42.7)<br />
190.6±9.2<br />
(102.3-276.8)<br />
0.34±0.03<br />
(0.08-0.70)<br />
0.23±0.02<br />
(0.13-0.46)<br />
0.38±0.02<br />
(0.20-0.58)<br />
179.9±13.9<br />
(47.7-295.8)<br />
27.3±0.1<br />
(20.7-31.7)<br />
7.4<br />
(7.1-8.9)<br />
1.9±0.5<br />
(0.3-0.5)<br />
31.0±2.1<br />
(14.7-50.3)<br />
202.0±9.0<br />
(104.4-292.8)<br />
0.36±0.01<br />
(0.09-0.69)<br />
0.21±0.02<br />
(0.13-0.40)<br />
0.45±0.06<br />
(0.22-0.78)<br />
155.8±9.2<br />
(33.6-271.2)<br />
Table 6. Comparative economic analysis (in NRs) for ponds in each treatment during the experiment.<br />
Mean values with same superscript in the same row are not significantly different (p
TECHNICAL REPORTS: INVESTIGATIONS 2009–2011<br />
Body weight (g)<br />
80<br />
70<br />
60<br />
50<br />
40<br />
30<br />
20<br />
10<br />
0<br />
Figure 1. Growth trend of sahar in each treatment during the experiment period of 180 days (25 February to<br />
26 August, 2011).<br />
Mean weight (g)<br />
250.0<br />
200.0<br />
150.0<br />
100.0<br />
50.0<br />
0.0<br />
T3 T4<br />
0 30 60 90 120 150 180<br />
Experimental period (days)<br />
T2 T3 T4<br />
0 30 60 90 120 150 180<br />
Experimental period (days)<br />
Figure 2. Growth trend of Nile tilapia in each treatment during the experiment periodof 180 days (25<br />
February to 26 August, 2011).<br />
48
49<br />
TECHNICAL REPORTS: INVESTIGATIONS 2009–2011<br />
Figure 3. Weekly mean temperature ( o C) of pond water at 0600–0800 h in each treatment during the<br />
experimental period (25 February to 26 August, 2011).<br />
Figure 4. Weekly mean dissolved oxygen (mg L -1 ) of pond water at 0600–0800 h in each treatment during the<br />
experimental period (25 February to 26 August, 2011).
TECHNICAL REPORTS: INVESTIGATIONS 2009–2011<br />
Figure 5. Weekly mean pH of pond water at 0600–0800 h in each treatment during the experimental period (25<br />
February to 26 August, 2011).<br />
Figure 6. Weekly mean secchi depth (cm) of pond water at 0600–0800 h in each treatment during the<br />
experimental period (25 February to 26 August, 2011).<br />
50
51<br />
TECHNICAL REPORTS: INVESTIGATIONS 2009–2011<br />
Figure 7. Fortnightly mean total ammonium nitrogen (TAN) (mg L -1 ) of pond water at 0600–0800 h in each<br />
treatment during the experimental period (25 February to 26 August, 2011).<br />
Figure 8. Fortnightly mean nitrite ammonium nitrogen (Nitrite-N) (mg L -1 ) of pond water at 0600–0800 h in<br />
each treatment during the experimental period (25 February to 26 August, 2011).
TECHNICAL REPORTS: INVESTIGATIONS 2009–2011<br />
Figure 9. Fortnightly mean soluble reactive phosphorous (SRP) (mg L -1 ) of pond water at 0600–0800 h in<br />
each treatment during the experimental period (25 February to 26 August, 2011).<br />
52
53<br />
TECHNICAL REPORTS: INVESTIGATIONS 2009–2011<br />
Study on the Effectiveness of a Pond-Based Recirculating<br />
System for Shrimp Culture<br />
Production System Design and Best Management Alternatives/Experiment/09BMA04UM<br />
Lai Qiuming<br />
Hainan <strong>University</strong><br />
Haikou City, China<br />
Yuan Derun<br />
Network of Aquaculture Centres in Asia-Pacific<br />
Bangkok, Thailand<br />
Liu Liping<br />
Shanghai Ocean <strong>University</strong><br />
Shanghai, China<br />
James S. Diana<br />
<strong>University</strong> of Michigan<br />
Ann Arbor, Michigan, USA<br />
ABSTRACT<br />
An experiment was conducted in four earthen ponds (about 0.35 ha each) at Haoshideng Shrimp Farm,<br />
Hainan Province, China from March 2010 to July 2011 to test efficiency of a pond based recirculating<br />
shrimp culture system equipped with a water treatment facility consisting of a screen drum filter and a<br />
foam fractionating unit. Shrimp post-larvae were stocked at 100 shrimp m -2 and cultured in replicates in a<br />
recirculating system and an open system with 15% weekly water exchange. The experiment was repeated<br />
for twice in two years in the same ponds with similar weather conditions. Shrimp survival rate ranged<br />
from 59 - 64% and shrimp yield ranged from 8081 – 9931 kg ha -1 , with the recirculating system having<br />
significantly higher shrimp survival rate and yield than the open system. When pond water passed through<br />
the treatment facility, TSS, COD, TAN, TKN and TP in water were significantly reduced and DO<br />
increased. Biweekly water sampling and analyses however did not show any significant differences in<br />
water quality for ponds of each system, indicating the water treatment facility had a waste nutrient<br />
removing capacity equivalent to 15% water exchange weekly. The recirculating system was more<br />
environmentally friendly without effluent discharge during production, and produced higher yields than<br />
the exchange system.<br />
INTRODUCTION<br />
Worldwide shrimp production increased rapidly from 71,432 metric tons in 1980 to 3,399,105 metric tons<br />
in 2008 with a total value of USD 14.3 billion (FAO, 2010). Despite continuously increasing market<br />
demand, further development and expansion of shrimp is constrained by environmental concerns<br />
associated with discharge of effluents and dispersal of solid wastes to the environment. This has renewed<br />
interest in recirculating systems due to their perceived advantages, including reduced use of water, greater<br />
control of the culture environment, reduced or eliminated use of antibiotics and hazardous chemicals, and<br />
close to zero discharge of effluents. Attempts have been made to develop recirculating shrimp culture<br />
systems using indoor tanks or raceways (Wyk et al., 1999) and outdoor ponds (Lin, 1995; Neori et al.,<br />
1996; Shpigel and Neori, 1996; Neori and Shpigel, 1999; Jones et al., 2001). Commercial-scale<br />
aquaculture has become possible using these systems and practices. However, a tank- or raceway-based
TECHNICAL REPORTS: INVESTIGATIONS 2009–2011<br />
indoor recirculating system is technically sophisticated, economically expensive, and may be impractical<br />
for the majority of small-scale shrimp farmers in Asia. On the other hand, integrated pond-based<br />
recirculating systems require a large percentage of the farm area to culture treatment organisms such as<br />
seaweeds, bivalves, and filter-feeding fish, which limits their application. Combining shrimp pond culture<br />
with efficient waste treatment components similar to those used in indoor tank systems but with limited<br />
complexity of operation and maintenance may be a feasible alternative.<br />
Hainan province, the only tropical area in China, is one of the major shrimp production areas. The<br />
environmental impact of shrimp culture has become a serious concern. Thus, this experiment was<br />
conducted to test a pond-based recirculating system at Haoshideng Shrimp Farm in Hainan province to<br />
eliminate effluent discharge and use solid wastes as fertilizer for coconut trees.<br />
The specific objectives were:<br />
1. To evaluate effectiveness of combining a screen drum filter and a foam fractionating unit to remove<br />
solid wastes and improve water quality of shrimp culture ponds;<br />
2. To compare water quality parameters in recirculating and open shrimp culture ponds;<br />
3. To compare overall production performance between recirculating and open shrimp culture ponds.<br />
MATERIALS AND METHODS<br />
The experiment was conducted in four earthen ponds of 0.33 ha at Haoshideng Shrimp Farm, at the<br />
northern tip of Hainan province, China from March 2010 to July 2011. Drainage pipes were located in the<br />
center of ponds and pond bottoms and dikes were lined with plastic. Pond water depth was maintained at<br />
about 1.3 m and four paddle wheels were installed in each pond to provide aeration. White shrimp postlarvae<br />
were stocked at 100 pieces m -2 and fed with commercial pellets. The feeding rate was determined<br />
using feeding trays.<br />
The four shrimp ponds were randomly divided into treatment and control groups, with two ponds in each<br />
group. Water in ponds of the treatment group flowed through a screen drum filter and a foam<br />
fractionating unit before recirculating back to the ponds (Figure 1). Water in ponds of the control group<br />
was exchanged weekly at 15%. Unfortunately both ponds and water were limited, constraining the<br />
number of replicates. To overcome this shortfall, the experiment was repeated for twice in two years with<br />
the same ponds and facilities and similar weather conditions.<br />
Water quality parameters in ponds were measured once every two weeks. Temperature, DO, and pH at<br />
dawn were measured in situ using a DO meter (YSI Model DO-100) and a pH meter (YSI Model pH-<br />
200). Secchi disk visibility, water depth, and salinity were measured in situ at 0900 h using a Secchi disk<br />
and a hand-held refractometer. Pond water was sampled once at 0900 h for analyses of specific reactive<br />
phosphorus (SRP), total phosphorus (TP), nitrite nitrogen (NO2-N), nitrate nitrogen (NO3-N), total<br />
ammonia nitrogen (TAN), total Kjedahl nitrogen (TKN), chemical oxygen demand (COD), chlorophyll α,<br />
total suspended solid (TSS), and total alkalinity following standard methods (APHA et al., 1995).<br />
For ponds of the treatment group, water was also sampled once every two weeks before and after<br />
circulation through the screen drum filter and foam fractionating unit for water quality analysis. The same<br />
parameters and methods were used as above.<br />
Data from two replicate experiments were pooled together. Production and pond water quality parameters<br />
were analyzed statistically by analysis of variance (Steele and Torrie, 1980), while paired t-test was used<br />
to compare water quality parameters before and after water treatment in the recirculating system. SPSS<br />
(version 16.0) statistic software package (SPSS Inc., Chicago, USA) was used for statistical analyses.<br />
Differences were considered significant at an alpha level of 0.05. Means were given with ± standard error<br />
(S.E.). Percentage data were transferred to arcsine before analysis but presented in the original form.<br />
54
Figure 1. The work flow chart of the recirculating system for shrimp culture<br />
55<br />
TECHNICAL REPORTS: INVESTIGATIONS 2009–2011<br />
RESULTS<br />
The technical details of the recirculating system (Table 1) included a screen drum filter and a foam<br />
fractionating unit designed for a pond area about 0.35 ha. The screen drum filter separated suspended<br />
solids with particle size larger than 700 μm, through physical filtration while the foam fractionating unit<br />
further partially separated smaller suspended particles and some large organic molecules by injecting air<br />
bubbles and foam formation. Testing of water drained from the central drainage pipe before treatment,<br />
recirculating back to ponds after treatment, and waste water collected from the treatment units showed a<br />
significant decrease of total suspended solids, COD, total ammonia nitrogen, TKN, TP after water<br />
treatment (P
TECHNICAL REPORTS: INVESTIGATIONS 2009–2011<br />
Table 2. Water quality change before and after water passed through the screen drum filter and the foam<br />
fractionating unit in recirculating ponds of the experiment.<br />
Parameters<br />
Before After<br />
Mixed waste water<br />
DO (mg L -1 ) 1 4.80 ±0.51 5.23 ±0.42 -----<br />
pH 7.94±0.21 8.08±0.13 7.41±0.24<br />
TSS (mg L -1 ) 1 0.0412±0.0243 0.0346±0.0204 1.3289± 0.4159<br />
COD (mg L -1 ) 1 7.9536±2.7042 6.9161±2.4644 75.2052±19.5465<br />
Nitrite (mg L -1 ) 0.2036±0.2649 0.2023±0.2642 0.5002±0.5616<br />
Nitrate (mg L -1 ) 0.3054±0.4154 0.3046±0.4155 0.7155±0.7652<br />
TAN (mg L -1 ) 1 0.2598±0.2159 0.2356±0.1984 2.0654±1.6868<br />
TKN (mg L -1 ) 1 4.4895±2.3567 3.9385±2.0335 41.4196±18.1711<br />
TP (mg L -1 ) 1 0.6226±0.1190 0.5432±0.1650 4.1941±1.5894<br />
Parameters followed by a superscript had significant differences between before and after values (p
57<br />
TECHNICAL REPORTS: INVESTIGATIONS 2009–2011<br />
There were also no significant differences in water quality parameters between treatment and control ponds<br />
(Table 4).<br />
Table 4. Values of water quality parameters measured during the experiment.<br />
Parameter Open system Recirculating system<br />
Mean Values<br />
Secchi disk visibility (cm) 48.03±0.89 48.91±3.06<br />
Water depth (cm) 132.69±0.28 133.47±1.03<br />
Temperature ( o C) 29.01±0.09 28.85±0.04<br />
DO (mg L -1 ) 6.72±0.23 6.73±0.04<br />
Salinity (PPT) 30.11±0.08 30.06±0.3<br />
pH 8.1±0.04 8.03±0.02<br />
SRP (mg L -1 ) 0.08±0.01 0.09±0.01<br />
TP (mg L -1 ) 0.72±0.1 0.69±0.07<br />
Nitrite (mg L -1 ) 0.15±0.05 0.16±0.02<br />
Nitrate (mg L -1 ) 0.28±0.01 0.31±0.05<br />
TAN (mg L -1 ) 0.17±0.01 0.22±0.02<br />
TKN (mg L -1 ) 4.15±0.26 4.38±0.43<br />
COD (mg L -1 ) 8.18±0.17 7.95±0.4<br />
Chl-a (mg L -1 ) 265.05±27.08 233.57±33.39<br />
TSS (g L -1 ) 0.05±0.01 0.04±0.01<br />
Alkalinity (mmol dm -3 ) 3.04±0.08 3.1±0.06<br />
End values<br />
Secchi disk visibility (cm) 32.5±2.5 29.5±2.1<br />
Water depth (cm) 136.25±1.25 135.5±1.66<br />
Temperature ( o C) 32±0.06 31.96±0.05<br />
DO (mg L -1 ) 7.29±0.59 7.95±0.55<br />
Salinity (PPT) 30.9±0.25 31.03±0.09<br />
pH 7.55±0.22 7.63±0.11<br />
SRP (mg L -1 ) 0.09±0.04 0.05±0.03<br />
TP (mg L -1 ) 0.73±0.06 0.83±0.09<br />
Nitrite (mg L -1 ) 0.28±0.14 0.24±0.05<br />
Nitrate (mg L -1 ) 0.26±0.12 0.11±0.05<br />
TAN (mg L -1 ) 0.25±0.07 0.29±0.05<br />
TKN (mg L -1 ) 4.5±0.48 5.16±0.47<br />
COD (mg L -1 ) 11.1±0.21 11.51±0.03<br />
Chl-a (mg L -1 ) 298.52±57.81 546.9±128.94<br />
TSS (g L -1 ) 0.04±0.01 0.06±0.02<br />
Alkalinity (mmol dm -3 ) 2.9±0.15 3±0.08
TECHNICAL REPORTS: INVESTIGATIONS 2009–2011<br />
DISCUSSION<br />
Water exchange was traditionally used to maintain pond water quality and reduce waste accumulation in<br />
intensive shrimp culture (Fast, 1991). It however carries the risk of introducing diseases with inflow<br />
water, and could cause drastic changes in pond water quality (Hopkins et al., 1995). In this experiment,<br />
15% of the pond’s volume was exchanged weekly in control ponds. This water exchange maintained<br />
water quality at similar levels to the treatment ponds, but probably was a stress factor which resulted in<br />
lower shrimp survival and production in control ponds.<br />
This experiment did not reveal any significant differences in nutrient contents in pond water between the<br />
open system and the recirculating system. This indicated that the water treatment facility had a nutrient<br />
removing capacity equivalent to a 15% water exchange weekly.<br />
Environmental pollution has been associated with intensive shrimp pond culture since early 1910s<br />
(Pruder, 1992; Phillips et al., 1993; Boyd and Clay, 1998; Fast and Menasveta, 2000). This is primarily<br />
caused by the nature of the systems in which only small portion of the nutrient input is harvested through<br />
shrimp, while the majority is discharged into natural waters (Briggs and Funge-Smith, 1994; Lin, 1995;<br />
Teichert-Coddington et al., 2000; Jackson et al., 2003). Sophisticated waste treatment systems are often<br />
costly and impractical, especially for small scale shrimp farms which are still the dominant types in major<br />
shrimp producing countries such as China. This experiment demonstrated that installation of simple waste<br />
water treatment facilities such as screen drum filters and foam fractionators is effective to remove wastes<br />
produced in shrimp ponds without effluent discharge to surround environment during culture. In<br />
addition, shrimp survival and production was actually improved in the recirculating system. The<br />
recirculating system was therefore more environmentally friendly and more productive than the<br />
traditional open system with period water exchange.<br />
ANTICIPATED BENEFITS<br />
Whiteleg shrimp (Litopeneaus vannamei) is the most important shrimp species cultured throughout the<br />
region. Testing and demonstration of the proposed pond-based recirculating system will lead to further<br />
development, fine tuning and extension of recirculating systems which are suitable to the majority of<br />
small scale shrimp farms in Asia. This will reduce environmental impacts of intensive shrimp culture and<br />
improve its sustainability. Since shrimp imports are dominated by the U.S., better knowledge of<br />
sustainable shrimp culture will benefit NGOs like World Wildlife Fund, as well as private citizens and<br />
markets concerned with reducing the environmental footprint of shrimp culture.<br />
LITERATURE CITED<br />
APHA, AWWA, and WPCF, 1995. Standard Methods for the Examination of Water and Wastewater, 20 th<br />
Edition. American Public Health Association, American Water Works Association and Water<br />
Pollution Control Federation, Washington, D.C.<br />
Boyd, C.E., and J.W. Clay, 1998. Shrimp aquaculture and the environment. Scientific American, June<br />
1998:58-65.<br />
Briggs, M.R.P., and S.J. Funge-Smith, 1994. A nutrient budget of some intensive marine shrimp ponds in<br />
Thailand. Aquaculture and Fisheries Management, 25:789-811.<br />
Fast, A.W., 1991. Marine shrimp pond grow-out conditions and strategies: A review and prognosis.<br />
Reviews in Aquatic Sciences, 3:357-400.<br />
Fast, A.W., and P. Menasveta, 2000. Some recent issues and innovations in marine shrimp pond culture.<br />
Reviews in Fisheries Science, 8:151-233.<br />
FAO, 2008. Fishstat, Fisheries Department, Food and Agriculture Organization, Rome.<br />
58
59<br />
TECHNICAL REPORTS: INVESTIGATIONS 2009–2011<br />
Jackson, C., N. Preston, P., J. Thompson, and M. Burford, 2003. Nitrogen budget and effluent nitrogen<br />
components at an intensive shrimp farm. Aquaculture, 218: 397-411.<br />
Jones, A.B., W.C. Denniso, and N.P. Preston, 2001. Integrated treatment of shrimp effluent by<br />
sedimentation, oyster filtration and macroalgal absorption: a laboratory scale study. Aquaculture,<br />
193:155-178.<br />
Lin, C.K., 1995. Progression of intensive marine shrimp farm in Thailand. In: C.L. Browdy and J.S.<br />
Hopkins (Editors), Swimming Through Troubled Water, Proceedings of the Special Session on<br />
Shrimp Farming, Aquaculture’95. World Aquaculture Society, Baton Rouge, Louisiana, pp. 13-22.<br />
Neori, A., M.D. Krom, S.P. Ellner, C.E. Boyd, D. Popper, R. Rabinovitch, P.J. Davidson, O. Divr, D.<br />
Zuber, M. Ucko, D. Angel, and H. Gordin, 1996. Seaweed biofilters as regulators of water quality in<br />
integrated fish-seaweed culture units. Aquaculture, 141:183-199.<br />
Neori, A., and M. Shpigel, 1999. Using algae to treat effluents and feed invertebrates in sustainable<br />
integrated mariculture. World Aquaculture, June 1999:46-49.<br />
Pruder, G. D., 1992. Marine shrimp pond effluent: characterization and environmental impact. In: J.<br />
Wyban (Editor). Proceedings of Special Session on Shrimp Farming, World Aquaculture Society,<br />
Boton Rouge, LA USA., pp. 187-190.<br />
Phillips, M.J., C.K. Lin, and M.C. Beveridge, 1993. Shrimp culture and the environment: lessons from the<br />
world’s most rapidly expanding warmwater aquaculture sector. In: R.S.V. Pullin, H. Rosenthal, and<br />
J.L. Maclean (Editors). Environment and Aquaculture in Developing Countries. ICLARM<br />
Conference Proceedings 31, Manila, Philippines. pp. 179-191.<br />
Shpigel, M., and A. Neori, 1996. The integrated culture of seaweed, abalone, fish and clams in modular<br />
intensive land-based systems: I. Proportions of size and projected revenues. Aquaculture Engineering,<br />
15:313-326.<br />
Steele, R.G.D., and J.H. Torrie, 1980. Principles and Procedures of Statistics : A Biometrical Approach.<br />
McGraw Hill, New York, USA 533 pp.<br />
Teichert-Coddington, D.R., D. Martinez, and E. Ramirez, 2000. Partial nutrient budgets for semi-<br />
intensive shrimp farms in Honduras. Aquaculture, 190:139-145.<br />
Wyk, P.V., M. Davis-Hodgkins, R. Laramore, K.L. Main, J. Mountain and J. Scarpa, 1999. Farming<br />
Marine Shrimp in Recirculating Freshwater System. Harbor Branch Oceanographic Institute, Florida,<br />
U.S., 220 pp.
TECHNICAL REPORTS: INVESTIGATIONS 2009–2011<br />
Development of Indoor Recirculating Culture Systems for<br />
Intensive Shrimp Production in China<br />
Production System Design and Best Management Alternatives/Experiment/09BMA05UM<br />
Part 1. Objectives 1–3<br />
Jiang Min, Liu Liping, Dai Xilin, Yu Gending, Qu Rui, Li Shikai<br />
Shanghai Ocean <strong>University</strong><br />
Shanghai, China<br />
James S. Diana<br />
<strong>University</strong> of Michigan<br />
Ann Arbor, Michigan, USA<br />
ABSTRACT<br />
Indoor recirculating ponds, traditional ponds and eco-culture ponds were evaluated for water quality and<br />
Litopenaeus vannamei culture in 2010 and 2011. pH changed more dramatically in outdoor ponds.<br />
Nutrient content such as TN, TP, NO2-N, NO3-N, TAN and PO4-P were lowest in eco-culture ponds, then<br />
in indoor RAS, and highest in traditional outdoor ponds. Nutrient budget analysis showed that both<br />
nitrogen and phosphorus gain to ponds occurred mostly from feed (nitrogen: 94.95% in indoor RAS,<br />
85.21% in traditional ponds and 88.06% in eco-culture ponds; phosphorus: 97.06%, 92.34% and 94.87%,<br />
respectively), while 34.24% of nitrogen and 16.84% of phosphorus were retained in shrimp from indoor<br />
RAS, 31.02% N and 13.21% P were retained in shrimp from traditional outdoor ponds, and 35.73% and<br />
15.25% for eco-culture ponds. Phosphorus was more important than nitrogen causing algae blooms<br />
during shrimp culture. Good water quality is essential, but not the only factor that affects shrimp<br />
production.<br />
INTRODUCTION<br />
Shrimp is a favored aquatic product around the world since it has high protein, low fat and is rich in<br />
nutrition. Marine shrimp has a wide range of adaptability to salinity and can be cultured in salt, brackish,<br />
or fresh water. China's shrimp farming industry has made remarkable achievements in the last two<br />
decades. In 1993, shrimp farming was severely damaged by outbreak of epidemic diseases, but it<br />
recovered, and shrimp production increased significantly. This increase was caused by several new<br />
technologies, such as the replacement of cultured species, structural transformation of the pond, and<br />
disinfection of rearing water.<br />
In recent years, culturing shrimp has been widely developed in Shanghai and adjacent provinces.<br />
Traditional aquaculture models are still being applied throughout China, which means high density, high<br />
input, high yield, and high water exchange rate, with much drug use and high consumption of energy.<br />
These traditional models will not prevent outbreak of diseases and cause water pollution by discharging<br />
of wastewater rich in nitrogen, phosphorus, and organic matter to surrounding rivers or lakes. The<br />
damaged water ecosystems then cause further disease outbreaks, which in turn threaten human health and<br />
food safety.<br />
Intensive fish farming has a long history in many countries (Sung-Koo et al., 2000). Production by a<br />
Danish aquaculture company was from 100-300 kg/m 3 . Although there is noticeable gap between China<br />
and other developed countries in facilities and techniques (Chen 1998), indoor intensive aquaculture has<br />
60
61<br />
TECHNICAL REPORTS: INVESTIGATIONS 2009–2011<br />
also been explored around China (Ying, 2001). Water treatment equipment and technologies have been<br />
developed and successful systems have been introduced to culturists. Indoor intensive aquaculture<br />
technologies have been used in culturing abalone, Atlantic turbot (Scophthalmus maximus), and flounder<br />
in Shandong, Liaoning, and other provinces (Chang-fa, 2002).<br />
Indoor intensive aquaculture has been developed worldwide. Recycling intensive shrimp farming has<br />
succeeded in Hawaii, Florida, Texas, and other places, and may produce approximately 5-10 kg shrimp<br />
per cubic meter of water in three months. In indoor intensive shrimp aquaculture, the most important<br />
thing is to control water quality and micro-organisms within desirable levels.<br />
Considering the cost of infrastructure construction, relatively high electricity use, and need for highly<br />
educated or at least high skilled farmers, people in China are uncertain whether to develop indoor RAS or<br />
outdoor eco-culture systems. In this study, three different systems for Litopenaeus vannamei culture were<br />
studied to discuss their feasibility and effect.<br />
METHODS<br />
The research was originally designed to be conducted at Shanghai Bluesea Aquatech Co., Ltd, Fengxian<br />
District, Shanghai, China. In 2010, the infrastructure construction for greenhouse was delayed due to local<br />
policy for land use planning, so our study on an intensive indoor recirculating system (Figure 1) for<br />
Litopenaeus vannamei culture was carried out at Langxia's Special Cultivation Co., Jinshan District,<br />
Shanghai. At the same time, 22 outdoor ponds with traditional culture technologies (Figure 2) and 3 ecoculture<br />
ponds with special water quality control technology (Figure 3) were monitored for survival rate of<br />
shrimp and water quality. According to the results of shrimp production in 2010, we continued the study<br />
only on 17 eco-culture ponds in Bluesea Co. in 2011.<br />
Shrimp culture pond<br />
Foam separator<br />
Sedimentation tank Rough filter<br />
Air-liquid mixter<br />
Figure 1. Flow diagram of our intensive indoor recirculating system.<br />
Figure 2. Schematic of a traditional outdoor pond.<br />
Air compressor<br />
O2-making machine<br />
Ozone generator
TECHNICAL REPORTS: INVESTIGATIONS 2009–2011<br />
Figure 3. Schematic of our outdoor eco-culture pond. Characteristics included: 1-discharge ditch; 2canvas<br />
divider; 3-water purifying net; 4-aerator; 5-aquatic plants; 6-water flow.<br />
The research was accomplished from 2010 to 2011. Table 1 shows the basic information on facilities and<br />
shrimp culture methods for the experimental ponds. Commercial feed was used for the whole culture<br />
period. In 2010, all post-larvae of Litopenaeus vannamei were bought from Hainan. In 2011, shrimp in 12<br />
ponds were from Hainan Province, while shrimp for the other 5 ponds were nursed by Shanghai Bluesea<br />
Aquatech Co., Ltd.<br />
62
Table 1. Basic conditions and shrimp culture methods for the experimental ponds.<br />
Research Pond type Location Ponds Pond size Facilities Shrimp Remarks<br />
year<br />
number<br />
density<br />
2010 Indoor recirculating Jinshan 2 700m<br />
system<br />
District<br />
2 Settling tank, rough filter, foam separator 342 ind/m<br />
combined sometimes with ozone treatment<br />
constituted the water treatment unit.<br />
In each pond, there was a canvas divider<br />
(37.65m×1.70m), 6 aerators and several water<br />
purifying nets.<br />
2 One crop<br />
June-Sept.<br />
2010 Outdoor traditional Fengxian 11 ponds A A:2855±167m<br />
pond<br />
District 11 ponds B<br />
2<br />
B: 3864±171m 2<br />
Three aerators of 1.5 KW were used in each 85.5±6.0<br />
pond.<br />
ind/m 2<br />
Two crops<br />
May- July<br />
July-Sept.<br />
2010 Outdoor eco-culture Fengxian 3 550 m<br />
pond<br />
District<br />
2 Each pond has a piece of canvas, 2 aerators, 200 ind/m<br />
several water purifying nets, air stripping tubes<br />
and aquatic plants<br />
2 One crop<br />
July-Sept.<br />
2011 Outdoor eco-culture Fengxian 17 550 m<br />
pond<br />
District<br />
2 Each pond has a piece of canvas, 2 aerators, 112.5 ind/m<br />
several water purifying nets and air stripping<br />
tubes and aquatic plants<br />
2 One crop<br />
July-Sept.<br />
63
TECHNICAL REPORTS: INVESTIGATIONS 2009–2011<br />
Water samples were collected at the depth of 0.5m, and parameters including pH, dissolved oxygen (DO),<br />
Transparency (SD), suspended solid (SS), total organic carbon (TOC), biological oxygen demand<br />
(BOD5), chemical oxygen demand (CODMn), nitrite (NO2-N), total ammonia (TAN), nitrate-nitrogen<br />
(NO3-N), total nitrogen (TN), phosphate phosphorus (PO4-P), and total phosphorus (TP) were measured.<br />
Table 2 shows the analytic methods used for these water qualities.<br />
Table 2. Water quality parameters and methods.<br />
Parameters Method Parameters Method<br />
SD Secchi disc NO3-N DIONEX IC1500<br />
pH WTW pH330 NO2-N DIONEX IC1500<br />
DO YSI ProPlus TAN Nessler’s reagent spectrophotometry<br />
SS Gravimetric<br />
method<br />
TN Alkaline potassium persulfate digestion-UV<br />
spectrophotometric method<br />
TOC TOC-VCPH TP Ammonium molybdate spectrophotometric method after<br />
alkaline potassium persulfate digestion<br />
CODMn Alkaline<br />
Permanganate<br />
method<br />
BOD5<br />
HACH<br />
BODTrak TM<br />
PO4-P<br />
Chl.a<br />
64<br />
Ammonium molybdate spectrophotometric method<br />
Acetone extraction spectrophotometric method<br />
In the indoor recirculating system, sediment samples were collected from the drain that was in the middle<br />
of the eco-culture pond. In outdoor ponds, sediment was collected from the pond bottom after harvest. TN<br />
and TP were analyzed after samples had been mixed and dried. Feed samples were also analyzed for TN<br />
and TP.<br />
In 2010, shrimp samples were taken from 22 outdoor ponds with traditional culture technologies and 3<br />
eco-culture ponds every two weeks. The white spot syndrome virus (WWSV), taura syndrome virus<br />
(TSV) and infectious hypodermal and hematopoietic necrosis virus (IHHNV) were monitored. At the<br />
same time, the total number of culturable heterotrophic bacteria, and vibrio in pond water were analyzed.<br />
RESULTS AND DISCUSSION<br />
Outdoor ponds had a wider range of pH values and reached higher pH levels compared to indoor ponds<br />
(Tables 3-5). DO was not measurably different among the three pond different types.<br />
Technologies used in indoor RAS and eco-culture ponds showed obvious effects on control of water<br />
quality. Overall, the concentrations of TAN, NO2-N, NO3-N, TN, PO4-P, and TP in eco-culture ponds<br />
were much lower than those in traditional ponds. The indoor recirculating system also had lower<br />
concentrations than outdoor traditional ponds, although type b (larger outdoor ponds) had relatively<br />
similar water quality to the indoor system.
65<br />
TECHNICAL REPORTS: INVESTIGATIONS 2009–2011<br />
Both the indoor RAS and eco-culture ponds used aerators and canvas to manage water flow, and provided<br />
water purifying nets for attachment of microorganisms. Due to the relatively weak light conditions,<br />
aquatic plants did not grow well in the indoor RAS, so they were removed from the ponds soon after<br />
culture began. In outdoor eco-culture ponds, plants grew quite well and absorbed inorganic nutrients<br />
which caused lower levels of dissolved nitrogen and phosphorus compared to indoor RAS.<br />
In eco-culture ponds, no water was discharged directly to the adjacent environment during the culture<br />
period and new water was added only to make up for evaporation loss. In the traditional outdoor ponds,<br />
water was not usually discharged if the water quality was controllable. However, in 2010, the water<br />
quality in type-a ponds decreased dramatically after the first crop of shrimp, so all water was exchanged.<br />
Table 3. Water quality measurements for the indoor recirculating ponds.<br />
Variable<br />
Pond 1 Pond 2<br />
Range x s<br />
Range x s<br />
pH 7.50-8.36 7.92±0.33 7.50-8.59 7.96±0.38<br />
DO (mg/L) 3.70-8.00 6.43±1.21 3.78-8.42 6.37±1.49<br />
TAN (mg/L) 0.231-1.119 0.517±0.263 0.219-1.281 0.558±0.326<br />
NO2-N (mg/L) ND-2.626 0.396±0.842 0.054-0.785 0.318±0.273<br />
NO3-N (mg/L) 2.532-19.663 12.229±6.495 2.372-22.249 13.357±7.695<br />
CODMn (mg/L) 6.45-16.98 9.54±3.49 7.84-22.04 11.03±4.44<br />
Table 4. Water quality measurements for the outdoor traditional ponds.<br />
Pond<br />
size<br />
Variable Range x ± SD Variable Range x ± SD<br />
A temperature(℃) 18.5-30.6 26.18±3.40 NO2-N(mg/L) 0.134-6.652 0.64±0.74<br />
B 18.0-30.7 26.20±3.46 0.025-3.556 0.13±0.44<br />
A SD (cm) 10-90 27.31±13.58 NO3-N(mg/L) 0.100-8.293 1.26±1.20<br />
B 15-65 26.23±12.00 0.056-8.032 0.89±1.18<br />
A SS (mg/L) 4-208 53.80±31.71 TAN (mg/L) 0.049-3.390 0.82±0.71<br />
B 6-156 59.98±32.05 0.098-1.588 0.43±0.26<br />
A pH 7.32-9.60 8.05±0.50 TN (mg/L) 1.023-6.493 2.81±1.12<br />
B 7.31-10.11 8.34±0.43 0.111-7.471 2.63±1.90<br />
A DO (mg/L) 2.23-14.76 5.79±2.10 TP (mg/L) 0.030-0.849 0.37±0.14<br />
B 3.83-15.26 7.85±2.15 0.068-1.731 0.40±0.32<br />
A CODMn (mg/L) 6.42-31.21 15.19±5.50 PO4-P (mg/L) 0.004-0.391 0.09±0.08<br />
B 7.17-44.41 17.62±9.48 0.004-0.242 0.04±0.04<br />
A Chl.a (mg/L) 0.003-0.29 0.10±0.07<br />
B 0.003-0.511 0.16±0.13
TECHNICAL REPORTS: INVESTIGATIONS 2009–2011<br />
Table 5. Water quality measurements for the outdoor eco-culture ponds.<br />
Variable 2010 (pond number=3) 2011 (pond number=17)<br />
Range x s<br />
Range x s<br />
DO(mg/L) 3.20-11.70 5.23±1.68 3.60-12.10 5.58 ±1.98<br />
temperature(℃) 18.8-30.7 25.6±4.32 26.00-31.70 29.07 ±1.51<br />
pH 7.84-8.63 8.23±0.37 7.60-9.80 8.38± 0.46<br />
CODMn (mg/L) 10.88-15.67 13.27±3.12 7.88-40.18 18.36± 6.98<br />
Chl.a (mg/L) 0.03-0.81 0.23±0.11 ND-0.60 0.12 ±0.11<br />
TAN (mg/L) 0.04-0.70 0.30±0.26 0.13-4.08 0.55 ±0.62<br />
NO2-N (mg/L) 0.02-0.461 0.13±0.08 ND-0.20 0.01 ±0.03<br />
NO3-N (mg/L) 1.01-2.67 1.64±0.57 ND-0.70 0.25 ±0.11<br />
TN (mg/L) 0.43-5.15 2.57±1.56 0.58-6.79 2.41 ±1.31<br />
PO4-P (mg/L) 0.006-0.24 0.13±0.06 ND-0.70 0.05 ±0.08<br />
TP (mg/L) 0.04-0.371 0.18±0.14 0.03-0.80 0.22 ±0.13<br />
The amount of culturable heterotrophic bacteria in traditional ponds water was higher than that in ecoculture<br />
ponds. And no vibrio was detected in eco-culture ponds while vibrio was detected in 52% water<br />
samples from traditional ponds even if there showed no obvious disease outbreak. The three kinds of<br />
specific virus including WWSV, TSV and IHHNV were not detected in shrimps of the two different types<br />
of ponds (Table 6). It seemed that good water quality in eco-culture ponds would affect the amount of<br />
bacteria thus lower the probability of bacterial infection.<br />
Table.6 Monitoring results of culturable heterotrophic bacteria and vibrio in water and virus analysis<br />
results in two types of culture ponds in 2010.<br />
Pond type culturable heterotrophic bacteria<br />
(cfu/mL)<br />
Traditional ponds<br />
(n=22)<br />
66<br />
Vibrio<br />
(cfu/mL)<br />
WWSV TSV IHHNV<br />
1.3×10 2 -1.9×10 6 ND -1.4×10 4 ND ND ND<br />
Eco-culture ponds (n=3) 1.4×10 2 ±6.7×10 4 ND ND ND ND<br />
ND: not detected<br />
In 2010, shrimp production per crop in traditional ponds was lower than in indoor RAS or eco-culture<br />
ponds (Table 7). Good water quality seemed valuable in improving shrimp production. But in 2011, there<br />
was a disease outbreak in ponds with shrimp from Hainan, which spread to the other ponds. Virus<br />
monitoring showed that WWSV were found in infected shrimp. By September 26, there were only two<br />
ponds with shrimp that were still healthy, so production values could not be obtained but were obviously<br />
likely to be quite low. Water quality appeared to be quite good even when disease occurred (Table 5).<br />
SPF shrimp and disease prevention should be given a higher priority in these grow-out systems.
67<br />
TECHNICAL REPORTS: INVESTIGATIONS 2009–2011<br />
Table 7. Shrimp production in different experimented ponds in 2010.<br />
Pond type Production per crop (kg/m 2 )<br />
Indoor RAS 0.80-1.40<br />
Traditional ponds 0.29-0.44 (Pond A) , 0.20-0.23 (Pond B)<br />
Eco-culture ponds 0.80-0.92<br />
The nutrient budget was analyzed in indoor recirculating systems in 2010 (Figure 4). Feed input 94.95%<br />
of total nitrogen and 97.06% of phosphorus, with only 4.75% of nitrogen and 2.93% of phosphorus<br />
originating from water. Since shrimp juveniles were so small, they accounted for only 0.30% and 0.01%<br />
of the input. After 100 days of culture, 34.24% of input was bound shrimp tissue, 53.84% was in the<br />
water, and 0.825% was in organisms attached to purifying nets. Shrimp retained only 16.84% of the<br />
phosphorus while the unaccounted proportion was quite high at 34.53%.<br />
attached on<br />
net<br />
0.83%<br />
effluent<br />
4.64%<br />
shrimp<br />
34.24%<br />
water<br />
4.75%<br />
feed<br />
94.95%<br />
a:Nitrogen input<br />
b:Nitrogen ouput<br />
shrimp<br />
0.30%<br />
unaccounted<br />
6.46%<br />
water<br />
53.84%<br />
unaccounted<br />
34.53%<br />
attached on<br />
net<br />
5.59%<br />
water<br />
2.93%<br />
feed<br />
97.06%<br />
c:Phosphorus input<br />
effluent<br />
4.49%<br />
Figure 4. Nutrient budget for the indoor recirculating system.<br />
d:Phosphorus ouput<br />
shrimp<br />
0.01%<br />
water<br />
38.56%<br />
shrimp<br />
16.84%
TECHNICAL REPORTS: INVESTIGATIONS 2009–2011<br />
Feed nutrient input was higher than optimum (Dhirendra et al., 2003). In Dhirendra’s research over 90<br />
days in closed systems, shrimp feed accounted for 76-92% of input nitrogen and 70-91% of phosphorus,<br />
while major sinks of nutrients were in the sediment (14-53% nitrogen and 12-29% phosphorus). In that<br />
study, the drained water at harvest contained 14-28% of input nitrogen and 12-29% of phosphorus.<br />
Li et al. (2007) found that an intensive Litopenaeus vannamei culture had 84.3%-98.3% of nitrogen and<br />
93.2%-97.3% of phosphorus inputs from feed. The major outputs of nitrogen and phosphorus were<br />
sediment (30.9%-43.9% and 51.5%-60.7%) and water exchange (27.5%-36.3% and 8.4%-23.9%). Their<br />
nutrient budget showed that only 14.5%-28.7% of nitrogen and 7.4% and 16.5% of phosphorus were<br />
transformed into harvested shrimp, which was a much lower retention rate than that in our RAS system.<br />
Nitrogen and phosphorus inputs showed similar patterns in both traditional ponds and eco-culture ponds<br />
(Table 8). Nitrogen input to ponds was mostly from feed (85.21% and 88.06%), then water (14.68% and<br />
11.85%). Nitrogen retention in the two types of ponds was different. Since aquatic plants were grown in<br />
eco-culture ponds, 7.89% of nitrogen was incorporated into plants, and the percent of nitrogen retained in<br />
water and sediment was less than that in traditional ponds. Phosphorus input also came mostly from feed<br />
(92.34% and 94.89%) and phosphorus retention was mainly in sediment (48.78% and 38.12%).<br />
Table 8. Nutrient budgets for traditional ponds and eco-culture ponds.<br />
Nitrogen input (%)<br />
Nitrogen output (%)<br />
Phosphorus input (%)<br />
Phosphorus output (%)<br />
Traditional ponds Eco-culture ponds<br />
Feed 85.21 88.06<br />
Water 14.68 11.85<br />
Shrimp 0.11 0.09<br />
Shrimp 31.02 35.73<br />
Water 19.45 11.32<br />
Sediment 33.24 27.09<br />
Aquatic plant - 7.89<br />
Unaccounted 16.29 17.97<br />
Feed 92.34 94.89<br />
Water 7.57 5.04<br />
Shrimp 0.09 0.07<br />
Shrimp 13.21 15.25<br />
Water 11.36 5.69<br />
Sediment 46.78 38.12<br />
Aquatic plant - 6.22<br />
Unaccounted 28.65 34.72<br />
In 2010, algae blooms broke out in two traditional ponds, so we tried to determine the relationship<br />
between chlorophyll-a and other water quality parameters. Chlorophyll-a had highly significant positive<br />
correlations to SS, CODMn, TN and TP. A significant positive correlation also existed between<br />
chlorophyll-a and DO. Highly significant negative correlations were found between chlorophyll-a and SD<br />
68
69<br />
TECHNICAL REPORTS: INVESTIGATIONS 2009–2011<br />
and between chlorophyll-a and PO4-P. No significant correlations were found between chlorophyll-a and<br />
water temperature, pH, NO2 - -N, NO3 - -N and NH3-N. According to the methods for selecting independent<br />
variables in multiple linear regression analysis, four water quality parameters including CODMn, TN, PO4-<br />
P, and TP were used to determine the stepwise regression model which was<br />
Chl.a 4<br />
- 0.03457 0.0217 TN 0.0007 COD Mn- 0.49 PO - P 0.338 TP, ( r <br />
0.6896)<br />
The effects of these four factors to chlorophyll-a were tested using partial regression coefficients. The<br />
most influential water quality parameter to chlorophyll-a was TN, and then TP, PO4-P, and CODMn in<br />
turn.<br />
Using the multiple regression formula, we calculated chlorophyll-a and compared it with measured values<br />
(Figure 5). The results matched reasonably well, especially when the concentration of chlorophyll-a was<br />
high.<br />
Calculated value of Chl.a<br />
(mg/L)<br />
0.8<br />
0.7<br />
0.6<br />
0.5<br />
0.4<br />
0.3<br />
0.2<br />
0.1<br />
0<br />
Calculated value<br />
Measured value<br />
0.0<br />
1 11 21 31 41 51 61 71 81 91101111121131141151161171181191201211221231241<br />
组别<br />
Figure 5. Comparison between calculated and measured chlorophyll-a in traditional ponds in 2010.<br />
We did same statistical analysis on data from 17 eco-culture ponds in 2011 and following equation was<br />
obtained:<br />
Chl.a 0.21809 0.00590COD Mn 0,0092t 0.340TP 0.32PO4<br />
P (r 0.7032)<br />
Compared to traditional ponds, TN was not included in the regression for eco-culture ponds. Combined<br />
technologies of purifying nets and aquatic plants probably played important roles in reducing nitrogen<br />
content of the water, resulting in low correlation between TN and chlorophyll-a. Phosphorus had a closer<br />
relationship with chlorophyll-a, so it is essential to keep phosphorus content low in water. According to<br />
the budget, over 90% of P came from feed but less than 16% of P was converted to shrimp. Improving<br />
utilization rate of feed P is important not only in cost savings, but also in controlling pond algae blooms.<br />
0.8<br />
0.7<br />
0.6<br />
0.5<br />
0.4<br />
0.3<br />
0.2<br />
0.1<br />
Measured value of Chl.a<br />
(mg/L)
TECHNICAL REPORTS: INVESTIGATIONS 2009–2011<br />
ANTICIPATED BENEFITS<br />
Recently, farmers have been encouraged by local government to culture shrimp or other aquatic animals<br />
with standardized methods, which mean acceptable pond types, preferred feed, SPF shrimp, suggested<br />
water quality control technologies, and permitted chemical use. But aquaculture is a complicated industry<br />
and successful production depends on not only technology, but also on management experience, shrimp<br />
quality, and even weather. In this study, we compared three types of shrimp culture models, analyzed<br />
water quality and production differences, evaluated the nutrient budgets and relationship between<br />
chlorophyll-a and other parameters. Combined water quality control technologies can be extended to<br />
other farmers. Some farmers have already begun to use purifying nets, bottom aeration in their ponds, and<br />
aquatic plants or aquatic vegetables to remove nutrients.<br />
In short-term training to farmers, we taught them how to monitor water quality and showed them the basic<br />
technology for eco-culture of shrimp. Further research is still needed, particularly related to disease<br />
control.<br />
LITERATURE CITED<br />
Chang-fa, L., 2002. Environmental friendship aquaculture – Zero discharge integrated recirculating<br />
aquaculture systems. Journal of Dalian Fisheries <strong>University</strong>, 17:220-226.<br />
Chen H.C., 1998. Studies on the better management for highly successful intensive shrimp culture.5 th<br />
Asian Fish Forum, Thailand, 13 p.<br />
Dhirendra, P.T., and C.K. Lin, 2003. Water quality and nutrient budget in closed shrimp (Penaeus<br />
monodon) culture systems. Aquacultural Engineering, 27:159-176.<br />
Li, Y., L. Jian, and W. Qingyin, 2007. Effect of stocking density on input and output of nitrogen and<br />
phosphorus in super-intensive shrimp farming pond. Journal of Fishery Sciences of China, 14:926-<br />
931.<br />
Sung-Koo, K., I. Kong, B.H. Lee, L. Kang, M.G. Lee, K.H. Suh, 2000. Removal of ammonium-N from a<br />
recirculation aquacultural system using an immobilized nitrifier. Aquacultural Engineering, 21:139-<br />
150.<br />
Ying, L. 2001. Control of pH and design of nitrification facilities in closed cycle aquaculture systems.<br />
Fishery Modernization, 3:10-11, 35.<br />
70
71<br />
TECHNICAL REPORTS: INVESTIGATIONS 2009–2011<br />
Part 2. Objective 4<br />
Effects of Microcystis Aeruginosa on Juvenile<br />
Survivial and on Enzyme Activites of Adult Crayfish (Procambarus Clarkii)<br />
Liu Liping, Yue Yaling, Li Kang, Chen Taoying, and Jiang Min<br />
Shanghai Ocean <strong>University</strong><br />
Shanghai, China<br />
James S. Diana<br />
<strong>University</strong> of Michigan<br />
Ann Arbor, Michigan, USA<br />
ABSTRACT<br />
In this paper, larvae of the crayfish Procambarus clarkii were exposed to different concentrations of the<br />
algae M. aeruginosa (1.0×10 6 , 5.0×10 6 , 1.0×10 7 , and 2.0×10 7 cells/mL) to investigate the algae's impact<br />
on larvae survival and hepatopancreatic ultrastructure. At the same time, adult crayfish were exposed to<br />
the same algae concentrations and the total hemocyte count (THC), serum hemocyanin content, and<br />
superoxide dismutase (SOD), peroxidase (POD), phenoloxidase (PO), and Na + /K + -ATPase activities in<br />
gill filaments were evaluated. The results showed that: (1) M. aeruginosa significantly reduced larval<br />
survival rate, such that, when exposed to 1.0×10 7 cells/mL algae, the survival rate was significantly lower<br />
than controls by day 19 (p
TECHNICAL REPORTS: INVESTIGATIONS 2009–2011<br />
aeruginosa on larval body color and hepatopancreas ultrastructure were examined by visual and<br />
transmission electron microscopy (TEM), with the goal to observe the chronic toxicological mechanism<br />
of this algae on crayfish and to provide some useful information to aid healthy cultivation of crayfish.<br />
MATERIAL AND METHODS<br />
The larvae of P. clarkii (body length: 12.09 ±0.98 mm, body weight: 99.20 ±13.80 mg) were contributed<br />
by the Aquatic Life Vegetative Reproduction Laboratory of Shanghai Ocean <strong>University</strong>, and adult<br />
crayfish (body length: 57.52 ±3.84 mm, body weight: 16.90 ±2.10 g) from Shanghai Mudflat Resource<br />
Development Institute. Experimental crayfish were raised in fresh water after it was sterilized with 5%<br />
salt solution and full aeration, after which, healthy individuals of similar size were selected randomly for<br />
experimentation. M. aeruginosa was contributed by the Institute of Hydrobiology, Chinese Academy of<br />
Sciences, and maintained in culture solution BG-11 for 15 d, at 20 ±1 C, with a 12/12 light/dark cycle.<br />
In accordance with the usual algae density in M. aeruginosa blooms (Lu et al., 2005; Vasconcelos et al.,<br />
2001) three concentrations were selected: 1.0×10 6 , 5.0×10 6 , and 1.0×10 7 cells/mL, to examine the effect of<br />
M. aeruginosa on juvenile P. clarkii survival. A control group was maintained in fresh water previously<br />
sterilized by boiling. All treatments were triplicated. The experimental vessel was a square plastic 5 L<br />
casing with 4 L of water. Healthy crayfish larvae were divided randomly into groups of 20 per casing, fed<br />
daily at a fixed time, and the water renewed every two d to maintain a steady algae density. The surviving<br />
larvae were counted daily with death based on lack of appendage movement.<br />
Healthy P. clarkii larvae were cultivated with M. aeruginosa at 5.0×10 6 , 1.0×10 7 , and 2.0×10 7 cells/mL<br />
for 7 d and their hepatopancreas removed after the larvae were washed in sterile water. The collected<br />
tissue was fixed in 2.5% glutaraldehyde and 1% osmic acid, and dehydrated in ethanol. Next, tissue was<br />
embedded in epoxy resin EPON812, microtomed into ultrathin sections with a LKB NOVA slicing<br />
machine (LKB Nova, Bromma, Sweden), dyed twice with uranyl acetate and lead citrate, and observed by<br />
transmitting electron microscope (TEM, H-700, Hitachi, Ltd., Japan) with an accelerating voltage of 75<br />
kV.<br />
Triplicate groups of 60 randomly selected healthy P. clarkii adults were cultivated with M. aeruginosa at<br />
1.0×10 6 , 5.0×10 6 , 1.0×10 7 cells/mL, a control group in sterilized fresh water. Each group was cultivated in<br />
a 200 L plastic storage box and evaluated for THC and serum hemocyanin content, as well as SOD, POD,<br />
PO, and Na+/K+-ATPase activities of their gill filaments. THC was assessed using the method of Yao et<br />
al. (2007), PO activity with the method of Ashida (1971), and hemocyanin content using the combined<br />
methods of Johnson et al. (1984) and Zhang et al. (2005). Also, in consideration of the strong hemocyanin<br />
absorption peak at 280 and 334 nm, the spectrophotometer was adjusted to measure optical density at<br />
both OD280 and OD334. An examination reagent box from Nanjing Jiancheng Company was used to<br />
measure the SOD, POD, and Na+/K+-ATPase.<br />
RESULTS<br />
Juvenile crayfish survival was significantly correlated with the M. aeruginosa concentration. There was<br />
no reduction in survival when algae density was 1.0×10 6 cells/mL; young crayfish began to die after 25 d<br />
of exposure, and at the end of cultivation (30 d), survival rate was 95%, with no significant difference<br />
from the control. However, when algae density was 5.0×10 6 cells/mL, survival rate at 26 d was only<br />
68.33%, significantly lower than the control (p
存活率(%)<br />
survival rate(%)<br />
120<br />
100<br />
80<br />
60<br />
40<br />
20<br />
0<br />
control<br />
1.0×10⁶cells/ml<br />
5.0×10⁶cells/ml<br />
1.0×10⁷cells/ml<br />
73<br />
TECHNICAL REPORTS: INVESTIGATIONS 2009–2011<br />
1 3 5 7 9 11 13 15 17 19 21 23 25 27 29<br />
时间(天)<br />
time(d)<br />
Figure 1. Effect of different densities of M. aeruginosa on survival rate of P. clarkii larvae.<br />
Observation by anatomical lens revealed that, compared to controls, P. clarkii larvae showed differences<br />
in testa spots and body color when cultivated in different densities of M. aeruginosa. Specifically, testa<br />
spots and body color were darker in M. aeruginosa at density of 1.0×10 7 and 2.0×10 7 cells/mL. Closer<br />
observation of the carapace revealed that the hepatopancreas was swollen to varying degrees (Figure 2).<br />
Figure 2. Effect of M. aeruginosa on body color of crayfish larvae. Left, morphology of whole body;<br />
right, hepatopancreas; A, 5.0×10 6 cells/mL; B, 1.0×10 7 cells/mL; and C, control.<br />
TEM images of larval hepatopancreas revealed damaged hepatopancreatic cells in crayfish cultivated at<br />
1.0×10 7 and 2.0×10 7 cells/mL algae (Figure 3), including damage to cell chromatin around the nuclear<br />
membranes, nucleolus margination, large cytoplasmic vacuoles, and organella damage; while<br />
hepatopancreatic cells of the control group were structurally complete, with evenly distributed chromatin,<br />
and lipid droplets similar to a yolk or fat granule. The group reared in the lowest algae density also had<br />
relatively complete cell membranes in their hepatopancreas, with no obvious damage.
TECHNICAL REPORTS: INVESTIGATIONS 2009–2011<br />
Figure 3. Ultrastructure of crayfish larvae hepatopancreas. A, cell nucleus; B, cellular organelle/lipid<br />
droplet; C, cell membrane breakage site; D, vacuoles between cytoplasm.<br />
The THCs of adult P. clarkii were increasingly affected with increasing M. aeruginosa density (Figure 4);<br />
while the THCs of controls were basically the same as the 1.1×10 6 cells/mL treatment group. After<br />
exposure to algae-laden water for 24 h, adult crayfish THCs in each experimental group rose, with higher<br />
density groups at 5.0×10 6 and 1.0×10 7 cells/mL showing significant differences compared to the control<br />
(p
280nm下血蓝蛋白含量(mg/ml)<br />
hemocyanin density tested under<br />
280nm(mg/ml)<br />
8<br />
7<br />
6<br />
5<br />
4<br />
3<br />
2<br />
1<br />
0<br />
10<br />
9<br />
8<br />
7<br />
6<br />
5<br />
4<br />
3<br />
2<br />
1<br />
0<br />
control 1million<br />
5million 10million<br />
75<br />
TECHNICAL REPORTS: INVESTIGATIONS 2009–2011<br />
Evaluation of the effect of M. aeruginosa density on P. clarkii hemocyanin revealed that the serum<br />
hemocyanin concentration experienced no significant variation after 3 d of algae exposure but decreased<br />
significantly after 5 d (Figure 5), with the hemocyanin concentration of the two higher algae density<br />
groups significantly lower than the control (p
TECHNICAL REPORTS: INVESTIGATIONS 2009–2011<br />
but soon afterwards, began to decrease and was finally restored to initial values (Figure 6). In addition,<br />
PO activity in groups with 1.0×10 6 and 5.0×10 6 cells/mL were not significantly different from the control.<br />
超氧化物歧化酶(U)<br />
SOD(U)<br />
Figure 6. Effect of M. aeruginosa density on adult P. clarkii PO activity.<br />
M. aeruginosa in lower concentrations, 1.0×10 6 and 5.0×10 6 cells/mL, produced no significant effect on<br />
P. clarkii SOD activity, but at the highest concentration, SOD activity was significantly restrained (Figure<br />
7). SOD activity in the highest algae group decreased slightly after 1 d of exposure and dropped<br />
significantly after 5 d of exposure (p
77<br />
TECHNICAL REPORTS: INVESTIGATIONS 2009–2011<br />
(p
TECHNICAL REPORTS: INVESTIGATIONS 2009–2011<br />
DISCUSSION<br />
Survival And Health Status Of P. Clarkii Larvae Were Influenced by M. aeruginosa in the culture water,<br />
which corresponded to the fact that cyanobacteria blooms in water bodies cause death in different<br />
organisms (Babica et al., 2006; Zimba et al., 2001; Xie et al., 2004; Obernum et al., 1999; Yokoyama and<br />
Park, 2002, 2003), and indicated that even crayfish with strong environmental tolerances were affected by<br />
M. aeruginosa. Microcystin is a type of hepatotoxin, which can result in liver swelling and congestion,<br />
increasing the liver to body weight ratio and causing a series of enzymological changes. Moreover, this<br />
toxin can induce apoptosis in various cells (Amorim and Vasconcelos, 1999; Fu et al., 2004; Lankoff,<br />
2004) and cause framework damage to cell ultrastructures (Beasley et al., 2000). In this study, the larval<br />
hepatopancreas was found to experience swelling to different degrees and hepatopancreas necrocytosis<br />
after algal exposure for 7 d, but no apoptotic body or cell nucleus breakage was observed in the process.<br />
Therefore, the larval hepatopancreas was strongly affected by high concentration of microcystin, resulting<br />
in large quantities of necrocytosis. However, further research is required to understand whether M.<br />
aeruginosa at low density can also induce hepatopancreatic apoptosis.<br />
Among crustaceans, hemocyte count and PO activity have direct correlations with immunity. Blood<br />
lymphocytes hold a central position in the immune system and THC can reflect, to some extent, the<br />
immunological stress, or physical condition of an organism and has been adopted as one of the indicators<br />
for measuring immunity level of crustaceans (Huang et al., 2007). M. aeruginosa caused THCs to rise in<br />
P. clarkia during our exposures, indicating that the algae stimulated their immune system to generate<br />
more blood lymphocytes in an effort to resist the adverse environment. PO is the most important<br />
antioxidizing element in crustacean body fluid and is the first defensive line against external damage,<br />
yielding PO activity as a common indicator of immunity level. PO activity strengthened significantly after<br />
algal exposure in this study, which was similar to results reported by Huang et al. (2007) and Lei et al.<br />
(2001) that PO activity strengthened with different infection status. As the respiratory pigment of<br />
crustaceans, hemocyanin is dispersed in the hemolymph, performing oxygen transport and participating in<br />
immune defense, exhibiting functions similar to phenoloxidase under the influence of certain substances<br />
(Adachi et al., 2003). Yoganandhan et al. (2003) found that the hemocyanin ratio in Penaeus indicus<br />
declined significantly after WSSV infection, which agrees with the results in our study, and this may<br />
indicate that the algae caused hemocyanin decomposition and reduced oxygen transport, and damage to<br />
the crayfish immune system. When algal density reached a higher level, it rapidly stimulated the crayfish<br />
immune system, generating large numbers of blood lymphocytes and releasing phenoloxidase as well as<br />
similar immunological factors to participate in the immune response.<br />
Antioxidases, such as SOD and POD, are important in metabolic detoxification in organisms. SOD is a<br />
crucial enzyme in balancing oxidation and antioxidation, and variation in its activity directly reflects the<br />
ability to eliminate free radicals in the organism itself. Research has demonstrated that SOD activity<br />
declines significantly when aquatic organisms are in an adverse environment (Hu et al., 2009; Zhang et<br />
al., 2007).<br />
In this study, the SOD activity of P. clarkii was also found to decline significantly after exposure to M.<br />
aeruginosa, which was similar to a report by Sun and Ding (1999) on the effect of ammonia nitrogen on<br />
the premonition of Penaeus chinesis. POD performs the function of catalytic decomposition of oxides or<br />
peroxides, as well as oxygenolysis of toxins (Ashida and Soderhall, 1984; Soderhall and Cerenius, 1998).<br />
In the current work, serum POD activity of crayfish rose significantly after exposure to high-density algae<br />
for 1 d, demonstrating that oxides increased significantly in the crayfish with algae exposure and that<br />
POD was generated in large amounts by the organisms and could have helped eliminate excessive internal<br />
oxides. The changes of antioxidase activity observed here may have been caused by the M. aeruginosa<br />
generated microcystin MC-LR, which produced damage after crossing the cell membrane. Research has<br />
indicated that, after entering cells, algae toxins can produce oxidative damage, lipid peroxidation, DNA<br />
chain breakage, and oxidative modification of proteins (Ding et al., 2000; Chen et al., 2006; Fan et al.,<br />
2008), which are features that appear common to the toxicological mechanisms of M. aeruginosa.<br />
78
79<br />
TECHNICAL REPORTS: INVESTIGATIONS 2009–2011<br />
For crustaceans, Na + /K + -ATPase is an important osmoregulatory enzyme, mainly scattered in the gill,<br />
hepatopancreas, and antennal gland, and its activity is an important measure of an organism's<br />
physiological metabolism and growth status (Pan and Liu, 2005). In the present study, Na + /K + -ATPase<br />
activity changes observed in gill filaments were similar to results of Zhao et al. (2006) on the effect of salt<br />
concentration on Na + /K + -ATPase activity in Acipenser schrenckii gill tissue. One possible explanation for<br />
this effect is that gill tissue had direct access to the algae in the external environment and experienced a<br />
stress response when Na + /K + -ATPase activity declined rapidly. However, after residing in an adverse<br />
environment for some time, the crayfish entered into an active adjustment stage in which Na + /K + -ATPase<br />
activity increased significantly, regulating the cell osmotic pressure and performing the functions of<br />
respiration, excretion, osmoregulation, and disease defense. Consequently, the crayfish successfully<br />
adapted to the external environment.<br />
The stress response in organisms is an active fight against adverse environmental conditions and when<br />
abrupt changes in environmental factors exceed the crustaceans' endurance, metabolic disorders,<br />
osmoregulation dysfunction, immunity decline, or even death can result (Guo et al., 2007). When the<br />
external environmental factors are within their endurance levels, they can adapt with a buffering stress<br />
response. The experimental results here confirmed that: the significant death rate in juvenile P. clarkii<br />
was caused only when the M. aeruginosa density reached 1.0×10 7 cells/mL, beyond the endurance of the<br />
juveniles. However, the adult enzyme activities experienced increases and decreases at a variety of<br />
exposure densities, finally stabilizing and demonstrating that when the algae density reached 1.0×10 7<br />
cells/mL, adults managed to show great tolerance, gradually adapting to the external environment after a<br />
clear stress response stage.<br />
ACKNOWLEDGMENTS<br />
The authors of this paper want to express their gratitude to General Manager Shen Hong from Shanghai<br />
Mudflat Resource Development Institute who provided generous support for this research, and also to Dr.<br />
Wang Chun and undergraduate students He Yue-Feng and Wang Jia-Qi in Shanghai Ocean <strong>University</strong>,<br />
who have given their kind help in the experiments.<br />
LITERATURE CITED<br />
Adachi, K., T. Hirata, and T. Nishioka, 2003. Hemocyte components in crustaceans convert hemocyanin<br />
into a phenoloxidase-like enzyme. Comparative Biochemistry and Physiology Part B: Biochemistry<br />
and Molecular Biology, 134:135-141.<br />
Amorim, A., and V. Vasconcelos, 1999. Dynamics of microcystins in the mussel Mytilus<br />
galloprovincialis. Toxicon, 37:1041-1052.<br />
Andersen, R.J., H.A. Luu, and D.X.Z. Chen, 1993. Chemical and biological evidence links microcystins<br />
to salmon "netpen liver disease." Toxicon, 31:1315-1323.<br />
Ashida, M., 1971. Purification and characterization of pre-phenoloxidase from hemolymph of the<br />
silkworm Bombyx mori. Archives of Biochemistry and Biophysics, 144:749-762.<br />
Ashida, M. and K. Söderhäll, 1984. The prophenoloxidase activating system in crayfish. Comparative<br />
Biochemistry and Physiology Part B: Comparative Biochemistry, 77:21-26.<br />
Babica, P., L. Bláha, and B. Maršálek, 2006. Exploring the natural role of microcystins-a review of<br />
effects on photoautotrophic organisms. Journal of Phycology, 42:9-20.<br />
Beasley, V.R., R.A. Lovell, and K.R. Holmes, 2000. Microcystin-LR decreases hepatic and renal<br />
perfusion, and causes circulatory shock, severe hypoglycemia, and terminal hyperkalemia in<br />
intravascularly dosed swine. Journal of Toxicology and Environmental Health Part A, 61(4):281-303.<br />
Chen, G., Z. Yang, and M. Tao, 2006. Toxicological study of fresh water microcystins. Journal of Hygiene<br />
Research, 35:120-122.<br />
Ding, W., H. Shen, and C. Ong, 2000. The critical role of ROS and mitochondrial membrane permeability<br />
in microcystin-LR induced rapid apoptosis in primary rat hepatocytes. Hepatology, 32:547-555.<br />
Fan, Y., S. Zhan, and J. Gan, 2008. Toxicity of microcystin and their prevention. Chemistry of Life,<br />
28:101-103.
TECHNICAL REPORTS: INVESTIGATIONS 2009–2011<br />
Fu, W.Y., M.W. Li, J.P. Chen, and L.H. Xu, 2004. Detection of apoptosis of renal cells of mice induced by<br />
microcystin-LR . Acta Hydrobiologica Sinica, 28:101-102.<br />
Guo, C., Y. Guan, and B. Liu, 2007. Effect of temperature, pH and salinity on gill Na + /K + -ATPase activity in<br />
Procambarus clarkii. Chinese Journal of Zoology, 42:96-102.<br />
Hu, G.F., Z. Li, H.W. Liang, C.Z. Wang, Q.C. Wu, X.Z. Luo, and G.W. Zou, 2009. Effects of Cadmium<br />
on SOD and CAT in hepatopancreas, antennary gland and gill of Procambarus clarkii. Journal of Agro-<br />
Environment Science, 28:1806-1811.<br />
Huang, X.X., H.Q. Zhou, and L.P. Song, 2007. The effect of acute infection on the innate immune activities<br />
of the shrimp, Fenneropenaeus chinensis. Acta Hydrobiologica Sinica, 31:325-331.<br />
Johnson, B.A., C. Bonaventura, and J. Bonaventura, 1984. Allosteric modulation of Callinectes sapidus<br />
hemocyanin by binding of L-lactate. Biochemistry, 23:872-878.<br />
Lankoff, A., 2004. The uptake kinetics and immunotoxic effects of microcystin-LR in human and chicken<br />
peripheral blood lymphocytes in vitro. Toxicology, 204:23-40.<br />
Lei, Z.H., J. Huang, B. Yang, and K.K. Yu, 2001. Immune factors in haemolymph supernatant of Penaeus<br />
chinensis infected by WSSV. Journal of Fishery Sciences of China, 8(4): 46-51.<br />
Lu, K.H., C.H. Jin, and Y.C. Wang, 2005. Control of cyanobacterial blooms in eutrophication lakes by<br />
tilapia. Journal of Fisheries of China, 29:811-818.<br />
Oberemm, A., J. Becker, and G.A. Codd, 1999. Effects of cyanobacterial toxins and aqueous crude<br />
extracts of cyanobacteria on the development of fish and amphibians. Environmental Toxicology,<br />
14:77-88.<br />
Orr, P.T., G.J. Jones, and R.A. Hunter, 2001. Ingestion of toxic Microcystis aeruginosa by dairy cattle<br />
and the implications for microcystin contamination of milk. Toxicon, 39:1847-1854.<br />
Pan, L., and H. Liu, 2005. Review on the osmoregulation of crustaceans. Journal of Fisheries of China,<br />
29:109-115.<br />
Park, H.D., Y. Sasaki, and T. Maruyama, 2001. Degradation of the cyanobacterial hepatotoxin<br />
microcystin by a new bacterium isolated from a hypertrophic lake. Environmental Toxicology,<br />
16(4):337-343.<br />
Reinikainen, M., J.A.O. Meriluoto, and L. Spoof, 2001. The toxicities of a polyunsaturated fatty acid and<br />
a microcystin to Daphnia magna. Environmental toxicology, 16:444-448.<br />
Söderhäll, K., and L. Cerenius, 1998. Role of the prophenoloxidase-activating system in invertebrate<br />
immunity. Current Opinion in Immunology, 10:23-28.<br />
Sun, J.J., and M.L. Ding, 1999. Effect of ammonia-N on anti-disease ability of Penaeus chinensis,<br />
Oceanologia Et Limnologia Sinica, 30:267-272.<br />
Vasconcelos, V., S. Oliveira, and F.O. Teles, 2001. Impact of a toxic and a non-toxic strain of Microcystis<br />
aeruginosa on the crayfish Procambarus clarkii. Toxicon, 39:1461-1470.<br />
Xie, L., P. Xie, and K. Ozawa, 2004. Dynamics of microcystins-LR and-RR in the phytoplanktivorous<br />
silver carp in a sub-chronic toxicity experiment. Environmental Pollution, 127:431-439.<br />
Yao, C.L., C.G. Wu, and J.H. Xiang, 2007. Changes in antimicrobial activity of plasma and haemocytes in<br />
Fenneropenaeus chinese challenged by killed Vibrio anguilarum . Oceanologia Et Limnologia Sinica,<br />
38(1): 1-7.<br />
Yoganandhan, K., S. Thirupathi, and A.S. Hameed, 2003. Biochemical, physiological and hematological<br />
changes in white spot syndrome virus-infected shrimp, Penaeus indicus. Aquaculture, 221:1-11.<br />
Yokoyama, A., and H.D. Park, 2002. Mechanism and prediction for contamination of freshwater<br />
bivalves(Unionidae) with the cyanobacterial toxin microcystin in hypereutrophic Lake Suwa, Japan.<br />
Environmental Toxicology, 17:424-433.<br />
Yokoyama, A., and H.D. Park, 2003. Depuration kinetics and persistence of the cyanobacterial toxin<br />
microcystin-LR in the freshwater bivalve Unio douglasiae. Environmental Toxicology, 18:61-67.<br />
Zha, G.C., C.Q, Zhou, J.R. Huang, J.G. He, and X.W. Mai, 2004. Studies on the structure and biodiversity<br />
of the microplankton community in Litopenaeus vannamei desalination culture ponds. Acta Ecologica<br />
Sinica, 24(8):1752-1759.<br />
80
81<br />
TECHNICAL REPORTS: INVESTIGATIONS 2009–2011<br />
Zha, G.C., C.Q. Zhou, X.G. Niu, 2007. Harm of Microcystis aeruginosa to Litopenaeus vannamei Low<br />
Salinity Stocking. Acta Scientiarum Naturalium Universitatis Sunyatseni, 46(2):64-67.<br />
Zhang, J., J.X. Wang, Y.J. Zhang, C.Q. Liu, and H.T. Cui, 2007. Effect of starvation on metabolism and<br />
SOD activity of Macrobrachium nipponensis. Journal of Hebei <strong>University</strong> (Natural Science Edition),<br />
27:537-540.<br />
Zhang, W.H., X.Q. Xu, and C.Q. Qiu, 2001. Advance in study on microcystins in aquatic environment.<br />
Research of Environmental Sciences, 14(2):57-61.<br />
Zhang, Y.L., S.Y. Wang, G.M. Liu, Y. Chen, and X.H. Zou, 2005. Variation of phenoloxidase activity<br />
affected by hemocyanin in shrimp Penaeus vannamei. Journal of Fishery Sciences of China, 12:402-<br />
406.<br />
Zhao, F., P. Zhuang, and L. Zhang, 2006. The influence of salinity acclimation on activity of Na + /K + -<br />
ATPase in branchial epithelium, concentration of ions and osmolarity in serum of Acipenser schrenckii .<br />
Journal of Fisheries of China, 30:444-449.<br />
Zimba, P., L. Khoo, and P.S. Gaunt, 2001. Confirmation of catfish, Ictalurus punctatus (Rafinesque),<br />
mortality from Microcystis toxins. Journal of Fish Diseases, 24:41-47.<br />
Zimba, P.V., A. Camus, and E.H. Allen, 2006. Co-occurrence of white shrimp, Litopenaeus vannamei,<br />
mortalities and microcystin toxin in a southeastern USA shrimp facility. Aquaculture, 261:1048-1055.<br />
Zurawell, R.W., H. Chen, and J.M. Burke, 2004. Hepatotoxic cyanobacteria: a review of the biological<br />
importance of microcystins in freshwater environments. Journal of Toxicology and Environmental<br />
Health, Part B, 8(1):1-37.
TECHNICAL REPORTS: INVESTIGATIONS 2009–2011<br />
Identifying Best Practices to Improve the Giant River Prawn Industry in<br />
Thailand<br />
Production System Design and Best Management Alternatives/Activity/09BMA06UM<br />
Yuan Derun<br />
Network of Aquaculture Centres in Asia-Pacific<br />
Bangkok, Thailand<br />
James S. Diana and Vicki Schwantes<br />
<strong>University</strong> of Michigan<br />
Ann Arbor, Michigan, USA<br />
Liu Liping<br />
Shanghai Ocean <strong>University</strong><br />
Shanghai, China<br />
ABSTRACT<br />
In 2005, the <strong>University</strong> of Michigan project conducted surveys of prawn farming in Thailand, with intent<br />
to understand the environmental impact. The end results showed that prawn farming was lucrative for<br />
farmers, but there were major concerns about eutrophication of water sources, overuse of feed, and other<br />
environmental impacts symptomatic of over-intensity of prawn production. As a follow-up to that<br />
evaluation, this August, we brought together a group of managers and farmers and planned to review the<br />
status of prawn farming and educate them on how to minimize the environmental impacts from farming<br />
practices. As the workshop progressed, we were surprised to find that prawn farming had changed<br />
dramatically over the past six years. The typical prawn farmer had significantly reduced stocking density,<br />
tended to use no exchange water systems for production, and reduced total yield while achieving a higher<br />
standard product from the grow-out systems. As a result, the concerns about eutrophication and<br />
overfeeding had largely disappeared over that six-year period.<br />
To our surprise, prawn farmers in Thailand had willingly changed their practices to a very substantial<br />
degree. In 2005, 96% of all farmers practiced intensive monoculture. While we were unable to conduct a<br />
similar survey with statistical methodology in the 2011 workshop, reports at the workshop indicated that<br />
80% of farmers today used polyculture instead. The common polyculture was with Macrobrachium<br />
(about 6 pieces per square meter) and white shrimp (Litopenaeus vannamei) (about 12 pieces per square<br />
meter) in fresh water. This is in comparison with monoculture of prawns, which was done at about 40<br />
pieces per square meter; so effectively, the overall density had decreased by at least one-half. Similarly, in<br />
2005, feeds were often handmade and were of low quality with many fine particles, while in polyculture,<br />
commercial feeds were used, which are better controlled for quality. Feeding rates are now evaluated<br />
using feeding trays. Water exchange in 2005 was about 60% per pond per week, while currently, water is<br />
exchanged at a much lower rate, and most of that water is retained. These changes have occurred in part<br />
because of the adoption of the GAP standards for shrimp and applying them to prawns, and in part<br />
because of the move by the Thai Department of Fisheries to help farmers become more environmentally<br />
aware, as well as more profitable. In the new aquaculture system, most farmers rely on freshwater culture<br />
of white shrimp at low density for their basic income, and then the culture of prawn at even lower<br />
densities of prawns for supplementing their income because of the high market value.<br />
INTRODUCTION<br />
Aquaculture has a major role of producing food for both export and local markets. The case of the giant<br />
river prawn (Macrobrachium rosenbergii) is interesting in the region of Southeast Asia, particularly<br />
Thailand. Prawns are very popular food items in this region and, as such, contribute largely to the local<br />
82
83<br />
TECHNICAL REPORTS: INVESTIGATIONS 2009–2011<br />
economy. In 2008, the total production of prawns in Thailand was approximately 32,000 metric tons,<br />
worth about $131 million. The production of prawns has maintained itself at around 30,000 tons since<br />
2003, while the value has increased dramatically – almost doubling during that same time period. Clearly,<br />
the quality of the crop and the value per pound has increased over that time period. Prawns grown in<br />
Thailand are entirely marketed locally, with no export reported. As such, they are not necessarily good<br />
candidates for certification or market forces driving more sustainable production for several reasons.<br />
First, Thais already understand and value aquaculture. Second, local consumption eliminates<br />
organizations, such as importers from Europe or America, having any say in the standards for growing<br />
prawn. And third, local consumers in Thailand are more concerned about price than environmental<br />
performance.<br />
In 2005, Schwantes et al. (2009) conducted surveys of prawn farming in Thailand, with intent to<br />
understand the environmental impact. The end results showed that prawn farming was lucrative for<br />
farmers, but there were major concerns about eutrophication of water sources, overuse of feed, and other<br />
environmental impacts symptomatic of over-intensity of prawn production. As a follow-up to that<br />
evaluation, we conducted a workshop in August 2011 intending to convince prawn farmers to undertake<br />
more sustainable production practices. We brought together a group of managers and farmers, reviewed<br />
the status of prawn farming, and educated famers and outreach personnel on how to minimize the<br />
environmental impacts from farming practices.<br />
RESULTS<br />
The workshop was held from 8-10 August 2011 in Bangkok, Thailand. A list of participants is provided<br />
in Table 1. The meeting agenda is shown in Table 2.<br />
As the workshop progressed, we were surprised to find that prawn farming had changed dramatically over<br />
the past six years. The typical prawn farmer had significantly reduced stocking density, tended to use no<br />
exchange water systems for production, and reduced total yield while achieving a higher standard product<br />
from the grow-out systems. As a result, the concerns about eutrophication and overfeeding had largely<br />
disappeared over that six-year period. Farmers began following the Thailand GAP (good aquaculture<br />
practices) standards for Thai shrimp. The shrimp GAP includes ten requirements that are either major<br />
(must be adhered to), minor (requires 70% compliance), or recommended (requires 60% compliance).<br />
These include major categories of: farm location, farm management, use of drugs, effluent and sediment<br />
management, energy use, farm sanitation, harvest and post-harvest handling, labor and welfare, social and<br />
environmental responsibilities, and record keeping. While the system is voluntary, GAP standards have<br />
been adopted by a large number of shrimp farmers in an effort to improve the sustainability of their<br />
operations. Prawn farmers have adopted the same practices in absence of specific prawn standards.<br />
To our surprise, prawn farmers in Thailand had willingly changed their practices to a very substantial<br />
degree. In 2005, 96% of all farmers practiced intensive monoculture. While we were unable to conduct a<br />
similar survey with statistical methodology in the 2011 workshop, reports at the workshop indicated that<br />
80% of farmers today used polyculture instead. The common polyculture was with Macrobrachium<br />
(about 6 pieces per square meter) and white shrimp (Litopenaeus vannamei at about 12 pieces per square<br />
meter) in fresh water. This is in comparison with monoculture of prawns, which was done at about 40<br />
pieces per square meter in 2005; so effectively, the overall density had decreased by at least one-half.<br />
Similarly, in 2005, feeds were often handmade and were of low quality with many fine particles, while in<br />
polyculture, commercial feeds were used, which are better controlled for quality. Feeding rates are now<br />
evaluated using feeding trays, mainly focused on the shrimp crop. Water exchange in 2005 was about<br />
60% per pond per week, while currently, water is exchanged at a much lower rate, and most of that water<br />
is retained. These changes have occurred in part because of the adoption of the GAP standards for shrimp<br />
and applying them to prawns, and in part because of the move by the Thai Department of Fisheries to help<br />
farmers become more environmentally aware, as well as more profitable.
TECHNICAL REPORTS: INVESTIGATIONS 2009–2011<br />
In the new aquaculture system, most farmers rely on freshwater culture of white shrimp at low density for<br />
their basic income, and then the culture of prawn at even lower densities for supplementing their income<br />
because of the high market value. As a result, their overall production has stabilized over the past six<br />
years, while the value of their crop has increased dramatically, and the environmental impact of their<br />
growing system has decreased dramatically. Assuming the reports presented at our workshop reflect what<br />
is actually happening throughout the industry, this is a win-win situation, with prawn culture remaining<br />
more profitable, while improving its environmental performance. Perhaps the most interesting portion of<br />
this impact was the rapidity of this change; in about six years, the industry has changed dramatically from<br />
one dominated by intensive monoculture, to one using more semi-intensive polyculture. Both systems are<br />
very profitable, but the current system appears to be more so because of the lower impact of diseases and<br />
the high value of large prawns, which grow more readily in the lower density culture systems.<br />
DISCUSSION<br />
The results of the workshop were surprising. Yuan Derun coordinated the workshop, inviting 14 farmers,<br />
as well as 17 researchers or government managers of aquaculture systems. Because the workshop was<br />
located in Bangkok, most farmers were from Suphanburi or Ratchaburi, two provinces near Bangkok.<br />
However, their views almost certainly reflect those of the industry, as those two provinces are the major<br />
producers of prawns in Thailand.<br />
Overall, the workshop was a success in so many ways. From the <strong>AquaFish</strong> <strong>CRSP</strong> perspective, major<br />
changes in prawn culture have occurred in Thailand as a result of increasing scrutiny for environmental<br />
performance. The aquaculture programs continue to be profitable –even more profitable than before – but<br />
at the same time, much more environmentally sustainable. Intensive efforts by the Thai Department of<br />
Fisheries, various research groups including NACA (Network of Aquaculture Centers in Asia-Pacific)<br />
and the <strong>AquaFish</strong> <strong>CRSP</strong>, and the results of our previous study led this movement toward more sustainable<br />
production. More than anything, this change demonstrates the importance of sustainability to<br />
aquaculturists in Thailand and bodes well for the future of aquaculture in that region.<br />
LITERATURE CITED<br />
Schwantes, V.S., J.S. Diana, and Y. Yi, 2009. Social, economic, and production characteristics of giant<br />
river prawn Macrobrachium rosenbergii culture in Thailand. Aquaculture, 287:120-127.<br />
84
Table 1. List of participants at the prawn workshop in Bangkok.<br />
Farmer’s Name<br />
Other’s Name<br />
Farms<br />
Organization<br />
85<br />
TECHNICAL REPORTS: INVESTIGATIONS 2009–2011<br />
Province<br />
Ms. Reamgi Langpho Hatchery Ratchaburi<br />
Ms. Somgi Seandu Grow-out Ratchaburi<br />
Ms. Aumpong Jabgun Grow-out Ratchaburi<br />
Ms. Suntong Mokejang Hatchery Ratchaburi<br />
Mr Naluamol Saunkumruk Grow-out Ratchaburi<br />
Ms. Somtawin Maneekham Grow-out Ratchaburi<br />
Ms. Soan Kawang Grow-out Ratchaburi<br />
Mr Jumloung Tonkyuthit Grow-out Suphanburi<br />
Mr. Gulkitikon Bualaim Grow-out Suphanburi<br />
Mr. Pratoank Mounwong Hatchery Suphanburi<br />
Ms. Jumlong Sukthon Grow-out Suphanburi<br />
Ms. Thanapha Kumnuanshil Grow-out Suphanburi<br />
Mr. Prashit Pingeal Grow-out Suphanburi<br />
Mr. Kun Noksakul Grow-out Suphanburi<br />
Prof. Sena De Silva Director General, Network of Aquaculture Centres in Asia-Pacific<br />
Prof. James S. Diana School of Natural Resources and Environment, <strong>University</strong> of Michigan, USA<br />
Prof. Chadag V. Mohan<br />
Research and Development Manager, Network of Aquaculture Centres in Asia-<br />
Pacific<br />
Dr. Pakorn Unprasert Director, Division of Fisheries Information, DoF, Thailand<br />
Dr. Putth Songsangjinda Director, Marine Shrimp Culture Research Institute, DoF, Thailand<br />
Mr. Suntipan Phasugdee<br />
Fisheries Biologist, Bureau of Inland Fisheries Research and Development, DoF,<br />
Thailand<br />
Dr. Vicki Schwantes<br />
Management and Program Analyst, NOAA Budget Outreach and<br />
Communications, U.S. Department of Commerce<br />
Dr. Donghuo Jiang Vice President, CPF, Thailand<br />
Mr. Yuan Derun<br />
Education and Training Programme Coordinator, Network of Aquaculture<br />
Centres in Asia-Pacific<br />
Prof. C. Kwei Lin Asian Institute of Technology<br />
Mr Thavone Jirasophonrak Fisheries officer, Suphanburi, DoF, Thailand<br />
Mr. Wiwiththanon Boonyung Fisheries officer, Ratchaburi, DoF, Thailand<br />
Ms. Vasana Srathonglomg Fisheries officer, Kanchanaburi, DoF, Thailand<br />
Ms. Viphavan Phaujin Fisheries officer, Kanchanaburi, DoF, Thailand<br />
Ms. Maliwan Punsritom Researcher, CPF, Thailand<br />
Ms. Pornthip Chansaeng Researcher, CPF, Thailand<br />
Ms. Patchararut Ponglumyai Administrative staff, Network of Aquaculture Centres in Asia-Pacific<br />
Interpreter Translation Lab Associate<br />
Interpreter Translation Lab Associate
TECHNICAL REPORTS: INVESTIGATIONS 2009–2011<br />
Table 2. The agenda for the workshop on prawn aquaculture in Thailand.<br />
Time Activity Lead<br />
08:30 - 09:00 Registration/arrival of participants<br />
August 8<br />
09:00 - 09:10 Welcome address DoF DG; NACA DG<br />
09:10 - 09:20 Remarks from the project PI Prof. James S Diana<br />
09:20 - 09:45 Presentation- Introduction to the workshop Mr. Yuan Derun<br />
09:45 - 10:00 V. Participants introduction<br />
10:00-10:30 GROUP PHOTO, Coffee/Tea Break<br />
10:30 – 11:30<br />
11:30 – 12:30<br />
Plenary Session: Status review – Chair: Profs. Sena De Silva and C. V. Mohan<br />
Technology development in Improving Sustainability<br />
and Reducing Environmental Impacts of Aquaculture<br />
Systems<br />
International principles for responsible aquaculture<br />
practice, BMPS and farmer clusters development<br />
86<br />
Prof. James S Diana<br />
Prof. C. V. Mohan<br />
13:30 – 14:30 Thai GAP and CoC Dr. Putth Songsangjinda<br />
14:30 - 15:30 Thailand Prawn production – 2005 survey report Dr. Vicki S. Schwantes<br />
August 9 – Thematic Groups<br />
08:30 – 09:00<br />
Thematic groups: Assignments of group members,<br />
leaders, rapporteurs and materials<br />
Mr. Yuan Derun<br />
09:00 – 12:30 Group work Group leaders<br />
13:30 – 15:00 Group presentations Group leaders<br />
15:30 – 17:00<br />
Working Group Synthesis<br />
Drafting the fact sheet on Better Management<br />
Practices for Prawn Hatchery and Grow-out<br />
Production<br />
Chair: Prof. James Diana<br />
Synthesis working group<br />
August 10 - Plenary Session II: Better Management Practices for Prawn Hatchery and Grow-out<br />
Production Chair: Dr. Putth Songsangjinda<br />
09:00 – 10:00 Presentations on output of synthesis working group<br />
10:30 – 11:30<br />
Suggestions for modification<br />
Issues on implementation<br />
Suggestions to follow up<br />
11:30 – 12:00 Thanks and Closing<br />
Prof. James Diana<br />
Mr. Yuan Derun<br />
The Chair<br />
NACA DG<br />
DoF reprehensive<br />
Prof. James Diana<br />
Other guests
Assessment of <strong>AquaFish</strong> <strong>CRSP</strong> Discoveries<br />
87<br />
TECHNICAL REPORTS: INVESTIGATIONS 2009–2011<br />
Production System Design and Best Management Alternatives/Study/09BMA07OR<br />
Steven Buccola and Lin Qin<br />
Department of Agricultural and Resource Economics<br />
<strong>Oregon</strong> <strong>State</strong> <strong>University</strong><br />
Corvallis, <strong>Oregon</strong>, USA<br />
Rolf Fare<br />
School of Public Policy<br />
<strong>Oregon</strong> <strong>State</strong> <strong>University</strong><br />
Corvallis, <strong>Oregon</strong>, USA<br />
ABSTRACT<br />
Quantitative methods, combined with representative case studies, are used here to examine relationships<br />
between inputs and outputs in <strong>AquaFish</strong> investigations. The Data Envelopment (DEA) methods we<br />
employ to examine the 2007 – 2011 training investigations reveal wide differences in the efficiency with<br />
which training is produced. While some of that disparity likely can be explained by cross-investigation<br />
differences in such factors as travel distance and training intensity, some of it probably stem from<br />
unobserved variations in the manner in which US and host-country cost shares are allocated.<br />
Regression instead of DEA methods are used to examine <strong>AquaFish</strong>’s 2009 – 2011 research-oriented<br />
investigations. The Bayes value of sample information – namely the utility an investigation affords to a<br />
private or public decision-maker – is used in these regressions as the knowledge measure. The functional<br />
form we assume allows one to observe each research input’s effect on the investigation’s mean surprise<br />
and sampling accuracy as well total new knowledge. We find that investigation team size, team<br />
education, and distance to study site have moderate impacts on the mean surprise generated. Statistical<br />
accuracy is higher in experimental than in survey studies. Research outcome dimension and investigation<br />
topic area have weak implications for an investigation’s mean surprise but strong implications for its<br />
accuracy. Returns to investigation scale are below unity, implying smaller-scale investigations tend to be<br />
more efficient than larger ones are. With some exceptions, these findings are broadly consistent with our<br />
assessment of the 2007 – 2009 research investigations.<br />
INTRODUCTION<br />
In research, training, and outreach programs like <strong>AquaFish</strong> <strong>CRSP</strong>, it often is useful to compare program<br />
outputs with inputs, providing an idea of how effective the program resources have been in producing<br />
new knowledge and pointing to better resource allocations. The present Investigation of the Research<br />
Discovery and Impact Assessment Project focuses on just such an assessment for the <strong>AquaFish</strong> <strong>CRSP</strong>. Its<br />
objective is to develop improved methods for assessing the discoveries arising from <strong>AquaFish</strong> <strong>CRSP</strong><br />
experiments, studies, and activities, and to apply the methods to demonstrate how <strong>AquaFish</strong> has produced<br />
new knowledge and human capital. In particular, it examines the <strong>AquaFish</strong> discovery and training<br />
successes themselves as opposed to the wider impact those successes might have on the fish-farming<br />
industry and environment. To distinguish between these two purposes, we refer to the present<br />
Investigation as dealing with program discovery, and to Investigation #2 of this Project as dealing with<br />
program impact assessment.
TECHNICAL REPORTS: INVESTIGATIONS 2009–2011<br />
<strong>AquaFish</strong> discoveries are approached here in two ways: (a) quantitative comparisons of investigation<br />
discoveries with the inputs used to achieve them, and (b) a series of seven brief case studies, one in each<br />
of the seven other <strong>AquaFish</strong> projects. The quantitative analyses reported here concentrate on only the<br />
<strong>AquaFish</strong> Phase II (2009 – 2011) investigations. Quantitative analysis of Phase I (2007 – 2009)<br />
investigations is provided in our accompanying Synthesis Project Final Report.<br />
The purpose of the case studies is to provide insights into selected <strong>AquaFish</strong> investigations that may not<br />
be apparent from the <strong>AquaFish</strong> final reports or other publications. The cases were selected for their<br />
diversity and informativeness rather than "success." Although each story is unique, the case presentations<br />
follow, for the sake of comparability, an identical reporting format: a depiction of the problem tackled,<br />
the study's social and physical setting, the investigators' strategy in solving the problem, obstacles<br />
overcome or not overcome, and study results and likely impacts.<br />
In contrast to the case studies, which seek to show the differences among <strong>AquaFish</strong> efforts, our<br />
quantitative analysis draws implications common to a group of investigations. The quantitative approach<br />
for examining <strong>AquaFish</strong>’s research-type (experiment or study) investigations differs from the one we take<br />
for the training-type (activity) investigations. In both, we show how project inputs like total expenditure<br />
and science person-hours have led to project outputs. For the research investigations however, we<br />
construct a new Bayesian measure of knowledge output, while for the training investigations we take the<br />
standard approach of representing output as the number of training hours delivered. Analysis of research<br />
investigations employs parametric (statistical) estimates of a knowledge production function, while<br />
analysis of training investigations employs non-parametric (statistic-free) methods which identify the<br />
distance between each investigation and technically efficient performance.<br />
In the following, we first take up the quantitative analysis of <strong>AquaFish</strong>’s research-type investigations.<br />
We then turn to quantitative analysis of the training-type investigations, and finally to the case studies.<br />
Analysis of Research-Type Investigations<br />
INTRODUCTION<br />
The wide variety of <strong>AquaFish</strong> research investigations creates a serious challenge to their quantitative<br />
assessment because it complicates the identification of valid correlations between knowledge-gained and<br />
resource-expended. Variety is found among research investigations’ methods (experiment vs survey),<br />
types of findings (profitability, human health, ecosystem quality), and technological and cultural settings.<br />
That heterogeneity exacerbates the difficulties already present in <strong>AquaFish</strong> program assessment, in<br />
particular the data and conceptual problems of distinguishing program influences from other factors<br />
affecting the fish-farm or training setting. Much of our effort therefore was devoted to dealing with, and<br />
taking advantage of, cross-study heterogeneity.<br />
In particular, investigations differ widely in their targeted outputs. Some concerned with yield-improving<br />
management practices, for example, focus on weight-gain enhancement while others focus on survival<br />
rate or fertility enhancement. The latter in turn are incommensurable with the water-quality or market<br />
improvements in other investigations. Furthermore, aquacultural research typically involves not only a<br />
variety of research treatments but a variety of outcomes per treatment. An examination of alternative fish<br />
feed rations, for instance, may be concerned with the survival rate, feed conversion, final body weight,<br />
and flesh quality associated with each ration. And a statistical survey of fish exporters may inquire about<br />
both desirable fish length and harvest date. This is because each such outcome affects profitability in a<br />
separate way. For all these reasons, cross-study assessments like the present one require not only a single<br />
but a flexible output metric.<br />
88
89<br />
TECHNICAL REPORTS: INVESTIGATIONS 2009–2011<br />
Essential for this purpose is that the metric be expressed in terms of percentage changes, relative either to<br />
the output the researcher had anticipated or to that prevailing in the local area before the investigation<br />
began. Because percentage changes are always comparable with one another, they transcend differences<br />
among study outcomes. However, the metric must satisfy an additional requirement. Some<br />
investigations fail in the sense that the hypothesized improvement – a better water purification scheme,<br />
say – does not materialize. The failure does not, however, imply that expenditures have been wasted: the<br />
disappointment was valuable in pointing to more fruitful research directions (CGIAR Science Council<br />
2009).<br />
In order to capture the entire scope of knowledge a research study produces, we must cast it in terms of<br />
the information the study is expected to generate. For example, suppose researchers anticipate that a new<br />
Tilapia seed-production method will boost pond yields, but find in the course of their research that it<br />
instead reduces yields. The study nevertheless was a success insofar as it updated our knowledge of pond<br />
yield probabilities, expressed as a shifting or narrowing of the probability distribution of yield outcomes<br />
in the presence of alternative treatments. Our research discovery assessment consists in comparing these<br />
outcome distribution changes with the investigation inputs – such as expenditures, human capital, and<br />
effort – that have made the changes possible.<br />
To compare outputs with inputs in this way, we regard each investigation as a production unit that uses<br />
inputs like money and personnel to produce discoveries (Buccola, Ervin, and Yang 2009; Xia and<br />
Buccola 2005). Every experimental investigation examines several alternative treatments, and every<br />
survey study examines several respondent sub-groups. Furthermore, a given experimental treatment gives<br />
rise to a multitude of findings or outcomes such as weight gain and feed/gain ratio, and a given survey<br />
involves a variety of questions. For each of these two reasons, we are able to examine a number of inputoutput<br />
combinations in each investigation and <strong>AquaFish</strong> research cycle. Pooling such combinations<br />
across all investigations in a given cycle (2007 - 2009 or 2009 - 2011) or Topic-Area category allows a<br />
comparison of research discoveries with research inputs in that investigation stratum.<br />
A Bayesian Measure of Scientific Knowledge<br />
A production function approach to research discovery assessment may be represented as<br />
K f ( X ) f ( X , X , .... , X )<br />
(1) 1 2<br />
where K is a measure of the knowledge discovered in the investigation and X ( X1, X 2 , ...., X I ) is<br />
the vector of the study’s I inputs. Estimates of equation (1) can be used to compute derivatives K/ Xi,<br />
showing the effect on knowledge output K of changes in the study’s i th input. Because many study inputs<br />
can simultaneously be controlled in this fashion, equation (1) therefore is a foundation for assessing and<br />
improving research management and design.<br />
Knowledge Outputs<br />
An important aspect of our modeling is the manner in which the before-study ("prior") and after-study<br />
("posterior") probabilities of outcomes K – like mortality rate – are obtained. Well-developed methods<br />
are available for eliciting investigators’ prior probabilities of their discoveries (Stael von Holstein 1970).<br />
The methods involve casting the probability questions in the context of the study’s institutional and<br />
technical environment. The corresponding posterior probabilities are obtained from the investigation's<br />
statistical results, in an experimental study embedded in the ANOVA analysis of the experimental<br />
outcomes and in a statistical survey in the means and variances of the survey responses.<br />
I
TECHNICAL REPORTS: INVESTIGATIONS 2009–2011<br />
Bayesian methods are a rigorous and self-consistent way of updating such probabilities as the<br />
investigation proceeds (Schimmelpfennig and Norton 2003, Carlin and Louis 1996, Press 1989). Unlike<br />
classical statistics, which allow inferences about a population, Bayesian statistics allow inferences about<br />
how much new knowledge has been gleaned from a research effort. In the present Investigation, we<br />
develop a new Bayesian approach for constructing the measure of knowledge-gained, and use it to assess<br />
output-input relationships in <strong>AquaFish</strong> research (experiment or study) investigations.<br />
To summarize the Bayesian approach to measuring knowledge, let Y be the percentage improvement in a<br />
particular study outcome such as pond quality, and Z the experimental performance (sample information)<br />
of the pond-cleaning technology the researchers are studying. The likelihood that experimental outcome<br />
Z will occur depends on study inputs X and on random events ; that is, Z Z( X , )<br />
. Bayes<br />
Theorem says the probability the investigator assigns to a particular pond-quality improvement is, once<br />
the experiments have been completed,<br />
(2) p[ Y | Z ( X, )] p( Y) p[ Z( X , )<br />
| Y]<br />
where p() is probability, | indicates the term following is held constant, and means “is proportionate<br />
to.” Expression pY ( ) is the investigator’s “prior” (pre-study) estimate of the chances that pond-quality<br />
Y will occur. Equation (2) thus says that, after the experiments have been conducted, the probability of<br />
pond-quality Y is proportionate to the probability of pond-quality Y originally anticipated times the<br />
probability (often called the “likelihood”) that experimental outcome Z would be obtained in the presence<br />
of pond- quality Y. The left-hand side of equation (2) is called the “posterior” (post-study) probability of<br />
pond improvement. We will not be directly concerned in this report with the likelihoods of experimental<br />
events, but only with the prior and posterior probabilities of outcomes like pond quality.<br />
The usefulness to us of Bayes’ Theorem (2) is that it generates the very research knowledge measure K<br />
we discussed earlier. The underlying principle is that a research study’s output can be expressed in terms<br />
of the useful information the study is expected to generate. To see this, suppose an oyster producer is<br />
faced – in the presence of her present oyster management practices X – with a decision d about how many<br />
oysters to promise to deliver next month at quality grade A. If she later delivers them at lower than the<br />
promised grade, her quality reputation will suffer; if at higher than the promised grade, she will not be<br />
prepared to market them at the proportionately higher price. Her profit or utility, that is, rises with her<br />
accuracy in predicting quality grade. Oyster management research improves such prediction accuracy –<br />
in proportion, in fact, to the difference which the research generates between the prior and posterior<br />
probability of oyster quality A.<br />
In particular, the gain the oyster producer enjoys from basing her marketing decisions on posterior<br />
probability p ( Y | Z) rather than prior probability pY ( ) is reflected in the value of sample (researchproduced)<br />
information Z (Winkler 1972):<br />
(3) VSI( d , Z) E[ U( d | Z)] E[ U( d<br />
| Z )]<br />
where d is the optimal decision in the presence of prior information only, d is the optimal decision in<br />
the presence of both the sample Z and prior information, and double-primes on expectations indicate they<br />
are taken with respect to the posterior (Z-present) information. Equation (3) is the difference between:<br />
(i) the utility the farmer expects to enjoy when promising the quality grade ( d ) that is optimal in the<br />
presence of the sample information, and (ii) the utility she expects to receive when promising quality<br />
grade d that had been optimal before sample Z was drawn, both expectations being computed in the<br />
90
91<br />
TECHNICAL REPORTS: INVESTIGATIONS 2009–2011<br />
presence of the sample information. Thus also, the value of sample information is the disutility –<br />
computed from the post-research vantage point – the farmer suffers if deprived of the research study.<br />
Research samples Z come at a cost, namely the expense of the study’s inputs X. That is, we can<br />
generalize equation (3) by writing ZXin ( ) place of Z. And because the research knowledge K discussed<br />
above is precisely the value of the sample information which the research produces, we can write<br />
(4) K VSI ( d , Z) E{ U[ d | Z( X , )]} E{ U[ d | Z( X , )]} f ( X , )<br />
where is random, unobservable study input and f is a production function. Expression (4) shows how<br />
study inputs are used to generate the sample information which improves farmers’ prediction accuracy<br />
and hence management decisions, and on the basis of which his expected utility rises above what he faced<br />
with his inferior, pre-research information.<br />
Importantly, knowledge measure (4) is a function only of the difference between p[ Y | Z ( X, )]<br />
and<br />
pY ( ) , the after- and before-study predictions of a given fish-quality outcome. Because, thanks to the<br />
researcher’s new sample information, the probability distribution of the former will never be less accurate<br />
than the distribution of the latter, knowledge-gained measure K will never be negative. Thus, although<br />
some research projects fail in the sense that a hoped-for technical improvement – enhanced pond yield,<br />
say – does not materialize, they can never fail to provide useful information. Even the disappointment<br />
was valuable in pointing to fruitful research directions (CGIAR Science Council 2009).<br />
Functional Form<br />
A number of functional forms are available for specifying fish-farmer utility U in (3) and (4) . We adopt<br />
here the mean absolute deviation (MAD) form U( d , Y ) | Y d|<br />
in which utility is proportionate to<br />
the absolute difference between a random outcome and its prediction (Robert 2001). In the present<br />
context it carries two assumptions: (a) the farmer loses as much utility when fish quality turns out to be a<br />
given amount below his quality prediction as it does when it turns out to be a given amount above; and (b)<br />
that loss is proportionate to the difference between the predicted and actual quality. The realism of these<br />
assumptions might be greater for some outcomes, like fish mortality or pond dissolved-oxygen content,<br />
than it is for others.<br />
With the MAD functional form, knowledge equation (4) becomes<br />
<br />
(5) K | Yi M PR | | Yi M PO | f ( X , )<br />
i i<br />
<br />
PO PO<br />
where M PR is the mean of the prior probability distribution ( ) pY of Y, and M PO is the mean of the<br />
posterior distribution p[ Z( X , )<br />
| Y]<br />
. The first middle term in equation (5) is the mean absolute<br />
deviation of a sample fish-quality observation from the pre-research quality prediction, namely<br />
d M . The second middle term is the mean absolute deviation of an observation from the post-<br />
PR<br />
research prediction d MPO<br />
(Y’s sample mean). In the present analysis, an <strong>AquaFish</strong> investigation’s<br />
knowledge output is modeled as the difference between these two farmer risks, each computed from the<br />
post-research probability distribution of quality outcomes.<br />
2<br />
Numerical decomposition of (5) shows it can, with high ( R 0.97 ) accuracy, be expressed as
TECHNICAL REPORTS: INVESTIGATIONS 2009–2011<br />
(6) ln K A a ln | M M | a ln STD <br />
1 PR PO 2<br />
PO<br />
where A , 1 a , and 2 a are estimated constants and STD PO is the standard deviation of the post-research<br />
fish quality distribution. That is, a research study’s information contribution depends separately on:<br />
(i) the absolute difference between the pre- and post-research estimate of expected fish quality (the studyproduced<br />
absolute shift in the fish quality expectation and hence the study’s mean surprise), and (ii) the<br />
post-research sample estimate of the standard deviation of quality outcomes (the study’s predictive<br />
success and hence accuracy). This decomposition allows us much flexibility in examining the impacts of<br />
study inputs X on knowledge output K, for it permits us to distinguish between how those inputs affect<br />
the shift in a fish-quality forecast as well as the accuracy of that forecast. Mean surprise and accuracy<br />
are, that is, separate aspects of a study’s forecast effectiveness. Mean surprise tells us how close the<br />
average dart is to the bulls eye; accuracy tells us how close the darts are to one another.<br />
Expressions ln | M M | and <br />
PR PO ln STDPO on the right-hand-side of (6) were estimated – for each<br />
<strong>AquaFish</strong> research treatment, outcome, and survey question – by taking 50 random draws of each the two<br />
parenthesized expressions in the middle of (5) and using them to compute PR M , M PO , and STD PO .<br />
Because outcomes Yi in <strong>AquaFish</strong> studies are expressed in a variety of units (kilograms of fish per<br />
hectare, micrograms of oxygen per liter of water, and so forth), we render them comparable to one<br />
another by dividing each by the mean of the 50 outcomes drawn. Each outcome or finding level such as<br />
mortality thus is equivalently expressed as its percent deviation from its own posterior mean. Thus also,<br />
this normalization reduces posterior mean M PO to 1.0 in each experimental treatment, outcome, and<br />
survey question, so that PR M is expressed as a proportion of M PO .<br />
METHODS<br />
Knowledge Outputs: Elicitation and Construction<br />
Data required for constructing knowledge output measures K and input measures X were obtained from<br />
the key host-country individual responsible for carrying out the investigation. Because there were 24 key<br />
investigators, communication with them was conducted largely through a single coordinator in each of the<br />
seven <strong>AquaFish</strong> projects. Coordinators were (by U.S. university of the respective project): Steven<br />
Amisah (Purdue <strong>University</strong>), Gertrude Atukunda (Auburn <strong>University</strong>), Remedios Bolivar (North Carolina<br />
<strong>State</strong> <strong>University</strong>), Wilfrido Contreras (<strong>University</strong> of Arizona), Eladio Gaxiola (<strong>University</strong> of Hawaii), So<br />
Nam (<strong>University</strong> of Connecticut), and Gao Zexia (<strong>University</strong> of Michigan). Fifty-five research-type<br />
investigations were conducted under <strong>AquaFish</strong>’s 2007 – 2009 and 2009 – 2011 phases. Twenty-seven of<br />
these, examined in the present Report, were conducted during the 2009 – 2011 phase. Twenty-eight,<br />
examined in the authors’ Synthesis Report, were conducted during the 2007 – 2009 phase.<br />
Outputs K were elicited by way of two Output questionnaire forms, one for an experiment-type and<br />
another for a survey-type study. These forms are shown respectively in Appendixes A and B. As<br />
Appendix A indicates, the scientist in an experiment-type investigation is asked – for each treatment (e.g.<br />
feed ration) and each outcome of that treatment (e.g. feed/gain ratio or mortality) – to state: (i) her prior<br />
or pre-study probability L p , M p , p H that each of three selected (L, M, H) experimental outcome levels<br />
would be attained; and (ii) the corresponding posterior probabilities as represented by the outcome’s mean<br />
and standard deviation in the ANOVA results. The scientist in a survey-type investigation is asked – for<br />
each major survey question (e.g., export-optimal fish species or length) – to state: (i) his prior probability<br />
p , p M , p H that he would obtain each of three selected (L, M, H) survey answer levels; and (ii) the<br />
L<br />
92
93<br />
TECHNICAL REPORTS: INVESTIGATIONS 2009–2011<br />
corresponding posterior probabilities as represented by the mean and standard deviation of the<br />
respondent’s answers to that question. The investigator often had to use judgment in identifying which<br />
experimental outcomes or survey questions to report. In some studies, for example, respondents are asked<br />
30 to 40 survey questions, or numerous water chemistry factors collected. To avoid highly uneven<br />
sample sizes across investigations, scientists were asked to choose no more than five or six of the most<br />
insightful or strategic questions they asked.<br />
The rationale for the correspondences established between these two questionnaires is clear. Each<br />
prospective outcome of each experimental treatment in an experiment-type investigation constitutes an<br />
answer to a question, and hence can be compared with the prospective answer to each major question in a<br />
survey-type investigation. An example of responses to a survey-type output questionnaire is provided in<br />
Table 1 for Investigation 07MNE04UM, which examined relationships between pond nutrient content,<br />
effluent quality, and harvest yields.<br />
Eliciting prior probabilities requires motivating the researcher to think deeply about how he expects the<br />
study will later turn out, based partly on the literature he has read and his conversations with others, and<br />
partly on his experience. These judgments are best elicited by casting the probability questions in the<br />
context of the study’s institutional and technical environment. They also require practice. Opportunity<br />
for that practice was provided to most of the <strong>AquaFish</strong> investigators at our project workshops and<br />
meeting in San Diego, Seattle, and Shanghai, where Bayesian statistical theory was explained and<br />
participants worked through examples of the two types of output questionnaire. Forty-four investigators<br />
and staff attended the day-long 2009 San Diego workshop, 17 attended the two-and-a-half-day 2010<br />
Seattle project meeting, and seven attended the six-hour 2011 Shanghai workshop.<br />
Several difficulties were encountered in prior probability elicitation. The first is that, because the present<br />
project was not built into <strong>AquaFish</strong>’s original design, we were – with every 2007 – 2009 investigation<br />
and most of the 2009 – 2011 ones – unable to elicit prior probabilities before the study actually began.<br />
Under these circumstances, investigators could be asked only to remember, or equivalently imagine, what<br />
their priors were at the start of their work. This may have introduced some bias in their responses because<br />
preliminary study results can color the scientist’s prospects for the final results. However, investigators<br />
were frequently made aware of this problem during the training sessions and told us they were able to<br />
guard against it. Presence of bias is tested statistically below.<br />
Respondents were asked (Appendixes A and B) to state their prior probability that each of three outcome<br />
levels, rather than intervals of levels, would be observed in the statistical phase of their research. Such<br />
level-type question simplifies the respondent’s task, as it is relatively easy to identify a low, medium, and<br />
high outcome level. However, because in continuous-distribution situations a non-zero probability cannot<br />
be assigned to an outcome level, the respondent in these situations would theoretically have had to<br />
propose three alternative outcome intervals rather than points. In many cases, and at our suggestion, she<br />
did assign her prior probabilities to outcome intervals. For purposes of forming the associated cumulative<br />
densities, we used the midpoints of these outcome intervals.<br />
Knowledge Inputs<br />
Table 2 shows the kinds of inputs X used in an experimental or survey investigation. Money expenditure<br />
and human capital may be regarded as the positive factors brought to bear on a study question. Research<br />
problem type and public infrastructure may in contrast be considered as obstacles which those resources<br />
must overcome in achieving research success. The latter essentially are “negative resources” and thus<br />
must be specified along with the positive ones.<br />
<strong>AquaFish</strong>-financed expenditure in the first category include salaries and wages, travel, research materials<br />
like feeds and medicines, training materials, student-workers’ tuitions, and publication expenses. Cost
TECHNICAL REPORTS: INVESTIGATIONS 2009–2011<br />
share, observable only at the project level, includes materials and equipment, administrative overhead,<br />
and portions of investigator salaries. Human capital – the knowledge and skills embedded in the<br />
investigators themselves – is to some degree reflected in their salaries. But those reflections are imperfect<br />
and usefully supplemented by, for example, information about the research team’s academic rank and<br />
years of experience. More expenditure or human capital would provide greater scope for solving the<br />
research problem and hence presumably boost knowledge production K. The kinds of inputs included in<br />
cost share unfortunately vary across projects, so interpretations of cost share’s knowledge impacts are<br />
inherently ambiguous.<br />
Experimental approaches may be more or less difficult to plan and manage than survey studies are, so our<br />
expectations of experimental controls’ impacts on knowledge production are somewhat ambiguous also.<br />
One might, however, at least expect controlled experiments to bring lower sample variances than survey<br />
studies do, since experimental controls are designed for very purpose of reducing random noise. An<br />
investigation’s outcome or findings dimensions likely differ among one another in understandability or<br />
accessibility – fish weight gain perhaps being more difficult to measure than water oxygen level.<br />
Similarly, an investigation’s Topic Area category may influence research difficulty insofar as some topics<br />
may be less understood and more expensive to address than are others. But we do not have strong prior<br />
expectations for such outcome-wise or Topic-Area-wise effects. A list of <strong>AquaFish</strong> Topic Areas,<br />
organized for purposes of the present analysis into five broad categories, is shown in Table 3.<br />
Finally, public infrastructure can influence knowledge output in many ways. Distance and the difficulty<br />
of travel to study site consume resources that otherwise could be expended on knowledge-generation at<br />
the site. Climate, culture, or other geographic factors can have their own impacts on research success, for<br />
example when traditions among a surveyed group influence the types of information they are willing to<br />
reveal. National-level factor prices like wage rates affect the purchasing power of both cash and in-kind<br />
expenditures (Heston, Summers, and Aten 2011).<br />
Data Elicitation<br />
For an experiment-type investigation, an observation in the present study consisted of a pair of prior and<br />
posterior probability distributions for each treatment and for each outcome of that treatment. In surveytype<br />
investigations, an observation consisted of such a probability distribution pair for each survey<br />
question reported. Data on research inputs (i), (iii, parts a & d), and (iv, part d) were obtained from<br />
<strong>AquaFish</strong> project proposals and quarterly, annual, and final reports. Information about (iii, parts b and c)<br />
was obtained from the key investigator by way of the Output Questionnaires (e.g., Outcome Target, col.<br />
4; Prior Probability Distribution, cols. 5 – 6; and Notes, col. 9, in Appendix A). Data on inputs (ii) and<br />
(iv, parts a, b, and c) were obtained from the key investigator via an Input Questionnaire, Appendix C.<br />
Procedures for administering the Input Questionnaire were the same as those for the Output<br />
Questionnaire, discussed above.<br />
Data collection ran from October 2010 to December 2011. Part of the collection took place during the<br />
2010 Seattle project meeting and 2011 Shanghai workshop, allowing us to address technical or conceptual<br />
problems as they arose. At one or other of the San Diego, Seattle, or Shanghai meetings, we were able to<br />
work directly with nearly all 24 of the investigators who had a key role in an investigation we examined.<br />
This early trouble-shooting helped avoid potential misunderstandings and enabled mostly smooth data<br />
elicitation afterward. Subsequent data submissions indicating any misunderstanding, or flaws in our<br />
questionnaire design, were returned for re-working.<br />
Model Specifications<br />
Indexing knowledge-production model (1) in terms of the types of research inputs discussed above gives<br />
94
(7) K f ( X) f ( E , H , T , I )<br />
in which<br />
hijk ih i ijk i<br />
95<br />
TECHNICAL REPORTS: INVESTIGATIONS 2009–2011<br />
E hi is the vector of expenditures on the i th investigation of the h th project, in dollars per biennium;<br />
H i is the vector of human capital variables in the i th investigation;<br />
T is the vector of research problem types in the j th treatment and k th outcome of the i th investigation;<br />
ijk<br />
Ii is the vector of public infrastructure variables in the i th investigation.<br />
Details of these specifications are provided in Tables 2 and 4. The correspondingly indexed form of<br />
equation (6) is<br />
(8) ln K A a ln | M M | a ln STD <br />
in which<br />
hijk 1 PR PO hijk 2<br />
PO hijk<br />
ln | M M| f ( X , e )<br />
(9) 1 1,<br />
PR PO hijk<br />
hijk hijk<br />
ln STD f ( X , e )<br />
(10) 2 2,<br />
hijk<br />
hijk hijk<br />
We therefore are able to estimate the latter two equations separately, and so can observe how research<br />
inputs affect research distribution shift or mean surprise (9) separately from how they affect research<br />
accuracy (10). We then combine them, via equation (8) and its 1 and 2 parameter estimates, to<br />
conclude how research inputs affect total knowledge output – the expected value of the sample<br />
information provided by <strong>AquaFish</strong> research.<br />
RESULTS<br />
Summary Statistics<br />
The sample data are summarized in Table 5. Sample size in the 2009 – 2011 phase was 284. In the<br />
typical investigation, treatment, and outcome (experimental finding or survey answer), the researcher’s<br />
prior outcome expectation was 0.171 (17.1%) higher or lower than the mean outcome or answer in the<br />
subsequent experiment or survey. That is, the researcher’s expectations tended to be 17% “off” of what<br />
eventually happened, creating an average 17% mean surprise. The associated standard deviation (0.195)<br />
is slightly higher than the mean, implying a great deal of variation in how far a researcher’s prior<br />
expectations missed the eventual mark. The distribution of these absolute surprises was skewed strongly<br />
to the right: mean surprises tended to cluster just above zero, the successively larger ones less frequent,<br />
and in only a few investigations very high.<br />
The shape of the sample distribution of posterior standard deviations – measuring the spread or<br />
inaccuracy of research outcomes around their experimental or survey means – is similar to the distribution<br />
of mean shifts or surprises. Average experimental or survey outcome was 0.335 (33.5 percent) above or<br />
below its own mean. The 0.370 standard deviation of this accuracy across investigations, treatments, and<br />
outcome types reveals rather strong sample variation among the investigations’ sample variances. And<br />
the distribution of the accuracies across investigations and outcomes was positively skewed. They<br />
bunched just to the right of zero, where standard deviations are low, the successively larger ones (with
TECHNICAL REPORTS: INVESTIGATIONS 2009–2011<br />
higher standard deviations and hence less accurate) being continuously less frequent. Because our<br />
knowledge measure is a weighted sum of mean absolute surprise and variance, their sample coefficients<br />
of variation (standard deviation divided by mean) of 1.14 and 1.10 are adequate for examining the factors<br />
affecting <strong>AquaFish</strong> knowledge generation.<br />
Average <strong>AquaFish</strong>-financed expenditure on an investigation was $90,645, and host-country and US cost<br />
shares respectively $82,438 and $175,353. The average research team consisted of about 10 individuals,<br />
the average investigator 32 years old with 17 years of education. Sixty-three percent of the research<br />
outcomes pertained to fish production (growth, feeding, mortality) 12% to water quality, 13% to<br />
marketing potential, and 11% to species development. Fifty-eight percent of investigations fell into a fish<br />
production topic area, 16% into marketing, 4% into technology adoption, and 22% into environmental<br />
problems. Seventy percent involved controlled experiments and 30% surveys. Average distance to<br />
experiment or survey site was 1134 kilometers; 62% percent of the roads to them were paved, 14%<br />
gravel, 24% dirt. Ninety-three percent of transportation to research site primarily involved auto or bus,<br />
7% walking.<br />
Sample variation of most of these research inputs is adequate for regression inference. For example,<br />
coefficient of variation of <strong>AquaFish</strong> cash expenditure is 0.39 and of team FTE 0.35. Lowest coefficients<br />
of variation in Table 6 are in the research team’s average age (0.13) and education (0.06) and in hostcountry<br />
cost share (0.19). Coefficients of variation of the research outcome dimensions and topic-area<br />
categories are mostly above one. Relative variation in the proportion of investigations in which walking<br />
was the main mode of access to research site was particularly high (cv = 3.71).<br />
Few of these variables are pairwise-correlated to the degree creating inference problems. Possible<br />
exceptions are that African projects came with especially high host-country cost shares (correlation 0.63<br />
between HC cost share and African status). Scientist age and education are correlated 0.71. The number<br />
of full-time-equivalent (FTE) scientists in an investigation is significantly negatively (-0.52) correlated<br />
with average scientist age, suggesting investigations can somewhat be divided into those with many (and<br />
young and thus cheap) workers and those with few (and old and thus expensive) ones. Several of the<br />
transportation-mode and road-condition variables are correlated strongly.<br />
The concern that several of the research outcome dimensions employed here might be correlated highly<br />
with some topic-area categories – because, for example, production and marketing appear in both lists –<br />
does not for the most part materialize. The strongest pairwise relationships are that marketing outcomes<br />
are correlated 0.59 with the marketing topic area, and species-development outcomes 0.67 with the<br />
environmental topic area. These generally low correlations are achievable because an investigation can<br />
fall into only one topic area but can examine a variety of outcome dimensions, such as both fish growth<br />
and water quality. Nevertheless, despite the typically moderate pairwise correlations in our sample,<br />
multicollinearity possibilities remain whenever a large number of explanatory variables are specified in a<br />
regression equation.<br />
Because knowledge K depends partly on the scientist's subjectively determined prior expectation M PR of<br />
the study outcome, one ought first check whether the reported expectations contain investigator bias. In<br />
particular, investigators may have tried to record a large mean surprise by reporting a prior mean they<br />
knew to be far from the eventual experimental or survey outcome. Examination of sample algebraic<br />
differences PR M - M PO in our data, however, suggest otherwise. Except for a small right tail, the<br />
distribution of these differences is approximately symmetrically distributed around zero. As a long-run<br />
average, that is, investigator research predictions tended to be accurate, an accuracy that strategic<br />
96
97<br />
TECHNICAL REPORTS: INVESTIGATIONS 2009–2011<br />
expectations reports would have frustrated. The rather high mean absolute differences | M M | in<br />
pr po<br />
Table 5 show of course that investigators differed widely in their ability to predict eventual outcomes.<br />
Factors Affecting Output: Mean Surprise<br />
We address first the factors affecting mean research surprise, then those affecting research accuracy, then<br />
those affecting their weighted average constituting scientific knowledge. Estimates of research surprise<br />
equation (9), with the 2009 – 201 sample of 284 observations, are shown in Table 6. Sixteen outlier<br />
observations were dropped from the original 300 observations on account of their excessive influence<br />
on regression estimates. Column (2) gives the coefficient estimates and column (4) the t-statistics.<br />
Because both research surprise and the continuous research inputs are expressed in logs, coefficients of<br />
these Table 6 inputs are "output elasticities," the percent increase in surprise generated by a one-percent<br />
rise in the input. The coefficient of a categorical (zero-one) variable in Table 6 is instead the percent<br />
change in mean surprise when switching to the indicated condition from the condition's base group.<br />
Statistical significances of the Table 6 effects are rather low, particularly compared with the<br />
corresponding effects in our analysis of the 2007 – 2009 <strong>AquaFish</strong> phase (see Synthesis Project Final<br />
Report). The reason likely is due to the difference in the sample sizes available for these two studies. We<br />
2<br />
are able to explain about only one-quarter of the mean-surprise variation in either <strong>AquaFish</strong> phase ( R =<br />
0.23 in the 2007 – 2009 phase, 0.25 here in the 2009 – 2011 phase). But the sample size available in the<br />
2009 – 2011 phase is only 284, namely 33% less than the 424 in the 2007 – 2009 phase. Sample size<br />
substantially affects regression estimates’ standard errors and hence the t-values indicating statistical<br />
significance. In situations like the present, that is, where quantitative explanation of a dependent variable<br />
is difficult, a large sample size is important for securing satisfactory confidence intervals around the<br />
regression estimates. Given the comparatively small sample in the 2009 – 2011 analysis, we are forced to<br />
employ a wider confidence interval in it for assessing inputs’ mean-surprise effects.<br />
All three continuous inputs in Table 6 had the implications for mean research surprise we had expected.<br />
Expanding a study's size by increasing the number of its full-time-equivalent investigators modestly but at<br />
the 10% significance level shifts the location of the research outcome’s probability distribution. In<br />
particular, a one-percent FTE boost lifts mean surprise by 0.12 percent. The bigger the team, that is, the<br />
greater the mean surprise expected. The percentage boost given to mean surprise by raising the team’s<br />
aggregate education is even greater, although with lower statistical significance. Raising team education<br />
by one percent lifts mean surprise by 0.4%, with significance at the 15% level (t = 1.49). Finally,<br />
reducing travel distance by one-percent would bring only 0.01% greater mean surprise, all else constant.<br />
That effect, too, is significant at only the 15% level (t = -1.44). Although very modest, it is consistent<br />
with our expectation that travel time reduces the time and energy available for creativity and innovation.<br />
While nonsignificant at usual confidence limits, experiment-type investigations bring, all else equal, an<br />
average 7.5% less surprise than do survey-type investigations (t = -1.11). This compares with the 13%<br />
lower mean surprise (t = -1.95) that they brought during the 2007 – 2009 phase. These results are<br />
understandable. The possibility of analyzing a problem with experimental controls normally is found<br />
where the scientist is relatively familiar with the problem's stochastic environment. That familiarity in<br />
turn implies one would not normally expect the research project to greatly change the investigator’s<br />
expectations of a study outcome. Survey methods, in contrast, usually are more exploratory, to which<br />
investigators resort when the environment is comparatively unknown. Such expectations weakness is<br />
conducive to marked changes in the expectations as the study proceeds.<br />
At normal confidence levels, type of research finding does not affect mean surprise once the remaining<br />
factors are accounted for. As in the 2007 – 2009 analysis for example, outcomes relating to fish<br />
production generated no greater surprise (t = - 0.84) than do those in the water-quality base group. Unlike
TECHNICAL REPORTS: INVESTIGATIONS 2009–2011<br />
in 2007 – 2009, marketing findings’ tendency to bring greater surprise (7% more, compared with 2007 –<br />
2009’s 28%) 2007 – 2009) has t statistic only slightly above unity. The latter weakness may be affected<br />
by the stronger correlation (0.60 vs 0.36) that marketing outcomes bear to the marketing topic area in<br />
2009 – 2011 than they do in 2007 – 2009. In any event, it is important that we not confuse the marketingoutcome<br />
effect on knowledge production with the experiment-vs-survey effect. Survey methods were<br />
used extensively to answer water-quality and fish-population questions as well as marketing questions,<br />
and correlation between experiment-vs-survey) and the marketing outcome dimension in 2009 – 2011<br />
investigations is only -0.34, well below the Belsley-Kuh-Welsh (1980) plus-or-minus-0.80 threshold for a<br />
problematic pairwise correlation between explanatory variables.<br />
As in 2007 – 2009, an investigation’s topic area itself also appears to have no significant effect on the<br />
mean surprise it generates. Table 6 shows the estimated mean-surprise differences between the<br />
production, human health, and environmental topic categories and the marketing base group, once the<br />
other factors are accounted for. All differences are statistically non-significant, both from the base group<br />
and from one another. Finally, investigations in Asia have, after controlling for the other factors in this<br />
analysis, brought 33% less mean surprise than did those in Africa. Although that result is statistically<br />
significant, its interpretation is ambiguous. Asian investigations may have involved better-understood<br />
problems than Africa ones did, bringing lower prospects for fundamental surprise.<br />
Research mean-surprise model R-square is 0.25. We are able to explain about one-quarter of the variation<br />
across treatments, outcomes, and investigations in 2009 – 2011 research-induced mean probability<br />
distribution shift. The modesty of this proportion is to be expected. The investigator insights needed to<br />
fundamentally shift our understanding of a research problem are relatively ineffable and not easily<br />
explained with measurable inputs. That is not, as we shall see next, true for the research accuracy<br />
dimension.<br />
Factors Affecting Output: Statistical Accuracy<br />
Consider now (Table 7) the corresponding estimates of research accuracy equation (10), showing research<br />
inputs’ effects on the standard deviations of the experimental or survey-question outcomes and thus on<br />
the precision with which these outcomes can be predicted or explained. For brevity, we often will refer to<br />
these standard deviations as variances. Because precision varies inversely with variance, factors with<br />
negative effects in Table 7 are those contributing positively to precision and thus to knowledge.<br />
All but two of the factors in Table 7 is statistically significantly different from zero at least close to the<br />
5% level. One with nonsignificant effect is team FTE. A one percent FTE rise brings only 0.06% higher<br />
predictive accuracy in the investigation’s experiments and surveys, and the t-statistic is below unity. This<br />
contrasts with the highly significant 0.13% greater accuracy in the 2007 – 2009 phase. Unexpectedly,<br />
greater research-team education is associated with higher sampling variance: a one-percent rise in the<br />
team-members’ average formal education lifts outcome standard deviation by 0.71%. We had expected<br />
contrarily, and indeed found in the 2007 – 2009 investigations, that team education would reduce<br />
variances because better-educated teams should be better able to maintain the experimental controls<br />
which restrict random variation. At the ground level, these controls usually are in the hands of the team’s<br />
most-junior members, whose education levels have a strong role in our mean team-education variable.<br />
In 2007 – 2009, we had found that greater travel distance to study site leads to statistically significantly –<br />
but barely perceptibly – greater sampling variance and thus to lower accuracy, the greater distance<br />
presumably inhibiting study monitoring. Rather consistent with that result, distance’s effect in Table 7 is<br />
not significant at all. And like in 2007 – 2009, investigator choice between an experimental and survey<br />
research design has a much more profound research-accuracy implication than distance has. Experimenttype<br />
investigations provide, all else constant, 60% lower outcome variance and thus more accurate study<br />
results than do survey investigations. This effect is highly statistically significant and intuitive. As noted<br />
98
99<br />
TECHNICAL REPORTS: INVESTIGATIONS 2009–2011<br />
above, experimental controls are used for the very purpose of reducing study outcome variances below<br />
what could be had with statistical controls.<br />
Table 7 shows that investigation findings relating to fish production, marketing, and species development<br />
in either experiment and survey studies have lower sample variances than do water-quality findings (the<br />
base group). These outcome effects are statistically significant at least at the 10% level and rather high in<br />
magnitude. Fish-growth findings are 28% more accurate, marketing findings 13% more accurate, and<br />
species-development findings 48% more accurate than water-quality ones are. (Corresponding<br />
percentages in the 2007 – 2009 investigations were 30%, 34%, and 54%.) It follows in the 2009 – 2011<br />
data that fish-production findings are substantially more accurate than marketing findings are. And<br />
water-quality findings suffer from substantially more unexplained variability than the others do.<br />
Unlike its effects on mean research surprise, an investigation’s topic area has strong implications for<br />
research accuracy. Controlling for the other factors, investigations in the fish production, human health,<br />
and environmental topic areas bring significantly more accurate conclusions – in the sense of tighter<br />
sample distributions – than do those in the marketing area. Production topics bring 14% more accuracy,<br />
human health topics 50% more, and environment topics 20% more, than marketing topics do.<br />
(Corresponding percentages in the 2007 – 2009 data, also statistically significant, were 48%, 22%, and<br />
47%.) These impacts do not appear to be confounded with the outcome-dimension ones discussed in the<br />
previous paragraph, despite that the sample correlation between marketing outcome and marketing topic<br />
area is 0.60. Many marketing-topic-area investigations involve, for instance, fish production and<br />
environmental findings, and many marketing findings are found in environmental and food-safety topic<br />
areas.<br />
2<br />
Our research accuracy model’s R is 0.65. We are able to explain about two-thirds of the statisticalaccuracy<br />
variation among <strong>AquaFish</strong>’s 2009 – 201 investigations, treatments, and outcomes. In the<br />
Synthesis report, we note were able to explain one-half the statistical-accuracy variation in the 2007 –<br />
2009 data.<br />
Implications for Knowledge Production<br />
In the above two sections, we have estimated how <strong>AquaFish</strong> research inputs affect the means and<br />
variances, equations (9) and (10), of the scientist’s findings. Mean-shift and variance – mean surprise and<br />
accuracy – in turn constitute knowledge production. We now aggregate the Table 6 and 7 estimates, by<br />
way of equation (8), to see how research inputs influence knowledge production itself. First we regress<br />
equation (6) on the sample data, obtaining:<br />
(11) ln K = -0.112 + 0.873 ln | M M | - - 0.101 STD <br />
PR PO<br />
(- 16.97) (62.28) (- 10.90)<br />
ln PO<br />
2<br />
R <br />
in which the left-hand term is the log of knowledge output, the second right-hand term is the log of mean<br />
shift in <strong>AquaFish</strong> findings, and the third right-hand term is the log of the standard deviation of those<br />
findings. Numbers in parentheses are t-statistics. Mean surprise is a positive element, and standard<br />
deviation (inaccuracy) a negative element, of knowledge. Given MAD utility functional form (5), mean<br />
surprise is – at the margin – substantially more important to knowledge-creation than accuracy is. In<br />
particular, equation (11) shows that mean surprise’s knowledge weight is 0.873 / 0.101 = 8.6 times<br />
greater than accuracy’s knowledge weight. Using these relative weights and Tables 6 and 7, we compute<br />
in Table 8 each research input’s net knowledge effects. For purposes of the Table 8 calculations, we have<br />
set to zero any input effect that was statistically nonsignificant at the 15% level in Tables 6 and 7.<br />
0.93
TECHNICAL REPORTS: INVESTIGATIONS 2009–2011<br />
Table 8 shows that, by way of mean surprise alone, the net knowledge impact of expanding research-team<br />
FTE is (0.873) (0.121) = 0.106. In other words, by virtue of its boost to mean surprise, expanding team<br />
hours by one percent enhances knowledge creation by 0.11%. And because the team-size effect on<br />
statistical accuracy is nonsignificant even at a generous confidence level, size’s mean-surprise effect is its<br />
total effect. Thus, a one-percent team expansion boosts new knowledge by a net 0.106 – 0 = 0.11%.<br />
Science labor has a positive though moderate marginal impact on scientific knowledge.<br />
On account of its (modestly) statistically significant boost to mean surprise, a one-percent improvement in<br />
the team’s education lifts knowledge creation by (0.873) (0.397) = 0.346%. On account of its surprising<br />
exacerbation of sampling variance, education impairs knowledge creation by (- 0.101) (0.709) = -<br />
0.072%. The net new-knowledge impact of boosting education by one percent is thus 0.27%. Despite,<br />
that is, its quixotic negative influence on research accuracy in the 2009 – 2011 data, education has a<br />
positive influence on scientific knowledge.<br />
Finally, as we have seen in Tables 6 and 7, reducing distance to study site has little effect on either mean<br />
surprise or statistical accuracy. Its net-knowledge effect by way of mean surprise is only (0.873) (0.01) =<br />
0.009, and by way of statistical accuracy is nonsignificant. Thus, as Table 8 shows, distance has only a<br />
0.01 knowledge elasticity in the 2009 – 2011 investigations. Reducing distance one percent expands<br />
scientific knowledge by 0.01%. This is little different from distance’s modest 0.03 elasticity in the 2007<br />
– 2009 investigations.<br />
Following the same procedures, Table 8 shows, holding the other factors constant, that fish-production,<br />
marketing, and species-development findings contain respectively 2.8%, 7.6%, and 4.9% more new<br />
knowledge than water-quality findings do. These positive margins are smaller than the respective 4.6%,<br />
31.2%, and 82.9% margins encountered in th<br />
e 2007 – 2009 investigations. In the present 2009 – 2011 data, they come nearly entirely from the<br />
findings’ accuracy rather than mean-surprise aspect.<br />
As in 2007 – 2011, topic-area category was shown in Table 6 to have had no statistically significant<br />
bearing on 2009 – 2011’s mean surprises. Hence, topic area’s influence on knowledge creation is again<br />
just its influence on accuracy weighted by accuracy’s implication (- 0.101 in the 2009 – 2011 data) for net<br />
new knowledge. Production, health, and environmental topic areas thus bring in Table 8 an average<br />
1.4%, 14.6%, and 2.0% more new knowledge than does the marketing topic area, all other factors –<br />
including the finding dimension – accounted for. The corresponding margins in 2007 – 2009 were 7.3%,<br />
3.4%, and 7.2%.<br />
Returns to Scale<br />
The sum of an enterprise’s continuous-input production elasticities constitutes the enterprise’s returns to<br />
scale. Because we regard FTE, education, and travel-distance-reduction as inputs in a research enterprise,<br />
we therefore can compute returns to scale in the production of mean surprise (Table 6) as (acknowledging<br />
the effects are significant at only the 10% to 15% level) 0.121 + 0.397 + 0.010 = 0.528. Returns-to-scale<br />
below unity imply productive efficiency declines as enterprise size is expanded. Thus, scaling team labor<br />
time and education upward and travel distance downward would, while bringing more average surprise,<br />
do so with declining input efficiency. Undoubtedly, this reflects the poor replicability of the lead<br />
scientist’s time and creative talent, which presumably are mostly responsible for the location shift of the<br />
outcome density function that provide mean surprise. However, 0.528 is substantially greater – implying<br />
a lower efficiency-loss rate – than the 0.093 returns-to-scale encountered in the 2007 – 2009<br />
investigations.<br />
Returns to scale in the production of research accuracy are negative in the 2009 – 2011 phase on account<br />
of education’s unexplainably negative accuracy impact in Table 6. But even if education’s 0.709 variance<br />
100
101<br />
TECHNICAL REPORTS: INVESTIGATIONS 2009–2011<br />
elasticity is maintained, returns to scale in net knowledge creation remain positive in the 2009 – 2011<br />
data. Weighting the statistically significant mean-surprise elasticities by their 0.873 knowledge weight<br />
and accuracy elasticities by their – 0.101 weight gives a net return-to-scale of 0.106 - 0.072 + 0.009 =<br />
0.043. (In the 2007 – 2009 investigations, the net was 0.242.) In other words, returns to scale in 2009 –<br />
2011 <strong>AquaFish</strong> knowledge creation were positive though strongly decreasing, implying steeply declining<br />
productive efficiency as investigation size grows. Adams and Griliches (1996) similarly find decreasing<br />
returns to scale in U.S. academic research. Decreasing returns signify a fixity in the research inputs<br />
excluded from the computation. Many such inputs clearly have not, from the evidence of our regressions’<br />
2<br />
Rs, been captured in the present analysis at all. But others are present in the form of the research<br />
outcome dimensions and topic-area categories. Each confines what the investigator is examining and<br />
hence implies a constraint in its own right, limiting the possibilities for efficient scaling-up of research<br />
effort.<br />
Thinking about the factors that were nonsignificant in a regression analysis can be as important as<br />
thinking about those significant, and several research inputs consistently had non-robust or nonsignificant<br />
effects in the present analysis. Because of their high correlation with other inputs, <strong>AquaFish</strong> dollar<br />
expenditures had unstable estimated impacts on knowledge output. U.S. and host-country cost share<br />
effects were unstable as well, partly because they are observed only at the project level and partly because<br />
the expenses they represent – salaries, materials, capital infrastructure – vary unevenly across project.<br />
Experiment and survey sample sizes, which vary by treatment, outcome dimension, and survey question<br />
as well as by investigation, ought by statistical theory to have a negative effect on posterior variances. In<br />
our own results they appeared to have no impact at all. Collaborator hours and education also were<br />
nonsignificant, and road- and transportation-type effects were non-robust. Stratification of the analysis by<br />
topic-area category required too many observations to be feasible.<br />
CONCLUSIONS<br />
We have statistically assessed the factors affecting the knowledge generated in <strong>AquaFish</strong> investigations,<br />
using the Bayesian value of sample information as the knowledge measure. A mean-absolute-deviation<br />
utility functional form allowed decomposing that knowledge into two independent effects: the difference<br />
(mean surprise) between the prior expectation of the research outcome and its posterior or statistical<br />
mean, and the outcome’s statistical variance (accuracy). The former speaks to research’s ability to shift<br />
the location of the probability distribution of possible study outcomes, and the latter to its ability to<br />
improve the tightness of that distribution. The decomposition permitted separate examination of research<br />
inputs’ effects on these two distinct knowledge dimensions as well their effects on net or total knowledge.<br />
We find, in 2009 – 2011 <strong>AquaFish</strong> research, strong evidence of decreasing returns to scale in the<br />
production of both research surprise and net knowledge creation. Likely, much of the surprise depends on<br />
the lead investigators’ skills in question formulation and research strategy, which cannot easily be<br />
replicated with additional money inputs. Replicability and hence feasible investigation expansion is<br />
especially curtailed by the variety of topics and outcomes pursued in <strong>AquaFish</strong> research, which serve as a<br />
fixity which frustrates scale economy. It might be argued that topic variety is, in the present setting,<br />
socially more important than returns-to-scale are.
TECHNICAL REPORTS: INVESTIGATIONS 2009–2011<br />
Analysis of Training-Type Investigations<br />
Qian Wu, <strong>Oregon</strong> <strong>State</strong> <strong>University</strong>, assisted with this training-investigation analysis.<br />
INTRODUCTION<br />
Training investigations take approximately 35 percent of the <strong>AquaFish</strong> <strong>CRSP</strong> budget and may, like<br />
research investigations, be regarded as productive units (Charnes, Cooper, and Rhodes 1978). Measuring<br />
the efficiency of these investigations provides an important policy tool for USAID policy makers. The<br />
method of doing so in the present study gives information about: (i) each training investigation’s relative<br />
technical efficiency, and (ii) how each investigation might allocate its inputs and outputs to attain full<br />
efficiency (Groot and Garcia-Valderrama 2006, Tone 2001).<br />
METHODS<br />
A sum-directional distance function is applied to our data to provide information about (i) and (ii). This<br />
distance function, introduced by Fare and Grosskopf (2010), allows investigations to reallocate their<br />
inputs and outputs to attain efficiency. Comparing efficient with observed allocations of inputs and<br />
outputs provides the decision maker information about policy actions that might improve total training<br />
budget use. The distance function also yields an efficiency indicator for each investigation, allowing it to<br />
be ranked with respect to performance.<br />
We treat each <strong>AquaFish</strong> training investigation as a productive unity in the sense of Data Envelopment<br />
k<br />
Analysis (Charnes, Cooper, and Rhodes 1978). Each unit, k = 1, … , K, uses inputs x ( xk1 , ..., xkn)<br />
to<br />
k<br />
produce outputs y ( yk1 , ..., ykm)<br />
. These observations form the reference technology toward which<br />
efficiency is calculated.<br />
Fare and Grosskopf (2011), building on Tone (2001), formulated a sum-directional distance function as a<br />
measure of efficiency relative to the DEA reference technology. In particular, a training investigation’s<br />
technical efficiency is specified as the following optimization problem:<br />
(12)<br />
max ... ... <br />
O 1 N 1<br />
M<br />
K<br />
<br />
s. t. z x x , n 1,...<br />
N<br />
k<br />
z<br />
K<br />
<br />
k<br />
k kn on n<br />
z y y , m 1,...,<br />
M<br />
k km om m<br />
0, 0, 0,<br />
k n m<br />
k 1,... K; n 1,..., N ; m 1,...<br />
M<br />
where k z , n = 1, …, k, are the intensity variables. The model reduces inputs by n ( n 1, ..., N ) and<br />
increases output by m ( m 1,..., M ). The optimal input to (12) yields 0 for investigation “0” and<br />
shows by how many units inputs may be reduced or output raised. Because the intensity variables z k , k =<br />
1, …., K, are restricted only to be nonnegative, the model exhibits constant returns to scale.<br />
Figure 1 depicts this efficiency mechanism. Points A, B, and C are three observed investigations, all<br />
using inputs x to produce outputs y under constant returns to scale. Points A and B are on the best<br />
102
103<br />
TECHNICAL REPORTS: INVESTIGATIONS 2009–2011<br />
practice frontier, meaning they cannot be improved upon. The optimal path to C’s efficiency is to raise its<br />
outputs from Y C to Y D and decrease its inputs from C X to X D , arriving at D. MATLAB 7.0 is used to<br />
calculate the efficiency scores, and input and output changes achieving the best-practice frontier.<br />
Y<br />
YD<br />
YC<br />
O<br />
A<br />
D<br />
B<br />
XD<br />
Data<br />
Figure 1. Technically Efficient and Inefficient Activities<br />
<strong>AquaFish</strong> training investigations involved workshops, meetings, training sessions, and podcasts for a<br />
variety of participants, including farmers, technicians, researchers, and sometimes potential investors.<br />
They provided training in pond layout and design, stocking techniques, feeds and feeding, water<br />
management, processing and packing, and management. Conducting these programs required trainer<br />
time, training materials, transportation expenditures, and other inputs.<br />
Investigation outputs are represented here by the number of person-training days provided. The modest<br />
number of training investigations prevents specifying a large number of alternative inputs. Four inputs<br />
are specified here:<br />
(i) <strong>AquaFish</strong> expenditure, observable at the investigation level<br />
(ii) US-institution cost share, observable at the project level<br />
(iii) Host-country-institution cost share, observable at the project level<br />
(iv) Number of workshops provided during the two-year project<br />
XC<br />
The advantage of using expenditures and cost shares is that they represent most of the investigation<br />
inputs. The disadvantages of project-level cost shares is that they are not broken down by investigation;<br />
and the types of inputs to which they correspond differ across projects. The number of workshops can be<br />
considered an output measure; but it also is an input measure because it proxies for the set-up and set-<br />
C<br />
X
TECHNICAL REPORTS: INVESTIGATIONS 2009–2011<br />
down costs of workshop organization. It is considered here to be an input, that is a drag on the number of<br />
training hours provided with given resources (although it also might be correlated with training quality).<br />
Thirteen training-type investigations, collectively involving 26 workshops, were conducted during the<br />
2007 – 2009 <strong>AquaFish</strong> phase. Nine training-type investigations, involving 28 workshops, were<br />
conducted during the 2009 – 2011 phase. Several investigations that comprised large conferences were<br />
considered non-comparable to the others and omitted.<br />
RESULTS<br />
Table 9 provides the results for the full 22-investigation data set. Quantities in the x 1 , 2 x , 3 x , x4 and y<br />
column are respectively the four observed inputs and the output. Corresponding columns with d<br />
subscripts show the technically efficient input levels, namely on the efficiency frontier as defined by the<br />
most-efficient investigations. The inefficiency (DSDM) measure in the right-hand column is the sum<br />
(divided by 10,000) of the investigation’s observed input and output distances to the frontier. Hence, a<br />
given row in Table 9 indicates both the technical inefficiency and the changes that would correct it in the<br />
least-cost way.<br />
An investigation provided, on average, 179 person-days of training to 105 trainees, that is 1.7 days of<br />
training per trainee. An average of 2.45 workshops were conducted, the majority short-term ones varying<br />
from one to three days. The mean number of trainees per workshop was about 43. <strong>AquaFish</strong><br />
expenditures on these training investigations averaged $60,776. They differed dramatically from one<br />
investigation to the next. Mean host-country cost share was $95,716, and average US-institution cost<br />
share $149,562. Host-country cost shares varied substantially across investigations but US cost shares<br />
varied little.<br />
We can see in the bottom rows of Table 9 that four investigations (two in the 2007 – 2009 <strong>AquaFish</strong><br />
phase and two in the 2009 – 2011 phase) achieve, among all our observations, maximal relative efficiency<br />
in the sense of producing as many person-training days as possible with the resources at hand. Two of<br />
these most-efficient are in Latin America, one in Asia, and one in Africa. One is in technology adoption<br />
(TAP), one in production systems (BMA), and two in human health (HHI). In contrast, among the four<br />
most-inefficient investigations, two are in Latin America, one in Africa, and one in Asia; they cover a<br />
variety of topic areas. Considering the rest of the investigations also, there thus appears to be little<br />
association between apparent inefficiency and either location or topic.<br />
d<br />
But inefficiency ratios xi / xiin Table 9 are difficult to believe. They say, for example, that investigation<br />
09BMA06UM could have produced the training hours it did with only 7% of the <strong>AquaFish</strong> expenditure it<br />
used. Some of the host-country cost share inefficiencies seem to be worse. Among the 18 inefficient<br />
investigations, average ratio of optimal to observed input is 26%. Evidently, the four most-efficient<br />
investigations at the bottom of the table are setting an impossible efficiency standard for the rest to<br />
follow. That is explainable either by supposing the top-four had enormous and nonreplicable cost<br />
advantages or that our cost data contain substantial inaccuracy. Because the <strong>AquaFish</strong> expenditures are<br />
indisputable, and the US cost shares do not differ much across projects, we think the reported hostcountry<br />
cost shares poorly reflect host-country contributions to the training projects, in turn skewing the<br />
inefficiency magnitudes.<br />
As a robustness test, therefore, we eliminated Table 9’s seven most-efficient investigations and re-ran the<br />
analysis without them. This allowed the most-efficient investigations to arise from among the remaining<br />
15 in the sample. Results are shown in Table 10. Five of the investigations in Table 10 are on the<br />
efficiency frontier: one in Latin America, two in Asia, and two in Africa. Each focused on a different<br />
104
105<br />
TECHNICAL REPORTS: INVESTIGATIONS 2009–2011<br />
topic area. The less efficient investigations likewise are in a variety of locations and topic areas. Again,<br />
therefore, no geographic area or training topic reveals any efficiency dominance. Indeed, the absence of<br />
any systematic effect of topic or regional location on efficiency appears to be an important conclusion<br />
from this work. However, optimal <strong>AquaFish</strong> expenditures and cost shares continue to be rather small<br />
percentages of the observed levels. Among inefficient investigations, ratios of optimal to observed inputs<br />
average 30%.<br />
CONCLUSIONS<br />
In this application of directional-distance modeling to <strong>AquaFish</strong> training activities, we find wide<br />
efficiency differences among investigations. The differences are so wide as to suggest that some<br />
expenditure data inaccurately represent training input levels. Our judgment is that the greatest source of<br />
inaccuracy is in host-country cost shares. Like US cost shares, they are reported only at the project level,<br />
so we do not know which portion actually were spent on the training activities. Nor do we know how<br />
they were distributed across the several countries in which a project was involved. Finally, there is some<br />
evidence of variation across projects in the kinds of inputs – salary, infrastructure, materials – the cost<br />
share was supposed to have defrayed. These variations become especially misleading in data<br />
envelopment methods like directional distance modeling because identities of efficient and inefficient<br />
investigations can be greatly affected by even a single large data inaccuracy.<br />
Hence, we cannot place a great deal of weight on the Table 9 and 10 results. That conclusion suggests in<br />
its own right how valuable it would be for evaluation and programming purposes to have cost-share data<br />
that reliably reflects the types and magnitudes of program inputs. The results do, however, probably<br />
contain truth about the rank orderings (as opposed to the magnitudes) of the efficiencies in <strong>AquaFish</strong><br />
training programs. We should keep in mind that at least some such inefficiencies are legitimate in the<br />
sense of reflecting road conditions, travel distances, hotel rates, and training program intensity. They do<br />
not necessarily reflect managerial error. As part of, but not reported in, our above quantitative study of<br />
<strong>AquaFish</strong> research investigations, we found that investigation expenditures are significantly explained by<br />
several infrastructural factors.<br />
Case Study Analysis<br />
Jangho Choi, <strong>Oregon</strong> <strong>State</strong> <strong>University</strong>, assisted with these case studies.<br />
The case studies pursued here include investigations that have targeted pond yield and profitability, water<br />
quantity and quality, native species development, and human health and safety. See Table 11 for the<br />
case-study titles and their topic areas. Those selected focus more on research than training, although<br />
some have training and outreach components. The two principal research methods used in <strong>AquaFish</strong><br />
<strong>CRSP</strong> -- experiments and statistical surveys -- are both covered. Approximately 70% of <strong>AquaFish</strong><br />
research has involved experimental methods and the remaining 30% survey methods.<br />
Each case study was structured around the same set of questions, summarized in Table 12. To depict the<br />
study's setting, we examined its location and institutional background and the resources at the researchers'<br />
disposal. We next characterized the investigators' study strategy, including the research steps they<br />
planned to take, their plans for coordinating their work, and the types of professional and nonprofessional<br />
collaborators involved. We sought then to depict some of the dialectics of the research<br />
process, and the sequence of problems encountered and overcome. Several of the main research results<br />
and likely impacts are then summarized.<br />
Information for these case studies was obtained from three sources: (i) the investigation proposals and<br />
quarterly, annual, and final reports; (ii) a questionnaire administered to the lead investigator; and (iii) in
TECHNICAL REPORTS: INVESTIGATIONS 2009–2011<br />
some cases, email contacts with the lead investigator. The purpose of the questionnaire and email<br />
contacts was to capture aspects of the study that typically are not recorded in formal publications. We<br />
were in a few cases able to circulate case-study drafts to the lead investigators and lead host-country and<br />
U.S. principal investigators for accuracy checks. We will continue to consult with all the research leaders<br />
to improve the versions included in the present report.<br />
The seven case studies, one from <strong>AquaFish</strong>’s Phase I (2007 – 2009), five from its Phase II (2009 – 2011),<br />
and one from both the 2007 – 2009 and 2009 – 2011 phase, are provided in Appendix D.<br />
REFERENCES<br />
Adams, and Griliches. 1996. “Research Productivity in a System of Universities.” NBER Working<br />
Paper No. 5833.<br />
Belsley, D.A., E. Kuh, and R.E. Welsh. 1980. Regression Diagnostics: Identifying Influential Data and<br />
Sources of Collinearity. New York: John Wiley, 1980.<br />
Buccola, S.T., D. Ervin, and H. Yang. “Research Choice and Finance in <strong>University</strong> Bioscience.”<br />
Southern Economic Journal 75 (April 2009): 1238 - 1255<br />
Carlin, B.P., and T.A. Louis. 1996. Bayes and Empirical Bayes Methods for Empirical Analysis.<br />
London: Chapman and Hall.<br />
CGIAR Science Council. 2009. Defining and Refining Good Practice in Ex-Post Impact Assessment –<br />
Synthesis Report. CGIAR Science Council Secretariat: Rome, Italy.<br />
Charnes, A., C. Cooper, and E. Rhodes, Measuring the Efficiency of Decision Making Units, European<br />
Journal of Operational Research, 1978, 2:429-444.<br />
Färe, R., and S. Grosskopf. 2010. “Directional Distance Functions and Slacks-Based Measures of<br />
Efficiency.” European Journal of Operational Research 200 (1): 320-322.<br />
Groot, T., and T. Garcia-Valderrama. 2006. “Research Quality and Efficiency: An Analysis of<br />
Assessments and Management Issues in Dutch Economics and Business Research Programs.”<br />
Research Policy 35: 1362 - 1376.<br />
Heston, A., R. Summers, and B. Aten. 2011. Penn World Table, Version 7.0. Center for International<br />
Comparisons of Production, Income, and Prices, <strong>University</strong> of Pennsylvania.<br />
Robert, C.P. 2001. The Bayesian Choice, 2 nd Ed. New York: Springer-Verlag.<br />
Press, S.J. 1989. Bayesian Statistics: Principles, Models, and Applications. New York: John Wiley and<br />
Sons.<br />
Schimmelpfennig, D. E., and G.W. Norton. 2003. “What is the Value of Agricultural Economics<br />
Research?” American Journal of Agricultural Economics. 85: 81 – 94.<br />
Stael von Holstein, C.A. 1970. Assessment and Evaluation of Subjective Probability Distributions. The<br />
Economics Research Institute, Stockholm School of Economics.<br />
Tone, K. 2001. “A Slacks-Based Measure of Efficiency in Data Envelopment Analysis.” European<br />
Journal of Operational Research 130 (3): 498 – 509.<br />
Winkler, R.L. 1972. An Introduction to Bayesian Inference and Decision. New York: Holt, Rinehart,<br />
Winston.<br />
Xia, Y., and S.T. Buccola. 2005. “<strong>University</strong> Life Science Programs and Agricultural Biotechnology.”<br />
American Journal of Agricultural Economics 87: 229 – 243.<br />
106
107<br />
TECHNICAL REPORTS: INVESTIGATIONS 2009–2011<br />
Table 1. Example of a Comparison of Prior and Posterior Outcome Density Function, by Research<br />
Outcome for a Given Investigation and Research Treatment a<br />
Research Outcome<br />
Fish harvest yield<br />
(kg/ha)<br />
Dissolved oxygen<br />
(mg/L)<br />
Total suspended<br />
solids (mg/L)<br />
Possible<br />
Outcome Level<br />
Low 7000 0.10<br />
Median 8000 0.60<br />
High 9000 0.30<br />
Low 6 0.20<br />
Median 7 0.70<br />
High 8 0.10<br />
Low 20 0.10<br />
Median 30 0.70<br />
High 40 0.20<br />
Prior probability Posterior mean<br />
Posterior<br />
standard<br />
deviation<br />
8255.06 1438.05<br />
6.74 1.05<br />
47.12 12.33<br />
a Example is drawn from Investigation #07MNE04UM, “Assessing Effectiveness of Current Waste Management Practices for<br />
Intensive Freshwater and Marine Pond Aquaculture in China.”
TECHNICAL REPORTS: INVESTIGATIONS 2009–2011<br />
Table 2. Types of Research Inputs.<br />
Money Expenditures ( E ) hi<br />
(a) <strong>AquaFish</strong>-covered expenditure<br />
(b) U.S. institution expenditure (cost share)<br />
(c) host-country institution expenditure (cost share)<br />
Human Capital ( H ) i<br />
(a) research team total FTE<br />
(b) research team size<br />
(c) research team mean age<br />
(d) research team mean education<br />
(e) collaborator average education<br />
VI.<br />
Research Problem Type ( T ) ijk<br />
(a) analytical approach (experiment versus statistical survey)<br />
(b) investigation sample size<br />
(c) research outcome dimension (production, marketing, species development, water quality)<br />
(d) <strong>AquaFish</strong> Topic Area category (production, human health, technology adoption, marketing,<br />
environment)<br />
VII.<br />
Public Infrastructure ( I ) i<br />
(a) Mean roundtrip distance to study sites<br />
(b) Road type<br />
(c) Transportation type<br />
(d) Region of world (representing climate, culture, or other geographic conditions)<br />
(e) Wage rates indexes as representative of factor prices<br />
108
109<br />
TECHNICAL REPORTS: INVESTIGATIONS 2009–2011<br />
Table 3. <strong>AquaFish</strong> Topic-Area Categories Examined in Analysis of Knowledge Production<br />
Topic Area <strong>AquaFish</strong> Code<br />
Category I: Fish Production<br />
Production System Design & Best Management Alternatives BMA<br />
Sustainable Feed Technology SFT<br />
Indigenous Species Development IND<br />
Quality Seedstock Development QSD<br />
Category II: Human Health<br />
Human Health Impacts of Aquaculture HHI<br />
Food Safety and Value-Added Product Development FSV<br />
Category III: Technology Adoption<br />
Technology Adoption and Policy Development TAP<br />
Category IV: Fish Marketing<br />
Marketing, Economic Risk Assessment, and Trade MER<br />
Category V: Environment<br />
Watershed and Integrated Coastal Zone Management WIZ<br />
Mitigating Negative Environmental Impacts MNE<br />
_________<br />
Note: Topic Areas and codes in this table are official <strong>AquaFish</strong> designations. Categories shown are our own and are for<br />
purposes of the present Investigation only.
TECHNICAL REPORTS: INVESTIGATIONS 2009–2011<br />
Table 4. Definitions of Explanatory Variables Used in Statistical Analysis, 2009 – 2011 <strong>AquaFish</strong><br />
Research Investigations.<br />
Money Expenditure ( E hi )<br />
<strong>AquaFish</strong> expenditure Investigation expenditure financed by <strong>AquaFish</strong><br />
Host-Country cost share Investigation expenditure financed by Host-Country Institution<br />
US Institution cost share Investigation expenditure financed by U.S. Principal Investigator's Institution<br />
Human Capital ( H i ):<br />
Team Size Number of researchers on investigation team<br />
Team Mean Education Mean number of school/university years of research team member<br />
Team FTE Total annual full-time-equivalent labor of research team<br />
Team Average Age Mean age of research team member<br />
Collaborator Hours Worked Total working hours of non-team individuals helping with the investigation<br />
Collaborator Education Mean number of school or university years per collaborator<br />
Other<br />
Analytical Approach 1 if approach is controlled experiment; 0 if statistical survey<br />
Outcome Sample Size Number of observations of experimental treatment effect or survey response<br />
Country Wage Rate Index: Mean wage rate in country (base = Tanzania)<br />
Research Problem Type ( T ijk )<br />
Research Outcome Dimension<br />
Fish Production 1 if outcome relates to fish production; 0 otherwise<br />
Fish Marketing 1 if outcome relates to fish marketing; 0 otherwise<br />
Species Development 1 if outcome relates to species development; 0 otherwise<br />
Water Quality 1 if outcome is a water quality observation; 0 otherwise<br />
Topic-Area Category<br />
Fish Production 1 if Topic-Area is in fish production; 0 otherwise<br />
Human Health 1 if Topic-Area is in human health ; 0 otherwise<br />
Technology Adoption 1 if Topic-Area is in technology adoption; 0 otherwise<br />
Fish Marketing 1 if Topic-Area is in fish marketing; 0 otherwise<br />
Environment 1 if Topic-Area is environmental 0 otherwise<br />
110
Public Infrastructure ( I i )<br />
Road Type<br />
111<br />
TECHNICAL REPORTS: INVESTIGATIONS 2009–2011<br />
Paved 1 if roads from station to research sites are mostly paved; 0 otherwise<br />
Gravel 1 if roads from station to research sites are mostly gravel; 0 otherwise<br />
Dirt 1 if roads from station to research sites are mostly dirt; 0 otherwise<br />
Transportation<br />
Walking 1 if mostly walking to research sites; 0 otherwise<br />
Auto/Bus 1 if mostly taking auto or bus to research sites; 0 otherwise<br />
Mean Distance Total mean distance from research station to research sites<br />
Region of World ( G i )<br />
Asia 1 if investigation is in Asia; 0 otherwise<br />
Africa 1 if investigation is in Africa; 0 otherwise<br />
Latin America 1 if investigation is in Mexico, Nicaragua, or Guyana; 0 otherwise
TECHNICAL REPORTS: INVESTIGATIONS 2009–2011<br />
Table 5. Summary Statistics of Sample Data, 2009 – 2011 <strong>AquaFish</strong> Research Investigations (N = 284)<br />
Knowledge Generated<br />
Variable Unit Mean<br />
112<br />
Standard<br />
Deviation<br />
Coefficient of<br />
Variation<br />
Value of Sample Information (K) proportion 0.145 0.162 1.12<br />
Mean Surprise (MAD) “ 0.171 0.195 1.14<br />
Accuracy (Standard Deviation) “ 0.335 0.370 1.10<br />
Money Expenditure ( E hi )<br />
<strong>AquaFish</strong> Expenditure<br />
Host-Country Cost Share<br />
$/investigation<br />
$/project<br />
90,645<br />
82,438<br />
35,162<br />
15,419<br />
0.39<br />
0.19<br />
US Cost Share $/project 175,353 44,475 0.25<br />
Human Capital ( H i )<br />
Other<br />
Team Size no. of persons 9.93 4.5 0.45<br />
Team Mean Education years/person 17.1 1.0 0.06<br />
Team FTE years 3.24 1.13 0.35<br />
Team Average Age years/person 32.1 4.3 0.13<br />
Collaborator Education<br />
Collaborator Hours Worked<br />
years/person<br />
hours<br />
13.1<br />
143.23<br />
3.37<br />
152.57<br />
0.26<br />
1.07<br />
Experiments vs Surveys<br />
1 = experiment 0.69 0.46 0.67<br />
Country Wage-Rate Index index 0.471 0.25 0.53<br />
Research Problem Type ( T ijk )<br />
Research Outcome Dimension<br />
Fish Production category 0.630 0.48 0.76<br />
Fish Marketing “ 0.134 0.34 2.54<br />
Species Development “ 0.113 0.32 2.83<br />
Water Quality “ 0.123 0.33 2.68
Research Topic-Area Category<br />
113<br />
TECHNICAL REPORTS: INVESTIGATIONS 2009–2011<br />
Fish Production category 0.577 0.49 0.85<br />
Human Health “ 0<br />
Technology Adoption “ 0.042 0.20 4.76<br />
Fish Marketing “ 0.158 0.36 2.28<br />
Environment “ 0.222 0.42 1.89<br />
Public Infrastructure ( I i )<br />
Road Type<br />
Paved category 0.62 0.49 0.79<br />
Gravel “ 0.14 0.34 2.43<br />
Dirt “ 0.24 0.43 1.79<br />
Transportation Type<br />
Walking category 0.07 0.26 3.71<br />
Auto/Bus “ 0.93 0.26 0.28<br />
Mean Distance to Study Site kilometers 1132.8 2067.0 1.82<br />
Region of World ( G i )<br />
Asia category 0.81 0.39 0.48<br />
Africa “ 0.19 0.39 2.05<br />
Latin America “ 0
TECHNICAL REPORTS: INVESTIGATIONS 2009–2011<br />
Table 6. Factors Affecting Absolute Difference Between Prior and Posterior Mean Finding (Mean<br />
Surprise), 2009 – 2011 <strong>AquaFish</strong> Research Investigations.<br />
Research Input Estimate Standard Error t-value<br />
Intercept -1.299 0.761 -1.71<br />
Continuous Inputs<br />
Team FTE 0.121 0.068 1.78<br />
Team Mean Education 0.397 0.266 1.49<br />
Mean Distance to Study Site -0.010 0.007 -1.44<br />
Analytical Approach<br />
Experiments vs Surveys -0.075 0.068 -1.11<br />
(Base: Statistical Surveys)<br />
Research Outcome Dimension<br />
Fish Production -0.043 0.051 -0.84<br />
Fish Marketing 0.072 0.070 1.03<br />
Species Development -0.045 0.102 -0.44<br />
(Base: Water Quality)<br />
Research Topic-Area Category<br />
Fish Production -0.020 0.069 -0.30<br />
Human Health -0.109 0.089 -1.23<br />
Environment -0.030 0.080 -0.37<br />
(Base: Fish Marketing)<br />
Region of World<br />
Asia -0.328 0.082 -4.02<br />
(Base: Africa and Latin America)<br />
114
115<br />
TECHNICAL REPORTS: INVESTIGATIONS 2009–2011<br />
Table 7. Factors Affecting Standard Deviation (Inaccuracy) of Research Findings, 2009 – 2011<br />
<strong>AquaFish</strong> Research Investigations.<br />
Research Input Estimate Standard Error t-value<br />
Intercept -1.489 0.787 -1.89<br />
Continuous Variables<br />
Team FTE -0.062 0.071 -0.88<br />
Team Mean Education 0.709 0.275 2.58<br />
Mean Distance to Study Site 0.006 0.007 0.83<br />
Analytical Approach<br />
Experiments vs Surveys -0.593 0.070 -8.45<br />
(Base: Statistical Surveys)<br />
Research Outcome Dimension<br />
Fish Production -0.278 0.053 -5.26<br />
Fish Marketing -0.130 0.073 -1.79<br />
Species Development -0.483 0.105 -4.58<br />
(Base: Water Quality)<br />
Research Topic Area Category<br />
Fish Production -0.137 0.071 -1.93<br />
Human Health -0.501 0.092 -5.47<br />
Environment -0.195 0.082 -2.36<br />
(Base: Fish Marketing)<br />
Region of World<br />
Asia 0.061 0.084 0.72<br />
(Base: Africa and Latin America)<br />
Notes<br />
Dependent variable: Standard deviation of experimental finding or survey response<br />
Residual standard error: 0.222<br />
Sample size: 284<br />
Multiple R-square: 0.649
TECHNICAL REPORTS: INVESTIGATIONS 2009–2011<br />
Table 8. Decomposition of Research Inputs’ Net Knowledge Effects, 2009 – 2011 <strong>AquaFish</strong> Research<br />
Investigations.<br />
Research Input<br />
Continuous Variables<br />
Knowledge Contribution<br />
Knowledge Contribution<br />
via Research Mean<br />
via Research Accuracy<br />
Surprise<br />
116<br />
Total Knowledge<br />
Contribution<br />
Team FTE 0.106 0 0.106<br />
Team Mean Education 0.346 -0.072 0.274<br />
Mean Distance to Study Site* 0.009 0 0.009<br />
Analytical Approach<br />
Experiments vs Surveys 0.066 0.060 0.126<br />
(Base: Statistical Surveys)<br />
Research Outcome Dimension<br />
Fish Production 0 0.028 0.028<br />
Fish Marketing 0.063 0.013 0.076<br />
Species Development 0 0.049 0.049<br />
(Base: Water Quality)<br />
Research Topic Area Category<br />
Fish Production 0 0.014 0.014<br />
Human Health 0.095 0.051 0.146<br />
Environment 0 0.020 0.020<br />
(Base: Fish Marketing)<br />
Region of World<br />
Asia 0.286 0 0.286<br />
(Base: Africa and Latin America)<br />
Notes: Contributions in the first column are elasticities in Table 5 multiplied by mean surprise’s marginal positive contribution<br />
(0.873) to scientific knowledge. Contributions in the second column are elasticities in Table 6 multiplied by standard deviation’s<br />
marginal negative contribution (- 0.101) to scientific knowledge. Numbers for the continuous inputs are percentage changes<br />
induced by a one-percent change in the indicated input. Those for categorical variables are percent changes associated with<br />
switching from the base group to the group indicated. * Mean distance effects refer to a reduction in mean distance.
Table 9. Technical Efficiency Analysis of 2007 – 2011 <strong>AquaFish</strong> Training Investigations, Full Data Set.<br />
117<br />
TECHNICAL REPORTS: INVESTIGATIONS 2009–2011<br />
Investigation Location <strong>AquaFish</strong> Expenditure US Cost Share HC Cost Share No. of Workshops Training Days DSDM<br />
1 x d d<br />
x /<br />
1 1 1<br />
x x 2<br />
x d d<br />
x /<br />
2 2 2<br />
x x 3<br />
x d d<br />
x /<br />
3 3 3<br />
x x 4<br />
x d d<br />
x /<br />
4 4 4<br />
x x y<br />
07SFT04UA Guyana 15389 3236 21% 154861 18241 12% 237110 7510 3% 3 0 15% 62 3.78<br />
07BMA03UA Mexico 14600 3914 27% 154861 22071 14% 237110 9090 4% 1 1 55% 75 3.72<br />
07MER02PU Ghana & Kenya 147828 2868 2% 153884 16184 11% 93853 6666 7% 2 0 20% 55 3.70<br />
07TAP01UC Cambodia 98898 5271 5% 167036 29716 18% 128100 12240 10% 3 1 25% 101 3.47<br />
07WIZ01PU Ghana 122912 5842 5% 153884 32954 21% 93853 13575 14% 1 1 82% 112 3.18<br />
09BMA06UM Thailand 65829 4854 7% 192500 27360 14% 89543 11272 13% 1 1 68% 93 3.04<br />
07QSD02PU Western Kenya 84187 3132 4% 153884 17654 11% 93853 7272 8% 1 0 44% 60 3.04<br />
09FSV01UC Cambodia 62281 2557 4% 158408 14418 9% 77185 5939 8% 1 0 36% 49 2.75<br />
07MER03PU Tanzania 37000 1566 4% 153884 8824 6% 93853 3636 4% 1 0 22% 30 2.71<br />
07MNE07UM China 30000 2505 8% 140780 14120 10% 112300 5820 5% 1 0 35% 48 2.61<br />
09SFT02PU Kenya 78406 7307 9% 187883 41193 22% 55185 16968 31% 3 1 34% 140 2.56<br />
09IND06PU Ghana 78263 11013 14% 187883 62083 33% 55185 25574 46% 2 2 77% 211 2.23<br />
07BMA04UH Mexico 32291 1461 5% 104849 8238 8% 63287 3394 5% 2 0 10% 28 1.87<br />
09TAP03UC Cambodia 61945 14509 23% 158408 81794 52% 77185 33694 44% 8 2 25% 278 1.68<br />
09FSV03UC Cambodia & Vietnam 100000 5480 5% 35369 30893 87% 77185 12726 16% 2 1 38% 105 1.63<br />
09QSD05PU Ghana 100000 7985 8% 69936 45016 64% 55185 18544 34% 2 1 56% 153 1.54<br />
07HHI04UH Mexico 37000 6733 18% 104849 37955 36% 63287 15635 25% 1 1 94% 129 1.45<br />
07MNE02NC Indonesia & Philippines 40805 23486 58% 155902 132400 85% 60657 54541 90% 7 3 47% 450 0.47<br />
07TAP02NC Philippines 19438 19438 100% 155902 155902 100% 60657 60657 100% 1 1 100% 168 0<br />
09BMA02AU Uganda 50000 50000 100% 281865 281865 100% 116112 116112 100% 7 7 100% 958 0<br />
07HHI03UH Mexico 40000 40000 100% 104849 104849 100% 63287 63287 100% 2 2 100% 319 0<br />
09HHI02UH Mexico & Nicaragua 20000 20000 100% 158678 158678 100% 101774 101774 100% 2 2 100% 314 0<br />
Mean 60776 11053 29% 149562 61019 42% 95716 27542 35% 2 1 54% 179
TECHNICAL REPORTS: INVESTIGATIONS 2009–2011<br />
Table 10. Technical Efficiency Analysis of 2007 – 2011 <strong>AquaFish</strong> Training Investigations, Reduced DataSet.<br />
Investigation Location <strong>AquaFish</strong> Expenditure US Cost Share HC Cost Share No. of Workshops Training Days DSDM<br />
1 x d d<br />
x 1 1 / 1<br />
x x 2<br />
x d d<br />
x 2 2 / 2<br />
118<br />
x x 3<br />
x d d<br />
x 3 3 / 3<br />
x x 4<br />
x d d<br />
x 4 4 / 4<br />
x x y<br />
07SFT04UA Guyana 15389 5622 37% 154861 21481 14% 237110 8360 4% 3 1 32% 62 3.72<br />
07BMA03UA Mexico 14600 10990 75% 154861 35941 23% 237110 17710 7% 1 1 100% 75 3.42<br />
07TAP01UC Cambodia 98898 9158 9% 167036 34996 21% 128100 13610 11% 3 2 52% 101 3.36<br />
09FSV01UC Cambodia 62281 4443 7% 158408 16978 11% 77185 6605 9% 1 1 76% 49 2.70<br />
07MNE07UM China 30000 4353 15% 140780 16630 12% 112300 6470 6% 1 1 75% 48 2.56<br />
09SFT02PU Kenya 78406 12695 16% 187883 48503 26% 55185 18871 34% 3 2 73% 140 2.41<br />
09BMA06UM Thailand 65829 19660 30% 192500 58910 31% 89543 32901 37% 1 1 100% 93 2.36<br />
07WIZ01PU Ghana 122912 28812 23% 153884 83157 54% 93853 48938 52% 1 1 100% 112 2.10<br />
07BMA04UH Mexico 32291 2539 8% 104849 9701 9% 63287 3774 6% 2 0 22% 28 1.84<br />
09TAP03UC Cambodia 61945 25208 41% 158408 96313 61% 77185 37473 49% 8 4 54% 278 1.39<br />
07HHI04UH Mexico 37000 37000 100% 104849 104849 100% 63287 63287 100% 1 1 100% 129 0<br />
07MNE02NC Indonesia & Philippines 40805 40805 100% 155902 155902 100% 60657 60657 100% 7 7 100% 450 0<br />
09QSD05PU Ghana 100000 100000 100% 69936 69936 100% 55185 55185 100% 2 2 100% 153 0<br />
09FSV03UC Cambodia & Vietnam 100000 100000 100% 35369 35369 100% 77185 77185 100% 2 2 100% 105 0<br />
09IND06PU Ghana 78263 78263 100% 187883 187883 100% 55185 55185 100% 2 2 100% 211 0<br />
Mean 62575 31970 51% 141827 65103 51% 98824 33747 48% 3 2 79% 136
Table 11. Investigations Examined in a Case Study<br />
U.S.<br />
<strong>University</strong><br />
<strong>University</strong><br />
of<br />
Michigan<br />
Auburn<br />
<strong>University</strong><br />
<strong>University</strong><br />
of Arizona<br />
<strong>University</strong><br />
of Hawaii<br />
<strong>University</strong><br />
of<br />
Connecticut<br />
Purdue<br />
<strong>University</strong><br />
North<br />
Carolina<br />
<strong>State</strong><br />
<strong>University</strong><br />
119<br />
TECHNICAL REPORTS: INVESTIGATIONS 2009–2011<br />
Investigation # Investigation Title Principal Host-<br />
Country Investigator<br />
09WIZ03UM Evaluating efficiency of nutrient and solid waste retention of traditional and improved cages<br />
for fish culture in deep lake waters in China (Mitigating negative environmental impact/Study)<br />
09WIZ01AU<br />
Effects of Watershed-Water Quality-Aquaculture Interactions On Quantity and Quality of<br />
Water from Small Catchments in South Africa and Uganda<br />
09IND05UA Consolidation of native species aquaculture in Southeastern Mexico: Continuation of a<br />
Selective Breeding Program for Native Cichlids and snook reproduction in captivity<br />
07IND01UA Development of Snook (Centropomus spp) Seed Production Technology for Application in<br />
Aquaculture and Restocking of Over-fished Populations (Tabasco)<br />
Zexia Gao<br />
Khalid Salie<br />
Wilfrido Contreras<br />
09HHI04UH Co-management and bivalve sanitation for black cockles (Anadara spp.) in Nicaragua Erick Sandoval<br />
09SFT01UC Alternative Feeds for Freshwater Aquaculture Species. Tran Thi Thanh Hien<br />
07WIZ01PU Characterization of Pond Effluents and Biological and Physiochemical Assessment of<br />
Receiving Waters in Ghana<br />
Emmanuel Frimpong<br />
Steve Amisah<br />
09SFT04NC Feeding and Feed Formulation Strategies to Reduce Production Costs of Tilapia Culture Remedios Bolivar
TECHNICAL REPORTS: INVESTIGATIONS 2009–2011<br />
Table 12. General Format of Case Study<br />
I. Problem<br />
(i) What difficulty are researchers trying to address?<br />
(ii) How will they try to address it?<br />
II. Study Setting<br />
(i) Where is the study conducted?<br />
(ii) Who conducts it?<br />
(iii) What study resources will researchers have?<br />
(iv) What is the geographic setting or other relevant environment of study?<br />
III. Study Strategy or Plan<br />
(i) How in general do researchers solve the problem?<br />
(ii) What steps do they to take?<br />
(iii) How will researchers coordinate their work with one another?<br />
(iv) What kinds of non-professional collaborators (e.g. farmers) are involved, and<br />
how?<br />
(v) What kinds of professional collaborators (e.g. university administrators,<br />
<strong>AquaFish</strong> administrators) are involved, and how?<br />
IV. Problem Solution Process<br />
Phase One: achievement and problems<br />
Phase Two: achievement and problems<br />
Phase Three: achievement and termination<br />
V. Results<br />
VI. Likely Impacts<br />
120
Appendix A. Outputs Questionnaire for Controlled Experiments<br />
<strong>CRSP</strong> PHASE: [ ] 2007-09 [ ] 2009-11<br />
INVESTIGATION TITLE OR NUMBER: ______________________________________________<br />
STUDY #:___________________<br />
Year &<br />
Treatment<br />
#<br />
e.g., feed composition,<br />
frequency, amount<br />
Management<br />
Treatment<br />
e.g., soils, vegetation e.g.,<br />
fingerling<br />
growth rate<br />
Facilities/Equipment<br />
Outcome<br />
Target<br />
(indicate<br />
unit)<br />
e.g. from literature review, professional<br />
experience<br />
121<br />
TECHNICAL REPORTS: INVESTIGATIONS 2009–2011<br />
from controlled trials<br />
Prior Probability Distribution Experimental Results<br />
Outcome Level<br />
High _________________<br />
Medium ______________<br />
Low _________________<br />
Probability<br />
of<br />
Occurrence<br />
(%)<br />
_________<br />
_________<br />
_________<br />
100%<br />
High ____________________ _________<br />
Medium _________________ _________<br />
Low ____________________ _________<br />
100%<br />
Mean<br />
(indicate<br />
unit)<br />
_________<br />
Standard<br />
Deviation<br />
_________<br />
_________ _________<br />
Notes<br />
(include sample<br />
size)
TECHNICAL REPORTS: INVESTIGATIONS 2009–2011<br />
Appendix B. Outputs Questionnaire for Survey Studies<br />
<strong>CRSP</strong> PHASE: [ ] 2007-09 [ ] 2009-11<br />
INVESTIGATION TITLE OR NUMBER: ______________________________________________<br />
STUDY #:___________________<br />
Year &<br />
Dimension<br />
#<br />
e.g. demand seasonality, estuary quality,<br />
fish population<br />
Dimension of Problem Examined<br />
e.g., from survey pre-test or rapid reconnaissance<br />
122<br />
formal survey statistics<br />
Prior Probability Distribution Survey Results<br />
Dimension Level<br />
(indicate unit)<br />
High __________________<br />
Medium _______________<br />
Low __________________<br />
High __________________<br />
Medium _______________<br />
Low __________________<br />
High __________________<br />
Medium _______________<br />
Low __________________<br />
Probability of<br />
Occurrence<br />
(%)<br />
_________<br />
_________<br />
_________<br />
_________<br />
_________<br />
_________<br />
_________<br />
_________<br />
_________<br />
Mean<br />
(indicate<br />
unit)<br />
_________<br />
_________<br />
_________<br />
Standard<br />
Deviation<br />
_________<br />
_________<br />
_________<br />
Notes<br />
(include sample<br />
size)
Please first complete the following information:<br />
Personnel information<br />
Appendix C. Inputs Questionnaire<br />
Name Rank Age<br />
123<br />
Highest<br />
Degree<br />
Controlled experiment<br />
Statistical survey<br />
Outreach or training<br />
A second way to characterize an investigation is by its geographical situation:<br />
FTE per year<br />
devoted to this<br />
investigation<br />
Other<br />
Information<br />
On the premises of a university or research station (so there is no need for the investigators to<br />
travel away from their place of work).<br />
At a single site located some distance away from the university or research station (for example,<br />
at a farm or very closely situated group of farms).<br />
At a collection of sites located some distance away from the university or research station (for<br />
example, fish processors interviewed at a variety of sites across the country).<br />
Please check which of the above three categories best describes the present investigation. (You may<br />
choose more than one type, for example if your work is substantially conducted both at the university and<br />
away from it.)<br />
Geographical situation:
TECHNICAL REPORTS: INVESTIGATIONS 2009–2011<br />
On the premises of your university or research station<br />
At a single site some distance from university or research station<br />
At multiple sites some distance from university or research station.<br />
Single Off-Station Site:<br />
If you checked box #2 on page 4, please answer the following:<br />
1. Distance of the single off-station site from your research station:<br />
_____________________________________________________________________________<br />
2. Transportation method to the site:<br />
Walking Bicycle Auto Bus Other _____________<br />
3. Road conditions to the site:<br />
Paved Gravel Dirt Other_________<br />
4. Do you have access to a mobile phone at the site? Yes No<br />
Explain:<br />
________________________________________________________________________________<br />
Multiple off-station sites:<br />
If you instead checked box #3 on page 4, please answer the following:<br />
1. What kinds of multiple research sites are you referring to? (E.g., fish exporters’ offices or fish farms involved<br />
in research or visited as part of workshop)<br />
_______________________________________________________________________________<br />
2. Number of off-station research locations: __________________________________________<br />
3. Total mileage required for you to visit all these off-station locations (if you take the most efficient route to<br />
visit all of them): _______________________________________<br />
4. Transportation method to these multiple sites:<br />
Walking Bicycle Auto Bus Other _____________<br />
5. Road conditions to the average site:<br />
Paved Gravel Dirt Other____________<br />
124
6. Do you have access to a mobile phone at these sites? Yes No<br />
Explain:<br />
125<br />
TECHNICAL REPORTS: INVESTIGATIONS 2009–2011<br />
A third way to characterize an investigation by the non-<strong>AquaFish</strong> collaborator(s) with whom you worked or are<br />
working:<br />
Without collaborators: Your work is conducted only with <strong>AquaFish</strong> <strong>CRSP</strong> personnel<br />
(including paid laborers)<br />
With collaborators: Your work is conducted in collaboration with other people (for example,<br />
farmers, exports brokers, fish processors)<br />
Please check one of the following:<br />
Use of collaborators:<br />
Without collaborator(s)<br />
With collaborator(s)<br />
If your investigation is conducted with collaborators (that is, if you checked box 2 on page 7):<br />
1. Brief description of work the collaborator(s) perform or performed<br />
________________________________________________<br />
2. Number of collaborators: ________________<br />
3.Collaborators’ average educational level:<br />
__________________________________________________________________________________<br />
4.Average number of hours per month the collaborator(s) worked with the investigation:<br />
______________________________________________________________________________<br />
Other conditions affecting you ability to carry out your investigation:<br />
Please describe any other factors affecting the cost of your research (e.g., rural infrastructure)
TECHNICAL REPORTS: INVESTIGATIONS 2009–2011<br />
Principal Investigator:<br />
Appendix D. Case Studies<br />
Alternative Feeds for Freshwater Aquaculture Species<br />
Case Study of <strong>AquaFish</strong> Investigation 09SFT01UC<br />
Jangho Choi, Lin Qin, and Steven Buccola<br />
Tran Thi Thanh Hien, Vice-Dean, College of Aquaculture and Fisheries, Cantho <strong>University</strong>, Vietnam.<br />
Introduction<br />
Vietnam has experienced rapid growth in aquaculture and Cambodia has the potential to do the same.<br />
Feeding cost consumes about 70% of snakehead culture cost. Many small farmers continue to draw their<br />
feeds from “trash fish” caught in fresh or marine water fisheries, while larger farms use pelleted feed from<br />
commercial feed mills. On-farm feed formulation have not been widely used in Vietnamese or<br />
Cambodian aquacultural systems.<br />
The present investigation examined the possibilities of alternative feeds for snakehead production in<br />
Vietnam, using locally available plant materials to build a long-term sustainable aquaculture system.<br />
<strong>AquaFish</strong> researchers and scientists from the <strong>University</strong> of Rhode Island and Cantho <strong>University</strong> worked<br />
together to carry out a series of formulated-feed experiments and on-farm snakehead culture trials. The<br />
study included an economic analysis of fish-meal costs, a productivity comparisons of plant-based<br />
proteins and trash fish, and an analysis of the risks of an unavailability of trash fish in the decades ahead.<br />
<strong>Link</strong>s to Earlier Research<br />
This investigation was the second phase of a study began in 2007. During the study’s 2007 – 2009 phase,<br />
the team had determined the species composition, size, and chemical composition of the main freshwater<br />
trash (“low-value”) fish species used as feed in finfish aquaculture in Vietnam’s Mekong Delta. They<br />
also had developed weaning methods allowing small, hatchery-reared snakehead to become quickly<br />
adapted to pelleted diets. They had, for example, assessed Channa striata snakehead survival and growth<br />
prospects in the presence of selected diet types. They showed that a feed consisting of fish, soybean, and<br />
cassava meal – which can be cheaply and locally produced and formulated – can replace up to 30% of the<br />
more expensive rice-bran content with no decline in snakehead survival or growth.<br />
Experimental Design<br />
Formulated-feed experiments were conducted in the wet laboratory and hapas at the College of<br />
Aquaculture and Fisheries of Cantho <strong>University</strong>, and on-farm trials carried out in An Giang and Dong<br />
Thap Provinces. Research consisted of eight interlocking studies, each with multiple experiments.<br />
Study 1 evaluated the chemical composition of marine and fresh-water trash fish to determine their<br />
relative values as a snakehead feed ingredient. Samples were collected from three different sites and<br />
analysis conducted of their chemical composition (protein, lipid, moisture and mineral) and TVB-N<br />
(Total Volatile Base Nitrogen).<br />
Study 2 was comprised of pilot trials for weaning snakehead larvae onto formulated feeds. It consisted of<br />
trials for snakehead (Channa micropeltes) larvae, snakehead (Channa striata) larvae on farms; and giant<br />
snakehead (Channa micropeltes) fingerlings. The experiment considered larvae ten days after hatch,<br />
126
127<br />
TECHNICAL REPORTS: INVESTIGATIONS 2009–2011<br />
carrying out with nine treatments with three replicates per treatment. Trash-fish feed was replaced by<br />
experimental feed at 20, 30 or 40 days after hatch – at rates of 10% per day, 10% every two days, or 10%<br />
every three days – until larvae were receiving 100% of the experimental feed per day. Fish then were<br />
counted and final body weight and wet-weight gain determined. Based on these data, survival rate, daily<br />
weight gain, feed intake, feed conversion ratio, protein efficiency ratio, and economic conversion ratio<br />
were calculated. The mortality rate (number of actual mortalities removed from experiment) and<br />
cannibalism rate (initial number of fish stocked minus number of mortalities removed less survivors) were<br />
analyzed as well.<br />
Study 3 compared Channa striata growth when fed a formulated rather than trash-fish feed. In pond #1,<br />
snakehead fingerlings (12-13g/fish) in three 5x10 meter hapas were fed marine trash fish for six months.<br />
In pond #2, snakehead fingerlings (12-13g/fish) in the three 3 hapas were provided a formulated feed<br />
consisting of such ingredients such as Kien Giang fish meal, defatted soybean meal, cassava meal, and<br />
dried rice-bran. All diets were made in an extruding-pellet mill at Cantho <strong>University</strong>. Trash fish was<br />
marine trash fish bought from markets and was chopped up before feeding. At the end of the experiment,<br />
the team conducted a sensory comparison of the fillet quality of the experimental and wild fish, and an<br />
analysis of the feeds’ chemical compositions.<br />
Study 4 applied the Study 3 methods to Channa micropeltes rather than Channa striata. Six hapas<br />
(50m 2 /hapa) were placed in one pond (700 m 2 ) with a stocking density of 100 fingerlings/m 2 . Giant<br />
snakehead fingerlings (12 - 13g/fish) in three hapas (5x10 m in size) were fed marine trash fish for 5<br />
months, and fingerlings (12-13g/fish) in the other three hapas (5x10 m in size) fed a formulated feed.<br />
Study 5 replaced the traditional marine trash-fish diet – then a freshwater trash-fish diet – with rice bran<br />
and with rice bran mixed with cassava meal. In each of these settings eleven separate diet treatments<br />
were used, including a formulated pellet determined during the 2007 – 2009 phase of this investigation,<br />
and others feeds involving combinations of marine and freshwater trash-fish, rice, and cassava meal.<br />
Three replicates were employed in each treatment.<br />
In Study 6 the research team moved to on-farm trials, in which fingerlings were fed floating commercial<br />
pellets. Pellets in the 1 st , 2 nd , and 3 rd months contained 44% crude protein (CP), and only 40% CP<br />
afterward.<br />
In Study 7, 29 farmers were interviewed in An Giang and 12 in Dong Thap about their fish-culture and<br />
fish-health management practices, about disease outbreaks in their ponds, and about profitability. Related<br />
secondary aquacultural information also was collected from newspapers, magazines, and websites.<br />
Significant Outcomes<br />
The laboratory experiments and on-farm trials confirmed that formulated feeds provide An Giang<br />
snakehead farmers significantly higher profit than do trash-fish feeds. Pellets formulated with local ricebran,<br />
cassava, and freshwater trash-fish produce given weight gains in a less costly way than marine<br />
trash-fish does. Feed conversion ratios and returns on equity therefore are higher.<br />
Specifically, snakehead fingerlings can be weaned at the rate of 10% per day from a trash-fish to<br />
formulated-feed diet. Neither growth nor survival rate significantly changed from 100% trash-fish use.<br />
Among giant snakehead, trash-fish-based fingerling feeds did bring significantly higher daily weight gain<br />
than did formulated feeds. However, they brought no significant advantage in survival rate. Quality<br />
analysis showed that on day of capture, trash fish from fresh water satisfied a higher freshness standard<br />
than did trash fish from marine sources. And freshwater trash fish provided more effective feeds for<br />
Channa striata than did those from marine waters.
TECHNICAL REPORTS: INVESTIGATIONS 2009–2011<br />
Principal Investigator:<br />
Improved Cages for Fish Culture in Deep-Water Lakes<br />
Case Study of <strong>AquaFish</strong> Investigation 09WIZ03UM<br />
Lin Qin, Jangho Choi, and Steven Buccola<br />
Liping Liu, Associate Professor, College of Fisheries and Life Science, Shanghai Ocean <strong>University</strong>,<br />
Shanghai, China<br />
Introduction<br />
Cage culture is often used in Asia’s lakes, reservoirs, and slower-flowing rivers to improve both fish<br />
production and water quality, allowing a more intensive feeding strategy and greater carrying capacity.<br />
However, it also can be environmentally problematic because cages allow solid and liquid wastes to<br />
disperse into the receiving waters, leading to eutrophication, pollution, and habitat degradation.<br />
VII.<br />
The purpose of the present investigation was to compare the fish production, water quality, and carrying<br />
capacity performance of a traditional and an ecologically improved freshwater aquaculture cage.<br />
Specifically, the investigation assessed the impacts of the improved cages designed to reduce waste<br />
loadings into Longtan Reservoir in southern Guizhou Province. The improved cage in the present study<br />
was designed by the Tongwei Group of China (Figure 1). It consists of a collecting cone and tube built at<br />
the cage bottom to collect solid and liquid waste, plus a surrounding cage (or outer cage) to retain<br />
nutrients for growing additional fish species. <strong>AquaFish</strong> <strong>CRSP</strong> researchers and scientists from Shanghai<br />
Ocean <strong>University</strong>, Huazhong Agricultural <strong>University</strong>, and <strong>University</strong> of Michigan worked together to test<br />
whether the improved cage has significant advantages over the traditional one.<br />
VIII.<br />
<strong>Link</strong>s to Earlier Research<br />
IX.<br />
During the <strong>AquaFish</strong> <strong>CRSP</strong>’s 2007-2009 phase, this same team had assessed (07MNE04UM) the<br />
effectiveness of waste management practices for intensive freshwater and marine pond aquaculture in<br />
China. In particular, they had evaluated alternative management strategies employed by small-scale<br />
farmers in Hubei and Hainan provinces to reduce effluent and solid waste pollution in intensive carp,<br />
tilapia, and shrimp pond culture. They identified, in that process, several important management<br />
improvements but had excluded deep-water cage-culture methods. Both investigations have pointed to<br />
ways of boosting fish production and reducing aquatic pollution, but with the use of different methods.<br />
128
129<br />
TECHNICAL REPORTS: INVESTIGATIONS 2009–2011<br />
Figure 1. Diagram of the Tongwei ecological cages with sediment collection from the bottom and a<br />
surrounding cage for nutrient retention.<br />
Experimental Design<br />
The experiment began in May 2010. Ten cages were used in the experiment, including three modified-a<br />
cages containing an outer cage and no sediment trap, three modified-b cages containing both the outer<br />
cage and sediment trap, three traditional cages, and one control cage. Modified cages were 12x12 m in<br />
surface area and 6m deep, not including the sediment collector below. Traditional cages were 5x5 m in<br />
surface area and 5 m deep, and the control cage 3x3 m in surface area and 3 m deep. Reservoir water was<br />
used for hydropower and thus had a measureable flow.
TECHNICAL REPORTS: INVESTIGATIONS 2009–2011<br />
Fish stocking density was 160 Channel catfish per square meter, or a total of 16,000 fish per cage in the<br />
modified cages, while there were 4,000 catfish in traditional cages. In the ecological cage’s main-culture<br />
or inner apparatus, the stocking rate was similar. In its surrounding apparatus, it was combined with<br />
seven bighead carp (500g each), three silver carp (200g), and six tench (50g) per square meter.<br />
Growout duration was one year. Feeding treatments differed between the inner and surrounding cages.<br />
Fish in traditional cages and the inner apparatus of the ecological cages were fed with pellet feeds at<br />
manufacturer-commended levels, while no feed or other materials were provided to the outer cages.<br />
Water quality was monitored through certain routine measurements and other, less frequent ones. The<br />
former, performed weekly, included water DO, Ph, conductivity, and temperature, drawn from a data<br />
sonde. These measures were taken both inside the cages and in the exterior water. Measures in the cages<br />
were drawn in three locations: at the first cage in the upstream group, at the center of the cage cluster, and<br />
at the last cage in the downstream group.<br />
The more detailed measurements were made one month, six months, and twelve months after stocking.<br />
They included total phosphorus, total nitrogen, NO3, NO2, TAN (total ammonia nitrogen), TVS (total<br />
volatile solids), TSS (total suspended solids), and phytoplankton and zooplankton samples. Fish size and<br />
sedimentation rate were also measured monthly.<br />
The <strong>AquaFish</strong> researchers expected the ecological cage-culture system to boost fish production, improve<br />
the nutrient dynamics, and reduce the pollution burden considerably in these deep waters. This<br />
expectation was tested by comparing data from four cage-culture systems using standard Analysis of<br />
Variance.<br />
Unexpected Difficulties<br />
The <strong>AquaFish</strong> researchers encountered several unexpected difficulties in the process of this investigation.<br />
The first came when the automatic equipment for feces collection in the ecological cage culture system<br />
became unstable during the experiment. Instead of using the automatic equipment for feces collection,<br />
they had to collect it by hand. The other arose from the difficulty of using fishing nets to sample the<br />
Channel catfish in the inner cages. The Channel catfish fins were very strong, easily destroying the<br />
fishing net. It was found much easier to draw the samples by traditional fishing methods.<br />
In addition, fish in outer cages retained less than 1% of total phosphorus input from cages. This retention<br />
was not enough to influence nutrient concentrations between different cage types, and raised questions<br />
about the availability to filter-feeding fish of waste nutrients from intensively fed cages.<br />
The last but not least important difficulty was that constraints in sampling ability limited the conclusions<br />
that could be drawn from the results. The remote location of the facility made sampling infrequent. And<br />
the experiment took place at a commercial facility, so how the proximity of the experiment to other cages<br />
may have confounded the results was unknown.<br />
Communication<br />
In addition to the collaboration among the three universities, Tongwei Company’s specialists provided a<br />
substantial amount of advice on the use of the improved cages. This was a win-win situation for both<br />
sides because Tongwei benefitted from <strong>AquaFish</strong>’s rigorous comparison of the traditional and Tongwei-<br />
improved cage in fish production and water pollution. Tongwei also had received government funding in<br />
its cage design work.<br />
130
131<br />
TECHNICAL REPORTS: INVESTIGATIONS 2009–2011<br />
Because the study reservoir is a two-hour drive from the Huazhong Agricultural <strong>University</strong> campus that<br />
served as the study headquarters, local farmers were engaged to help feed the fish and collect the water<br />
samples. To better communicate with these farmers, a translator was engaged to speak the local language.<br />
Significant Outcome<br />
The most significant finding of this investigation was that fish production in cage-culture systems can be<br />
substantially improved by using feces collection equipment. In particular, catfish growth rates were lower<br />
in traditional than in modified cages (figure 2), giving lower production. Feed conversion ratios ranged<br />
from 1.37 to 2.61 but were not statistically differ among traditional and other treatments.<br />
Unexpectedly, water quality did not significantly differ between traditional or experimental cages. The<br />
traditional ones held a greater number of species than the improved cages did, and all cages held more<br />
species than did the reservoir samples. Biomass of phytoplankton was fairly similar across cage types.<br />
Economic return appeared to be greatest when culturing bighead carp and tilapia in the surrounding<br />
apparatus. The net income ratio of modified cages a and b were 74.3% and 73.8%, respectively. Cost of<br />
the waste collection device accounted for only 0.6% of the total cost. The revenue of channel catfish in<br />
modified cages a and b accounted for 96.8% and 96.4% of the total revenue, respectively. Thus, revenue<br />
from channel catfish contributed most to total revenue, while revenue from both types of modified cages<br />
was small.<br />
Future Study<br />
The team suggests examining the application of fish feces from the ecological cage culture system to<br />
vegetable production. In the outer cages, water quality might be further improved by culturing float grass<br />
or by using bio-membranes.<br />
Figure 2. Average weight of carp and tilapia in modified and control cages at stocking and at harvest.
TECHNICAL REPORTS: INVESTIGATIONS 2009–2011<br />
Principal Investigator:<br />
Pond Effluents and their Impacts on<br />
Receiving Waters in Ghana<br />
Case Study of <strong>AquaFish</strong> Investigation 07WIZ01PU<br />
Lin Qin, Jangho Choi, and Steven Buccola<br />
Emmanuel A. Frimpong, Research Scientist, Department of Fisheries and Wildlife Sciences, Virginia<br />
Polytechnic Institute & <strong>State</strong> <strong>University</strong>, Virginia, the United <strong>State</strong>s.<br />
Introduction<br />
Regulation of water pollution in West African fish farming is hampered by inadequate biological,<br />
chemical, and managerial data on pond effluents. In the absence of that information, regulatory agencies<br />
may either exaggerate or understate aquaculture’s pollutive effects, leading either to over-regulation and<br />
hence undue industry restrictions or to controls that inadequately protect the environment. There has, as a<br />
result, been increased demand for effective characterization of pond effluents and assessment of their<br />
effects on aquaculture’s receiving waters.<br />
The present study, conducted by Purdue <strong>University</strong> in collaboration with Virginia Tech and Kwame<br />
Nkrumah <strong>University</strong> of Science & Technology, sought to estimate the potential and actual impacts of<br />
pond effluents on receiving-stream quality in the Ashanti and Brong Ahafo regions of Ghana. The hope<br />
is eventually to extend the study to the entire Ghanaian aquatic ecosystem. The Ashanti and Brong Ahafo<br />
regions were chosen for their concentrated aquacultural activity, providing the variety of aquacultural<br />
system and receiving-water characteristics that would allow generalizations to the rest of Southern Ghana<br />
and similar systems in other sub-Saharan African countries.<br />
Study Strategy<br />
A combination of questionnaire survey, field sampling, and laboratory analyses of pond water, receiving<br />
and reference stream water, and fish and benthic macro-invertebrate sampling were used to generate the<br />
data. Six pond types were examined, and the water-quality impact of each pond type was analyzed.<br />
Ponds, receiving waters, and reference streams were first examined for macro-invertebrate and fish<br />
populations and for physicochemical and microbial content. Cluster analysis was used with the survey<br />
data to identify possible pond and effluent types. Relationships between management practices and<br />
downstream physicochemical and microbial levels were then assessed, and environmental bestmanagement<br />
practices drawn up and disseminated through a workshop.<br />
Unexpected Problems<br />
X.<br />
Two unexpected technical problems occurred during the study. The first was unpredictably high rainfall<br />
and flooding during the field sampling, requiring stream re-sampling at some stations. The second was<br />
that, because collaborators’ fish ponds were widely dispersed and drained at odd intervals, so researchers<br />
were unable to observe actual effluent contents. They had instead to resort to computing potential<br />
effluent by sampling at various depths of the ponds themselves rather than actual effluents at the outlets.<br />
XI.<br />
Beside these technical problems, three non-technical difficulties presented themselves as well.<br />
Bureaucratic procedures delayed funds for fieldwork, so field sampling schedule had to be reworked to<br />
132
133<br />
TECHNICAL REPORTS: INVESTIGATIONS 2009–2011<br />
begin with tasks not requiring immediate cash expenditure. Meanwhile, the bureaucratic process delayed<br />
laboratory services for water sampling at the collaborating university. And state agencies were unable to<br />
provide digitized geographical information about the study area, so that private arrangements had to be<br />
arranged later for it.<br />
Communication<br />
Earthen pond fish farmers, offering their farms and streams for sampling, were the main collaborators in<br />
this study. Regional heads of the Ghana Fisheries Commission, and the Ashanti Regional Director of the<br />
Ghana Statistical Service, helped throughout the study. Regional fisheries directors provided lists of fish<br />
farmers, and introduced them to the <strong>AquaFish</strong> researchers. Ghana Statistical Services provided<br />
socioeconomic information about study regions.<br />
The fish farmers themselves appeared to be more interested than anyone else in the pond effluent<br />
examination. Not only do they want to understand why the mortality rates have been high in some of<br />
their ponds while the fish in other ponds flourished, but also they hope the water-quality measures the<br />
study will identify will help them avoid stringent state regulation. Fisheries Commission directors or<br />
their representatives used the opportunity of the study to visit the collaborating pond farms in their<br />
regions, although official and extension visits were constrained due to transportation and other problems.<br />
A random sub-sample of at least five farms was selected from each stratum in the two regions. The<br />
investigators obtained the cooperation of local fish farmers by explaining research objectives and<br />
strategies to them in advance of the study.<br />
Significant Outcomes<br />
From the survey and statistical analysis, researchers concluded there was no evidence that fish farming<br />
was creating any significant water quality degradation in receiving streams, or any adverse effect on fish<br />
and benthic macro-invertebrates. This is remarkable because water qualities in Ashanti and Brong Ahafo<br />
ponds are generally quite different from those in receiving streams, which usually contain more natural<br />
nutrients, solids, and organic waste-water content than ponds do.<br />
Despite this good news, the pollution situation in the Ghanaian fish-farm industry could worsen as the<br />
industry intensifies. The key question will be how effluents are managed, including the frequency and<br />
volume of pond-water releases and under what conditions effluents are handled before reaching the<br />
receiving waters.<br />
This study of Ghanaian fish-farm effluent has provided government regulators with baseline information<br />
about pond aquaculture in Ghana. More importantly, however, it has provided Best Management<br />
Practices (BMPs) recommendations for fish farmers. The majority of Ghanaian fish farms actually have<br />
environmental BMPs already in place. They include water reuse mechanisms, vegetated ditches or<br />
canals, settling basins, drainage into natural wetlands, and top-release of pond water. Continuing to<br />
implement such broadly focused environmental BMPs my reduce the need for aquacultural effluent<br />
regulations in Ghana for the foreseeable future.<br />
<strong>AquaFish</strong> scientists say a better understanding of the economic, social, and environmental impacts of<br />
adopting BMP or other practices on Ghanaian fish farms could be achieved through a systematic<br />
classification of fish farming areas, including a comprehensive spatial database and a characterization of<br />
fish pond effluent systems.
TECHNICAL REPORTS: INVESTIGATIONS 2009–2011<br />
Principal Investigator:<br />
Development of Snook Seed Production Technology in Mexico<br />
Case Study of <strong>AquaFish</strong> Investigation 07IND01UA and 09IND05UA<br />
Jangho Choi, Lin Qin, and Steven Buccola<br />
Wilfrido M. Contreras-Sánchez, Professor, Laboratorio de Acuicultura Tropical,<br />
División Académica de Ciencias Biológicas Universidad Juárez Autónoma de Tabasco, Villahermosa,<br />
Tabasco, México<br />
Introduction<br />
Snook fish stocks have gradually declined in southeastern Mexico on account of the fish’s great market<br />
popularity. As Mexican incomes rise, snook consumption rises also, depleting stocks in many areas.<br />
Alternatives – especially through artificial reproduction – to capturing wild snook therefore are being<br />
sought, not only for meeting market requirements but for protecting wild fisheries. Researchers from the<br />
<strong>University</strong> of Arizona and Universidad Juárez Autónoma de Tabasco have conducted a series of<br />
experiments to deal with the problems encountered when snook breeders are held in captivity.<br />
In the first of the investigations (07IND01UA), the team developed techniques for snook seed production,<br />
including injecting or implanting wild broodstock with alternative concentrations of GnRHa (a hormone<br />
analogue that intervenes in the reproductive system). The team held an international workshop on snook<br />
biology and culture in July 2009.<br />
In the second investigation (09IND05UA), they tested the possibility of artificial reproduction in<br />
Common, Fat, and Mexican Snook. They also looked at broodstock feeding programs, in particular the<br />
expression of and digestive-enzyme genes in snook broodfish.<br />
XII.<br />
Experimental design<br />
XIII.<br />
Major snook species are the Common Snook (Centropomus undecimalis) and Fat Snook (Centropomus<br />
parallelus). Fat Snook wild broodstock samples were collected during spawning season in coastal areas<br />
near the experiment facility, which had been established in earlier collaborations with USAID (<strong>CRSP</strong>-<br />
UJAT-Cooperativa Pesquera San Ramόn). Samples were obtained from the induced spawning of<br />
broodstock held in captivity since 2008.<br />
In experiment #1 of investigation 07IND01UA, 36 breeders (12 females and 24 males) were selected for<br />
experiments, one female and two males in each experiment. Recently-caught wild broodstock were<br />
employed in Fat Snook experiments, while one- to two-year-old captured and cultured broodstock were<br />
used in the Common Snook experiments. Treatments were either by injection or pellet at various GnRHa<br />
concentrations. Three hypotheses (Ho) about the techniques for good-quality snook egg production were<br />
tested:<br />
134
135<br />
TECHNICAL REPORTS: INVESTIGATIONS 2009–2011<br />
Table 1. Three experiments conducted to examine techniques for producing good-quality snook eggs.<br />
Experiment Species Treatments<br />
Experiment 1 Ho: Injections of GnRHa will produce good-quality eggs<br />
Ex 1a<br />
Ex 1b<br />
Wild Fat<br />
Snook<br />
Common<br />
Snook<br />
Females were injected with saline solution, 75 or 150 μg<br />
GnRHa/kg. All males were injected with 50 μg GnRHa/kg<br />
Not conducted (no wild fish)<br />
Experiment 2 Ho: Implants of GnRHa will produce good-quality eggs<br />
Ex 2a Fat Snook<br />
Ex 2b-i<br />
Experiment 3<br />
Common<br />
Snook<br />
Females were implanted with pelleted vehicle (no GnRHa),<br />
100 or 200 μg GnRHa/fish. All males were implanted with<br />
100 μg GnRHa pellets<br />
Same as Ex 2a<br />
Ho: Initial stocking rates of snook larvae will not affect their growth or<br />
ability to wean from live zooplankton to prepared diets<br />
Ex 3a Fat Snook Five liter culture tank<br />
Ex 3b Fat Snook Ten liter culture tank<br />
In experiments #2 and #3, treatment effectiveness was determined by the presence or absence of<br />
spawning and by egg quality level. The number of eggs produced was estimated by taking three 50 ml<br />
samples from the egg collector and counting eggs with a Petri dish. Using a dissecting microscope,<br />
fertilization was recorded after 30 minutes by blastemic observation of 100 eggs. For hatching<br />
estimation, viable eggs were incubated in a 300 L tank, using sea water similar to that employed in the<br />
spawning tanks. After 48 h of incubation, three 50 mL samples were taken from each incubation tank for<br />
larval-counting under microscope. Larval survival was determined by the same method. Egg number,<br />
egg diameter, larvae total length, fertilization rates, hatching, and survival-to-first-feeding were recorded<br />
and examined statistically in each treatment. Two batches of Fat Snook larvae were obtained by GnRHa<br />
pellet induction. Initial snook-larvae stocking densities were 20, 40, 60, 80, and 100 larvae/L and each<br />
treatment was replicated three times.<br />
From July 8 to July 15, 2009, the <strong>AquaFish</strong> team conducted an international workshop at Divisiόn<br />
Académica de Ciencias Biológicas, UJAT. The workshop theme was larval culture and grow-out of Fat<br />
Snook juveniles, and histological determination of gonadal development on Teleost fish. About 185<br />
participants attended the workshop.<br />
During the investigation’s 2009 – 2011 phase, the team continued drawing broodstock samples and<br />
testing alternative technologies for good- quality snook seed production. They first identified the<br />
digestive enzyme gene expression in Common and Fat Snook at various stages in their life cycle. Snook<br />
larvae and juveniles with at least 150 mg of stomach, intestine, and pancreatic tissue were collected, and<br />
samples drawn for RNA extraction and other tests.<br />
Unexpected Difficulties
TECHNICAL REPORTS: INVESTIGATIONS 2009–2011<br />
Unfortunately, the team managed to catch no wild snook with satisfactory broodstock quality in 2009.<br />
For want of broodstock, some experiment plans had to be changed. In particular, Experiment #1b was<br />
never conducted; only one female was used per treatment in experiment #2b; and only the captured<br />
female was implanted in experiment #2b-i.<br />
Because only Fat Snook larvae were obtained from these experiments, no Common Snook larvae could be<br />
produced. Although additional experiments were conducted at the Universidad Nacional Autonoma de<br />
Mexico to acquire Common Snook larvae, insufficient larvae were obtained to run trials on the density of<br />
GnRHa pellet induction. Thus, only Fat Snook could be used in the experiment #3 density trials.<br />
Furthermore, all Fat Snook larvae had died by the 8 th day of the experiment, so that experiment #3<br />
conclusions about the effects of initial larvae stocking rates could be obtained only for the first eight days<br />
of feeding. On account also of the paucity of female samples, possibilities for statistical inference were<br />
weak.<br />
Significant Outcomes<br />
The <strong>AquaFish</strong> team concluded in investigation 07IND01UA that both injections and implants were<br />
effective in inducing Fat Snook spawning, finding no significant differences between these methods in the<br />
numbers of eggs produced, in fertilization, or in hatching rates.<br />
XIV.<br />
In investigation 09IND05UA, they determined the possibility of Common and Mexican Snook spawn and<br />
larvae production by GnRHa-induced reproduction. Snook populations thus can be maintained through<br />
hormonal stimulus, and improved feeding and handling strategies can maintain broodstock for lengthy<br />
periods. However, effective GnRHa dose varies by broodstock weight.<br />
XV.<br />
Although inadequate size of the sample broodstock prevented statistical tests, this <strong>AquaFish</strong> study has<br />
showed snook broodstock can readily be adapted to captivity conditions, where only hormone-treated<br />
females can spawn. Higher-dose. Fertilization percentage was 100%, higher-dose females produced<br />
more eggs, and hatching rate was 68%.<br />
136
137<br />
TECHNICAL REPORTS: INVESTIGATIONS 2009–2011<br />
Co-Management and Bivalve Sanitation for Black Cockles in Nicaragua<br />
Case Study of <strong>AquaFish</strong> Investigation 09HHI04UH<br />
Lin Qin, Jangho Choi, and Steven Buccola<br />
Principal Investigator:<br />
Erick José Sandoval Palacios, Assistant Professor, Central American <strong>University</strong>, Managua, Nicaragua.<br />
Introduction<br />
Black Cockles are – along most of the Pacific coast of Latin America – an important fisheries resource<br />
and emergency food, especially among women, children, and the poor. Unfortunately, on account of<br />
imprudent management, this resource is faced nearly with extinction. Governments in some countries in<br />
turn have introduced yearly bans on their exploitation, threatening local fishers’ incomes. Because most<br />
black cockles are collected from the contaminated estuary areas and eaten raw, the bivalve sanitation also<br />
has become an urgent issue for aquacultural researchers and scientists.<br />
The present study was part of <strong>AquaFish</strong> <strong>CRSP</strong>’s efforts in Human Health and Aquaculture, focusing on<br />
aquacultural sanitation and best-management practices. As a continuation of an earlier (2007 – 2009)<br />
study, it sought to examine how voluntary community ("co-management") programs might be used to<br />
effectively stabilize cockle populations and improve cockle quality in heavily harvested areas. Cockle<br />
areas designated as “no-take” were compared with others in terms of cockle numbers, size, and tissue<br />
quality in the Aserradores Estuary.<br />
<strong>Link</strong>s to Earlier Research<br />
Prior to the study, community co-management already had successfully improved average cockle sizes in<br />
no-take zones of the Aserradores Estuary, which were heavily exploited. The community voluntarily<br />
selected the zones, which could be successively expanded if found effective. As scientists began pointing<br />
to co- management's successes, the Ministry of Natural Resources (MARENA) considered giving it<br />
official sanction. But before it could be extended to other communities, long-term evidence would have<br />
to be provided of its positive effects on cockle volumes and safety.<br />
The Center for Development and Research of Aquatic Resources (CIDEA) at Central American<br />
<strong>University</strong> (UCA), and its partners at the <strong>University</strong> of Hawaii - Hilo, had for the past decade studied<br />
black-cockle culture, management, and sanitation methods on the Nicaraguan Pacific Coast. Their<br />
purpose was to test community-based co-management programs as an alternative to the inefficient, yearby-year<br />
April-July collection bans, which had little scientific validity and place local fishers into conflict<br />
with government regulators. The <strong>AquaFish</strong> investigation was intended to supplement these efforts by<br />
examining the extent of the black-cockle population, size, and sanitations problem and what can be done<br />
to improve it.<br />
Research Design<br />
Beginning in January 2010, cockle populations were drawn every six months at each of twelve sampling<br />
stations, including three no-take zones, three sites 100 meters from those zones, and six sites far away<br />
from the no-take zones. No-take zones were selected by community leaders, marked with signals along<br />
the perimeters, and altered every six months. Local Fishers were employed as samplers, trained in<br />
sampling methods, and regularly visited by <strong>AquaFish</strong> staff during the sampling process. The samples<br />
were used in one-way analysis of variance (ANOVA) to test whether the cockle population differed<br />
significantly between the no-take zones and those at some distance from them.
TECHNICAL REPORTS: INVESTIGATIONS 2009–2011<br />
In the meantime, CIDEA facilitated community meetings in the study area to discuss management-related<br />
issues and resolve possible conflicts over collection rights. They also worked with communities in other<br />
areas, sharing the study results and investigating the possibility of similar co-management efforts there.<br />
They shared study information with the authorities as well, since any official recognition of these<br />
community-based management practices will require government familiarity and involvement. At the<br />
close of the <strong>AquaFish</strong> study, CIDEA will continue working on bivalve sanitation and depuration under a<br />
new two-year grant from European Union.<br />
Unexpected Difficulties<br />
Problems arose over the energy system used in the cockle purification process. Earlier <strong>AquaFish</strong> mollusk<br />
purification research had shown that traditional depuration systems are not feasible. CIDEA thus<br />
cooperated with the Central American Energy Alliance in a project involving the use of photovoltaic solar<br />
power to supply the energy and ultraviolet radiation to treat the black-cockle bivalves. This updated<br />
system of solar panels and water sterilization equipment worked effectively in the purification process.<br />
Researcher communication with local shell fishers was complicated by the fact that a substantial number<br />
of women fishers in the study area cannot read or write. During the training process, the problem was<br />
addressed by using methods such as skits to illustrate cockle sampling techniques.<br />
Collaboration<br />
An important goal of this study was to help the approximately 2,600 people in the Aserradores Estuary<br />
who suffered economic hardship during the four months in which cockle collection is seasonally banned.<br />
The <strong>AquaFish</strong> scientists sought to demonstrate that cockle resources can be more effectively protected,<br />
and without prejudice to those relying on these resource for a living – especially women, children, and<br />
poor fishers. To this end, <strong>AquaFish</strong> collaborated with a number of local institutions, including (a)<br />
contacts with government fisheries-development such as the Nicaraguan Environment Department<br />
(MARENA); (b) meetings with local authorities such as municipal governments in the Aserradores<br />
Estuary; and (c) cooperation agreements between the Nicaraguan Fishery and Aquaculture Department<br />
and NGOs sponsoring outreach events.<br />
The <strong>AquaFish</strong> investigation also was supported by the European Union’s initiative on the product valueadd<br />
processes. The alliance for energy and environment partnership played an indispensible role in the<br />
implementation of cockle sampling and sanitation. For example, the Central American Energy Alliance<br />
helped install a depuration plant and Nicaraguan Agricultural and Forestry Department (MAGFOR)<br />
provided the shellfish certifications.<br />
Significant Outcomes<br />
The study showed that fishers with low education and income are able to make sustainable use of<br />
resources for their livelihood, based on verbal communal agreements that are unsigned and unmonitored<br />
from outside the community. As a byproduct of the <strong>AquaFish</strong> work, researchers have developed deeper<br />
connections with shell-fish institutions throughout Nicaragua, such as in collaboration in the National<br />
Strategic Plan for shell-fish development.<br />
Future Study<br />
The researchers say more work now needs to be conducted on pesticide residues in Anadara mollusk<br />
tissues and on identifying pollution sources in estuarine areas. Better knowledge is needed of basic<br />
cockle biology such as its growth, sexual maturity, and spawning. Beyond that, fishers need more<br />
training in credit access, in marketing and project management, and in environmental awareness<br />
programs.<br />
138
Principal Investigator:<br />
139<br />
TECHNICAL REPORTS: INVESTIGATIONS 2009–2011<br />
Feeding Strategies to Reduce Tilapia Production Costs in Philippines<br />
Case Study of <strong>AquaFish</strong> Investigation 09SFT04NC<br />
Jangho Choi, Lin Qin, and Steven Buccola<br />
Remedios Bolivar, Professor, Freshwater Aquaculture Center (FAC)/ College of Fisheries, Central Luzon<br />
<strong>State</strong> <strong>University</strong> (CLSU), Science City of Munoz, Nueva Ecija, Philippines.<br />
Introduction<br />
Aquaculture in the Philippines is a high food-security priority, particularly in light of the country’s<br />
rapidly growing population and continued dependence on fish protein. Feeds clearly are one of the most<br />
costly aspects of fish farming, representing as much as 60% to 80% of production cost of small-scale<br />
tilapia aquaculture. Feed waste and the escalating cost of fishmeal in commercial diets are the main<br />
problem on small fish farms, where feed sources are rapidly declining and feed demand remains high.<br />
<strong>AquaFish</strong> researchers and scientists from Central Luzon <strong>State</strong> <strong>University</strong> and North Carolina <strong>State</strong><br />
<strong>University</strong> collaborated in the present investigation to examine whether Nile tilapia feed costs can be<br />
contained by: (a) reducing the amount of feed below that used in satiation feeding; (b) reducing feed costs<br />
by reducing crude-protein, supplementing amino acids, and replacing expensive fish meal with lower-cost<br />
proteins; and (3) reducing feed manufacturing cost by pellet- rather than the more expensive extrusionprocessing.<br />
<strong>Link</strong>s to Earlier Research<br />
The team’s investigations 07SFT02NC and 07SFT03NC during the <strong>AquaFish</strong> 2007 - 2009 phase, in<br />
which they analyzed feed strategies for reducing tilapia and milkfish production costs, were closely<br />
related to the present one. In those studies, limiting nutrient loads from feed waste was found helpful for<br />
mitigating fish farming’s negative environmental effects.<br />
Experimental Design<br />
In the present 2009-2011 phase, four studies were implemented to examine the best way of reducing feed<br />
costs. In each, growth and feed-conversion rates in sex-reversed tilapia fingerlings were monitored and<br />
the economic feasibility of the experimental treatments evaluated. Per-pond feed use was recorded daily<br />
and water quality weekly. Differences in growth performance, survival rate, and feed consumption were<br />
assessed through analysis of variance (ANOVA), and feed costs per kilogram of body examined for<br />
profitability.<br />
Study 1 evaluated three feed reduction strategies. Treatment A -- 67% daily feeding until harvest;<br />
Treatment B -- 67% daily feeding for 60 days, followed by 50% daily feeding until harvest; and<br />
Treatment C -- 67% daily feeding for 60 days, followed by 100% alternate-day feeding until harvest.<br />
Each was replicated three times. After 120 days of culture, stocks were harvested and measured for bulk<br />
weight, survival rate, and extrapolated gross fish yield [total fish weight at harvest (kg) / pond area ( )].<br />
Study 2 tested the grow-out performances of alternative feed ingredients. A – High CP (31%) extruded<br />
feed with 6% dietary inclusion of fishmeal – a standard diet in the industry; B -- Low CP (26%) extruded
TECHNICAL REPORTS: INVESTIGATIONS 2009–2011<br />
feed with 6% dietary inclusion of fishmeal, supplemented with amino acids; C – High CP (31%) extruded<br />
feed without dietary inclusion of fishmeal; and D – Low CP (26%) extruded feed without dietary<br />
inclusion, supplemented with amino acids. Fifty fish samples were collected every two weeks. Individual<br />
weights and lengths of 100 fish was obtained at initial and final samplings.<br />
Study 3 evaluated alternative types of pellet binder and feed additives for durability and water stability.<br />
Finally, Study 4 examined sinking-pellet versus floating extruded feeds in tilapia grow-out in ponds. Four<br />
fishmeal-free diets were tested: A -- 31% CP floating extruded feed; B -- 31% CP slow-sinking pelleted<br />
feed + binders; C -- 26% CP floating extruded feed supplemented with amino acids; and D -- 26% CP<br />
slow-sinking pelleted feed supplemented amino acids plus binders. Fish samples were drawn every two<br />
weeks by cast net to obtain average weight of fish stocks. Individual weights and lengths of 100 fish were<br />
obtained at initial stocking and final sampling.<br />
Unexpected Difficulties<br />
Two unexpected difficulties were encountered in this work. First, delivery of Study #1’s formulated<br />
feeds from Santeh Feeds Corporation was delayed two weeks. The study’s original intention of examining<br />
high- and low-crude protein diets with and without pond fertilization thus had to be changed to examining<br />
combined feed-reduction strategies in fertilized ponds. The treatments had to be changed as well because<br />
of the unavailability of the planned feed formulations. In Study #4, delay of the formulated-feed delivery<br />
also required using the same feed regimen in every treatment for two weeks, extending the study’s<br />
completion date from September 8 to September 23, 2011.<br />
Outcomes<br />
In Study 1, feed-reduction strategies examined differed little in improving tilapia yields (Figure 1).<br />
Average Weight (g)<br />
200<br />
180<br />
160<br />
140<br />
120<br />
100<br />
80<br />
60<br />
40<br />
20<br />
0<br />
0 15 30 45 60 75 90 105 120<br />
Culture Days<br />
Figure 1. Average weight of Nile tilapia after 120 days of culture in ponds under combined feedreduction<br />
strategies.<br />
Study 2 showed that reducing fishmeal crude protein from the standard 31% CP to 26% CP can generate<br />
significant feed-cost savings with no appreciable consequence for Tilapia growth or yield (Figures 2, 3).<br />
140<br />
Treatment I<br />
Treatment II<br />
Treatment III
Average Weight (g)<br />
350<br />
300<br />
250<br />
200<br />
150<br />
100<br />
50<br />
0<br />
0 15 30 45 60 75 90 105 120<br />
141<br />
TECHNICAL REPORTS: INVESTIGATIONS 2009–2011<br />
Figure 2. Average weight of Nile tilapia grown in ponds and fed extruded grower test diets formulated<br />
with 31% crude protein (CP) or 26% CP supplemented with amino acids with 6% fishmeal and 0%<br />
fishmeal (fishmeal substituted with porkmeal).<br />
Degree Centigrade<br />
30.0<br />
28.0<br />
26.0<br />
24.0<br />
22.0<br />
20.0<br />
Culture Period (days)<br />
1 2 3 4 5 6 7 8 9 10 11 12 13 14 15 16<br />
Sampling No.<br />
Treatment 1<br />
Treatment 2<br />
Treatment 3<br />
Treatment 4<br />
Treatment 1<br />
Treatment 2<br />
Treatment 3<br />
Treatment 4<br />
Figure 3. Weekly pond temperatures of Nile tilapia fed extruded grower test diets formulated with 31%<br />
crude protein (CP) or 26% CP supplemented with amino acids with 6% fishmeal and 0% fishmeal<br />
(fishmeal substituted with porkmeal).<br />
Study 4 showed that a combination of urea-formaldehyde and gelatin is the most effective binder for<br />
maximizing the water stability of pelleted tilapia feed. It also showed that a pelleted fishmeal-free diet in<br />
slow-sinking form is more effective than in extruded form, cutting feed costs by 3% with negligible yield<br />
impact.
TECHNICAL REPORTS: INVESTIGATIONS 2009–2011<br />
Average Weight (g)<br />
280.0<br />
240.0<br />
200.0<br />
160.0<br />
120.0<br />
80.0<br />
40.0<br />
0.0<br />
Figure 4. Average weight of Nile tilapia grown in ponds and fed floating extruded or slow-sinking pellet,<br />
fishmeal-free grower test diets formulated with 31% crude protein (CP) or 26% CP supplemented with<br />
amino acids.<br />
Communication<br />
0 15 30 45 60 75 90 105 120 135<br />
This investigation was closely followed by local farmers, who had collaborated earlier with <strong>AquaFish</strong> and<br />
whose feed costs and profitability stood to be improved from the research. Collaborators provided the<br />
ponds while the research team provided the fish stock, feeds, and fertilizer, so no additional inputs were<br />
necessary. Local feed manufacturing and formulation were coordinated with Santeh Feeds Corporation in<br />
Luzon. Government officials, technical personnel at private firms, and academics were invited to the<br />
investigation’s workshops. Several firms were asked to assist with workshop funding.<br />
142<br />
Treatment I<br />
Treatment II<br />
Treatment III<br />
Treatment IV
Principal Investigator:<br />
Watershed, Water Quality, and Aquaculture<br />
in Small South-African Catchments<br />
Case Study of <strong>AquaFish</strong> Investigation 09WIZ01AU<br />
Jangho Choi, Lin Qin, and Steven Buccola<br />
Khalid Salie, Lecturer, <strong>University</strong> of Stellenbosch, Maitland, South Africa<br />
Introduction<br />
143<br />
TECHNICAL REPORTS: INVESTIGATIONS 2009–2011<br />
Small impoundments have been built in the region around Stellenbosch, South Africa to deal with the<br />
shortage of water supply to agriculture and aquaculture and to a community with growing human<br />
population. These small reservoirs provide local fish farmers with enough water to culture trout in cages.<br />
However, cage culture operations in these small reservoirs have been problematic on account of rising<br />
phytoplankton in aquacultural ponds, which can clog irrigation systems.<br />
The purpose of the present investigation was to evaluate such farm impoundments in the Stellenbosch<br />
region. Objectives included examining water use and water quality in ponds with and without<br />
aquaculture; a pond’s impacts on the local ecosystem, emphasizing biodiversity and wildlife habitat; and<br />
the economic and environmental opportunities that are foregone when water is impounded for its present<br />
purposes. <strong>AquaFish</strong> researchers from Auburn <strong>University</strong>, Stellenbosch <strong>University</strong>, and Makerere<br />
<strong>University</strong> cooperated in the study.<br />
Earlier Research<br />
Prior to the investigation, the research team had examined alternative ways of improving pond alkalinity<br />
and hardness, and has assessed tilapia feeding rates with a combination of artificial and natural feeds.<br />
They also had conducted two workshops on water quality and feed management. These projects<br />
succeeded in characterizing the variety of aquacultural conditions and practices in the region, which local<br />
farmers found useful as management guidelines. They also had served as reference material for<br />
governmental policy prescriptions and aquacultural research.<br />
Experimental Design<br />
The present investigation provided measurements of three crucial water-system factors: the quality of the<br />
water, the amount and type of downstream pond discharge, and pond effects on environmental<br />
biodiversity. Six ponds on five farms were selected: three control ponds without aquaculture and three<br />
with aquaculture. Watershed information was obtained through direct observation, mapping, satellite<br />
imagery, and discussions with land owners. Average pond depths were determined by sounding.<br />
In order to measure the influence of cage culture operations on pond water quality, water samples were<br />
collected by dipping at monthly intervals from January to August 2011. Samples were analyzed for pH,<br />
temperature, dissolved oxygen, electrical conductivity, total alkalinity, total hardness, total phosphorus,<br />
total ammonia nitrogen, nitrate-nitrogen, nitrite nitrogen, iron, manganese, zinc, and copper.
TECHNICAL REPORTS: INVESTIGATIONS 2009–2011<br />
Pond water balances were constructed analytically to estimate pond runoff from overflow or seepage.<br />
Inflow sources in the simulations included direct rainfall, groundwater seepage, and wet-period inflow<br />
from ephemeral streams. Outflow consisted of pond overflow, evapo-transpiration, annual discharge, and<br />
seepage. Historical data on air temperature, rainfall, and evaporation in the region also had to be<br />
considered. Pond water levels were recorded weekly from January 19 to September 1, 2011.<br />
Biodiversity was accounted for by noting the species of wetland plants, birds, small mammals, fish in the<br />
pond neighborhoods.<br />
Unexpected Difficulties<br />
The <strong>AquaFish</strong> researchers encountered several unexpected difficulties. Due to the investigation’s late<br />
start, some farmers who had indicated their availability to serve as study collaborators had cancel their<br />
offers. New study sites and collaborators had to be recruited. Other farmer-collaborators did not stay<br />
with the planned timeline, and study progress often was inhibited by poor communication and reply<br />
delays from them. Several experiments were found to require specialized equipment for which there was<br />
no budget. Worst, other equipment was vandalized and stolen, replacement costs of which were<br />
especially high in the less-accessible areas. On account of these difficulties, accurate information often<br />
was unavailable about a pond’s water withdrawals and diversions for irrigation and downstream flow,<br />
complicating the development of a detailed water-use budget in those ponds.<br />
Communication<br />
The importance of water resource management and facilitation of multiple water uses is so great that the<br />
present research had strong direct implications for farmers and public officials alike. On the other hand,<br />
because it ranged over a wide geographic area and involved a large number of interested parties, its<br />
logistical difficulties were substantial. Support from fish-farm owners and managers, laborers, the Cape<br />
Town Municipality, the Department of Water Affairs, and the Water Research Commission provided<br />
crucial support and funding.<br />
Significant Outcome<br />
The researchers found, most importantly, that formation of permanent water surfaces and small wetland<br />
areas in fishpond vicinities has enhanced ecosystem complexity and biodiversity. On the other hand,<br />
although differences among and between control- and aquaculture-type ponds were not statistically<br />
different in this respect, ammonia and nitrate concentrations tend to be greater in aquacultural than in<br />
other ponds. The implication is that aquaculture’s feed inputs may tend to damage water quality.<br />
However, by drastically reducing water levels, crop agricultural irrigation appears to infringe most on the<br />
functionality of multipurpose ponds in which fish farmers are involved.<br />
Future Work<br />
This study points clearly to several future research directions. One is to examine the ecological and<br />
health status of the region’s sediments, including a comparison of long-term sediment conditions in fish-<br />
and non-fish farming reservoirs, and an analysis of management practices for minimizing feed waste and<br />
improving fish-farm productivity. Attention also needs to be paid to smaller reservoirs’ resilience to<br />
water quality degradation and to their possibilities for recovering from it during non-farming periods.<br />
144
145<br />
TECHNICAL REPORTS: INVESTIGATIONS 2009–2011<br />
Alternative Feeds For Freshwater Aquaculture Species In Vietnam<br />
Sustainable Feed Technology/Study/09SFT01UC<br />
David A. Bengtson<br />
<strong>University</strong> of Rhode Island<br />
Kingston, Rhode Island, USA<br />
Tran Thi Thanh Hien<br />
Can Tho <strong>University</strong><br />
Can Tho, Vietnam<br />
INTRODUCTION<br />
Aquaculture is growing rapidly in Vietnam and has the potential to do the same in Cambodia. Production<br />
of pangasiid catfish in the Mekong Delta of Vietnam alone exceeded 1 million metric tons in 2008.<br />
While some of the food provided to these fish, especially at the larger commercial farms, is pelleted feed<br />
from commercial feed mills, many small farmers still use “trash fish” from the Mekong in preparing feed<br />
by hand at the farm. In Cambodia, catfish culture is still at the small-farm stage and trash fish comprise<br />
the basic feed for the industry (which is considerably smaller in Cambodia than in Vietnam).<br />
As aquaculture expands in Vietnam and Cambodia, the fish called snakehead is becoming popular to<br />
culture because of its high value in the market. There are actually two species currently being cultured,<br />
Channa striata, the snakehead murrel, and Channa micropeltes, the giant snakehead. While culture of<br />
these is permitted (and growing) in Vietnam, it is prohibited in Cambodia (except for some experimental<br />
work) due to its dependence on small fish in the diet. Catfish culture has available commercial pellet<br />
diets, so getting farmers to switch from small fish to pellets is a socioeconomic issue. On the other hand,<br />
pelleted diets do not yet exist for snakehead in Vietnam. There have been very few studies conducted on<br />
feed and feeding in Cambodia (Heng et al. 2004). There is no tradition of on-farm feed formulation that<br />
can be widely used in aquaculture systems. Pond fertilizer techniques are well understood by farmers but<br />
organic manures are scarce since they are needed for agricultural crops. The market price for farmed fish,<br />
especially in relation to the cost of feed, is a major problem. Prices are very low when fish are plentiful<br />
from capture fisheries and consumers prefer wild captured fish to cultured fish.<br />
In the Mekong Delta in Vietnam domesticated snakehead (Channa micropeltes and C. striata) are fed<br />
with small-sized/low value fish (of both marine and freshwater origin). In Cambodia wild giant<br />
snakeheads (Channa micropeltes) are generally cultured in smaller cages of less than 200 m 3 . Feed<br />
represents more than 70% of the total operational cost and the main type of feed for wild giant snakehead<br />
culture in Cambodia is small-sized/low value fish of freshwater origin (So et al., 2005).<br />
During phase 1 of this project (2007-2009), we determined species composition, size and chemical<br />
composition of the main freshwater trash/low-value fish species used as feed for finfish aquaculture in the<br />
Mekong Delta of Vietnam. We also developed weaning methods so that small, hatchery-reared snakehead<br />
can be quickly adapted to pelleted diets. (When snakehead are collected from the wild by fishermen for<br />
aquaculture, it is difficult to impossible to get them to feed on pelleted diets in captivity; the transition<br />
must be done in the early life stages.). We then determined that Channa striata snakehead survive as well<br />
on pelleted diets in which up to 50% of the fish meal has been replaced by soybean meal as they do on<br />
pelleted diets made purely of fish meal. On the other hand, growth was equivalent only up to the point of<br />
30% replacement of fish meal with soybean meal, if only the appropriate amino acids are added to the<br />
soybean diets; however, that level was increased to 40% replacement when we also added phytase to
TECHNICAL REPORTS: INVESTIGATIONS 2009–2011<br />
break down the phytin in soybean meal. The addition of taurine to the diets did nothing to increase growth<br />
above that seen at the 30% soy replacement alone. Next, we determined that Channa micropeltes<br />
snakehead survive as well on pelleted diets in which up to 50% of the fish meal has been replaced by<br />
soybean meal as they do on pelleted diets made purely of fish meal. On the other hand, growth was<br />
equivalent only up to the point of 40% replacement of fish meal with soybean meal when we also added<br />
phytase to break down the phytin in soybean meal. Finally, we demonstrated that a mixed fish meal,<br />
soybean meal and cassava meal diet (with phytase added) can undergo replacement with rice bran at<br />
replacement levels up to 30% with no reduction in survival or growth. Cassava is a locally produced crop<br />
that may be easier and cheaper to obtain than soybean meal.<br />
The objective of the current (phase 2) portion of this study was to provide information on alternative diets<br />
for snakehead, especially those diets that incorporate locally available plant materials, in order to build a<br />
long-term sustainable industry. Through an economic analysis of costs of the diets (based on costs of fish<br />
meal and plant proteins vs. trash fish) and the risks of the unavailability of trash fish in the future, the<br />
information provided from this study will allow decisions to be made about the development of feed mills<br />
for local production of diets for the snakehead industry.<br />
To meet the objective, a series of formulated feed experiments were conducted at the wet laboratory and<br />
hapas at College of Aquaculture and Fisheries (CAF) of Cantho <strong>University</strong> (CTU). Furthermore, we<br />
conducted on-farm trials in An Giang and Dong Thap provinces to test the optimal formulated feed for<br />
snakehead culture from the CTU trials under actual farm conditions. Specific tasks that were conducted<br />
were:<br />
(i) Evaluation of the chemical composition of marine trashfish in order to determine its value as a<br />
feed ingredient.<br />
(ii) Determine weaning methods with formulated feeds for snakehead C. micropeltes<br />
(iii) Conduct pilot trials on weaning methods with both(Channa striata and C. micropeltes larvae<br />
(iv) Conduct farm trials on grow-out of Channa striata fed with trash fish vs formulated feed<br />
(v) Conduct farm trials on grow-out of Channa micropeltes fed with trash fish vs formulated feed<br />
(vi) Conduct studies on the replacement of trashfish by rice bran and rice bran + cassava meal in feed<br />
for Channa striata<br />
(vii) Conduct grow-out of Channa striata on demonstration farms to show local farmers the value of<br />
utilizing formulated feed<br />
(viii) Conduct a survey of snakehead farmers using formulated feed in An Giang and Dong Thap<br />
provinces to determine the reasons for using formulated feed<br />
RESULTS<br />
2.1 Study 1: Evaluate the chemical composition and quality of trashfish<br />
Introduction<br />
In order to conduct some of the trials in this project, it was necessary to know the chemical composition<br />
and quality of the trash fish that would be used for feeding the experimental fish. Both fresh-water and<br />
marine trash fish are available in Vietnam. The composition and quality of trash fish in phase 1 of this<br />
project were analyzed.<br />
Methods<br />
Sampling was done at three different distribution sites and farm sites (An Giang province). Marine trash<br />
fish samples were collected at distribution sites and farm sites on the same day, and then stored on ice and<br />
146
147<br />
TECHNICAL REPORTS: INVESTIGATIONS 2009–2011<br />
sent to the College of Aquaculture and Fisheries, Can Tho <strong>University</strong> for analysis of chemical<br />
composition (protein, lipid, moisture and mineral) and TVB-N (Total Volatile Base Nitrogen) analysis.<br />
Fresh-water trash fish samples were also collected at the distribution sites.<br />
Results and Discussion<br />
The results showed that protein content of marine trash fish was higher, about 17.0%, than that of<br />
freshwater trash fish (15.5%); by contrast, lipid content of marine trash fish (2.22%) was lower than that<br />
of freshwater fish (6.2%).<br />
Table 2.1.1. Chemical compositions of trash fish based on wet matter (%)<br />
Trashfish<br />
Moisture<br />
(%)<br />
Crude ash<br />
(%)<br />
Crude Protein<br />
(%)<br />
Crude Lipid<br />
(%)<br />
Marine trash fish 73.6±1.50 6.93±0.24 17.0±0.19 2.22±0.21<br />
Freshwater trash fish 71.1±0.41 5.50±0.31 15.5±0.27 6.20±0.48<br />
TVB-N values of marine trash-fish samples collected from distribution sites and farm sites were 99.2 ±<br />
12.0 and 119.0 ± 17.8 mgN/100g, respectively (Fig. 2.1). Pike and Hardy (1997) presented evaluation<br />
standards for the freshness of fish. TVB-N value must be lower than 14 mgN/100gfor fish to be<br />
categorized as fresh, from 14 to 30 mgN/100g to be considered moderately fresh and fish with TVB-N<br />
values over 50 mgN/100g are categorized as stale. Our analysis showed that all of marine trash fish<br />
samples were in stale condition according to classification of Pike and Hardy (1997). The reason why<br />
trash fish samples showed high values of TVB-N is the long storage duration in transportation from the<br />
fishermen to the distribution sites (normally three days or more). In fishmeal processing, TVB-N values<br />
in trash fish ranged from 22-143 mgN/100g (Pike and Hardy, 1997). Moreover, after three days of storage<br />
on ice, there was an increase in TVB-N value in all samples collected from distribution sites and farm<br />
sites (159±17.7 and 139±17.3 mgN/100g, respectively). Randomly sampling trash fish for TVB-N<br />
analysis, Tran Thi Thanh Hien et al. (2006) indicated that marine trash fish used for Tra catfish were of<br />
bad quality, ranging from 84-148 mgN/100g and averaging 113.2 ± 25.6 mgN/100g for 11 samples<br />
collected.<br />
Fresh-water trash fish exhibited low TVB-N values (15.7 ± 0.51mgN/100g) on the day of catching and<br />
sampling. The samples looked fresh at the time of analysis and fish were collected and analyzed on the<br />
days when they were caught. There was an increase in TVB-N value after three days of storage (43.5 ±<br />
1.1 mgN/100g). According to classification of Pike and Hardy (1997) the fresh-water trash fish were<br />
therefore still fresh after three days of storage.<br />
2.2. Study 2: Pilot trials on weaning method using formulated feeds for snakehead larvae<br />
Introduction<br />
First feeding is one of the critical periods in fish larval rearing. Zooplankton such as Brachionus, Moina<br />
and Daphnia are frequently used as food resources in fresh-water larviculture and for ornamental fish.<br />
They contain a broad spectrum of digestive enzymes such as proteinase, peptidase, amylase, lipase and<br />
even cellulase that can serve as exo-enzymes in the gut of the fish larvae (Lavens and Sorgeloos 1996).<br />
The quantity and quality of food given, including the types of food used in each of the developmental<br />
stages, can also be critical in larval rearing and most importantly can affect economic aspects. Larval<br />
rearing has been successful for freshwater and marine fish larvae using brine shrimp Artemia sp (Léger et<br />
al., 1986), for walking catfish Clarias macroceplalus using Moina (Fermine et al., 1991) or for European
TECHNICAL REPORTS: INVESTIGATIONS 2009–2011<br />
mg N/100g samples<br />
200<br />
160<br />
120<br />
80<br />
40<br />
0<br />
0 3<br />
Fig 2.1.1. The freshness of marine trash-fish (MTF) samples collected from distribution and farm sites<br />
and fresh water trash fish (FTF) samples collected at distribution sites (n=3). Bars indicate standard<br />
errors.<br />
catfish Silurus glanis using Tubifex worms (Ronyai and Ruttkay, 1990). Some catfish (Clarias gariepinus<br />
and Heterobranchus longifilis) can also be reared exclusively on formulated diet (Appelbaum et al.,<br />
1988). However, rearing larvae on formulated diets often resulted in lower growth and survival rate than<br />
rearing them on live foods or trash fish. So the present study aims at comparing growth performance and<br />
survival rate of Channa striata larvae when weaning from live feed to formulated diets.<br />
Methods<br />
After yolk absorption at 3 days after hatching (dah), larvae were fed with Moina. The experimental<br />
treatments were initiated when the larvae were 10 days after hatch (dah). The experiment was carried out<br />
with 9 treatments with three replicates of each treatment. Larvae were stocked at 200 individuals/tank.<br />
Trash fish was replaced by experimental feed at 20, 30 or 40 dah at rates of either 10% perday, 10%<br />
every two days, or 10% every three days) until larvae were receiving 100% experimental feed per day.<br />
Larvae were fed at 7am,10am, 2pm and 5pm.<br />
The temperature varied from 25.92-27.81 o C, tending to be higher around noon; dissolved oxygen varied<br />
from 4.39 - 5.56 mg/L; pH was around 7; and N-NH3 and NO2. were
Table 2.2.1. Environmental parameters<br />
Treat.<br />
Temperature ( o C)<br />
Dissolved Oxygen (ppm)<br />
149<br />
TECHNICAL REPORTS: INVESTIGATIONS 2009–2011<br />
Morning Afternoon Morning Afternoon Morning Afternoon<br />
Data measurement and calculation<br />
During the experiment, any mortalities were removed daily and counted. At the end of experiment, all<br />
fish were counted and final body weight (FBW, mg) and wet weight gain (WWG, mg) were determined.<br />
From those data, we calculated survival rate (SR), daily weight gain (DWG), feed intake (FI), feed<br />
conversion ratio (FCR), protein efficiency ratio (PER), and economic conversion ratio (ECR). In addition,<br />
we calculated the mortality rate (based on number of actual mortalities removed from the experiment) and<br />
cannibalism rate (based on the initial number of fish stocked minus the number of mortalities removed<br />
minus the survivors at the end; i.e., all fish unaccounted for and presumed to have been cannibalized).<br />
Differences among treatments were determined by one way ANOVA with means separated using<br />
Duncan’s Multiple Range test at p = 0.05 using SPSS 13.0.<br />
Results<br />
Experiment 1: Pilot trials on weaning method using formulated feeds for snakehead (Channa<br />
micropeltes) larvae<br />
The survival rate increased as weaning was delayed (Table 2.2.2).. Within the same weaning time (i.e.,<br />
20, 30, or 40 dah), the survival rates tended to increase with increased number of days allowed for<br />
weaning, although significant differences were only seen at 40 dah. The non-cannibalism mortality rate<br />
was not significantly different among treatments, except for fish weaned at 20 dah over two- or three-day<br />
periods. Channa micropeltes raised in captivity still retain many characteristics of wild fish. They<br />
cannibalize each other if they are not graded weekly. The cannalism rate was highest (44.8%) in<br />
treatment 20-1 and differred significantly from the other treatments at p
TECHNICAL REPORTS: INVESTIGATIONS 2009–2011<br />
Table 2.2.2. Survival rate, non-cannibalism mortality rate, and cannibalism rate. Values (mean±SD) in<br />
the same column followed by the same letter are not significantly different.<br />
Treatments<br />
Survival rate (%)<br />
Non-cannibalism<br />
mortality rate<br />
(%)<br />
150<br />
Cannibalism rate (%)<br />
20-1 30.5 ± 3.28 a 24.7 ± 6.53 a 44.8 ± 5.13 c<br />
20-2 37.5 ± 11.2 ab 47.2 ± 13.6 bc 15.3 ± 4.25 b<br />
20-3 37.2 ± 9.65 ab 54.7 ± 11.5 c 8.17 ± 6.17 ab<br />
30-1 60.8 ± 11.4 cd 29.5 ± 8.26 ab 9.67 ± 3.55 ab<br />
30-2 63.0 ± 8.19 cd 21.8 ± 8.50 a 15.2 ± 1.53 b<br />
30-3 69.3 ± 19.9 cd 18.5 ± 14.9 a 12.2 ± 5.01 ab<br />
40-1 57.0 ± 18.3 bc 30.3 ± 14.7 ab 12.7 ± 5.69 ab<br />
40-2 73.8 ± 14.3 cd 21.2 ± 12.7 a 5.00 ± 1.80 a<br />
40-3 80.8 ± 2.93 d 13.3 ± 4.54 a 5.83 ± 2.02 a<br />
Figure 2.2.1. Larvae with large fish eating small fish<br />
Table 2.2.3. Rates at which fingerlings did not accept formulated feed. Values (mean±SD) in the same<br />
column with different letters are significantly different (P
151<br />
TECHNICAL REPORTS: INVESTIGATIONS 2009–2011<br />
Figure 2.2.2. Larvae with thin body did not accept experimental feed. Larvae in treatment 40-3 gave the<br />
highest values in weight gain (8.6 g) and and daily weight gain (0.17 g/day) and differed significantly<br />
from those in other treatments at p
TECHNICAL REPORTS: INVESTIGATIONS 2009–2011<br />
Phần trăm (%)<br />
100<br />
90<br />
80<br />
70<br />
60<br />
50<br />
40<br />
30<br />
20<br />
10<br />
0<br />
-10<br />
0-5g 5-10g 10-15g >15g<br />
20-1 20-2 20-3 30-1 30-2 30-3 40-1 40-2 40-3<br />
Nghiệm thức<br />
Figure 2.2.3. Size variation of snakehead fed with different diets<br />
Figure 2.2.4. Size disparity of Channa micropeltes at the end of experiment<br />
In general, the best weaning strategy that is apparent from this experiment is to wean giant snakehead<br />
beginning at 40 dah and using a three-day transition to formulated feed. Since this strategy yielded about<br />
81% survival of the fish, some improvement ot this strategy may be possible, but our results are<br />
considered quite acceptable for snakehead culture in Vietnam.<br />
152
153<br />
TECHNICAL REPORTS: INVESTIGATIONS 2009–2011<br />
Experiment 2: Pilot trials on weaning method using formulated feeds for snakehead (Channa<br />
striata) larvae on farms.<br />
Introduction<br />
During phase 1 of this project, we conducted weaning trials with Channa striata in the facilities at CTU<br />
to determine the optimal strategy for weaning this important species. One critical factor in convincing<br />
snakehead farmers to use formulated feed is the availability of snakehead fingerlings that have been<br />
weaned to pellets in the hatchery. Wild snakehead or snakehead that have been reared in a hatchery<br />
without weaning cannot be weaned to pellets once they are in the grow-out facility. In the current trial, we<br />
wanted to test our optimal weaning strategy under actual farm conditions.<br />
Methodology<br />
The experiment was carried out in An Giang and Dong Thap provinces simultaneously at one farm in<br />
each province. The fish (6 - 7 g/fish in initial weight) were assigned to 6 hapas (50 m 2 /hapa) placed in a<br />
1,000 m 2 pond, 180 fish/m 2 in stocking density. Each treatment was triplicated and experimental period<br />
was 10 days.<br />
The experiment contained two treatments. In treatment 1, fish were fed with 100% trash fish during<br />
experimental period (control treatment). In treatment 2, on the first day, fish were fed 100% trash fish.<br />
Beginning the following day, the percentage of trash fish was reduced at a rate of 10% per day and<br />
replaced by formulated feed until trash fish was completely replaced by formulated feed on the 10 th day.<br />
During the experimental period, fish were fed 3 times per day to satiatation. Fish were weighed and<br />
counted on the 10 th day to calculate the survival rate (SR) and the growth rate. Temperature, oxygen and<br />
pH were measured daily. Water quality parameters were in the normal range for snakehead culture in<br />
Vietnam (Table 2.2.5). Temperature in the morning ranged from 28.0 – 29.5 o C while temperature in the<br />
afternoon was higher (29.5 – 32 o C). There was a small fluctuation in pH between the morning (6.7-7.5)<br />
and the afternoon (7.0 – 7.7). Dissolved oxygen was low in the morning (2.5 – 4 ppm) and higher in the<br />
afternoon (4.0 – 5.2 ppm).<br />
Table 2.2.5. Temperature ( o C), pH and Oxy (ppm) of Study 1 in An Giang province<br />
Provinces Temperature ( o C) pH Oxy (ppm)<br />
An Giang<br />
Morning<br />
Afternoon<br />
28.5 - 29.5<br />
30.0 - 32.0<br />
6.8 - 7.5<br />
7.0 - 7.7<br />
3.00 – 4.00<br />
4.50 - 5.20<br />
Dong Thap<br />
Morning<br />
Afternoon<br />
28.0 - 29.5<br />
29.5 - 32.0<br />
6.7 - 7.3<br />
7.1 - 7.7<br />
2.5 - 4<br />
4.0 - 5.0<br />
Results<br />
Survival and Growth<br />
No significant differences were observed between treatments in either survival rate or daily weight gain<br />
(p>0.05). Thus, snakehead fingerlings can be weaned by formulated feed in replacing trash fish at the rate<br />
of 10%.day -1 (Table 2.2.6).
TECHNICAL REPORTS: INVESTIGATIONS 2009–2011<br />
Table 2.2.6. Survival rate (%), body weight (g.fish -1 ) and daily weight gain (g.day -1 ) of Channa striata<br />
fed trash fish (TF) or weaned to formulated feed (FF) at two farms in An Giang and Dong Thap<br />
provinces. Data are means of three replicates per treatment ± SE. Means for TF and FF in the same<br />
column for a given province with the same superscript in each treatment are not significantly different<br />
(p
155<br />
TECHNICAL REPORTS: INVESTIGATIONS 2009–2011<br />
Results<br />
Survival and growth<br />
Fingerlings that were fed only trash fish had significant greater daily weight gain compared to fish<br />
weaned from trash fish to formulated feed (p0.05). Giant snakehead fingerlings can be weaned by<br />
formulated feed in replacing trash fish in the rate 10%.day -1 which reduce the dependence on trash fish<br />
supply, although farmers should expect that the growth rate of the fish will be reduced, at least<br />
temporarily.<br />
Table 2.2.8. Survival rate (%), body weight (g.fish -1 ) and daily weight gain (g.day -1 ) of Channa<br />
micropeltes fed either trash fish for 30 days or weaned from trash fish to formulated feed over 10 days<br />
and then grown an additional 20 days. Data are means of three replicates per treatment ± SE. Means in the<br />
same column followed by the same superscript are not significantly different.<br />
Diets Initial weight Final weight WG DWG SR<br />
Trash fish 1.51±0.87 a 15.3±8.84 b 13.8±7.97 b 0.34±0.19 b 89.1±51.4 a<br />
Formulated<br />
feed<br />
1.51±0.87 a 9.97±5.76 a 8.46±4.89 a 0.21±0.12 a 91.1±52.6 a<br />
2.3 Study 3: Farm trials on grow-out of Channa striata fed with trash fish vs formulated feed<br />
Introduction<br />
In phase 1 of this project, we developed formulated feeds for Channa striata in which a significant<br />
amount of the fish meal was replaced by soybean meal and local ingredients like cassava meal and rice<br />
bran. This diet development was based on laboratory feeding trials in tanks followed by larger scale<br />
feeding trials in hapas in ponds at CTU. In the current phase of the project, we wanted to demonstrate the<br />
effectiveness of these diets on actual snakehead farms.<br />
Methodology<br />
The experiment was carried out in An Giang and Dong Thap provinces simultaneously. The test was set<br />
up with 6 hapas (50m 2 /hapa) with a stocking density of 100 fingerlings/m 2 . Hapas were placed in 2 ponds,<br />
each500 m 2 . In pond 1, snakehead fingerlings (12-13g/fish) in the three hapas (5x10 m in size) were fed<br />
marine trash fish (control treatment) for 6 months. In pond 2, snakehead fingerlings (12-13g/fish) in the<br />
three 3 hapas (5x10 m in size) were fed formulated feed. In the two first months, snakehead fingerlings<br />
were fed by diet named CTU- <strong>CRSP</strong> 1 (44%CP). In the third month, fish were fed by diet CTU- <strong>CRSP</strong> 2<br />
(41%CP) and CTU- <strong>CRSP</strong> 3 (38%CP) was used for the two last months. The formulation of three<br />
formulated diets is given in Table 2.3.1.<br />
Formulated feed was made from main ingredients such as Kien Giang fish meal, defatted soybean meal,<br />
cassava meal, dried rice-bran. All diets were made in an extruding pellet mill at CTU. Trash fish was<br />
marine trash fish bought from markets andwas chopped up before feeding.
TECHNICAL REPORTS: INVESTIGATIONS 2009–2011<br />
Table 2.3.1. The formulation of three formulated feed diets (% of dry matter basis) used in the farm trials<br />
with Channa striata. Note: 1 USD = 20,600 VND<br />
Ingredients 44 % CP 41% CP 38 % CP<br />
Fish meal 32.76 30.21 27.66<br />
Soybean meal 31.87 29.39 26.91<br />
Dried rice-bran 20.00 20.00 20.00<br />
Cassava meal 7.12 11.99 16.86<br />
Premix Vitamin 1.00 1.00 1.00<br />
Premix mineral 1.00 1.00 1.00<br />
Fish oil 3.32 3.48 3.64<br />
Binder 1.90 1.90 1.90<br />
Lysine 0.40 0.44 0.46<br />
Methionine 0.28 0.28 0.28<br />
Threonine 0.41 0.40 0.39<br />
Phytase 0.02 0.02 0.02<br />
Total 100 100 100<br />
Price (USD) 0.94 0.92 0.90<br />
Sampling<br />
The amount of feed used daily was recorded. . The following water quality parameters were measured<br />
monthly: Transparency (Secchi disk), pH, dissolved oxygen, NH3, NO2 - . Growth was recorded monthly<br />
by weighing 30 fish/hapa. At the end of the experiment, a sensory evaluation was conducted to compare<br />
the fillet quality of experimental fish and wild fish.<br />
Data calculations<br />
(1) Chemical composition of the experimental feeds (see below)<br />
(2) Survival rate (%) = (Number of fish end of experiment/number of initial fish) x 100<br />
(3) Weight gain (WG) (g) = Final body weight – Initial body weight<br />
(4) Daily weight gain (DWG) (g.day -1 ) = [(Final body weight – Initial body weight)/<br />
duration of the experiment]<br />
(5) Feed Conversion Ratio (FCR)<br />
FCR (wet) = Feed intake (wet) / Weight gain<br />
FCR (dry) = Feed intake (dry) / Weight gain<br />
(6) PER = (Final body weight – Initial body weight) / Protein intake<br />
(7) Abnormal (humpback) rate (%)= 100%*(Number of abnormal fish/total fish)<br />
(8) Profit (USD)= Total income – total cost<br />
(9) Profit ratio (%) = 100*(profit/total cost)<br />
(10) Sensory test of fillets (see below)<br />
156
157<br />
TECHNICAL REPORTS: INVESTIGATIONS 2009–2011<br />
Chemical analysis<br />
Feed was analyzed for chemical composition: moisture, crude protein (CP), crude lipid (CL), crude fiber<br />
(CF), nitrogen free extracts (NFE) and gross energy, according to AOAC (2000) methods. Loss on drying<br />
was used to determine moisture content; protein (N x 6.25) was determined by Kjeldahl method; lipid was<br />
determined by Soxhlet method; crude fiber was determined by acid and base hydrolysis; and gross energy<br />
was determined by bomb calorimeter. Carbohydrate-NFE = 100 - (CP + CL + CF). Fish samples collected<br />
at the beginning and end of the experiment were also analyzed for moisture, crude protein, crude lipid,<br />
crude ash and nitrogen free extracts.<br />
Sensory evaluation<br />
At the end of the experiment, all fish were killed, filleted and washed, then they were steamed for 3<br />
minutes. First, these fish were used to determine the difference in the quality of fish fillet between the<br />
control and experimental groups by triangle test (2 controls and 1 sample) with three replacements per<br />
test. And the control sample was the snakehead which were bought at the local market. There were two<br />
samples named trash-fish and formulated feed.<br />
If less than 6 out of 9 detected the odd sample correctly, we determined that there was no significant<br />
difference and therefore no need to conduct a sensory test. A pair test was run if there was any difference<br />
in any sensory attributes for texture or taste even if they were minor – called a ‘descriptive pair test’. On<br />
the other hand, if 7 out of 9 people detected the odd sample correctly, there was a significant difference at<br />
P
TECHNICAL REPORTS: INVESTIGATIONS 2009–2011<br />
Proximate compositions of the formulated feeds were similar to the theoretical levels in the diet<br />
formulations diet while trash fish had higher protein level (59.1%) in dry basic matter.<br />
Water quality parameters<br />
Water quality parameters are presented in Table 2.3.3. There was some variation in water quality<br />
parameters between the two experimental ponds in each province. In particular, dissolved oxygen levels<br />
were lower in the ponds fed trash fish than they were in the ponds fed formulated feed. Trash fish is<br />
generally considered to pollute the water in which the fish to which it is fed are held and our observations<br />
may indicate that more oxygen is being used to break down the organic matter in the trash fish-fed ponds<br />
than in the formulated diet-fed ponds.<br />
Table 2.3.3. Water quality parameters in An Giang and Dong Thap provinces<br />
Provinces Diets<br />
An Giang<br />
Dong Thap<br />
Temperature<br />
( o C)<br />
Trash fish 29.0 - 31.8<br />
Formulated<br />
feed<br />
29.0 - 31.8<br />
Trash fish 29 - 31.8<br />
Formulated<br />
feed<br />
28.7 - 31.5<br />
pH<br />
7.1 -<br />
7.8<br />
7.0 -<br />
7.5<br />
7 -<br />
7.3<br />
7 -<br />
7.5<br />
158<br />
DO<br />
(ppm)<br />
2.5 –<br />
3.0<br />
Transparency<br />
(cm)<br />
22 – 30<br />
3.0 - 4.5 20 - 25<br />
2.2 –<br />
3.2<br />
3.5 –<br />
4.5<br />
20 - 25<br />
18 - 22<br />
NH3<br />
(mgL -1 )<br />
0.01 –<br />
0.08<br />
0.01 –<br />
0.02<br />
0.02 –<br />
0.06<br />
0.01 –<br />
0.02<br />
NO2 -<br />
(mgL -1 )<br />
0.01 –<br />
0.05<br />
0.01 –<br />
0.03<br />
0.01 –<br />
0.05<br />
0.01 –<br />
0.02<br />
Survival and growth<br />
After 6 months of culture in An Giang province, the average final weight of fish fed fed with formulated<br />
diet (403 ± 2.21g) was significantly higher than that of fish fed with trash fish (391 ± 3.32g) (Fig. 2.3.1),<br />
as was daily weight gain (2.75±0.02 g.day -1 and 2.67±0.02 g.day -1 respectively) (Table 2.3.4). After 4<br />
months of culture in Dong Thap province, the average final weight of fish fed with trash fish (136 + 10 g)<br />
was significantly lower than that of fish fed with formulated diet (199 + 3 g)(Fig, 2.3.2), as was daily<br />
weight gain (1.15 + 0.10 g/day and 1.74 + 0.02 g/day, respectively) (Table 2.3.4).
Weigh (g)<br />
250<br />
200<br />
150<br />
100<br />
50<br />
0<br />
Weigh (g)<br />
250<br />
200<br />
150<br />
100<br />
50<br />
Wi 1st 2nd 3rd 4th<br />
0<br />
Wi 1st 2nd 3rd 4th<br />
159<br />
TECHNICAL REPORTS: INVESTIGATIONS 2009–2011<br />
FF<br />
TF<br />
Month<br />
Figure 2.3.1. The growth performance of snakehead throughout the crop in An Giang province<br />
TF<br />
FF<br />
Month<br />
Figure 2.3.2. The growth performance of snakehead throughout the crop in Dong Thap province<br />
The survival rate in the experiment showed no significance between fish fed formulated feed and trash<br />
fish in the two provinces (p
TECHNICAL REPORTS: INVESTIGATIONS 2009–2011<br />
Table 2.3.4. Survival rate (%), feed conversion ratio (wet and dry basic matter), protein efficiency ratio<br />
(protein. weight gain -1 ) and abnormal rate (%) of Channa striata fed experimental diets of experiment 2<br />
in An Giang and Dong Thap province.<br />
Provinces<br />
Diets SR FCR (wet) FCR (dry) PER<br />
Abnormal<br />
rate (%)<br />
DWG<br />
AG TF 74.8±0.55 a 4.45±0.07 b 1.12±0.02 b 1.78±0.03 b 1.26±0.16 a 2.67±0.02 a<br />
FF 73.3±0.32 a 1.44±0.03 a 1.29±0.03 a 1.56±0.03 a<br />
20.1±1.83 b 2.75±0.02 b<br />
DT TF 78.5±3.44 a 3.72 ± 0.10 b 1.10 ± 0.04 a 1.56±0.06 b 00 1.15±0.10 a<br />
FF 79.7±2.67 a 1.59 ± 0.04 a 1.59 ± 0.04 b 1.34±0.04 a 00 1.74±0.02 b<br />
Note: TF: trash fish FF: formulated feed<br />
Abnormal rate from fish fed formulated diet (20.1 ± 1.83%) was significantly higher than that of fish fed<br />
the trash fish diet (1.26 ± 0.16%) (p
7.87<br />
1.66 4.98<br />
7.39 1.54 4.63<br />
86.4<br />
85.5<br />
161<br />
TECHNICAL REPORTS: INVESTIGATIONS 2009–2011<br />
feed cost<br />
fingerling cost<br />
medicine cost<br />
labor cost<br />
Figure 2.3.3. Breakdown of variable costs as percentages of total cost for the ponds fed<br />
formulated feed in the farm trials with Channa striata<br />
feed cost<br />
fingerling cost<br />
medicine cost<br />
labor cost<br />
Figure 2.3.4. Breakdown of variable costs as percentages of total cost for the ponds fed trash fish<br />
in the farm trials with Channa striata<br />
Profit from ponds fed trash fish were much lower than that from ponds fed formulated feed and there was<br />
a significant difference between treaments (p
TECHNICAL REPORTS: INVESTIGATIONS 2009–2011<br />
Table 2.3.6. Economics of experimental snakehead culture in An Giang and Dong Thap province on a<br />
per-hapa and per-meter-squared basis. Note: Crop duration was 6 months for An Giang province and 4<br />
months for Dong Thap province.<br />
Provinces<br />
Total cost (million Total income (million Profit (million<br />
Diets VND/hapa)<br />
VND/hapa)<br />
VND/hapa)<br />
An Giang TF 14.3 ± 0.13 b 20.6 ± 0.11 a 6.37 ± 0.21 a<br />
FF 13.4 ± 0.14 a 20.8 ± 0.18 a 7.43 ± 0.32 b<br />
Dong Thap TF 5.97 ± 0.16 a 11.5 ± 0.66 a 5.54 ± 0.51 a<br />
FF 9.04 ± 0.16 b 17.0 ± 0.30 b 8.01±0.38 b<br />
Provinces<br />
Total cost (million<br />
Diets VND/m 2 Total income (million<br />
)<br />
VND/m 2 Profit (million<br />
)<br />
VND/m 2 )<br />
An Giang TF 0.95 ± 0.01 b 1.37 ± 0.01 a 0.42 ± 0.01 a<br />
FF 0.89 ± 0.01 a 1.39 ± 0.01 a 0.50 ± 0.02 b<br />
Dong Thap TF 0.25 ± 0.01 a 0.48 ± 0.03 a 0.23 ± 0.02 a<br />
FF 0.38 ± 0.01 b 0.71 ± 0.01 b 0.33 ± 0.02 b<br />
Table 2.3.7. Economics of experimental snakehead culture in An Giang and Dong Thap province on a per<br />
kg fish basis. Note: Crop durationwas 6 months for An Giang province and 4 months for Dong Thap<br />
province<br />
Provinces Diets<br />
Total cost (thousand<br />
VND/kg fish)<br />
Total income (thousand<br />
VND/kg fish)<br />
Profit (thousand<br />
VND/kg fish)<br />
An Giang TF 32.5 ± 0.41 b 47.0 ± 0.00 14.5 ± 0.41 a<br />
FF 30.5 ± 0.62 a 47.0 ± 0.00 16.5 ± 0.62 b<br />
Dong Thap TF 24.0 ± 0.62 a 45.0 ± 0.00 21.0 ± 0.62 a<br />
FF 23.5±0.62 a 45.0 ± 0.00 21.5 ± 0.62 a<br />
Fish quality<br />
Sensory analysis<br />
In appearance, both fish fed trashfish and formulated feed received scores of approximately 4 to 5,<br />
meaning that the fillets were passable or fairly likable for liking; medium or rather white for whiteness;<br />
except structural integrity, for which the scores were nearly 7- relatively uniform. In taste, the fish fillet<br />
had snakehead-like taste without the presence of objectionable taste and odor. In texture examination, for<br />
liking, the score was from 5 to 6, from rather not like – passable – fairly like.For firmness, the scores were<br />
4-5, relatively soft – medium fish fillet. The fillet moistness was judged to be rather dry to medium (not<br />
dry and not moist). The fillet chewiness and flakiness was fairly mushy and relatively rubbery or medium<br />
(not mushy and not chewy; not rubbery and not flaky).<br />
The result showed that there was no significant difference between paired samples in triangle tests (less<br />
than 6 out of 9 people detected the odd sample correctly). These samples were then subjected to<br />
“descriptive” pair tests, with the result that the quality of fish fillet samples from the two treatments did<br />
not significantly differ.<br />
162
163<br />
TECHNICAL REPORTS: INVESTIGATIONS 2009–2011<br />
Table 2.3.8. Triangle test for difference (Number from a 9-person sample<br />
who detected the odd sample correctly<br />
TF FF<br />
2.67 ± 0.33 4.33 ± 0.33<br />
Table 2.3.9. Channa striata sensory analysis. Data are mean + SE.<br />
Content<br />
Appearance<br />
Scores<br />
TF FF<br />
Liking 4.70 ± 0.07 4.96 ± 0.13<br />
Whiteness 4.59 ± 0.07 4.48 ± 0.04<br />
Structural integrity<br />
Taste<br />
7.00 ± 0.00 6.93 ± 0.07<br />
Liking 4.30 ± 0.10 4.70 ± 0.10<br />
Snakehead-like taste 4.56 ± 0.11 5.81 ± 0.23<br />
Presence of objectionable taste No No<br />
Presence of objectionable odor<br />
Texture<br />
No No<br />
Liking 5.30 ± 0.10 5.89 ± 0.19<br />
Firmness 5.41 ± 0.07 4.93 ± 0.10<br />
Moistness 3.74 ± 0.07 5.04 ± 0.36<br />
Chewiness 5.63 ± 0.04 5.67 ± 0.06<br />
Flakiness 3.70 ± 0.07 4.04 ± 0.13<br />
In summary, snakehead fillet quality was fairly like and did not significantly differ between samples in<br />
triangle tests. In desciptive pair tests, there was also no significant difference between samples. So, the<br />
diets did not affect on the quality of fish fillet for fish in these farm trials.The results confirmed that trash<br />
fish can be replaced by formulated feed for snakehead culture.<br />
2.4 Study 4: Farm trials on grow-out of Channa micropeltes fed with with trash fish vs Formulated<br />
feed<br />
Introduction<br />
Just as for Channa striata, it is important to demonstrate the effectiveness in actual farm trials of the<br />
formulated diets developed in phase 1 of this project for Channa micropeltes.<br />
Methodology<br />
The experiment was carried out in An Giang province. The test was set up with 6 hapas (50m 2 /hapa)<br />
placed in one pond (700 m 2 )with a stocking density of 100 fingerlings/m 2 . Giant snakehead fingerlings<br />
(12 - 13g/fish) in three hapas (5x10 m in size) were fed marine trash fish (control treatment) for 5 months.<br />
Fingerlings (12-13g/fish) in the other three hapas (5x10 m in size) were fed formulated feed. In the two<br />
first months, snakehead fingerlings were fed the diet named CTU- <strong>CRSP</strong>- 1 (44%CP). In the third month,<br />
fish were fed by diet CTU- <strong>CRSP</strong>- 2 (41%CP) and CTU- <strong>CRSP</strong>- 3 (38%CP) for the two last months.<br />
Experimental diets, sampling, data calculation and analysis were done the same way as experiments on<br />
snakehead experiments
TECHNICAL REPORTS: INVESTIGATIONS 2009–2011<br />
Results<br />
The experiment will be completed on 15 September<br />
2.5 Study 5: Replacing trash fish by rice bran and rice bran + cassava meal in snakehead Channa<br />
striata feed<br />
Introduction<br />
Although hatchery-reared snakehead that have been weaned to pellets are available in Vietnam, such fish<br />
are not available in Cambodia and it will take some time before Cambodian hatcheries are fully functional<br />
and the snakehead have been domesticated there. In the short term in Cambodia, it will be necessary to<br />
use moist diets based on trash fish and other ingredients, such as rice bran and cassava meal. Rice bran is<br />
available and abundant in Mekong Delta. Using this ingredient will reduce feed cost for fish and animal<br />
production. Actually, it has often been used in formulated fish feed such as commercial feed (30-40% of<br />
rice bran has been used) and home-made feed (60-70%) for some species. Rice bran contains vitamins A,<br />
D, E, B1, and B2 at levels higher than those in corn, and rather high protein 8.34-16.3% (Hien et al.,<br />
2009).<br />
Cassava meal is acheap source of carbohydrates and serves as a good binder in fish feed. According to<br />
Hien (2009), the dry matter digestibility of cassava is approximately 83.3%, high compared to other<br />
carbohydrate sources.<br />
Methodology<br />
Figure 2.5.1. Experimental hapas<br />
Experimental fish<br />
Before starting the experiments, all the fish were reared in 2000-L round tanks and were fed with trash<br />
fish combined with pellet diets for 2 weeks. Replacement of trash fish by pellet feed was applied<br />
gradually at a rate of 10% day-1 until 100% of trash fish was substituted by pellet feed.<br />
Experimental design<br />
There are two experiments in this study. The first is replacing marine trash-fish (MTF) by rice bran and<br />
cassava meal. The second is replacing freshwater trash-fish (FTF) by those ingredients. Both experiments<br />
were conducted with 11 diet treatments consisting of a control diet formulated pellet (FP) which<br />
concluded fish meal, soybean meal, rice bran and cassava meal in the optimal combination as determined<br />
164
165<br />
TECHNICAL REPORTS: INVESTIGATIONS 2009–2011<br />
from experiments in phase 1; marine trash-fish (MTF); freshwater trash-fish (FTF); and others which<br />
were mixed with different ratios of MTF or FTF, rice bran (RB) and RB + cassava meal (CM) (Tables<br />
2.5.1 and 2.5.2) Each treatment had three replicates.<br />
The 33 hapas (1x1x2m/hapa) used in each experiment were fixed in a pond in CAF, Cantho <strong>University</strong><br />
(Fig. 2.5.1). Fifty snakehead fingerlings (3.7 - 3.9 g in initial weight) were assigned randomly in each<br />
hapa. Experimental time was 6 weeks.<br />
Table 2.5.1. Composition of 11 experimental diets (%)<br />
Treat Mixed ratios FP MTF FTF<br />
Replacing ratios<br />
of MTF (FTF)<br />
RB CM<br />
1 Formulated Pellet (FP) 100 - - - -<br />
2 MTF - 100 - - -<br />
3 FTF - - 100 - -<br />
4 MTF (FTF)+RB+CM 80:10:10 - - 80 10 10<br />
5 MTF (FTF)+RB+CM 70:15:15 - - 70 15 15<br />
6 MTF (FTF)+RB+CM 60:20:20 - - 60 20 20<br />
7 MTF (FTF)+RB+CM 50:25:25 - - 50 25 25<br />
8 MTF (FTF)+RB 80:20 - - 80 20 -<br />
9 MTF (FTF)+RB 70:30 - 70 30 -<br />
10 MTF (FTF)+RB 60:40 - - 60 40 -<br />
11 MTF (FTF)+RB 50:50 - - 50 50 -<br />
Fish were fed until satiation twice daily at 08:00am and 15:00pm. The amount of feed consumed was<br />
adjusted on a daily basis and recorded. All hapas were cleaned every two weeks. Total fish weight in each<br />
aquarium was determined at the beginning and at the end of experiments. Dead fish were recorded and<br />
weighed for calculating feed conversion ratio (FCR).<br />
Water temperature was measured daily and ranged from 27.0–30.1 o C. pH and dissolved oxygen were<br />
measured weekly and determined to be 6.5–7.6 and 1.9–2.6 ppm in the early morning, and 4.8-6.8 in the<br />
afternoon, respectively. No aeration was provided in the ponds.<br />
Methods for data calculation, chemical analysis and statistical analysis were identical to those used in the<br />
trial on farm experiments.<br />
Results and Discussion<br />
Experiment 1<br />
Marine trash-fish (17.0%) had higher protein content than freshwater trash-fish (15.5%). The lipid content<br />
was 2.22% for freshwater and 6.20% for marine trash-fish. Crude protein decreased with increasing<br />
replacement of fish meals with rice bran and cassava meal, and diets replacing trash-fish by only rice bran<br />
(16.5 – 14.8%) had higher protein content than those replacing TF by both RB and CM (15.5 – 12.5%)<br />
(Table 2.1.2).
TECHNICAL REPORTS: INVESTIGATIONS 2009–2011<br />
Table 2.5.2. Chemical compositions of treatment diets basing on wet matter (%)<br />
Treatment diets<br />
Moisture<br />
(%)<br />
Significantly higher growth rates were obtained with formulated pellet and freshwater trash-fish (0.56 and<br />
0.57 g.day -1 , respectively) than with the other treatments (Table 2.5.3). Conversely, significantly lower<br />
growth was obtained with diets MTF+RB+CM 50:25:25 (0.21 g.day -1 ) and MTF+RB 50:50 (0.23 g.day -<br />
1 ). This means that the greater amount of marine trash-fish that is replaced, the lower fish growth will be.<br />
In addition, snakehead using FTF grew as fast as fish fed by formulated pellet and faster than fish fed by<br />
MTF.<br />
Table 2.5.3. The growth of Channa striata fingerlings<br />
Crude ash<br />
(%)<br />
Treatments Wi Wf DWG SGR SR<br />
FP (44%CP) 3.79±0.01 a 27.3±0.25 e 0.56±0.01 e 4.70±0.02 c 91.0±1.73 d<br />
MTF 3.75±0.02 a 19.0±0.13 c 0.36±0.00 c 4.66±1.17 c 79.0±5.20 cd<br />
FTF 3.75±0.01 a 27.9±1.09 e 0.57±0.03 e 4.78±0.10 c 68.0±3.06 abc<br />
MTF+RB+CM 80:10:10 3.80±0.03 a 21.3±0.89 d 0.42±0.02 d 4.57±0.04 bc 70.0±1.15 abc<br />
MTF+RB+CM 70:15:15 3.78±0.02 a 17.6±1.18b c 0.33±0.03 bc 3.84±0.27 abc 63.3±6.77 ab<br />
MTF+RB+CM 60:20:20 3.76±0.02 a 14.8±0.51 ab 0.26±0.01 ab 3.57±0.31 abc 77.0±1.73 bc<br />
MTF+RB+CM 50:25:25 3.78±0.01 a 12.6±0.43 a 0.21±0.01 a 2.87±0.09 a 66.7±2.40 abc<br />
MTF+RB 80:20 3.77±0.02 a 14.5±0.25 ab 0.26±0.01 ab 3.20±0.05 a 66.0±3.06 abc<br />
MTF+RB 70:30 3.79±0.02 a 18.5±1.08 c 0.35±0.03 c 3.77±0.13 abc 62.9±8.86 ab<br />
MTF+RB 60:40 3.77±0.00 a 16.0±0.26 b 0.29±0.01 b 3.34±0.15 ab 56.0±2.31 a<br />
MTF+RB 50:50 3.78±0.02 a 13.2±0.93 a 0.23±0.02 a 2.70±0.32 a 58.0±5.29 a<br />
Data are means of three observations ± SE. Means in the same column with the same superscript are not significantly different<br />
(P
167<br />
TECHNICAL REPORTS: INVESTIGATIONS 2009–2011<br />
Survival rate of C. striata was the highest with formulated pellet (91.0%) while the lowest values were<br />
with diets replacing MTF by RB 60:40 and 50:50 (56.0 and 58.0%, respectively). It may be that<br />
snakehead fed by formulated pellet had reduced risk of contact with pathogens in the trash fish.<br />
Compared to results of experiments in phase 1 on C. striata, the survival rate in this experiment was high<br />
in the formulated diet treatment and fairly high in the treatments MTF (79.0%), FTF (68.0%), and<br />
treatments in which MTF was replaced by ingredients (56.0-77.0%).<br />
The lowest FCR was in the FP treatment (1.02) and the highest was in the treatment MTF (6.11) (Table<br />
2.5.4). Otherwise, fish effectively used protein in pellet (2.52) better than that in MTF (0.97). Moreover,<br />
feed cost per kg weight gain of fish was lowest in the pellet treatment (18,900 VND/kg fish). This value<br />
decreased with increasing replacement ratios of MTF by RB or RB and CM. Furthermore, feed cost for<br />
FTF is higher than that for MTF (35,900 and 33,600 VND/kg fish, respectively) because of the high price<br />
of FTF.<br />
Table 2.5.4. Feed conversion ratio, protein efficiency ratio, and feed costs for producing one kg weight<br />
gain of snakehead fed experimental diets (% of wet matter basis) in the experiment 1<br />
Treatments FCR PER<br />
FP (44%CP) 1.02±0.00 a 2.52±0.01 d 18.9<br />
MTF 6.11±0.35 d 0.97±0.06 a 33.6<br />
FTF 4.49±0.34 b 1.45±0.11 bc 35.9<br />
MTF+RB+CM 80:10:10 4.89±0.26 bc 1.33±0.07 b 24.5<br />
MTF+RB+CM 70:15:15 4.60±0.30 b 1.49±0.10 bc 21.8<br />
MTF+RB+CM 60:20:20 4.53±0.47 b 1.70±0.17 c 20.4<br />
MTF+RB+CM 50:25:25 5.77±0.07 cd 1.39±0.02 bc 24.5<br />
MTF+RB 80:20 4.63±0.22 b 1.32±0.06 b 23.6<br />
MTF+RB 70:30 4.33±0.41 b 1.49±0.15 bc 21.2<br />
MTF+RB 60:40 4.40±0.39 b 1.52±0.12 bc 20.7<br />
Feed cost/kg weight gain of fish<br />
(,000 VND/kg fish)<br />
MTF+RB 50:50 4.53±0.28 b 1.50±0.09 bc 20.4<br />
Data are means of three observations ± SE. Means in the same column with the same superscript are not significantly different<br />
(P
TECHNICAL REPORTS: INVESTIGATIONS 2009–2011<br />
Experiment 2<br />
Table 2.5.5. Chemical composition of treatment diets based on wet matter (and dry matter in brackets)<br />
Treatment diets<br />
Moisture<br />
(%)<br />
Crude ash<br />
(%)<br />
168<br />
Crude Protein<br />
(%)<br />
FP (44%CP) (90.0) (11.6) (44.1) (9.50)<br />
Crude Lipid<br />
(%)<br />
MTF 73.1 70.3 (26.1) 16.2 (60.2) 2.5 (9.29)<br />
FTF 70.5 5.78 (19.6) 15.1 (51.3) 6.9 (23.6)<br />
FTF+RB+CM 80:10:10 60.1 4.36 (10.9) 14.9 (37.2) 7.77 (19.5)<br />
FTF+RB+CM 70:15:15 55.1 5.25 (11.7) 14.3 (31.9) 7.83 (17.4)<br />
FTF+RB+CM 60:20:20 51.1 5.45 (11.1) 13.9 (28.5) 8.06 (16.5)<br />
FTF+RB+CM 50:25:25 42.2 5.46 (9.45) 13.0 (22.4) 8.35 (14.5)<br />
FTF+RB 80:20 58.7 6.12 (14.8) 14.5 (35.1) 8.22 (19.0)<br />
FTF+RB 70:30 50.9 6.62 (13.5) 13.3 (27.0) 8.51 (17.3)<br />
FTF+RB 60:40 43.1 7.43 (13.1) 13.2 (23.1) 9.25 (16.3)<br />
FTF+RB 50:50 39.7 7.72 (12.8) 12.9 (21.4) 9.50 (15.8)<br />
The fish fed diets in which FTF was replaced by both rice bran and cassava meal grew faster than those of<br />
diets replaced by only rice bran (Table 2.5.6). The highest growth was in the treatment FTF+RB+CM<br />
80:10:10 (1.58 g.day -1 ) and there was no significant difference (P>0.05) between treatments FTF,<br />
FTF+RB+CM 80:10:10, and FTF+RB+CM 75:15:15 (1.50, 1.58, and 1.53 g.day -1 , respectively).<br />
Table 2.5.6. The growth and survival rate of snakehead fed with different diets<br />
Treatments Wi Wf DWG SGR SR<br />
FP 3.90±0.001 60.0±0.56 e 1.34±0.01 e 6.51±0.02 f 91.0±1.73<br />
MTF 3.91±0.009 63.7±1.35 ef 1.42±0.03 ef 6.65±0.04 fg 86.0±3.46<br />
FTF 3.91±0.006 67.0±0.66 fg 1.50±0.02 fg 6.76±0.02 g 92.0±2.00<br />
FTF+RB+CM 80:10:10 3.91±0.001 70.3±3.55 g 1.58±0.08 g 6.88±0.12 g 92.0±8.00<br />
FTF+RB+CM 70:15:15 3.90±0.002 68.0±1.18 fg 1.53±0.03 fg 6.80±0.04 g 89.3±5.21<br />
FTF+RB+CM 60:20:20 3.91±0.007 46.6±2.64 c 1.02±0.06 c 5.89±0.13 d 82.7±10.4<br />
FTF+RB+CM 50:25:25 3.90±0.004 38.2±1.73 b 0.82±0.04 b 5.42±0.11 c 90.0±5.77<br />
FTF+RB 80:20 3.90±0.004 54.3±0.41 d 1.20±0.01 d 6.27±0.02 e 91.0±1.73<br />
FTF+RB 70:30 3.90±0.003 34.1±1.39 b 0.72±0.03 b 5.16±0.10 b 97.0±0.58<br />
FTF+RB 60:40 3.91±0.008 20.4±0.22 a 0.39±0.01 a 3.94±0.02 a 93.0±2.89<br />
FTF+RB 50:50 3.91±0.007 19.0±0.04 a 0.36±0.00 a 3.77±0.00 a 90.0±3.46<br />
Data are means of three observations ± SE. Means in the same column with the same superscript are not significantly different<br />
(P0.05) between treatments FTF, FTF+RB+CM 80:10:10, FTF+RB+CM<br />
75:15:15, FTF+RB 80:20, and FTF+RB 70:30 (4.33, 4.40, 4.62, 4.23 and 4.21, respectively). Protein in<br />
formulated pellet was the most effectively used (PER = 2.22) while PER was only 0.85 in MTF. In<br />
addition, the lowest feed cost per kg weight gain of fish was in the FP treatment (19,700 VND/kg fish),
169<br />
TECHNICAL REPORTS: INVESTIGATIONS 2009–2011<br />
the highest was in the MTF treatment (47,500 VND/kg fish) and the second lowest feed cost was in the<br />
treatment FTF+RB 70:30 (28,000 VND/kg fish). Compared to results of the experiment 1, feed cost per<br />
kg weight gain of fish fede diets containing FTF (28,000 – 35,300 VND/kg fish) was higher than those<br />
containing MTF (20,400 – 24,500 VND/kg fish) because FTF is had problems of seasonal availability, so<br />
its price was high and fluctuated.<br />
Table 2.5.7. Feed conversion ratio, PER and feed costs for producing one kg weight gain of snakehead<br />
fed experimental diets (% of wet matter basis) in the experiment 2.<br />
Treatments FCR PER<br />
Feed cost/kg weight gain of fish (,000 VND/kg<br />
fish)<br />
FP 1.04±0.00 a 2.22±0.01 d 19.7<br />
MTF 7.31±0.20 e 0.85±0.02 a 47.5<br />
FTF 4.33±0.38 b 1.55±0.15 bc 34.7<br />
FTF+RB+CM 80:10:10 4.40±0.30 b 1.54±0.11 bc 31.1<br />
FTF+RB+CM 70:15:15 4.62±0.19 bc 1.52±0.06 bc 30.5<br />
FTF+RB+CM 60:20:20 5.38±0.52 cd 1.36±0.12 bc 33.0<br />
FTF+RB+CM 50:25:25 5.51±0.10 cd 1.40±0.03 bc 31.2<br />
FTF+RB 80:20 4.23±0.13 b 1.64±0.05 bc 30.0<br />
FTF+RB 70:30 4.21±0.54 b 1.84±0.21 cd 28.0<br />
FTF+RB 60:40 5.79±0.41 d 1.32±0.09 b 35.9<br />
FTF+RB 50:50 6.14±0.07 d 1.64±0.38 bc 35.3<br />
Data are means of three observations ± SE. Means in the same column with the same superscript are not significantly different<br />
(P
TECHNICAL REPORTS: INVESTIGATIONS 2009–2011<br />
Results<br />
Observation and sampling for two practical farms<br />
Data for the two ponds used in this demonstration are given in Table 2.6.1 and Figure 2.6.1<br />
Table 2.5.1. Data of two ponds used for demonstration in Dong Thap province<br />
Parameters Pond<br />
Area (m 2 ) 1300±71<br />
Density (fish.m 2 ) 100±0.0<br />
Initial weight (g.fish) 2.44±0.05<br />
Final weight (g.fish) 562±135<br />
Abnormal rate (%) 5.82±3.99<br />
WG (g) 560±135<br />
DWG (g/day) 3.05±0.84<br />
SR (%) 54.6±1.59<br />
FCR 1.30±0.02<br />
Production (ton) 30.6±6.5<br />
Yield (kg/m 2 ) 22.6±3.63<br />
The result was displayed by mean ± STD<br />
Average of two investigated ponds was 1300 ± 71m2, socking density was 100 fish.m 2 . After 6 months of<br />
stocking, fish weight was 560 ± 135 (g.fish), survival rate was 54.6 ± 1.59 %, abnormal rate was 5.82 ±<br />
3.99 %. FCR was low, 1.30 ± 0.02. Average production was 30.6 ± 6.5 ton and average yield was 22.6 ±<br />
3.63 kg/m 2 .<br />
800<br />
700<br />
600<br />
500<br />
400<br />
300<br />
200<br />
100<br />
0<br />
Weigh (g)<br />
Wi M 1st M 2nd M 3rd M 4th M 5th M 6th<br />
Month<br />
Figure 2.6.1. Growth rate of fish on practical farm demonstrations.<br />
170
171<br />
TECHNICAL REPORTS: INVESTIGATIONS 2009–2011<br />
Total cost was 1.61 ± 0.01 USD/kg fish and total income 2.28 ± 0.03 USD/kg fish, farm gate price. Profit<br />
was 0.67 ± 0.02 USD/kg fish and profit ratio was 41.7 ± 0.80%.<br />
feed cost fingerling cost medicine cost labor cost Other<br />
4.75 4.53 1.82 0.50<br />
88.39<br />
Figure 2.5.2. Division of costs as a percentage of total cost<br />
As in the previous on-farm experiment, the feed cost made up the biggest cost for snakehead culture.<br />
2.7 Study 7: Investigation on the status of commercial pellet usage for cultured snakehead fish<br />
(Channa striata) in An Giang and Dong Thap provinces<br />
Introduction<br />
In the Mekong Delta, snakehead fish is an economically important culture species which was and is<br />
cultured popularly (Nguyen Van Thuong, 2004). There are many snakehead cultured systems commonly<br />
in Mekong Delta, including pond culture, hapa culture, cage culture and nylon tank (Le Xuan Sinh and<br />
Do Minh Chung, 2010). Channa striata and Channa micropeltes are the main culture species in Mekong<br />
Delta at present. Previous studies were performed (Le Xuan Sinh and Do Minh Chung, 2010; Nguyen Thi<br />
Diep Thuy, 2010; Sarowar et al., 2010). These study results illustrated data on the status of culturing<br />
snakehead, comprising of household information, culture skills, economic effectiveness and managing on<br />
feeding, water quality and disease problems as well. Feeding and feed cost were evaluated as a crucial<br />
elements during the culture period. In a study on feed cost, Hien et al. (2009) estimated that feed cost play<br />
a major role in the total cost of culture systems, contributing 50-80% of total expenditures. Snakehead in<br />
the Mekong Delta have been cultured in small scale sytems and “spontaneous systems” (meaning that the<br />
farmer did not follow the provincial plan for aquaculture) (Le Xuan Sinh and Do Minh Chung, 2010)<br />
using trash fish from both freshwater and marine sources as an important source feed However, rapid<br />
development of aquaculture activities resulted in considerable reduction in the availability of trash fish<br />
from the wild. Therefore, commercial pellet feed was developed for feeding cultured snakehead. This was<br />
considered to be an ideal feed because it reduced culture risks by improving feed and water quality and<br />
decreasing the feed cost as well. An investigation on the status of usage of pelleted commercial feed in<br />
the culture of snakehead is necessary.
TECHNICAL REPORTS: INVESTIGATIONS 2009–2011<br />
Methodology<br />
Data collecting<br />
Methods of secondary data collecting: secondary data were collected from the reports of local agencies<br />
and sectors consisting of Fisheries Stations of An Giang and Dong Thap provinces, Department of<br />
Fisheries Resources Management of An Giang and Dong Thap provinces, newspapers and magazines for<br />
aquaculture, websites for aquaculture and relating documentations to aquaculture.<br />
Methods of primary data collecting: primary data were collected by directly interviewing 29 farmers in<br />
An Giang (An Phu, Long Xuyen and Chau Thanh District) and 12 farmers in Dong Thap (Tam Nong, Tan<br />
Hong and Hong Ngu District) by a questionnaireon the farmer’s information, culture skills, custody and<br />
fish health management and status of disease outbreaks as well as economic effectiveness.<br />
Location for survey<br />
Figure 2.6.1: Location for survey<br />
Figure 2.7.1: Map of study site in An Giang and Dong Thap Province<br />
Statistical analysis<br />
Statistical analysis of collected data was done by SPSS for Windows version 13.0 in descriptive statistic<br />
(mean, maximum, minimum, standard deviation) and comparison of means.<br />
Laboratory analysis<br />
The pelleted commercial feeds used in feeding cultured snakehead fish were collected from interviewed<br />
farmers to evaluate the chemical composition of feeds which are used for snakehead culture.<br />
The nutrient compositions in the feed such as moisture, crude protein, crude lipid, crude ash were carried<br />
out using AOAC (2000) methods. Crude protein (Nx6.25) of feed was determined on total nitrogen<br />
determination (Kjeldahl). Crude lipid was defined by Soxhlet method. Crude ash was estimated by<br />
burning samples in a furnace overnight at 560 o C.<br />
172
173<br />
TECHNICAL REPORTS: INVESTIGATIONS 2009–2011<br />
Results<br />
Status of cultured snakehead systems<br />
The investigation results showed that there were 3 systems for culturing snakehead being applied by the<br />
households. The highest proportion (85.4%) of farmers culture snakehead inearthen ponds. The plastic<br />
covering tank system, which constituted 12.2%, was much less and the lowest percentage (2.4%) of<br />
snakehead culture system applied by farmers was hapas in ponds,. In the earthen pond culture system,<br />
commercial pellets have been applied because the amount of trash fish is declining. Moreover, snakehead<br />
fish farmers are moving away from using trash fish to commercial pellets to practice more intensive<br />
culture. However, hapa and plastic-covering snakehead fish culture systems are small scale and farmers<br />
can catch trash fish to feed totheir snakehead. The conclusion is that commercial pellets are applied only<br />
to the snakehead fish earthen pond culture system.<br />
Figure 2.7.2: The types of snakehead fish culture systems in An Giang and Dong Thap Provinces<br />
Snakehead fish culture in earthen pond in An Giang and Dong Thap Provinces<br />
The general information of snakehead fish culture pond in An Giang and Dong Thap Provinces is<br />
illustrated in Table 2.7.1. The information of average area of culture pond in this survey illustrated that<br />
culturing ponds in Dong Thap Province were larger than in An Giang Province, 1314±741 m 2 in<br />
comparison to 941±692 m 2 , respectively. Also, the water depth of culture ponds in Dong Thap Province is<br />
deeper than in An Giang Province, 3.1±1.1 m and 2.8±0.7 m, respectively. Moreover, stocking density is<br />
lower in Dong Thap Province (65.0±43.8 indi/m 2 ) than in An Giang Province (80.7±85.2 indi/m 2 ).<br />
Overall, there is higher survival rate and total production in Dong Thap Province in comparison to An<br />
Giang Province by 6.9% and 21.1 ton, respectively.<br />
Table 2.7.1. Parameters of snakehead fish culture in An Giang and Dong Thap Provinces<br />
Parameters An Giang province Dong Thap province<br />
Area (m 2 ) 940.8±692.2* 1314.2±740.5<br />
Depth (m) 2.8±0.7 3.1±1.1<br />
Stocking density (fish/m 2 ) 80.7±85.2 65.0±43.8<br />
Price (VND) 265.2±80.3 280.8±50.2<br />
Survival rate (%) 71.0±24.9 77.9±13.0<br />
Total production (ton) 21.8±30.4 42.9±32.6<br />
*average±std
TECHNICAL REPORTS: INVESTIGATIONS 2009–2011<br />
Information on commercial pelleted feeds used for snakehead fish culture in An Giang and Dong Thap<br />
Provinces is shown in Table 2.7.2. The four kinds of feed fed to cultured snakehead fish in pond culture<br />
in An Giang and Dong Thap provinces are AquaFeed, Ca Vang, Cargill and UP. However, Cargill was<br />
not fed in Dong Thap and the lowest percentage (6.9%) of Cargill was fed in An Giang province.<br />
Moreover, feed UP was not fed in An Giang, but this feed was fed commonly in Dong Thap province<br />
(75%). The feed for snakehead was a mixture of pellets and trash fish in both provinces (100% of farmers<br />
in Dong Thap Province and 93.1% in An Giang Province used a mixture in the first month). In the period<br />
of the investigation, a problem, humpback, in the fish was noted, showing the incidence of 4.5 ± 7.0% in<br />
An Giang Province and 3.5 ± 5.8% in Dong Thap Province.<br />
Table 2.7.2. Commercial pelleted using for snakehead fish earthen pond culture in An Giang and Dong<br />
Thap Provinces<br />
Parameters An Giang Province Dong Thap Province<br />
Name of feed<br />
AquaFeed (%) 20.7 8.3<br />
Ca Vang (%) 72.4 16.7<br />
Cargill (%) 6.9<br />
UP (%) 75.0<br />
Combined trash-fish & pellet<br />
No (%) 6.9<br />
Yes (%) 93.1 100.0<br />
Reasons 29 12<br />
Fast growth (%) 13.8 16.7<br />
Reducing cost (%) 58.6 50.0<br />
Unavailable of trash-fish (%) 20.7 16.7<br />
Decrease humpback fish (%) 6.9 16.7<br />
Feeding rate (times/day)<br />
2 (%) 10.3 41.7<br />
3 (%) 86.2 58.3<br />
5 (%) 3.4<br />
Feeding method<br />
Direct (%) 96.6 100<br />
Wet form (%) 3.4*<br />
*Some farmers added water to feed 15 minutes before feeding, because they think the commercial feed is too hard to be palatable<br />
to the fish.<br />
Economic analysis of this investigation on snakehead culture was carried out and demonstrated in Table<br />
2.7.4. The total cost and profit were different in different Provinces. The total cost of culture pond in<br />
Dong Thap Province (commercial pellet feed) was lower than in An Giang Province (trash fish feed) by<br />
4,375.8 MVND/ha/crop. Moreover, the result showed higher fixed cost and variable cost in An Giang<br />
Province than in Dong Thap Province, which were 44.5 ± 72.5 and 27.0 ± 36.1 and 14,706.6 ± 8,994.1<br />
and 10,348.3 ± 12,792.4 VND/ha/crop, respectively.<br />
174
175<br />
TECHNICAL REPORTS: INVESTIGATIONS 2009–2011<br />
Table 2.7.4. Cost and structure of cost of snakehead culture in An Giang and Dong Thap provinces<br />
Parameters Trash fish feed (N=29) Commercial pellet feed (N=42)<br />
Total cost (MVND/ha/crop) 14,751.1±9,020.5* 10,375.3±12,803.3<br />
Fix cost (MVND/ha/crop) 44.5±72.5 27.0±36.1<br />
Variable cost (MVND/ha/crop) 14,706.6±8,994.1 10,348.3±12,792.4<br />
Feed (%) 87.8 89.9<br />
Interest (%) 7.1 5.0<br />
Seed (%) 2.5 2.6<br />
Energy (%) 1.5 1.3<br />
Labour (%) 0.7 0.8<br />
Soil sludge out (%) 0.4 0.4<br />
*average±std<br />
Nutrient composition of feeds fed to cultured snakehead<br />
Seven commercial sources of feed fed to cultured snakehead were investigated. Feed samples were<br />
collected from the culture ponds in both survey provinces and were analyzed in the College of<br />
Aquaculture and Fisheries, Can Tho <strong>University</strong>. The results are given in Table 2.7.5. As might be<br />
expected, composition of the diets varied markedly. Levels of crude protein ranged from 26.7-44.5% and<br />
crude lipid ranged from 1.90-7.49%.<br />
Table 2.7.5. Chemical compositions of feeds<br />
Feed Moisture (%)<br />
Crude ash<br />
(%)<br />
Crude<br />
Protein (%)<br />
Crude Lipid<br />
(%)<br />
Crude<br />
Fibre (%)<br />
NFE<br />
1 6.82 13.8 44.5 2.10 2.95 29.8<br />
2 7.16 12.7 35.7 2.34 3.10 39.0<br />
3 7.56 12.8 43.6 7.49 2.75 25.8<br />
4 9.38 11.9 40.5 6.58 2.84 28.8<br />
5 8.78 14.0 39.0 1.90 4.82 31.5<br />
6 8.97 27.3 42.0 6.50 2.70 12.5<br />
7 10.7 12.8 26.7 6.15 7.02 36.7<br />
Comparison in cultured snakehead fed by commercial pellet feed (CF) and trash fish feed (TF)<br />
We conducted a comparison of operations using trash fish as feed and those using commercial pellet feed.<br />
The results of this study are given in Table 2.7.6. The stocking density at farms using CF for feeding<br />
cultured snakehead was lower than that at farms using TF (93±94 compared to 110±105 fish/m 2 ).<br />
Survival was 74.8±16.2% for CF, higher than the 59.1±24.9% observed for TF. FCR value in CF<br />
(1.4±0.3) was lower than in TF (3.9±0.8). As a result, the return on equity of CF was higher than of TF,<br />
showing 0.4±0.7 compared to 0.3±0.3. Therefore, CF system demonstrated an effectiveness in culture<br />
snakehead in pond condition.
TECHNICAL REPORTS: INVESTIGATIONS 2009–2011<br />
Table 2.7.6. Comparison between trash fish feed and commercial pellet feed fed cultured snakehead<br />
Parameters Trash fish feed (N=29) Commercial pellet feed (N=42)<br />
Area (m 2 ) 1,345±605* 1,366±1153<br />
Depth (m) 2.9±0.6 3.0±0.8<br />
Stocking density (fish/m 2 ) 110±105 93±94<br />
Survival rate (%) 59.1±24.9 74.8±16.2<br />
Havested size (g/fish) 743±200 729±215<br />
Total production (ton) 50.7±24.0 39.5±65.1<br />
Yeild (ton/ha/crop) 451±274 293±321<br />
Total of feed (ton/ha/crop) 1,719.8±1,001.5 401.8±498.9<br />
Trash fish (ton/ha/crop) 1,710.8±1,001.5 26.6±32.3<br />
Freshwater trash fish 652.6±981.4 12.2±13.2<br />
Marine trash fish 1,067.1±1,125.6 14.4±19.8<br />
FCR 3.9±0.8 1.4±0.3<br />
Total cost (MVND/ha/crop) 14,751.1±9,020.5* 10,375.3±12,803.3<br />
Fixed cost (MVND/ha/crop) 44.5±72.5 27.0±36.1<br />
Variable cost (MVND/ha/crop) 14,706.6±8,994.1 10,348.3±12,792.4<br />
Income (MVND/ha/crop) 19,250.1±12,907.6 15,762.9±29,250.5<br />
Production cost (1000d/kg) 32.6±6.7 33.8±7.8<br />
Average size (g/fish) 743.1±200.7 728.6±207.6<br />
Price of Selling (1000d/kg) 41.7±5.9 41.2±5.0<br />
Profit (1000d/kg) 7.9±8.2 7.3±<br />
Return on equity 0.3±0.3 0.4±0.7<br />
Loss (%) 20.7 16.7<br />
Profit (%) 79.3 83.3<br />
*average±std<br />
Pond culture for snakehead iss popular in theMekong Delta, showing the highest proportion (85.4%) of<br />
farmers. The lowest percentage was the hapas sytem with 2.4%. The total cost and profit were different in<br />
different provinces, being higher in Dong Thap province than in An Giang province. The nutrient<br />
composition in feeds fed to cultured snakehead was high in protein and lipid proportion, but very variable.<br />
Commercial pellet feed used for feeding cultured snakehead is probably a more sustainable system than<br />
using trash fish, based on results for survival, FCR value and return on equity.<br />
CONCLUSION<br />
1. The results from quality analysis showed that fresh-water trash fish exhibited low TVB-N values on<br />
the day of capture. Three days later, the fresh-water trash fish was still fresh, whereas the marine<br />
trash fish was in stale condition, even though they were still at the distribution site.<br />
2. Giant snakehead start to weaning at 30- 40 day old, replacement rate is 10%/days in 3 days<br />
3. Trial on farm: snakehead fingerlings can be weaned by formulated feed in replacing trash fish in the<br />
rate 10%.day -1 ; the growth of fish and survival rate were not significantly different compared to<br />
100% trash fish use. For giant snakehead, feeding fingerlings with trash fish yielded significantly<br />
higher daily weight gain compared to formulated feed (p0.05).<br />
4. The results confirmed that trash fish can be replaced by formulated feed for snakehead culture. Using<br />
formulated feed for snakehead culture provided significantly higher profit in AnGiang province than<br />
did using trash fish.<br />
176
177<br />
TECHNICAL REPORTS: INVESTIGATIONS 2009–2011<br />
5. The snakehead Channa striata more effectively used trash-fish from freshwater sources compared to<br />
trash-fish from marine sources. Formulated pellet contributed to reduction in the feed cost in<br />
snakehead culturing. Moreover, farmers could utilize available local rice bran and freshwater trashfish<br />
through the diet which is 70% freshwater trash-fish and 30% rice bran. In addition, farmers could<br />
also use diets MTF+RB+CM 60:20:20 or MTF+RB 50:50 for snakehead culturing. These results will<br />
probably be more applicable to farmers in Cambodia than to those in Vietnam.<br />
6. Pond culture in culture snakehead was popular in Mekong Delta, showing the highest proportion<br />
(85.4%) of farmers. The lowest percentage was hapas sytem with 2.4%. Pellet feed using for feeding<br />
cultured snakehead was probably a more sustainable system than using trash fish based on survival,<br />
FCR value and return on equity.<br />
ACKNOWLEDGMENTS<br />
The authors would like to thank Rural Development and Agriculture departments of An Giang and Dong<br />
Thap provinces for data collection and snakehead fingerling nursing sites.<br />
LITERATURE CITED<br />
Adron, J. W., and A. M. Mackie, 1978. Studies on the chemical nature of feeding stimulants for rainbow<br />
trout, Salmo gairdneri Richarson. J. Fish Bio/.,4: 303-310.<br />
Ali, A.J., and H.J. Dumont., 2002. "Rice bran as a diet for culturing Streptocephalus proboscideus<br />
(Crustacea:Anostraca)." Hydrobiologia 486: 249-254.<br />
AOAC, 2000, Official Methods of Analysis. Association of Official Analytical Chemists Arlington.<br />
Appelbaum, S. and P. Van Damme. 1988. The feasibility of using exclusively arti ficial dry feed for the<br />
rearing of Israeli Clarias gariepinus (Burchell, 1822) larvae and fry. J. Appl. Ichthyol., 4, 105-110<br />
Aquacop, G. Cuzon, R. Chou and J. Fuchs, 1989. Nutrition of the Seabass (Lates calcarifer). Advances in<br />
tropical aquaculture Tahiti. 9: 757-763.<br />
Baruah, K., A.K. Pal, N.P. Sahu, and D. Debnath, 2007. Microbial Phytase Supplementation in rohu,<br />
labeo rohita, a diet enhances growth performance and nutrient digestibility. Journal of the World<br />
Aquaculture Society; 38(1): 129-137.<br />
Cao, L., W. Wang, C. Yang, Y. Yang, J. Diana, A.Yakupitiyage, Z. Luo, and D. Li, 2007. Application of<br />
microbial phytase in fish feed. Enzyme and Microbial Technology 40: 497– 507.<br />
Cheng, Z.J., and R.W. Hardy, 2004. Effect of microbial phytase supplementation and dosage on apparent<br />
digestibility coefficients of nutrients and dry matter in soybean product-based diets for rainbow trout<br />
(Oncorhynchus mykiss). Journal of the world aquaculture society 35 (1).<br />
Cremer, M.C., Z. Jian and H.P. Lan, 2001. Cage Production of Japanese Sea bass Weaned From Trash<br />
Fish to Extruded Feed at Sub-Market Size. Results of ASA/China Feeding Trial 35-01-128.<br />
Cremer, M.C., Z. Jian and H.P. Lan, 2001. Cage Production of Red Drum Weaned From Trash Fish to<br />
Extruded Feed at Sub-Market Size. Results of ASA/China Feeding Trial 35-01-127.<br />
Dương Nhật Long, 2004. Giáo trình kỹ thuật nuôi thủy sản nước ngọt<br />
Fermin, A.C., and E.C. Bolivar, 1991. Larval rearing of the Philippine freshwater catfish, Clarias<br />
macrocephalus (Gunther), fed live zooplankton and artificial diet: a preliminary study. Bamidgeh.,<br />
43:87-94.<br />
Goh, Y., and T. Tamura, 1980. Olfactory and gustatory responses to amino acids in two marine teleostsred<br />
sea bream and mulletC. omp. Biochem. Physiol., 66: 217-224.<br />
Hansen, A. C., G. Rosenlund, O. Karlsen, W. Koppe, and G. I. Hemre, 2007. Total replacement of fish<br />
meal with plant proteins in diets for Atlantic cod (Gadus morhua L.) - Effects on growth and protein<br />
retention. Aquaculture., 272: 599-611.<br />
Hecht, T., and S. Appelbaum, 1987. Note on the growth of Israeli sharptooth catfish (Clarias gariepinus)<br />
during the primary nursing phase. Aquaculture., 63:195-204.
TECHNICAL REPORTS: INVESTIGATIONS 2009–2011<br />
Hertrampf, J. W., and F. Piedad-Pascual, 2000. Handbook on ingredients for aquaculture feeds. Kluwer<br />
academic publishers Dordrecht/ Boston/ London, The Netherlands. 573pp.<br />
Hien, T. T. T., D. T. Yen, and L. B. Ngoc, T. L. C. Tu, H. D. Phuong, and L. S. Heng, 2006. Study on the<br />
use of defatted rice-bran in diets for fish culture. Science report in Can Tho <strong>University</strong> 1: 175-183.<br />
Hien, T. T. T., T. V. Nhi, T. L. C. Tu, and N. T. Phuong, 2006. Evaluation Of Different Ingredient<br />
Sources On Culturing Striped Catfish In Cage In An Giang Province - Vietnam (Pangasius<br />
hypothalmus). Science report in Can Tho <strong>University</strong> 1: 158-168.<br />
Hien, T. T. T., T.T. Be, C.M. Lee, and D.A. Bengtson, 2009. Replacement of fish meal with soybean<br />
meal in diets for snakehead, Channa striata. Paper presented at Word Aqualculture Society, Seattle,<br />
Washington, February 15–18, 2009.<br />
Hughes, K.P., and Jr. Soares, 1998. Efficacy of phytase on phosphorus utilization in practical diets fed to<br />
striped bass (Morone saxatilis). Aquaculture Nutrition; 4(2): 133-140.<br />
Hung, L.T., B.M. Tam, P.Cacot and J.Lazard, 1999. Larval rearing of the Mekong catfish, Pangasius<br />
bocourti (Pangasidae, Siluroidei): Substitution of Artemia nauplii with live and artificial feed.<br />
Aquatic Living Resource, 12(3):229-232<br />
Jackson, L.C, H.Li. Meng, and E. H. Robinson, 1996. Use of Microbial Phytase in Channel Catfish<br />
(Ictalurus punctatus) Diets to Improve Utilization of Phytate Phosphorus1. Journal of the World<br />
Aquaculture Society; 27(3): 309-313.<br />
Kerdchuen, N., and M. Legendre, 1994. Larval rearing of an African catfish, Heterobranchus longifilis,<br />
(Teleostei, Clariidae): a comparison between natural and artificial diet. Aquatic Living Resource,<br />
7:247-253.<br />
Lavens, P., and P. Sorgeloos, 1996. Manual on the production and use of live food for Aquaculture. FAO,<br />
Fisheries Technical Paper No. 361. Rome. FAO., 295:283-288.<br />
Lê Thị Tươi, 2010. Nghiên cứu sử dụng cám gạo và mì lát làm thức ăn cho cá lóc giống. Luận văn tốt<br />
nghiệp đại học. 37 trang.<br />
Lê Vinh Phong, 2009. Khả năng sử dụng bột đậu nành thay thế bột cá trong khẩu phần ăn của cá lóc.<br />
Luận văn tốt nghiệp đại học. 23 trang.<br />
Lê Xuân Sinh, 2008. Giáo trình kinh tế thủy sản<br />
Léger, P., D.A. Bengtson, K.L. Simpson, and P. Sorgeloos, 1986. The use and nutritional value of<br />
Artemia as a food source. Oceanogr . Mar. Biol. Ann. Rev, 24:521-623.<br />
Liti, D. M., R. M. Mugo, J. M. Munguti, and H. Waidbacher, 2006. Growth and economic performance of<br />
Nile tilapia (Oreochromis niloticus L.) fed on three brans (maize. wheat and rice) in fertilized ponds.<br />
Aquaculture nutrition.,12: 239-245.<br />
Lưu Vương Khang, 2010. Nghiên cứu sử dụng cám gạo thay thế cá tạp làm thức ăn cho cá lóc giống.<br />
Luận văn tốt nghiệp đại học. 30 trang.<br />
Mackie, A. M, 1982. Identification of the gustatory feeding stimulants. In: Chemoreception in Fishes,<br />
Hara, T.J. (ed.). Elsevier Scientific Publication Co., Amsterdam., 275-291.<br />
Mackie, A. M., and A. I. Mitchell, 1983. Studies on the chemical nature of feeding stimulants for the<br />
juvenile European eel, Anguilla anguilla (L.). J. Fisi. Bio/., 22: 425-430.<br />
Mackie, A.M., and A. I. Mitchell, 1985. Identification of gustatory feeding stimulants for Fish-<br />
Applications in Aquaculture, Nufrition and Feeding in Fisi, 177-1 89.<br />
Martinez J. B., S. Chatzifotis, P. Divanach, and T. Takeuchi, 2004. Effect of dietary taurine<br />
supplementation on growth performance and feed selection of sea bass Dicentrarchus labrax fry fed<br />
with demand-feeders. Fisheries science; 70(1); 74:79.<br />
Mohanta, K. N., S. N. Mohaty, J. K. Jena, and N. P. Sahu, 2006. Apparent protein, lipid and energy<br />
digestibility coefficients of some commonly used feed ingredients in formulated pelleted diets for<br />
silver barb, Puntius gonuonotus. Aquaculture nutrition (12): 211 -218.<br />
Ngô Yến Tuyết, 2009. Khảo sát tình hình nuôi cá lóc thương phẩm ở thành phố Cần Thơ. Luận văn tốt<br />
nghiệp đại học. 81 trang<br />
178
179<br />
TECHNICAL REPORTS: INVESTIGATIONS 2009–2011<br />
Nguyễn Văn Tiến, 2007. Khảo sát tình hình sử dụng thức ăn trên tôm càng xanh (Macrobrachium<br />
rosenbergii) và cá lóc (Ophiocephalus striatus) ở An Giang, Đồng Tháp và Cần Thơ. Luận văn tốt<br />
nghiệp đại học. 70 trang<br />
Nutrient reasearch Council (NRC). Nutrient requirements of fish. Washington, DC: National Acedemiy<br />
Press; 1993, 71pp.<br />
Perschbacher, P., and R. Lochmann, 1999. Effect of feeding Pelleted versus non-pelleted defatted rice<br />
bran on Nile Tilapia Oreocgromis niloticus Production and Water quality in ponds. Asian Fisheries<br />
science., 12: 49-55.<br />
Phan Hồng Cương, 2009. Tình hình sử dụng cá tạp và khả năng sử dụng bột đậu nành trong phối chế thức<br />
ăn chế biến nuôi cá lóc. Luận văn tốt nghiệp cao học. 69 trang.<br />
Phan Văn Dương, 2010. Nghiên cứu sử dụng cám gạo làm thức ăn chế biến cho cá lóc. Luận văn tốt<br />
nghiệp đại học. 18 trang.<br />
Qin, J., A.W.F., 1996. Size and feed dependent cannibalism with juvenile snakehead Channa striatus.<br />
Aquculture 4, 313-320.<br />
Rachmansyah, U., Palinggi, N.N. and Williams, K., 2009. Formulated feed for tiger grouper grow-out,<br />
AquacultureAsia Magazine, pp. 30-35.<br />
Ronyai, A., and A. Ruttkay1990. Growth and food utilization of wels fry (Silurus glanis) fed with tubifex.<br />
Aquacult. Hung. (Szarvas) VI, 193– 202.<br />
Sajjadi, M., and C.G. Carter, 2004. Effect of phytic acid and phytase on feed intake, growth, digestibility<br />
and trypsin activity in Atlantic salmon (Salmo salar, L.). Aquaculture Nutrition; 10(2),: 135-142.<br />
Soltan, M.A., M.A. Hanafy, and M.I.A. Wafa, 2008. Effect of replacing fish meal by a mixture of<br />
different plant protein sources in Nile tilapia (Oreochromis niloticus L.) diets. Global Veterinaria. 2:<br />
157-164.<br />
Sverdrup-Jensen, S. Fisheries in the Lower Mekong Basin: Status and Perspectives. MRC Technical<br />
Paper No. 6. Mekong River Commission, Phnom Penh. 103 pp.<br />
Takeda, M., K. Takii, and K. Matsui, 1983. Identification of feeding stimulants for juvenile eel. Bull.Jap.<br />
Soc. Scient. Fisi., 59: 645-651.<br />
Trần Thị Thanh Hiền & Nguyễn Anh Tuấn, 2009. Dinh dưỡng và thức ăn thủy sản<br />
Trieu, N. V., D. N. Long, and L. M. Lan, 2001. Effects of Dietary Protein Levels on the Growth and<br />
Survival Rate of Snakehead (Channa striatus, Bloch) Fingerling. Development of new technologies<br />
and their practice for sustainable farming in Mekong Delta, Cuu Long rice research institute Omon,<br />
Cantho, Vietnam.<br />
Trương Thủ Khoa và Trần Thị Thu Hương, 1993. Định loại cá nước ngọt vùng đồng bằng sông Cửu Long<br />
Wang, Y., K. Li, H. Han, Z. X. Zheng, and D. P. Bureau, 2008. Potential of using a blend of rendered<br />
animal protein ingredients to replace fish meal in practical diets for malabar grouper (Epinephelus<br />
malabricus). Aquaculture., 281: 113–117.
TECHNICAL REPORTS: INVESTIGATIONS 2009–2011<br />
Assessment of Integrated Pond-Cage System for the Production of Nile<br />
Tilapia for Improved Livelihood of Small-Scale Fish Farmers in Kenya<br />
Sustainable Feed Technology/Experiment/09SFT02PU<br />
Kwamena Quagrainie<br />
Purdue <strong>University</strong><br />
West Layfayette, Indiana, USA<br />
Charles C. Ngugi<br />
Kenyatta <strong>University</strong><br />
Nairobi, Kenya<br />
Sammy Macharia<br />
Ministry of Fisheries Development<br />
Nairobi, Kenya<br />
Kuria Gladys Mwihaki<br />
Moi <strong>University</strong><br />
Eldoret, Kenya<br />
ABSTRACT<br />
The study analyzed the effects of three different stocking densities of tilapia in cages on growth and yield<br />
in an integrated cage-pond system and compared alternate feeding regimens on growth and yield<br />
performance under the three different stocking densities. The costs of producing tilapia at the different<br />
stocking densities and feeding regimens in the integrated system were also compared. The results from<br />
this study indicate that stocking density considerably influences the growth performance, survival, yield<br />
and economic performance of O. niloticus in cages under a cage-cum-pond culture system. The stocking<br />
density of 50 fish m -3 gave the best growth, survival and economic benefits but the lowest yield. This<br />
suggests that a cage-cum-pond culture system of O. niloticus with stocking density of 50 fish m −3 for<br />
larger size of fish in a short period and 100 fish m −3 provide the highest production. Integration of cage<br />
and pond culture therefore increases yield and thus farmers stand a chance of benefiting from two crops in<br />
the same facility. It is recommended that the appropriate stocking density in a cage-cum-pond culture<br />
system for larger fish in a short period of time should be 50 fish m −3 . On the other hand, for higher<br />
production, stocking cages at 100 fish m −3 is recommended.<br />
INTRODUCTION<br />
In the recent past, integrated cage-cum- ponds culture system has been developed and practiced using<br />
combination of catfish-tilapia and tilapia-tilapia (Yi et al., 1996 and Yi, 1997a, Yi 1997b). Integrated<br />
cage-cum- ponds culture is a system in which fish are fed with artificial diets in cages suspended in<br />
ponds, while same species or others low value fish are stocked in open pond water to utilize natural foods<br />
derived from cage wastes. The technique uses the niche optimization concept for feeding; the fish in<br />
cages are fed while those in open waters are either fed at lower rates or not fed at all. Pond fish, therefore,<br />
derive their nutrients from uneaten foods from the cages or from autotrophic and heterotrophic food<br />
chains (Yi et al., 1996). The aim is to rear fish in a cage while the pond fish utilize the uneaten cage feeds<br />
and the plankton generated in the pond to satisfy the bio-energetic needs. In such practices, the nutrient<br />
utilization efficiency could reach more than 50%, compared to about 30% in most intensive culture<br />
systems (Coche 1979). To limit competition for food, raise pond carrying capacity, increase pond fish<br />
180
181<br />
TECHNICAL REPORTS: INVESTIGATIONS 2009–2011<br />
production, higher supply of artificial feed is required. This systems, provides small-scale farmers an<br />
opportunity to use their limited resources to increase fish yield, generate more income.<br />
Rural pond culture in Kenya is moving from subsistence to small-scale commercial culture of fish. The<br />
aquaculture industry is transitioning from the rural subsistence enterprise to commercial profit-oriented<br />
aquaculture business. Small-scale commercial farmers are utilizing improved management practices such<br />
as stocking densities, feeding regimens, and feed nutrient to enhance their economic returns (Quagrainie<br />
et al., 2009). The current major production system is pond culture with an average size of 400m 2 stocked<br />
with Nile tilapia (Oreocrhomis niloticus) and the African catfish (Clarias gariepinus).<br />
Feeding issues appear to be one of the challenges facing Kenyan small-scale commercial farmers. Studies<br />
in Southeast Asia have suggested improvements in growth and yields of Nile Tilapia in integrated cagecum-pond<br />
systems (Yi and Lin, 2001; Yi, Lin and Diana, 1996). The integrated system allows the open<br />
pond water to utilize cage wastes as fertilizers, generating natural food in the pond. The integrated system<br />
is environmentally friendly because less waste nutrients are released to the public water systems.<br />
Profitability from such venture is highly dependent on fish performance in the cage and static ponds. Yi<br />
and Lin (2001) concluded that an appropriate integrated cage-cum-pond system depends on appropriate<br />
stocking densities for tilapia rotation culture. The underlying hypothesis is that greater amount of wastes<br />
from increased biomass in the cages would enhance the productivity in the open ponds. The specific<br />
objectives of this study are:<br />
1. To analyze the effects of three different stocking densities of tilapia in cages on growth and yield<br />
in an integrated cage-pond system<br />
2. To compare alternate feeding regimens on growth and yield performance under the three different<br />
stocking densities.<br />
3. To compare the costs of producing tilapia at the different stocking densities and feeding regimens<br />
in the integrated system<br />
4. Conduct on-farm trials to test integrated cage-pond system technologies developed in this study<br />
and evaluate costs and benefits to local fish farmers through on-farm trials<br />
Hypotheses<br />
1. H0: Different stocking densities have no effect on growth of O. niloticus in cages suspended in static<br />
ponds in an integrated cage-cum-pond culture system.<br />
2. H0: Different stocking densities have no effect on survival rates of O. niloticus in cages suspended in<br />
static ponds in an integrated cage-cum-pond culture system.<br />
3. H0: Different stocking densities have no effect on yield of O. niloticus in cages suspended in static<br />
ponds in an integrated cage-cum-pond culture system.<br />
4. H0: Integrated cage-cum-pond culture system has no effect on the growth and yield of O. niloticus in<br />
the pond.<br />
5. H0: Different stocking densities have no effect on economic benefits of O. niloticus in cages<br />
suspended in static ponds in an integrated cage-cum-pond culture system.<br />
METHODOLOGY<br />
Study Area<br />
The study was conducted at Mwea Aquafish Farm (MAF). The warm water fish farm is located 110km<br />
North East of Nairobi on the Nairobi-Embu highway and 1.5km from Kimbimbi town. The study area<br />
lies at 0˚36.73’S, 37˚22.84’E and 1208m above the sea level. Daily temperatures range from 16.9˚C to
TECHNICAL REPORTS: INVESTIGATIONS 2009–2011<br />
29˚C with cool seasons ranging between 16.9 - 23˚C and warm seasons between 19 - 29˚C. Rainfall<br />
ranges between 18.5mm – 223mm in rainy months and 0mm in dry months.<br />
Experimental Design<br />
The study was done in a 1300m 2 earthen pond using 9 cages each with a volume of 1 m 3 . The cages had a<br />
frame made from 2-inch diameter PVC pipes covered with a 1-inch netting material. The tubing of the<br />
upper frame was completely sealed to offer a self-floating mechanism, while the lower frame was<br />
perforated to allow it to sink once water filled the tubing. Floating feed rings with a diameter of 50cm<br />
made from flexible 15mm PVC tubing were installed to minimize the amount of floating feeds that would<br />
slip out of the sides of the cage during feeding.<br />
Hand sexed male O. niloticus fingerlings (Mean weight 65.57g ± 0.766; Total length 15.74cm ± 0.076)<br />
and O. niloticus fry from the M.A.F. hatchery were stocked in the cages and the open pond water<br />
respectively (the pond was stocked six weeks after stocking of cages). Fish were reared for a period of<br />
180 days with close monitoring and sampling between 2 nd September, 2010 and 2 nd March, 2011. Cages<br />
were randomly allotted three treatments and stocked at varying densities of 50, 75 and 100 fish per m 3 .<br />
Each treatment had three replicates to increase data accuracy and reduce cases of bias. Fish were fed with<br />
commercial floating feeds.<br />
Feeding was done through hand feeding to caged fish at 4% body weight for the first month and reduced<br />
as the fish grew to 1.5 in the sixth month. Fish were fed twice a day at 10.00 hrs and 16.00 hrs. Fish in the<br />
experimental pond were not fed with the commercial diet but browsed on the plankton material in the<br />
pond; however, they were allowed to feed on feeds that slipped from the sides of the cages. Feeds were<br />
adjusted every month based on calculated biomass.<br />
The experimental pond was stocked with 4m -2 O. niloticus as is the practice by small scale commercial<br />
fish farmers for static pond culture in this region. Prior to stocking, the pond was fertilized with 20kgN<br />
ha -1 wk -1 and 5kg P ha -1 wk -1 using Urea and Di-ammonium phosphate (DAP); which is a standard<br />
procedure. After 30 days, the rate of Urea application was lowered to 10kgN ha -1 wk -1 as measures to<br />
correct ammonia build up in the pond. Due to evaporation and pond seepage, the pond was topped up<br />
every two weeks to maintain the water level at 1.3m.<br />
Sampling<br />
Dip and seine nets were used to sample fish in cages and in the pond respectively. 30 fish from every cage<br />
and 100 from the open pond were sampled during each sampling occasion. On completion of the<br />
experiment, all fish were harvested from both the cages and the experimental pond. Their mean weights<br />
were recorded and their yields computed. Plankton net was used to sample plankton in the pond. Stomach<br />
content analysis of fish (both from the cages and from the pond) was also done.<br />
At the end of the experiment, fish were harvested using repeated netting, and total yield determined.<br />
Minitab statistical software was used for analysis. The effects of the three stocking densities on growth,<br />
survival, yield performance and economic benefits were analysed using Ordinal Logistic Regression with<br />
time in months as the response variable and the different stocking densities and the factors. ANOVA was<br />
also used to test significance differences among the treatments. The following parameters were calculated<br />
as indicated. Mortalities were recorded as they occurred. Their numbers were also determined by counting<br />
the remaining fish in the cages at each sampling date.<br />
A full enterprise budgeting analysis was used to compare the relative profitability of the different stocking<br />
densities by estimating all income and expenditures of each treatment.<br />
182
183<br />
TECHNICAL REPORTS: INVESTIGATIONS 2009–2011<br />
Dissolved oxygen (DO), temperature and pH were measured in situ twice a week. DO and temperature<br />
were measured using DO meter (model: YSI 550A) while pH was measured using a pH meter (model: HI<br />
98127). Water samples were also collected monthly in the morning and afternoon from the pond between<br />
0800 and 1800 h for analysis of nitrite-nitrogen (NO2-N), total nitrogen (TN), soluble reactive phosphorus<br />
(SRP), and total phosphorus (TP). All the analyses were conducted following the standard analytical<br />
procedures detailed in Boyd and Tucker (1992).<br />
RESULTS<br />
Fish Growth<br />
The overall growth performance attributes of O. niloticus in cages are presented in Table 2. The stocking<br />
weights of O. niloticus among the treatments were statistically similar (p=0.992). The same case applied<br />
for the stocking weights (p=0.995). After the study period of 180 days, the largest fish in cages weighed<br />
590g recorded in fish stocked at 50 fish m -3 as shown in Table 2 while the smallest fish was found in the<br />
treatment with the highest stocking density of 100 fish m -3 weighing 180g. Fish reared at the lowest<br />
stocking density were more uniform in sizes during harvest; however, fish reared at the highest stocking<br />
density were less uniform despite being stocked at the same size.<br />
The SGR of fish stocked at 50 fish m -3 was higher than that of fish stocked at 75 fish m -3 as well as those<br />
stocked at 100 fish m -3 which showed the lowest SGR. The condition factor of fish stocked at 50 fish m -3<br />
was higher than observed in the other two treatments with fish stocked at 100 fish m -3 having the least<br />
condition factor. Fish stocked at 100 fish m -3 had the highest total yield as compared to the other two<br />
treatments.<br />
Mean length of fish stocked at 50 fish m -3 was higher as compared to the other two treatments. Fish<br />
stocked at 100 fish m -3 had the least length as shown in figure 1. The same was observed for the mean<br />
weight. Both the lengths and the weights showed a statistical significant difference (p=0.000).<br />
There was a significance difference (p = 0.000) in the growth of fish among the different treatments. Both<br />
the weights and the lengths showed this difference. As shown in figure 2, fish stocked at 50 fish m -3 had<br />
the best growth as compared to the other two treatments. After the first month, the lengths of O. niloticus<br />
among the treatments showed no significance difference (p=0.434) as did the weights (p=0.854). At the<br />
second month, the length of fish stocked at 50 fish m -3 showed statistical difference (p=0.000) from the<br />
rest, however, the lengths of fish stocked at 75 fish m -3 and 100 fish m -3 still remained statistically similar<br />
(p=0.833). The same was observed in weights between fish stocked at 75 fish m -3 and 100 fish m -3<br />
(p=0.212). At the third month, all treatments showed statistical difference (p=0.000) which was<br />
maintained to the end of the experiment.<br />
Table 1: A summary of the various experimental parameters (Mean ± SE)<br />
Growth parameter 50 fish m -3<br />
75 fish m -3 100 fish m -3<br />
Stocking Length (cm) 15.72 ± 0.12 a<br />
15.74 ± 0.13 a 15.74 ± 0.15 a<br />
Stocking Weight (g) 65.47 ± 1.07 a 65.59 ± 1.24 a 65.67 ± 1.65 a<br />
Mean Harvest Length (cm) 25.57 ±0.137 a 24.03 ± 0.139 b<br />
23.15 ± 0.156 c<br />
Mean Harvest Weight (g) 360.00 ± 7.34 a 281.28 ± 4.73 b 247.94 ± 4.64 c<br />
Harvest maximum Length (cm) 30.0 26.8 26.4<br />
Harvest minimum Length (cm) 23.0 21.1 20.3<br />
Harvest maximum Weight (g) 590.0 390.0 350.0<br />
Harvest minimum Weight (g) 260.0 200.0 180.0
TECHNICAL REPORTS: INVESTIGATIONS 2009–2011<br />
Growth parameter 50 fish m -3<br />
184<br />
75 fish m -3 100 fish m -3<br />
Mean Yield (kg) 17.35 a<br />
18.58 a<br />
20.91 b<br />
SGR (% day -1 ) 0.41<br />
0.35<br />
0.32<br />
FCR 1.9 a<br />
2.6 b<br />
3.1 c<br />
Condition factor 2.15 a<br />
2.03 b<br />
2.00 c<br />
Survival (%) 96.67 a<br />
89.78 b 83.00 c<br />
NB: For every parameter and treatment, means with different letters as superscripts are statistically different.<br />
Figure 1: Total Length (Mean ± SE) for each<br />
treatment<br />
Figure 2: Total Length of fish over a period of<br />
6 months for the three treatments.<br />
The SGR of fish in all treatments had a continued decline. Reduction in the SGR was highest in fish<br />
stocked at 100 fish m -3 and lowest in fish stocked at 50 fish m -3 with fish stocked at 75 fish m -3 remaining<br />
as the intermediate. These trends were maintained throughout the experimental period. The SGR<br />
corresponded to cage biomass such that, as the cage biomass increased, SGR continually declined towards<br />
stagnation.<br />
At a stocking density of 50 fish m -3 , the general equation of Log W versus Log L indicated a slope (b)<br />
value of 3.3191; a slope of 2.7734 for the fish stocked at 75 fish m -3 ; and 2.6689 for fish stocked at 100<br />
fish m -3 . This shows a decrease in the slope as the stocking density increased. The lowest stocking<br />
density of 50 fish m -3 had the highest condition factor (K) as compared to fish stocked at 75 and 100 fish<br />
m -3 . The fish stocked at 100 fish m -3 had the lowest condition factor.<br />
Food Conversion Ratio of O. niloticus stocked in cages suspended in a pond decreased with decrease in<br />
stocking density. Fish stocked at 100 fish m -3 had the highest FCR of 3.1 followed by fish stocked at 75<br />
fish m -3 with FCR of 2.6 and finally fish stocked at 50 fish m -3 had the least FCR of 1.9 as shown in figure<br />
3. FCR among the three different treatment was statistically different (P= 0.000).
FOOD CONVERSION RATIO<br />
3.5<br />
3.0<br />
2.5<br />
2.0<br />
1.5<br />
1.0<br />
0.5<br />
0.0<br />
50 Fish m-3 75 Fish m-3 100 Fish m-3<br />
TREATMENT<br />
Figure 3: FCR of O. niloticus reared in cages<br />
suspended in a pond under 3 different stocking<br />
densities.<br />
185<br />
TECHNICAL REPORTS: INVESTIGATIONS 2009–2011<br />
Figure 4: Percentage Survival of O. niloticus in<br />
cages under three different stocking densities<br />
Fish Survival<br />
Percentage survival of O. niloticus stocked in cages suspended in a static-water pond increased with a<br />
decrease in the stocking density. Fish stocked at 50 fish m -3 had the highest survival rate of 96.67%<br />
followed by fish stocked at 75 fish m -3 at 89.78% and finally 100 fish m -3 with the least survival rate at<br />
83.00% as shown in figure 7. Mortalities were first experienced on the fifth day when feeding started and<br />
remained high for the first two weeks before the fish acclimatised to the new environment. Mortalities<br />
were also experienced after every sampling occasion.<br />
Yield<br />
Yields of fish increased with increase in the stocking density. The highest stocking density (100 fish m -3 )<br />
yielded higher than treatments where fish were stocked at 50 and 75 fish m -3 . Fish stocked at 50 fish m -3<br />
had the lowest yield as shown in figure 5. Mean yield of fish stocked at 100 fish m -3 had a significance<br />
difference (p=0.000) from the other two treatment. Mean yields of fish stocked at 50 fish m -3 and 75 fish<br />
m -3 showed no significance difference (p=0.050).<br />
Figure 5: Mean yield of O. niloticus stocked in cages at different stocking densities.
TECHNICAL REPORTS: INVESTIGATIONS 2009–2011<br />
Pond Fish<br />
Fish in ponds ranged in their weights between 1g and 190.0 g. They showed division in five classes which<br />
included fish between below 6g (fry – 28,500); 6.6 – 38.7g (3751 pieces); 43.9 – 69.4 g (1386 pieces);<br />
71.70 – 98.9g (342 pieces); and 103.9g – 190.0g (151 pieces) as shown in table 2.<br />
Plankton Composition<br />
Both the phytoplankton and zooplankton were available in the pond water where the cages were<br />
suspended. Phytoplankton dominated with Volvox spp (60%) as the dominant species found. Others<br />
include: Scenedesmus, Pandorina, Aphanocapsa, Tetraedron, Euglena spirogyra. Zooplankton were<br />
dominated by Daphnia spp (55%); others include: Flagaria capucina, Nauplius<br />
Table 2: A table showing the various classes of fish harvested in the pond<br />
Minimum Maximum Mean<br />
Class TL (cm) WT (g) TL (cm) WT (g) TL (cm) WT (g) Yield (kg)<br />
6 - 40g 7.00 6.60 13.30 38.70 10.32 21.47 80.53<br />
40-70g 13.10 43.90 16.20 69.40 14.63 55.47 76.88<br />
70 – 100 g 15.50 71.70 19.00 98.90 16.79 87.73 30.00<br />
> 100g 18.5 103.90 22.30 190.00 19.47 129.31 19.53<br />
Stomach Content Analysis<br />
Analysis of the stomach content of fish in cages for the three different stocking densities (i.e. 50, 75 &<br />
100 fish m -3 ) showed that fish in cages, highly depended on the commercial feed given to them with<br />
percentages of 95%, 93% and 93% respectively. On the other hand, fish in the open pond, consumed 88%<br />
plankton material and 12% commercial feed.<br />
Table 3: Mean, Min and Max water quality parameters measured during the study period.<br />
PARAMETER MEAN ± SE MINIMUM MAXIMUM<br />
Dawn DO (mg l -1 ) 3.023 ± 0.0496 1.9900 3.5600<br />
Evening DO (mg l -1 ) 6.827 ± 0.0998 5.2200 8.4400<br />
Dawn pH 8.279 ± 0.0232 7.9000 8.7000<br />
Evening pH 8.815 ± 0.0222 8.4000 9.3000<br />
Dawn Temperature (ᵒC) 22.750 ± 0.111 21.100 24.300<br />
Evening Temperature (ᵒC) 26.798 ± 0.111 25.000 28.800<br />
Total phosphorous (mg l -1 ) 0.085 ± 0.0034 0.0800 0.1000<br />
SRP (mg l -1 ) 0.036 ± 0.0008 0.0330 0.0390<br />
Total nitrogen (mg l -1 ) 0.287 ± 0.0061 0.2700 0.3100<br />
NO2-N (mg l -1 ) 0.009 ± 0.0004 0.0080 0.0110<br />
186
187<br />
TECHNICAL REPORTS: INVESTIGATIONS 2009–2011<br />
Water Quality Parameters<br />
The water quality parameters in the pond where the cages were suspended remained within the tolerable<br />
ranges for the optimal growth of O. niloticus as shown in table 3.<br />
Economic Benefits<br />
Returns decreased with increase in stocking density. The highest stocking density (100 fish m -3 ) had the<br />
lowest returns as compared to the other two treatments where fish were stocked at 50 and 75 fish m -3 . Fish<br />
stocked at 50 fish m -3 had the highest returns as shown in figure 6. Mean returns of fish stocked at 50 fish<br />
m -3 had a significance difference (p=0.003) from the other two treatment. However, mean returns of fish<br />
stocked at 75 fish m -3 and 100 fish m -3 showed no significance difference (p= 0.735). Fish from the pond<br />
Figure 6: Mean returns accrued from the different stocking densities<br />
were sold at different prices depending on their size. Fish above 120g were sold as broodstock. Individual<br />
cost and revenue are shown in Tables 4. Enterprise budget for O. niloticus stocked at 100 fish m -3 shown<br />
in Table 5.<br />
On-Farm Trials<br />
Preparatory contacts with farmers in Central Province – Kenya began immediately after the research work<br />
on cage-cum-pond culture started. Three groups of farmers were identified i.e. Ruiru Youth for<br />
Development and Environment Conservation group – Thika; Rugita Youth Development group – Kikuyu;<br />
and Karunda Whiteland Youth Development Group – Nyeri. A workshop to introduce the farmers to cage<br />
culture was held on 16th October, 2010 at Mwea Aquafish Farm. Farmers were taught the importance of<br />
cage culture, cage construction, site selection for placement of the cages, feeding, record keeping, and<br />
stocking densities among other cage management practices. They were also introduced to pond<br />
management practices. In addition to the farmers who participated in the workshop, extension officers,<br />
<strong>AquaFish</strong> <strong>CRSP</strong> personnel, Mwea Aquafish Farm staff and a student involved in the cage culture research<br />
work were involved. A more intensive training was conducted from 23rd November to 5th December,<br />
2010 at Mwea Aquafish Farm where two farmers from each group attended. During this training, the<br />
farmers constructed cage frames and also learnt how to make a complete cage. After the training, farmers<br />
were given materials for cage construction which they started from 6th December, 2010 at their respective<br />
sites. Each group constructed six cages.
TECHNICAL REPORTS: INVESTIGATIONS 2009–2011<br />
On-farm trials of cages in ponds and of cages in dams were conducted by the group members between<br />
December 2010 and July 2011. A post-trial workshop was held on 8 th July, 2011 at MAF. The three<br />
groups of farmers participated in the workshop, along with extension officers who have been working<br />
with the various groups, <strong>AquaFish</strong> <strong>CRSP</strong> personnel, MAF staff, representatives from the Ministry of<br />
Youth Affairs, and a student involved in the cage culture research work.<br />
Each group made a presentation of how they have progressed in cage farming, their experiences in fish<br />
farming and the challenges they are facing. Farmers were given a chance to ask questions and discuss the<br />
impacts they have had on the community around them.<br />
Challenges faced<br />
Twiga dam<br />
o High fish mortalities<br />
o Theft of fish<br />
o Accessibility of the cages – inefficient boat<br />
o Uncommitted members<br />
o Poor record keeping<br />
Gathathi-ini dam<br />
o Accessibility of the cages – inefficient boat (heavy)<br />
o Uncommitted members<br />
o Insufficient funds<br />
o Destruction of hapa nets by predators (leading to loss of fish)<br />
o High water turbidity<br />
Rungiri dam<br />
o Uncommitted members<br />
o Water resource conflict<br />
o Poor security<br />
o Drug trafficking by the community within the vicinity of the dam<br />
o Crime (Murder and suicide) – dumping of murdered people in the dam<br />
o Leadership problem (which is now resolved)<br />
DISCUSSION<br />
Fish Growth<br />
Growth trends of fish in this study indicated that there was uniform growth pattern in length and weight<br />
of fish stocked at the three different densities for the first month of the rearing period. This could be<br />
attributed to the fact that fish transferred to a new environment take time to acclimatize. This condition,<br />
however, changed in the subsequent months based on the different stocking densities. The growth<br />
performance of tilapia is significantly related with the stocking density of the fish (Chakraborty et al.,<br />
2010).<br />
In this study, the growth of O. niloticus in cages was found to be density dependent with increased<br />
stocking density having a negative effect on final mean body weight, final mean total length, SGR, FCR<br />
and condition factor. Similar observations were made by Yi and Lin (2001), where increased fish biomass<br />
of Nile tilapia in cages has a significant negative effect on the final mean body weight. Increased rearing<br />
density negatively affected the mean body weight, final mean total length, SGR and weight gain of O.<br />
niloticus fry reared in glass tanks (Opiyo, 2010). This is in agreement with previous studies by: Yi et al.,<br />
188
189<br />
TECHNICAL REPORTS: INVESTIGATIONS 2009–2011<br />
(1996); Gibtan et al., (2008); Mokoro, (2008). However, some researchers have found out a positive<br />
effect on growth of fish with increased stocking densities (Baker and Ayles, 1990; Petit et al., 2001).<br />
Table 4: Enterprise budget for O. niloticus in a cage-cum-pond culture system<br />
Item Number Unit<br />
Cost / unit<br />
(Kshs.)<br />
Total cost<br />
(Kshs.)<br />
Total cost<br />
(US$)<br />
Revenue<br />
Cage fish 170.52 kg 300 51156 639.45<br />
Pond fish 7 - 40g 3751 piece 15 56265 703.31<br />
Pond fish 40 – 70g 1386 piece 40 55440 693.00<br />
Pond fish 70 - 100g 342 piece 80 27360 342.00<br />
Pond fish > 100g 151 piece 200 30200 377.50<br />
Fry 28500 piece 7 199500 2493.75<br />
Total revenue<br />
Costs<br />
Variable costs<br />
419921 5249.01<br />
Fingerlings 675 piece 15 10125 126.56<br />
Fry 5200 piece 5 26000 325.00<br />
Feed 322.96 kg 60 19377.41 242.22<br />
Labor<br />
Fertilizer<br />
23 man/8hr 200 4600 57.50<br />
Urea 10.4 kg 50 520 6.50<br />
DAP 2.6 kg 60 156 1.95<br />
Fuel 23 Litres 100 2300 28.75<br />
Total variable costs (TVC)<br />
Fixed costs<br />
63078.41 788.48<br />
Cage rent 9 Piece 750 6750 84.38<br />
Pond rent 6 Month 500 3000 37.50<br />
Total fixed costs<br />
9750 121.88<br />
Total costs (TC)<br />
72828.41 910.36<br />
Net returns above TVC<br />
356842.59 4460.53<br />
Net returns above TC<br />
347092.59 4338.66<br />
The observed final mean body weight and final mean total length in this study were poor in the high<br />
stocking density of 100 fish m -3 . The lower growth performance of tilapia at higher stocking density could<br />
have been caused by voluntary appetite suppression, more expenditure of energy because of intense<br />
antagonistic behavioural interaction (Chakraborty et al., 2010), competition for food and living space<br />
(Diana et al., 2004) and permanent stress caused by crowding (Ellis et al., 2002). Boujard et al., (2002)<br />
also reported that appetite of fish can be impaired by increase in density. High stocking densities impair<br />
visual location of food by making it difficult for fish to follow a trajectory towards the food pellets (Silva<br />
et al., 2000) and might have prevented the physical access of pellets by the fish stocked at 100 fish m -3 .<br />
Poor feeding might also explain the poor performance of fish stocked at high density.
TECHNICAL REPORTS: INVESTIGATIONS 2009–2011<br />
Table 5: Enterprise budget for O. niloticus stocked at 100 fish m -3<br />
Unit Cost Total cost Total cost<br />
Item<br />
Revenue<br />
Quantity Unit (Kshs.) (Kshs.) (US $)<br />
Cage Fish 20.91 kg 300 6272.00 78.40<br />
Total revenue<br />
Costs<br />
Variable costs<br />
6272.00 78.40<br />
Fingerlings 100 piece 15 1500.00 18.75<br />
Feed 43.64 kg 60 2618.36 32.73<br />
Labor<br />
383.33 4.79<br />
Fertilizer<br />
16.00 0.20<br />
Fuel<br />
Total variable costs<br />
144.44 1.81<br />
(TVC)<br />
Fixed costs<br />
Kshs.<br />
4662.13 58.28<br />
Cage rent<br />
750.00 9.38<br />
Pond rent<br />
83.33 1.04<br />
Total fixed costs<br />
Kshs./US $<br />
833.33 10.42<br />
Total costs (TC)<br />
Kshs./US $<br />
5495.46 68.69<br />
Net returns above TVC<br />
Kshs./US $<br />
1609.87 20.12<br />
Net returns above TC<br />
Kshs./US $<br />
776.54 9.71<br />
Breakeven price (BEP)<br />
Kshs./US $<br />
155.29 1.94<br />
Breakeven yield (BEY)<br />
kg<br />
10.82<br />
The fish attained the highest length and achieved maximum body weight when reared at 50 fish m -3 . This<br />
could be due to the fewer fish per unit space (Sahoo et al., 2004) in the cages. Similar results were<br />
reported by Gibtan et al., (2008) who recommended 50 fish m -3 as the optimal stocking density of O.<br />
niloticus in cages in Lake Kuriftu in Ethiopia. The average weight for the low stocking density at harvest<br />
was 360g. The weights obtained in this study confirm the results obtained in experiments conducted at<br />
IAAS which showed that intensive culture of Nile tilapia in cage within pond with feeding can efficiently<br />
produce large fish (250-300 g) (Shrestha, 2002). In spite of rearing the fish in cages for 180 days, they did<br />
not attain an average weight of 500g which was reported by Yi et al., (1996) within a period of 90 days.<br />
This could have resulted from poor quality feeds as the diet used in this study had 17% crude protein<br />
which was lower than the recommended 28 - 32% CP for Tilapia above 25g (McGinty and Rakocy, 1989;<br />
Ofori et al., 2009).<br />
Fish stocked at a high density were less uniform in sizes during harvest despite being stocked at the same<br />
size. Among other factors the food accessibility is one of the most difficult parameter to set identical for<br />
each fish when density increases (Boujard et al., 2002). This could probably be the reason for the varied<br />
sizes in fish stocked at a high density of 100 fish m -3 .<br />
Specific growth rate of O. niloticus in cages under the current study was density dependent with low<br />
stocking density performing better than the other two treatments. The trend in this parameter over the<br />
190
191<br />
TECHNICAL REPORTS: INVESTIGATIONS 2009–2011<br />
180-day period showed reduction with increase in biomass after the second month. However, despite this<br />
reduction, low stocking density maintained the highest SGR throughout the study. The high SGR<br />
observed in low stocking density could be attributed to by better accessibility of feeds due to adequate<br />
space.<br />
The regression coefficient (r) for length-weight relationship of O. niloticus in cages for the three different<br />
stocking densities was high (above 80%). This indicates that the weight of fish increases with increase in<br />
length. The length-weight relationship within a species differs according to the robustness of individual<br />
fish, however, similar findings have been reported in previous studies on different fish species by: Layèyè<br />
(2006), Ayoade and Ikulala (2007); Ndimele et al., (2010). The condition factor for O. niloticus in cages<br />
was greater than 1 for all the treatments and this shows that all fish were above average condition. The<br />
low stocking density had the highest condition factor as compared to the other two treatments. The<br />
observed condition might have been caused by the low density of fish in the cage thus better feeding<br />
conditions, good appetite, reduced competition for space and reduced stress. Similar findings were<br />
reported by Mokoro, (2008).<br />
In this study, FCR was density dependent and higher stocking density resulted to significantly higher<br />
FCR compared to the low stocking density. High FCR is an indicator of low food efficiency and has been<br />
attributed to the decreasing efficiency in searching for food, poor water quality (Abou et al., 2007) and<br />
impaired visual location of food (Silva et al., 2000). This finding confirms observations made by Gibtan<br />
et al., 2008; Opiyo, 2010. However, some authors (Yi et al., 2005; Osofero et al., 2009) have reported no<br />
significant difference on FCR. In this study, fish were fed to satiation since the amount of feed given to<br />
the fish was based on the rearing density. Therefore, the higher FCR at 100 fish m -3 could be attributed to<br />
lower growth rates (Yi et al., 1996), poor feeding and poor appetite. Another probable reason is the fact<br />
that overcrowding resulted to stress thus food consumed was used to curb stress instead of being<br />
converted to somatic growth. FCR in this study was lower than that reported by Gibtan et al., 2008 of up<br />
to 7.22 in a study to evaluate the effect of stocking density on the growth performance and yield of Nile<br />
tilapia in a cage culture system in Lake Kuriftu, Ethiopia.<br />
Fish Survival<br />
The highest stocking density had the lowest percentage survival indicating that survival rate is density<br />
dependant which confirms observations made by Huang and Chiu, (1997). This agrees with findings of<br />
other fish as illustrated by Aksungur et al., (2007) who reported that stocking density had a significant<br />
effect on survival rates of turbot. However this contradicts findings by other authors (Yi et al., 2005;<br />
Abou et al., 2007; Gibtan et al., 2008; Osofero et al., 2009) who noted that survival of O. niloticus was<br />
not density dependent. The reduced survival rate at high stocking density might have been caused by the<br />
crowding of fish stocked at 100 fish m -3 which caused stress and voluntary appetite suppression. This<br />
might have had a negative effect on the immune system thus the high mortalities. Another probable<br />
explanation for the high mortalities in the highly stocked cages is the intense antagonistic behavioural<br />
interaction (Chakraborty et al., 2010) which might have increased stress in the fish.<br />
Mortalities were first experienced on the fifth day which coincided with the introduction of supplemental<br />
feeds. Increased metabolic rate due to feeding might have been the cause of the mortalities. Mortalities<br />
remained high for the first two weeks. This is because fish were not yet acclimatised to the new<br />
environment. Another cause could be handling during stocking. Survival of fish has a significant role to<br />
play in increasing the revenue and thus profitability of a culture unit and according to Ofori et al., (2009),<br />
extreme care must be taken in transportation, holding and handling of fish to avoid heavy mortalities.<br />
Mortalities were also experienced after every sampling occasion. This could have resulted from handling<br />
during sampling which increased stress in fish and led to mortalities. Percentage survival in all treatments<br />
was above 80% and higher than that reported by Ofori et al., (2009) of 30% but lower than that reported<br />
by Osofero et al., (2009) of 98.5 – 99.5%.
TECHNICAL REPORTS: INVESTIGATIONS 2009–2011<br />
Yield<br />
In this study, highest yields were recorded in the high stocking density. This indicates that yield is density<br />
dependant. Similar findings were reported by Gibtan et al., (2008). Yield was high in the high stocking<br />
density due to the high number of fish in the cage as compared to the other stocking densities.<br />
Additional yield was obtained from the pond which added to the revenue accrued from the cages.<br />
Fish stocked in the pond showed differentiation in sizes during harvest. This might have been caused by<br />
the fact that some fish are fast growers. Another probable reason could have been recruitment. Fish in the<br />
pond showed high recruitment since the fish stocked in the pond were mixed sex. Production of fish from<br />
the two systems i.e. pond and the cages, can help the farmers to stay in production throughout the year.<br />
This can be achieved by stocking the fast growers from the pond in the cage once those in cages attain<br />
market size and since there is recruitment in the pond, continued cycle is guaranteed. From this culture<br />
system, farmers can diversify in their final products such that they can sell both table size fish and<br />
fingerlings to other farmers at the same time.<br />
Water Quality<br />
Measured water quality parameters i.e. D.O., pH, temperature, total phosphorus, SRP, total nitrogen and<br />
NO2-N were within the optimal limits for the growth of O. niloticus as recommended by Popma and<br />
Masser, (1999). Therefore, the growth rates recorded were not affected by the water quality.<br />
Economic Benefits<br />
The highest returns were recorded in the low stocking density i.e. 50 fish m -3 in spite of the low yield and<br />
revenue accrued from this treatment. This might have been as a result of the low amount of feeds and<br />
fingerlings used in this stocking density as compared to the other two treatments. Returns decreased with<br />
increase in stocking density indicating a negative relationship. Breakeven price and breakeven yield<br />
increased with increase in stocking density. This could have resulted from the increased variable costs as<br />
the stocking density increased. This clearly shows the efficiency of the low stocking density.<br />
REFERENCES<br />
Abou, Y., E. D. Fiogbe and J. Micha. (2007). Effects of stocking density on growth, yield and<br />
profitability of farming Nile tilapia, Oreochromis niloticus L., fed Azolla diet, in earthen ponds.<br />
Aquaculture Research 38: 595 – 604.<br />
Aksungur, N., M. Aksungur, B. Akbulut and İ. Kutlu. (2007). Effects of Stocking Density on Growth<br />
Performance, Survival and Food Conversion Ratio of Turbot (Psetta maxima) in the Net Cages on the<br />
South-eastern Coast of the Black Sea. Turkish Journal of Fisheries and Aquatic Sciences, 7: 147-152<br />
Ayoade, A. A. and A. O. O. Ikulala. (2007). Length-Weight relationship, Condition factor and stomach<br />
content of Hemichromis bimaculatus, Sarotherodan melanotheron and Chromidotilapia guentheri<br />
(Perciformes: Cichlidae) in Eleiyele Lake, Southwestern Nigeria. International Journal of Tropical<br />
Biology, 55 (3-4): 969-977.<br />
Baker, R. F. and G. B. Ayles. (1990). The effect of varying density and loading level on the growth of<br />
Arctic charr (Salvelinus aspinus and rainbow trout (Oncorhynchus mykiss). World aquaculture 21: 58<br />
- 62<br />
Boyd, C. E. and C. S. Tucker. (1992). Water quality and pond soils analysis for aquaculture. Alabama<br />
Agric. Exp. Station, Auburn <strong>University</strong>, Alabama, USA.<br />
Chakraborty, S. B., D. Mazumdar and S. Banerjee. (2010). Determination of ideal stocking density for<br />
cage culture of monosex Nile tilapia (Oreochromis niloticus) in India. Proc. Zoological Society 63<br />
(1): 53–59<br />
Coche, A. G. (1979). A review of cage fish culture and its application in Africa. In: Pillay, T. V. R. and<br />
W. A. Dill (Eds.), Advances in Aquaculture. Fishing News Book, Farnham, pp. 428-441.<br />
192
193<br />
TECHNICAL REPORTS: INVESTIGATIONS 2009–2011<br />
Diana, J. S. C. K. Lin, and Y.Yi, (1996). Timing of supplemental feeding for tilapia production. Journal<br />
of the World Aqua. Soc. 27(4) 410-419.<br />
Ellis, T., North, B., Scott, A. P., Bromage, N. R., Porter, M. and Gadd, D (2002). The relationships<br />
between stocking density and welfare in farmed rainbow trout. Journal of Fish Biology 61: 493–531.<br />
FAO (2010). The state of the world fisheries and aquaculture 2010. FAO Fisheries and Aquaculture<br />
Department, Rome, Italy.<br />
FAO (2008). The state of the world fisheries and aquaculture 2008. FAO Fisheries and Aquaculture<br />
Department, Rome, Italy.<br />
FAO (2006). The state of the world fisheries and aquaculture 2006. FAO Fisheries and Aquaculture<br />
Department. Rome, Italy.<br />
Fitzsimmons, K. and P. Gonzalez (2006). Future expansion of global supplies and markets for tilapia<br />
products-2006 In: Sanchez, W. M. C. and K. Fitzsimmons (Eds.). Tilapia, sustainable aquaculture<br />
from the new millennium, Proceedings 7 th International Symposium on Tilapia in Aquaculture<br />
Gibtan, A., A. Getahun and S. Mengistou (2008). Effects of stocking density on the growth performance<br />
and yield of Nile Tilapia [Oreochromis niloticus (L., 1758)] in a cage culture system in Lake Kuriftu,<br />
Ethiopia. Aquaculture Research 39(13): 1450-1460.<br />
Huang, W. B. and Chiu, T. S. (1997). Effect of stocking density on survival, growth, size variation and<br />
production of tilapia fry. Aquaculture Research 28: 165 – 173.<br />
Lin, C. K. and J. S. Diana. (1995). Co-culture of Catfish (Clarias macrocephalus x C. gariepinus) and<br />
Tilapia (Oreochromis niloticus) in Ponds. Aquatic Living Resources 8:449-454.<br />
Liti, D. M., B. Fulanda, J. M. Munguti, M. Straif, H. Waidbacher, and G. Winkler. (2005). Effects of<br />
open-pond density and caged biomass of Nile Tilapia (Oreochromis niloticus L.) on growth, feed<br />
utilization, economic returns and water quality in fertilized ponds. Aquaculture research 36: 1535 –<br />
1543.<br />
McGinty, A. S. and J. E. Rakocy (1989). Cage Culture of Tilapia. South Regional Aquaculture Center<br />
(SRAC), Publication No. 281.<br />
Mokoro, A. K. (2008). Effects of stocking density on growth and survival of Nile Tilapia (Oreochromis<br />
niloticus, Linn. 1858) in cages. M. Phil thesis, Moi <strong>University</strong>, Kenya.<br />
Ndimele, P. E., C. A. Kumolu- Johnson, N. F. Aladetohun, and O. A. Ayorinde, (2010). Length-weight<br />
relationship, condition factor and dietary composition of Sarotherodon melanotheron, Rüppell, 1852<br />
(Pisces: cichlidae) in Ologe Lagoon, Lagos, Nigeria. Agriculture and Biology Journal of North<br />
America, 1(4): 584-590<br />
Opiyo, M. A. (2008). Influence of rearing density and background colour on the growth performance and<br />
survival of Nile tilapia (Oreochromis niloticus - Linn, 1758) fry M. Phil thesis, Moi <strong>University</strong>,<br />
Kenya.<br />
Osofero, S. A., S. O. Otubusin and J. A. Daramola. (2009). Effect of stocking density on tilapia<br />
(Oreochromis niloticus, Linnaeus 1757) growth and survival in bamboo-net cages trial. African<br />
Journal of Biotechnology, 8(7): 1322-1325<br />
Petit, G., Beauchaud, M. and Buisson, B. (2001). Density effects on food intake and growth of<br />
Largemouth bass (Micropterus salmoides). Aquaculture Research 32: 495 – 497.<br />
Popma, T. and M. Masser. (1999), Tilapia: Life History and Biology. South Regional Aquaculture Center<br />
(SRAC), Publication No. 283.<br />
Quagrainie, K. K., C. C. Ngugi, and S. Amisah. (2009). Analysis of the use of Credit facilities by small –<br />
scale fish farmers in Kenya. Aquaculture International, 18:393-402<br />
Shrestha, M. K. (2002). Mixed sex Nile tilapia culture model for subtorial Nepal. In: Book of Abstracts-<br />
World Aquaculture 2002, Beijing, China. pp. 699-699.<br />
Silva, P. C., V. L. Souza, D. M. Padua, P. C. Dalacorte and D. C. Goncalves. (2000). Effect of stocking<br />
density on growth and fillet composition of tetra hybrid red tilapia, Israeli strain. In: Fitzsimmons K.<br />
and Filho C. (Eds.), Tilapia Aquaculture in the 21 st century: Proceedings from 5 th International<br />
Symposium on Tilapia Aquaculture, pp 341-345. The World Aquaculture Society, FL, USA.
TECHNICAL REPORTS: INVESTIGATIONS 2009–2011<br />
Yi, Y., N. T. Phuong, J. S. Diana and C. K. Lin. (2005). Integrated cage-cum-pond culture systems with<br />
high-valued climbing perch (Anabas testudineus) in cages suspended in Nile tilapia (Oreochromis<br />
niloticus) ponds. In: J. Burright, C. Flemming, and H. Egna (Eds.), Twenty-Second Annual Technical<br />
Report, Aquaculture <strong>CRSP</strong>, <strong>Oregon</strong> <strong>State</strong> <strong>University</strong>, Corvallis, <strong>Oregon</strong>, pp.115-131.<br />
Yi, Y. and C. K. Lin. (2001). Effects of biomass of caged Nile tilapia (Oreochromis niloticus) and<br />
aeration on the growth and yields in an integrated cage-cum-pond system. Aquaculture 195, 253-267.<br />
Yi, Y. and C. K. Lin. (2000). Analysis of various input for pond culture of Nile Tilapia (O. niloticus):<br />
Profitability and potential environmental impacts. In: Fitzsimmons, K. and J. C. Filho (Eds.), Tilapia<br />
Aquaculture in the 21 st century Vol. I, Proceeding from the fifth International symposium on Tilapia<br />
Aquaculture, Sept. 3-7, 2000, Rio de Janeiro, Brazil. pp. 247-257.<br />
Yi, Y., (1997a). A cage-cum-pond integrated rotation culture system for fattening large Nile tilapia<br />
(Oreochromis niloticus) in cages and nursing small Nile tilapia in open ponds. Ph.D dissertation,<br />
Asian Institute of Technology, Bangkok, Thailand, 169 pp.<br />
Yi, Y., (1997b). A bioenergetics growth model for Nile tilapia (Oreochromis niloticus) based on limiting<br />
nutrients and fish standing crop in fertilized ponds. Thailand Special Topics Research 1, Thailand. In:<br />
Burke, D., J. Baker, B. Goetze, D. Clair, and H. Egna (Eds), Fifteenth Annual Technical Report. Pond<br />
Dynamics/Aquaculture <strong>CRSP</strong>, <strong>Oregon</strong> <strong>State</strong> <strong>University</strong>, Corvallis, <strong>Oregon</strong> (pp 140-167).<br />
Yi, Y., C. K. Lin, and J. S. Diana. (1996). Effects of stocking densities on growth of caged adult Nile<br />
tilapia (Oreochromis niloticus) and on yield of small Nile tilapia in open water in earthen ponds.<br />
Aquaculture, 146:205-215.<br />
194
195<br />
TECHNICAL REPORTS: INVESTIGATIONS 2009–2011<br />
Expansion of Tilapia and Indigenous Fish Aquaculture in Guyana:<br />
Opportunities for Women<br />
Sustainable Feed Technology/Study/09SFT03UA<br />
Pamila Ramotar<br />
Department of Fisheries<br />
Georgetown, Guyana<br />
Kevin Fitzsimmons<br />
<strong>University</strong> of Arizona<br />
Tucson, Arizona, USA<br />
ABSTRACT<br />
The focus of this investigation was an effort to work with fish farmers in two regions of Guyana to<br />
develop sustainable aquaculture systems. In the coastal region we worked with the Trafalgar Union<br />
women’s cooperative and some individual farmers. Their primary focus was on tilapia and hassar. The<br />
hassar is a native species of armored catfish that is considered a delicacy in Guyana and Trinidad and<br />
Tobago. Tilapia were introduced to Guyana many years ago for mosquito control but have now become a<br />
popular food fish. In recent years, genetically male tilapia have been imported from Great Britain to<br />
upgrade the broodstocks available. We collaborated with the Guyana Department of Agriculture on the<br />
distribution and maintenance of these broodstocks to a regional hatchery.<br />
In the interior region, we have been working with the Bina Hill Association which is composed primarily<br />
of women representatives for several of the surrounding villages. Our primary focus was on working with<br />
these women and the rest of the community to develop and demonstrate an integrated aquacultureagriculture<br />
system that would be stocked with native fish species. With no electrical grid available, we<br />
determined it would be better to run from solar panels and batteries, rather than the very expensive diesel<br />
which must be trucked in. The first solar panel and battery array was purchased and delivered to the<br />
demonstration. The fish are scheduled to be delivered in late September 2011, assuming the rainy season<br />
has ended and the road is passable.<br />
Over all we conducted three workshops for the women of Trafalgar Union and one farm visit. We held<br />
three workshops for the Bina Hill community in Annai and have prepared the plans for the demonstration<br />
and provided some of the materials. We have also provided some of the aquaculture supplies for both<br />
projects.<br />
OBJECTIVES<br />
a. To support development of small scale aquaculture in poor rural areas, with a focus on women’s<br />
groups in Trafalgar Union and Annai<br />
b. To support development of a regional hatchery program utilizing YY Genetically Male donated by<br />
DFID<br />
c. To identify and determine indigenous fishes with aquaculture potential<br />
d. Finalize development of a standard aquaculture feed containing locally available ingredients.
TECHNICAL REPORTS: INVESTIGATIONS 2009–2011<br />
INTRODUCTION<br />
Guyana, in South America, has some of the best protected rainforests in the world as well as enormous<br />
quantities of pristine freshwaters, little industry, a relatively small population and a long coastline. There<br />
is tremendous potential for small and large scale aquaculture in freshwaters, brackish water and in marine<br />
systems. The northern watersheds drain to the Caribbean while its southern watersheds are part of the<br />
Amazon Basin. Our <strong>AquaFish</strong> <strong>CRSP</strong> work in Guyana is split between the two areas. The northern<br />
watersheds drain to the coastal areas to the east and west of the capital Georgetown. The road to the west<br />
does not extend very far into Region 3, but the east road extends all the way to the border with Surinam.<br />
In this eastern area, Regions 4 and 5, we have worked with a number of individual farmers rearing tilapia<br />
and pacu and with one women’s cooperative rearing tilapia and hassar, a local armored catfish. The farms<br />
are all arrayed along the coastal highway and use their fish primarily for direct consumption and local<br />
sales, as well as some sales to the major population center of Georgetown.<br />
ADMINISTRATIVE REGIONS OF GUYANA<br />
RESULTS<br />
In Regions 4 and 5 we have worked with most of the individual farmers including those growing tilapia,<br />
pacu and shrimp, a feed mill producing fish feed and one tilapia hatchery. The tilapia farmers are using<br />
both Mozambique tilapia imported years ago and improved selections of Nile tilapia donated by Swansea<br />
<strong>University</strong> in Wales with support from the British DFID. The YY genetically male tilapia were first<br />
brought to the Mon Repos Station managed by Pamila Ramotar with the Fisheries Office. Later some of<br />
the broodstock were transferred to Mr. Chico Persaud, operator of the Maharaja Mill. Chico was the<br />
manufacturer of the local aquaculture diets and our collaborator on feed formulations and trials. We<br />
helped to design a tilapia hatchery adjacent to his feed mill. Unfortunately after all of our work with Mr.<br />
Persaud, he emigrated to Canada in late 2010. He has left the Mill and hatchery in hands of a brother who<br />
has no background in the business and has assigned a caretaker to the operation. We have spent some<br />
time to educate the caretaker, but so far with slow progress.<br />
196<br />
Region 1 Barima-Waini<br />
Region 2 Pomeroon-Supenaam<br />
Region 3 Essequibo Islands-West Demerara<br />
Region 4 Demerara-Mahaica<br />
Region 5 Mahaica-Berbice<br />
Region 6 East Berbice Corentyne<br />
Region 7 Cuyuni-Mazaruni<br />
Region 8 Potaro-Siparuni<br />
Region 9 Upper Takutu-Upper Essequibo<br />
Region 10 Upper Demerara-Berbice
Tilapia hatchery at Maharaja Mill<br />
197<br />
TECHNICAL REPORTS: INVESTIGATIONS 2009–2011<br />
Due to the departure of Mr. Persaud, our feed development aspect, and trials, was hindered. The eventual<br />
decision was to have Ms. Ramotar continue the feeding trials as part of her Master’s project here at the<br />
<strong>University</strong> of Arizona. The trials are underway at the time of this writing.<br />
Lacking access to the Maharaja Mill, we did develop a small project with Mr. Benni Sankar to develop<br />
simple on farm diet with local ingredients. Mr Sankar purchased a small hammer mill grinder and a basic<br />
pellet mill. Both pieces of equipment were manufactured in China and came without any instructions.<br />
We spent several days working with Mr. Sankar at his farm in Region 3. His basic ingredients were to be<br />
fish meal derived from the carcasses of filleted marine catfish, rice bran and broken rice from the rice<br />
farm operation and vegetable oil. We spent considerable time getting the equipment operating, training<br />
staff, and formulating a mix that would go through the equipment without plugging dies and screws. We<br />
eventually came up with a workable formulation. But the stability of the pellet in water was very short,<br />
less than one minute.<br />
Simple hammer mill for grinding fish carcasses Pellet mill
TECHNICAL REPORTS: INVESTIGATIONS 2009–2011<br />
We have more expansive hopes for the additional farmers in Region 4 and 5 and have started test<br />
shipments of tilapia to Florida. The first shipment was stalled and ruined by airline employees who<br />
thought that we were missing a permit. The second shipment was successful with high quality fish<br />
shipped to and sold by Sammy’s Seafood, a seafood company in St. Petersburg, FL . We have also<br />
assisted the two shrimp farmers who use extensive methods of non-fed, tidal impoundments. On our last<br />
visit we collected shrimp samples for return to Arizona for species identification and gross health exam.<br />
We have suggested that they consider tilapia in cages in their ponds to increase revenues, increase growth<br />
and survival of the shrimp and diversify their sales (in time and product).<br />
Pamila Ramotar with farmed pacu Preserving shrimp samples<br />
The Trafalgar Union Women’s Cooperative is one of the largest farms in Region 5. This cooperative of<br />
16 women have pooled their resources and been provided with a low cost lease on 12.5 hectares of federal<br />
land. The farm now includes 10 ponds and four more under construction. We have conducted three<br />
workshops for the women. One at the national aquaculture center at Mon Repos, one at the Maharaja<br />
Feed Mill and a third at the Trafalgar Union Farm. The first workshop, 15 August 2008, included basics<br />
of aquaculture and tilapia biology. The group met early in the morning and we started with introductions<br />
and welcoming comments. We spent the rest of the morning covering aquaculture production systems<br />
and marketing. We had a lunch provided for everyone and then started an afternoon session focused on<br />
tilapia and the two strains, YY Nile tilapia and red tilapia that are currently being farmed. Later in the<br />
afternoon we toured the Mon Repos facility and then reconvened at the Maharaja Oil Mill. We discussed<br />
some basics of feed manufacturing and feed handling. The second workshop, 18 June 2009, was held at<br />
the Mon Repos station and also moved later to the Maharaja Mill and covered basic fish nutrition, feed<br />
formulations, feed manufacturing, and on farm feed handling and distribution. The third workshop was<br />
held at the Trafalgar Union farm on 20 June 2011. This workshop was conducted on the farm moving<br />
from site to site. We started at the pumping station for introductions and to review water supplies and<br />
biosecurity. We then all moved to the ponds to discuss feeding practices, predator control, weed and<br />
algae control, taste and odor issues and harvest practices. Finally we moved back to the office and<br />
working area to discuss harvest and quality control aspects. We also discussed the sales and marketing<br />
aspects and plans for international distribution (to Florida and Trinidad).<br />
198
199<br />
TECHNICAL REPORTS: INVESTIGATIONS 2009–2011<br />
Office and feed storage at The Trafalgar Union Model Farm. Coop leader Ms. Shenella Lewis and<br />
several of the sons and nephews who have been hired to work at the farm.<br />
Our second area of interest is in the Rupununi Basin in the southern portion of Guyana. The Rupununi is<br />
a part of the Amazon watershed that seasonally floods large areas of savanna. The indigenous<br />
populations of the Rupununi are commonly referred to as AmerIndians. These native people have a very<br />
different culture and lifestyle compared to the coastal populations, which are composed of the<br />
descendants of black slaves and East Indian indentured workers. There is only one unpaved road across<br />
the Rupununi Basin and no electrical or phone systems. The people are essentially subsistence farmers<br />
utilizing solar panels or diesel generators for household electrical power. As there are no phone, radio or<br />
television signals, Internet connections through satellite dish is the only communication with the outside,<br />
besides irregular mail service when the dirt road is passable.<br />
Our focus in the southern watersheds was to develop, describe and demonstrate a simple integrated<br />
farming system utilizing native fishes and vegetable crops grown in the area. We organized our<br />
workshops and visits with the Fisheries Office staff in Georgetown before flying by small plane to the<br />
airstrip at Annai. We held our first workshops in August 2010 to describe the system to the community<br />
members and to gather their input and suggestions as to how to improve the concept. We also visited<br />
several ponds that had previously been built in the area. None of the ponds could be drained. None were<br />
fenced to keep out caiman or other fish eaters. Several of the ponds were more than three meters deep.<br />
The attempts at stocking had failed. And any attempts to harvest by net were sure to fail.<br />
Therefore we recommended a simple small pond system coupled with production of local vegetables. We<br />
also spent considerable time discussing the native fishes that could be farmed and how best to feed them<br />
in a farm setting. The species of greatest interest were: pacu (Colossoma), cascadura (Hassar), and<br />
arapaima (Arapaima gigas). All three are heavily overfished in the area and are considered delicacies of<br />
high monetary value. The pacu and especially arapaima are considered excellent sport fish that support<br />
valuable tourism. After the workshop we conducted a literature review to examine other species and to<br />
gather culture information on the pacu, hassar and arapaima.
TECHNICAL REPORTS: INVESTIGATIONS 2009–2011<br />
Poorly constructed pond Community pond used for fishing<br />
A second workshop was led by our host country PI, Pamila Ramotar on 21 September, 2010 and a third<br />
on 12 November 2010. She presented additional information of culture of pacu and arapaima with<br />
handouts and contacts to Brazilian farms and hatcheries.<br />
With the lack of reliable electricity we incorporated a solar panel for the pump to be used during irrigation<br />
periods during our fourth workshop on the 15 th and 16 th of June 2011. For the demonstration pond and<br />
garden, a panel was purchased in Georgetown along with a battery, a controller and a direct current pump.<br />
We took the materials as our checked baggage and flew to Annai with change of clothes in hand.<br />
After the prior workshop and discussions with the local association of farmers, we determined to put the<br />
demonstration farm at the Rock View Lodge. The Lodge is situated between the airstrip and the dirt<br />
highway crossing the Rupununi. The regional primary and secondary schools are on either side of the<br />
Lodge and virtually all the school children cross the property twice a day going or returning from school.<br />
With the open and sharing nature of the society, it is normal for everyone to stop and see anything that is<br />
new when “passing by”. Everyone agreed this would be the best location. The proprietor, Colin<br />
Edwards, has started the pond construction and planted the garden. He has the solar panel and battery<br />
apparatus ready to install when the fish are stocked. The current plan is to stock with pacu fingerlings.<br />
The pacu are native to the area and fingerlings are available from a hatchery across the border in Brazil.<br />
Delivery is only possible in the dry season, but plans have been developed for stocking in November<br />
2011.<br />
During the fourth workshop, we also spent considerable time discussing within the community the pro’s<br />
and con’s of rearing tilapia versus the native fishes. While most of us would prefer to work with native<br />
fishes, one member of the community felt that tilapia would be a superior fish and insisted on his right to<br />
import and rear the fish. A considerable amount of time was spent on this issue. We think we finally<br />
convinced the farmer that natives were a preferred crop for now and that the introduction of tilapia into<br />
the region had too many potential environmental risks.<br />
200
201<br />
TECHNICAL REPORTS: INVESTIGATIONS 2009–2011<br />
Workshop in Annai, at the Bina Hill Community Center, August 2010.<br />
CONCLUSIONS<br />
The project has certainly succeeded in providing the training and support to assist two groups and several<br />
individuals to advance their aquaculture efforts and improve sales of farmed fish domestically and now on<br />
an international level. In addition to training we have provided some materials and supplies for their<br />
operations. We have worked closely with the Guyana Investment and Trade Service, a contractor<br />
working on US-AID grant to support development in Guyana. We have also coordinated with the<br />
Farmer to Farmer program who provided support for one of our graduate students to contribute with a<br />
volunteer mission to Guyana.<br />
We expect to see continued growth of the aquaculture sector in Guyana with tilapia, hassar and shrimp<br />
along the coast and with pacu and arapaima in the interior. Our contributions to training, technical<br />
support, supplies and international marketing are showing results. We look forward to additional<br />
expansion in coming years. A significant weakness in the project has been the half-hearted support of<br />
the Department of Fisheries within the Ministry of Agriculture. At times, Fisheries staff assigned to<br />
work with us were not allowed to travel to international conferences, even with our full financial support,<br />
or even to accompany in the field within Guyana, again with our financial support. Some of the monies<br />
transferred to support specific activities within Guyana, have still not been spent. These funds are still in<br />
a suspense account that can be spent as soon as approved by the Minister, but repeated assurances that the<br />
approval was pending and the funds would be spent as promised have come and gone.
TECHNICAL REPORTS: INVESTIGATIONS 2009–2011<br />
Feeding and Feed Formulation Strategies to Reduce Production Costs of<br />
Tilapia Culture<br />
Sustainable Feed Technology/Experiment/09SFT04NC<br />
Remedios Bolivar<br />
Central Luzon <strong>State</strong> <strong>University</strong><br />
City of Muñoz, Philippines<br />
Peter Ferket, Charles Stark and Russell Borski<br />
North Carolina <strong>State</strong> <strong>University</strong><br />
Raleigh, North Carolina, USA<br />
ABSTRACT<br />
Feed constitutes 60-80% of total production costs of tilapia (Oreochromis spp.). Reductions in quantity of<br />
feed used for fish growout and in the cost of formulated feeds are two approaches to containing feed<br />
costs. We evaluated combined feed reduction strategies, and less costly fishmeal-free and low crude<br />
protein diets as well as feed manufacturing options for improving production efficiency of Nile tilapia (O.<br />
niloticus). In a 120-day pond trial, fish subjected to a combined feed reduction strategy that incorporates<br />
a sequential series of a 60-day, 67% feeding rate with a 60-day 50% daily or 100% alternate day feeding<br />
rate had similar growth rates as fish fed daily at the 67% level throughout the trial. However, they<br />
exhibited lower survivorship, and hence the final extrapolated yield at harvest of animals on the combined<br />
feed reduction protocol was significantly lower. It appear sthat this protocol of incorporating a<br />
combination of feed reduction stategies is less effective than any of the strategies used alone, which were<br />
previously shown to reduce feed costs by as much as 56% in the growout of marketable tilapia. In a<br />
second pond trial we show that elimination of fishmeal from a standard 31% CP diet can produce a<br />
significant costs savings in feeds with no appreciable effect on growth performance and yield of tilapia<br />
raised in ponds. This confirms our earlier report whereby fishmeal-free diet provide an additional 8%<br />
cost savings in growout of tilapia over and above the > 50% savings seen with an alternate day feeding<br />
protocol. A reduction of dietary CP to 26%, so long as the amino acid composition remains similar to<br />
that of the higher 31% CP feed, can produce additional cost savings in feed of up to a 5.69% if fishmeal is<br />
included in the diet or up to 11.69% if fishmeal is not included in the lower protein diets. Hence, this<br />
work demonstrates that both elimination of fishmeal and reductions in the amount of crude protein or both<br />
significantly reduces the costs of feeds for growout of tilapia with little overall impact on growth<br />
parameters, survival or yield of fish. We also demonstrate that the production of a less costly pelleted<br />
fishmeal-free diet over an extruded form is further effective in reducing feed costs with negligible impact<br />
on performance. This was particularly true of the higher 31% CP diet. The ability to produce pelleted<br />
fishmeal-free aquafeeds that are of comparable performance as extruded feeds can not only promote an<br />
additional cost savings in feed of 3-7%, but would allow manufacturers who lack costly extruders to<br />
expand to production of aquafeeds. Collectively these series of studies and our previous work<br />
demonstrates that over and above any effects of reducing the amount of feed applied to the culture of<br />
tilapia, that up to 18% savings of feed costs can be achieved with fishmeal-free, lower crude protein and<br />
pelleted diets relative to the standard higher protein extruded feed containing 6% fishmeal.<br />
INTRODUCTION<br />
Feed is the most costly component of fish farming, accounting for as much as 80% of total production costs<br />
for small-scale, rural farmers in the Philippines that grow tilapia (ADB 2005; El-Sayed 2006).<br />
Approximately 35% of all feed manufactured or sold in the Philippines is for aquaculture, largely for<br />
202
203<br />
TECHNICAL REPORTS: INVESTIGATIONS 2009–2011<br />
tilapia. Provided production efficiency is not significantly impaired, any reductions of feed costs per kg of<br />
fish marketed will increase income at several levels of Philippine society, including local suppliers of<br />
feedstuffs, feed manufacturers, allied industries, and especially tilapia farmers. Total feed costs for tilapia<br />
can be reduced through three approaches: 1) decrease in the amount of feed used for grow-out of<br />
marketable fish; 2) decrease feed formulation costs by reducing crude protein levels, amino acid<br />
supplementation and replacing expensive fish meal with lower cost protein sources; and 3) reduce feed<br />
manufacturing costs by pellet processing in place of the more expensive current practice of extrusion<br />
processing. The objectives of this investigation will address these three approaches to reducing feed costs<br />
for Filipino tilapia farmers.<br />
Our previous studies show that 1) delaying the onset of supplemental feeding to either 45-days or 75-days<br />
in fertilized ponds reduces the amount of feed consumed without any negative impact on the production of<br />
marketable tilapia, 2) feeding daily at 67% subsatiation produces growth rates identical to that of fish fed<br />
daily at full feeding levels and significantly improves production efficiency of tilapia growout, and 3)<br />
feeding daily at 50% satiation or on alternate days at the prescribed satiation level saved approximately half<br />
of feed cost without a significant reduction in growth, survival, or market yield of Nile tilapia in growout<br />
ponds (Brown et al. 2000, Bolivar et al. 2003, Bolivar et al. 2006; Bolivar et al., 2010). Nevertheless, fish<br />
were smaller on average at harvest with 50% daily satiation or alternate day satiation feeding relative to<br />
animals fed daily at the prescribed full level. Therefore, we tested a combined feeding strategy to evaluate<br />
whether a 67% subsatiation feeding combined with alternate day or 50% reduced feeding could reduce costs<br />
with no impact on growth or total biomass produced (see footnote at end of text).<br />
The formulation cost of commercial diets has risen sharply with about 40% of aquaculture feed costs<br />
attributable to fishmeal that constitutes as much as 20% of feed formulation. Much of the fishmeal used in<br />
the Philippines is imported and costs are expected to continue to rise as global supplies decline and demand<br />
increases. Unlike carnivorous species, tilapia are omnivorous fishes that do not require fish in their diet,<br />
and they are an ideal group of species to recycle food by-products into high quality food protein for humans<br />
(Brown 1983). Moreover, tilapia can digest a relatively high carbohydrate diet, and effectively utilize<br />
lower-cost feed ingredients readily available in the Philippines (e.g. rice bran, copra meal, and cassava) to<br />
completely replace or significantly reduce fishmeal use (Jackson et al. 1982; NRC 1993). Indeed, various<br />
animal and plant proteins have been shown to be either partially or completely replace fishmeal in tilapia<br />
diets (Lim and Webster 2006; El-Sayed 2006). For example, we reported tilapia fed diets with up to 33%<br />
sweet potato and lactic acid-stabilized poultry carcasses did not adversely affect tilapia growth performance<br />
or consumer panel sensory indices (Middleton et al. 2000). Additionally, our previous <strong>AquaFish</strong> <strong>CRSP</strong><br />
research demonstrates that fishmeal can be replaced with poultry by-p roduct meal, fermented poultry<br />
protein, or yeast extract protein without adversely affecting growth performance of tilapia fed pelleted feed<br />
(Ayoola 2010; Bolivar et al. 2010). Likewise, we have demonstrated that dietary replacement of a standard<br />
diet containing 6% fishmeal with porkmeal does not adversely effect growth of tilapia fed on alternative<br />
days in ponds, but produces a 8% cost savings in feeds (Borski et al. 2011). As observed with other<br />
monogastric omnivorous animal species, feeding lower protein diets supplemented with amino acids could<br />
significantly reduce excess nitrogen emission into pond water and increase profit margins by lowering feed<br />
costs for tilapia farmers (Ferket et al. 2003). These studies will evaluate the production performance<br />
feasibility of tilapia fed extruded high crude protein diets versus a lower crude protein diets supplemented<br />
with amino acids, and that contain either 0% or 6% fishmeal.<br />
Most commercial aquaculture feed, including those for tilapia, is manufactured and fed as floating or slowsinking<br />
extruded pellets because it is easier for fish farmers to detect over feeding and it has good water<br />
stability and durability. However, extrusion processing costs are higher than pellet processing. Likewise<br />
transport costs per ton are higher for extruded feeds because of their lower bulk density. Our previous work
TECHNICAL REPORTS: INVESTIGATIONS 2009–2011<br />
at NCSU have shown that tank-reared tilapia are able to consume pellet-processed feed without adversely<br />
affecting growth performance efficiency (Ayoola 2010; Bolivar et al. 2010). The economic and production<br />
feasibility of feeding pellet processed feed must be confirmed with pond-reared tilapia in the Philippines.<br />
However, more research must be done to improve the water stability and durability of pelleted feed for<br />
pond systems.<br />
Pond-reared tilapia feed must have sufficiently high water stability that allows feed to be consumed by the<br />
fish and prevent nutrients from dispersing or leaching in the water, leading to poor feed conversion and<br />
performance (Leonard et al. 2002). Diet formulation, ingredient particle size, conditioning, die specs, and<br />
cooling are the major factors that influence pellet quality (Axe 2002). Proteinaceous and starch materials<br />
have the greatest influence on producing a water-stable feed, as well as the affecting the formula costs to<br />
meet nutrient specifications (Rokey and Huber 2005). However, most by-product protein meals commonly<br />
used in tilapia feed are heat-denatured proteins, which have reduced pellet-binding characteristics. In<br />
contrast, dietary inclusion of nutritive protein binders from yeast, animal, and plant sources or pelleting<br />
aids, could significantly enhance the durability of pelleted feed for tilapia. In the proposed investigation,<br />
we will evaluate the effect of dietary inclusion of various nutritive protein pellet binders and pelleting aids<br />
on the pellet durability and water stability of pelleted feed. This information will then be used to formulate<br />
and manufacture pelleted tilapia feed for pond culture systems and compare it to conventional extrusionprocessed<br />
feed in terms of production efficiency and profitability.<br />
OBJECTIVES<br />
1. Evaluate effects of combined feed reduction strategies on the growout performance of Nile tilapia in<br />
fertilized earthen ponds.<br />
2. Evaluate pond growout performance of Nile tilapia fed high and low crude protein diets with and<br />
without fishmeal.<br />
3. Evaluate dietary inclusion of nutritive protein binders and pellet processing aids on pellet durability and<br />
water stability of tilapia feeds.<br />
4. Compare the effect on tilapia feed manufactured by extrusion and pellet processing on pond grow-out<br />
performance of Nile tilapia.<br />
MATERIALS AND METHODS<br />
Study 1 - Evaluation of 67% subsatiation daily feeding combined with 100% alternate day or 50% daily<br />
feeding versus continuous 67% daily feeding on growout of Nile tilapia in earthen ponds<br />
Previous studies show that feeding at 67% of normal rates produces identical growth rates to animals fed<br />
at the typical 100% level, but at a signficant cost savings infeeds. This study evaluated if the 67%<br />
subsatiation feeding when combined with previous feed reduction strategies of alternate day feeding and<br />
50% subsatiation might produce an additional cost savings with little impact on growth performance.<br />
This study evaluates three feeding treatments on the growth performance of Nile tilapia as follows:<br />
Treatment I – 67% daily feeding until harvest; Treatment II - 67% daily feeding for 60 days followed by<br />
50% daily feeding until harvest; and Treatment III - 67% daily feeding for 60 days, followed by 100%<br />
alternate day feeding until harvest.<br />
Sex-reversed Nile tilapia (Orechromis niloticus) fingerlings (#20; 0.35- 0.37 g) were stocked at 4 fish m -2<br />
in nine 500-m 2 earthen ponds at the Freshwater Aquaculture Center (FAC), Central Luzon <strong>State</strong><br />
<strong>University</strong> (CLSU), Science City of Muñoz, Nueva Ecija, Philippines with three replicates per group.<br />
The grow-out phase of this study were done in eight 500 m 2 earthen ponds. Size 20 (weight range =)<br />
fingerlings of the GIFT strain were stocked in each pond. Fish were fed with pre-starter feeds containing<br />
34% crude protein (CP) for the first month, starter feeds with 34% CP over the second month, and then<br />
grower feeds containing 31% CP until harvest. Treatment feed rations were adjusted based on the full<br />
204
205<br />
TECHNICAL REPORTS: INVESTIGATIONS 2009–2011<br />
ration levels prescribed that ranged from 20% down to 2% average body weight over the course of the<br />
study. Feeding adjustment was done every two weeks when average body weights of fish were<br />
ascertained. The amount of feeds used per treatment was recorded daily. Fish sampling was done every<br />
two weeks by bulk weighing of 100 fish in each ponds. Individual weight and length of 100 fish were<br />
measured at the onset and termination of the study 120 days post stocking.<br />
Water temperature and dissolved oxygen were measured weekly at 0900 and 1300 hr using dissolved<br />
oxygen meter (YSI model 55). Hydrogen ion concentration (pH) and Secchi disc visibility depth (SDVD)<br />
reading was also measured weekly. Determinations of the other water quality parameters (total ammonia<br />
nitrogen and nitrite-nitrogen level) were measured using freshwater test kit (Lamotte Model AQ2). Ponds<br />
were fertilized with ammonium phosphate (16-20-0) and urea (46-0-0. ) at the rate of 28 kg N and 5.6 kg<br />
P ha -1 week -1 , respectively to enhance the growth of natural foods in pond water. Weekly fertilization of<br />
the experimental ponds was adjusted based on SDVD.<br />
After 120 days of culture, stocks were harvested for bulk weight of all the stocks, survival rate, and the<br />
extrapolated gross fish yield (total weight of fish at harvest (kg) / area of the pond (m 2 )). Other variables,<br />
including total feed consumption, feed conversion ratio (FCR; feed consumed/body weight), specific<br />
growth rate (SGR; % daily body weight and length gain; [(ln Wf – ln Wi)/(Tf – Ti) X 100]) were<br />
calculated. Differences among means were statistically analyzed by analysis of variance (ANOVA)<br />
followed by Duncan’s Multiple Range Test (DMRT) (Duncan, 1955).<br />
Study 2 – Evaluation of pond growout performance of Nile tilapia fed high and low crude protein<br />
diets with and without fishmeal.<br />
This study was composed of 4 treatment groups:<br />
1. Feeding of high CP (31%) extruded feed with 6% dietary inclusion of fishmeal – a standard diet used in<br />
industry;<br />
2. Feeding of low CP (26%) extruded feed with 6% dietary inclusion of fishmeal supplemented with amino<br />
acids<br />
3. Feeding of high CP (31%) extruded feed without (0%) dietary inclusion of fishmeal<br />
4. Feeding of low CP (26%) extruded feed without (0%) dietary inclusion of fishmeal supplemented with<br />
amino acids<br />
Diets were least-cost formulated to be similar to those from our previous work that demonstrated 31% CP<br />
fishmeal-free feed was as effective on the performance of tilapia in ponds as a standard diet containing<br />
6% fishmeal (Borski et al. 2011)(Table 3). Diets were composed of locally available ingredients in the<br />
Philippines that included hydroyzed animal protein with fishmeal or porkmeal. Locally produced plant<br />
protein sources included copra cake, cassava, and rice bran. Soybean meal, upon which world protein<br />
market prices are based, was used as the basal plant protein source because of consistency of availability<br />
and nutritional quality. All grower diets were formulated to meet the nutrient requirement of tilapia<br />
(NRC 1993; Li et al. 2006) using least-cost linear programming. The low protein diets were<br />
supplemented with commercially available amino acids such that they have a similar amino acid profile<br />
as the high crude protein diet. Diets were formulated by Ms. Ning Pascaul of our industry cooperator,<br />
Santeh Feed Corporation (Tateh Aquafeeds, Santeh Feed Corp. Quezon City, Philippines).<br />
Sex-reversed Nile tilapia fingerlings (#22, 0.162 g body weight) of GIFT strain were stocked at 4 fish m -2<br />
in twelve 500 sq. m. earthen ponds at FAC-CLSU, Science City of Muñoz, Nueva Ecija, Philippines, with<br />
3 replicate ponds per treatment group. Fish in all treatments were fed first with pre-starter feeds<br />
containing 36% crude protein for the first month and then with starter feeds containing 34% crude protein<br />
for the second month. Fish were subsequently fed grower treatment diets until harvest at 120 days<br />
poststocking. Fish were fed according to a standard schedule of 20% down to 2% body weight from the
TECHNICAL REPORTS: INVESTIGATIONS 2009–2011<br />
beginning to the end of the pond study. Feeding adjustment was done every two weeks following<br />
subsampling for average body weight of stocks.<br />
Fish sampling was done every two weeks by getting the bulk weight of 50 fish samples. Individual weight<br />
and length of 100 fish was measured on the initial and final sampling. Water quality parameters were also<br />
measured as described above. Water temperature ( o C), dissolved oxygen concentration (mg/l), hydrogenion<br />
concentration, total alkalinity (mg/l), total ammonia nitrogen (mg/l), carbon dioxide concentration<br />
(mg/l) and total phosphorus (mg/l) were monitored weekly. Total hardness (mg/l) was monitored<br />
monthly. Ponds were fertilized weekly with ammonium phosphate (16-20-0) and urea (46-0-0. ) at the<br />
rate of 28 kg N and 5.6 kg P ha -1 week -1 , respectively to enhance the growth of natural foods in pond<br />
water and adjusted based on SDVD.<br />
Growth and production parameters were measured as described above. Differences among means were<br />
statistically analyzed by analysis of variance (ANOVA) followed by Duncan’s Multiple Range Test<br />
(DMRT) (Duncan 1955).<br />
Study 3 – Evaluate dietary inclusion of nutritive protein binders and pellet processing aids on pellet<br />
durability and water stability of tilapia feeds.<br />
The purpose of this study was to evaluate the efficacy of different types of pellet binder feed additives on<br />
the durability and water stability of pelleted tilapia feed. A 26% crude protein tilapia basal diet<br />
(containing ~34% corn, 25% soybean meal, 22% rice bran, 10% poultry by-product meal, 5% distillers<br />
dried grains with solubles, 0.5% poultry fat, and amino acids, vitamins and minerals making up the<br />
balance, Table 6) was ground through a #4 hammer mill screen to obtain a 400 micron geometrical mean<br />
particle size.<br />
Experiment 1<br />
In experiment 1, the basal diet was split into 4 kg batches. Three commercial pellet binders and one “no<br />
binder” control were prepared in triplicate and arranged in three randomized blocks of consecutive<br />
processing runs through a small experimental pellet mill with 40 psi steam at ~80C with a 3.7 mm X 18<br />
mm die). Feed additive pellet binders and inclusion levels tested were 0.2% urea-formaldehyde (UF), ,<br />
0.1% bone gelatin (G), and 2% wheat gluten (WG). The binders were added to 4 kg of the basal feed<br />
according to the manufacturer’s recommendations. The feed was pellet with a laboratory pellet mill. Feed<br />
was conditioned with 40 psi steam to 80 o C and pelleted through a 3.7 mm x 18 mm ring die. Batches<br />
were run in immediate sequence with no change in steam or feeder screw rates. The results of this<br />
experiment were used to select the pellet binders in Experiment 2.<br />
Experiment 2<br />
The basal tilapia grower formula and three different binders used in experiment 1 were also used here,<br />
with the addition of two combined treatments: 0.2% UF + 2% WG and 0.2% UF + 0.1% G. The<br />
combination of binders was based on the pellet quality results of Experiment 1. Diets were produced<br />
using a commercial-sized pellet mill equipped with a 4 mm X 45 mm die. The feed was conditioned for<br />
approximately 30 sec at each target temperature, using a 46 cm x 122 cm conditioner operating at 60<br />
RPM. The pellet mill (Model PM1112-2, California Pellet Mill Co., Crawfordsville, IN) was equipped<br />
with a 4.4 mm x 35 mm ring die.<br />
Pellet Quality Analysis<br />
Samples in Experiment 1 were tested for pellet compression strength, which was determined with a<br />
manually operated compression pellet tester (Amandas Kahl Nachf, 2057 Reinbek. Germany). The<br />
hardness of 15 pellets, randomly chosen from each treatment, was measured. Samples in Experiment 1<br />
and 2 were tested for pellet quality with the following testing methods: 1) Pellet durability was<br />
determined by duplicate runs on the New Holmen Pellet Tester (NHPT, 68 mbar), whereby 100 g of<br />
206
207<br />
TECHNICAL REPORTS: INVESTIGATIONS 2009–2011<br />
whole pellets were tumbled for 30- 90 seconds in a Holmen Pellet Tester, and percentage of remaining<br />
whole pellets calculated; 2) KSU pellet durability index (PDI) according to ASAE Method S269.7; 3)<br />
modified ASAE method that included the addition of three 19 mm hex-nuts (MPDI); and 4) water<br />
stability, which was determined with duplicate 50 g samples of pellets of each diet (PWS). Water<br />
stability samples were placed on a 3 mm diameter sieve and slowly immersed in deionized water at 24 ºC<br />
for 10 min; the sieve was removed from water, drained for 1 min, oven-dried at 105 ºC for 3 h, cooled in a<br />
desiccator, and reweighed. Water stability was calculated as the percentage difference in dry weight.<br />
Study 4: Compare the effect on tilapia feed manufactured by extrusion and pellet processing on<br />
pond grow-out performance of Nile tilapia.<br />
In this study we evaluated the effect of using a sinking pellet versus extruded feed on tilapia growout in<br />
ponds. Fish stocks were fed with the experimental feeds using a factorial arrangement of 2 manufactured<br />
feed forms, floating extruded versus slow sinking pelletd feed with high and low crude protein level.<br />
Binders used for the pelleted feed were those shown to maximize pellet durability and stability from<br />
Study 3 (0.2% urea-formaldehyde + 0.1% gelatin). All diets were formulated without fishmeal at either<br />
low or high crude protein levels similar to Study 2 using least-cost linear programming. Diets were<br />
formulated by Ms. Ning Pascaul of our industry cooperator, Santeh Feed Corporation (Tateh Aquafeeds,<br />
Santeh Feed Corp. Quezon City, Philippines). The following represent the four different fishmeal-free<br />
treatment diets used in the experiment:<br />
I) 31% CP floating extruded feed<br />
II) 31% CP slow-sinking pelleted feed + binders<br />
III) 26% CP floating extruded feed supplemented with amino acids<br />
IV) 26% CP slow-sinking pelleted feed supplemented amino acids + binders<br />
Sex-reversed fingerlings of size #22 (0.170 g/pc) were stocked in twelve 500 m 2 earthen ponds at FAC-<br />
CLSU at 4 pcs m -2 with 3 replicates per treatment. Fish stocks in all treatments were fed first with fry<br />
mash (31% CP) for the first 30 days and starter feeds (30% CP) were given up to 75 days of culture<br />
period. Fish were subsequently fed the grower treatment diets aon alternate days for 60 days or until the<br />
end of the 135-day growout trial. Alternate day feeding was previously shown to reduce production costs<br />
of tilapia without significantly altering final yield as almost 50% less feed could be used to grow fish than<br />
that incorporating standard daily feeding practices (Bolivar et al. 2006). Moreover, our previous work<br />
showed that replacement of fishmeal with pork meal is as effective in producing tilapia under an<br />
alternate-day feed reduction strategy, as those diets containing standard levels of fishmeal (Borski et al.<br />
2011). Feeding rates in the experiment started at 20% and was reduced to 2% based on average body<br />
weight of the stocks within the culture period.<br />
Fish sampling was done every two weeks by cast net to obtain average weight of fish stocks determined<br />
by bulk weighing 100 fish. Individual weight and length of 100 fish was measured on the initial stocking<br />
and final sampling. Water quality parameters were also measured as described above. Water temperature<br />
( o C), dissolved oxygen concentration (mg/l), hydrogen-ion concentration (pH), total alkalinity (mg/l),<br />
total ammonia nitrogen (mg/l), carbon dioxide concentration (mg/l) and total phosphorus (mg/l), and<br />
SDVD were monitored weekly at 0900 hour. Ponds were fertilized weekly with ammonium phosphate<br />
(16-20-0) and urea (46-0-0. ) at the rate of 28 kg N and 5.6 kg P ha -1 week -1 , respectively to enhance the<br />
growth of natural foods in pond water and adjusted based on SDVD.<br />
Differences in growth performance, survival rate and feed consumption were statistically analyzed by<br />
ANOVA and the overall production costs were estimated to assess economic feasibility.
TECHNICAL REPORTS: INVESTIGATIONS 2009–2011<br />
RESULTS AND DISCUSSION<br />
Study 1 - Evaluation of 67% subsatiation daily feeding combined with 100% alternate day or 50%<br />
daily feeding versus continuous 67% daily feeding on growout of Nile tilapia in earthen ponds 1<br />
Figure 1 shows the average growth trend of stocks after 120 days of culture period in fertilized ponds.<br />
Average body weight of Nile tilapia on the 67%-50% or 67%-alternate day feeding did not differ<br />
significantly from animals fed at 67% subsation throughout the study.<br />
Table 1 summarizes the growth performance, survival, feed consumption and yield of Nile tilapia cultured<br />
in earthen ponds using combined feed reduction strategies. Feed consumption per hectare was highest in<br />
fish fed 67% level (5201.1 + 1238 kg/ha) compared with those animals fed at 67%-50% level (3965.2 +<br />
1037 kg/ha) and 67%-alternate day protocol (4045.3 + 1104 kg/ha) Treatment III then Treatment II with<br />
a mean values of, 4,045.3 and 3,965.2 kgs hectare -1 , respectively. Fish fed daily at the 67% level had an<br />
FCR of 1.8 which was lower than that seen with fish on the 67%-50% and 67%-alternate day feeding<br />
protocol that had an FCR of 2.0. Despite these trends, there were no significant difference in feed<br />
consumed or FCR among treatments.<br />
In terms of fish yield, the highest yield per hectare was observed in fish fed daily at 67% level, followed<br />
by those on the 67%-alternate day schedule, and then those on the 67%-50% protocol, with a mean values<br />
of 2,968.7, 2,024.7 and 1,980.7 kgs per hectare, respectively. Fish yield was signficantly higher in the<br />
67% level group relative to other treatments (P < 0.05; Table 1).<br />
The highest survival of 46.9% was found for fish fed at the 67% level relative to the other groups whose<br />
mean survival ranged 27.7-29.3%. There was some variation in survivorship of replicate groups fed at<br />
the 67% level and hence no statistically signficant difference was observed between this and the other<br />
groups. It is likely that the higher yield of fish on the 67% daily feeding regimen s is due to the elevated<br />
survivorship of this group relative to the other treatments. Generally, the survival obtained after the<br />
experiment was low due to observed mortality during the third and fourth month of the study. Recorded<br />
high water temperatures during the afternoon could have caused stress which affected growth and survival<br />
even with replenishment of water. This may have been exaserbated in those groups where fish were fed<br />
daily at either the 50% level or on alternate days at full levels.<br />
Results on average minimum and maximum reading for water quality parameters during the 120-day<br />
culture period are summarized in Table 2. Generally, the dissolved oxygen readings during the morning<br />
ranged from 0.98 and 7.78 mg-L -1 for Treatment I, 1.20 and 3.89 mg-L -1 for Treatment II and 1.39 and<br />
6.64 mg-L -1 for Treatment III. Afternoon dissolved oxygen readings for Treatments I, II and III were 3.64<br />
and 12.87, 4.67 and 11.41 and 5.36 and 13.67 mg-L -1 , respectively. Dissolved oxygen concentration<br />
measured during the study remained in the favorable range for tilapia (Boyd 1990). The results support<br />
the findings of Liti et al. (2002) that Nile tilapia can tolerate low DO levels.<br />
1 The initial growout trial, e.g. Study 1, proposed for this investigation was initiated to assess the effect of high and lower dietary<br />
crude protein on growth performance of Nile tilapia in fertilized and nonfertilized ponds. Fry were sex reversed and fingerlings<br />
were stocked in ponds. However, due to production constraints, our industry cooperator (Santeh feed company of the<br />
Philippines) could not deliver the formulated feeds in adequate time to complete the study that was already in progress.<br />
Therefore, we improvised with the experiment already in progress by conducting Study 1 as outlined in this report., We<br />
evaluated the effects of a combined feed reduction on growout of tilapia using commercial feed in fertilized ponds. Also, our<br />
proposed second study (Study 2) essentially evaluates high and low dietary crude protein (with and without fishmeal) in fertilized<br />
ponds, hence it overlaps signficiantly with the original proposed Study 1, with exception that we did not test diets in unfertilized<br />
ponds. A majority of farmers fertilize there ponds so we have largely captured the objective of the original planned Study 1<br />
through experiments outlined here with Study 2.<br />
208
209<br />
TECHNICAL REPORTS: INVESTIGATIONS 2009–2011<br />
The average water temperature readings in the morning range between 28.43 and 31.97 o C, while<br />
afternoon water temperature ranged from 31.57 to 37.50 o C. Preferred water temperatures for tilapia<br />
growth are approximately 28.0-32.0 o C, but range varies depending on the tilapia species cultured.<br />
Tilapias reportedly tolerate temperatures up to 40 o C, but stress-induced disease and mortality are<br />
problematic when temperatures are around 37.0 or 38.0 o C (Teichert-Coddington et al. 1997). Fluctuation<br />
of the water temperature also affects growth due to the rise and fall of temperature, energy required for<br />
maintenance increases rapidly, thus decreasing the energy available for growth (Soderberg 1997).<br />
Average pH ranged between 6.93 and 8.37. Boyd (1998) reported that waters with a pH range of 6.5 – 9<br />
are the most suitable for fish production. Readings for total ammonia nitrogen and nitrite levels during<br />
the experiment were in the desirable range for all the treatments. The European Inland Fisheries<br />
Advisory Commission (1993) reported that the toxic level of NH4 to fish is 2 mg/L. The average value of<br />
Secchi disc reading were 23.3 and 72.7, 22.3 and 78.3 and 24.3 and 57.7 cm for Treatments I, II and III,<br />
respectively. Water quality parameters showed no significant difference among treatments at 5% level of<br />
significance.<br />
In our previous work we found that 67% daily feeding, 50% daily feeding and alternate day feeding at<br />
100% level when used alone are all effective in reducing feed and production costs with little impact on<br />
total yield (Brown et al. 2000, Bolivar et al. 2003, Bolivar et al. 2006; Bolivar et al. 2010). With the 67%<br />
daily feeding protocol animals grew to virtually identical sizes at harvest relative to the 100% daily<br />
feeding level, while the other feed reduction protocols elicited up to 50% cost savings, but final size at<br />
harvest was slightly less, albeit insignificant relative to animals on a typical feeding regimen. The results<br />
presented here shows that a combined feed reduction strategy that incorporates a sequential series of a 60day,<br />
67% feeding rate with a 60-day 50% daily or 100% alternate day feeding rate is less effective than<br />
67% feeding rate used alone in the pond growout of tilapia. Despite similar growth rates the survivorship<br />
of fish, and hence final extrapolated yield was reduced when using combined feed reduction strategies.<br />
We similarly found that the delayed onset of feeding combined with alternate day and 67% feeding rates<br />
was also less effective than that of animals fed at the typical 100% daily feeding rate (Borski et al. 2010;<br />
Bolivar et al. 2010). Collectively these results suggest that combined feed reduction strategies, at least<br />
based on the experimental paradigm tested here and previously, are less effective than applying 67%<br />
satiation, 50% satiation or 100% alternate day feeding strategies alone.<br />
Study 2 – Evaluation of pond growout performance of Nile tilapia fed high and low crude protein<br />
diets with and without fishmeal.<br />
The ingredients and proximate composition of the experimental diets are shown in Table 3. The 31% CP<br />
fishmeal and fishmeal free diets followed formulations from our previous work that showed the fishmeal<br />
free diets were 8% more cost effective than the standard diet containing fishmeal (Borski et al. 2011).<br />
Here we assess if reducing the crude protein levels of the diets might offer an additional cost benefit.<br />
Figure 2 shows the growth trend on average weight of Nile tilapia fed on four different diets after 120<br />
days of culture period. The highest growth performance measured by final average weight of 287.722 g,<br />
final average length of 23.3 cm and specific growth rate of 6.227% were attained in tilapia fed 31% CP<br />
extruded feed without dietary inclusion of fishmeal (Table 4). The next best performance was seen in<br />
tilapia fed the 26% CP extruded feed without dietary inclusion of fishmeal where a final mean body<br />
weight, body length and specific growth rate was 269.226 g, 22.7 cm, and 6.169%, respectively. Fish fed<br />
the 31% CP extruded feed with fishmeal attained an average final body weight of 254.416 g, final length<br />
of 22.3 cm, and specific growth rate of 6.118%. Collectively, there were no significant differences in<br />
growth performance of fish fed the different diets (P > 0.05).<br />
Similarly there was no significant difference in extrapolated yield of fish at harvest or in overall feed<br />
conversion ratio among the groups, although fish on the 26% CP, fishmeal free diet had the lowest FCR<br />
of 2.8 and highest extrapolated yield per hectare at harvest (Table 4). Low survival was partly due to the
TECHNICAL REPORTS: INVESTIGATIONS 2009–2011<br />
presence of predatory bird throughout the culture period. Additionally exposure to suboptimal, cooler<br />
temperature (22 C) along with extreme temperature shifts (22 - 28 C) during the culture period may have<br />
contributed to poorer survival (Figure 3). Other farmers in the region also exhibited generally low<br />
survival during the experimental period. Rakocy and McGinty (1989) indicated that the preferred<br />
temperature range for better tilapia growth and survival is 28-30 o C.<br />
Table 5 presents the minimum and maximum mean values of water quality parameters measured in each<br />
treatment over the course of the 120-day growth trial in ponds. Almost similar readings were observed<br />
for water quality parameters such as dissolved oxygen, water temperature, pH, alkalinity, total ammonia<br />
nitrogen, total phosphorus, CO2, total hardness and Secchi disc visibility. All water quality parameter<br />
readings during the experiment fall under the tolerable range for tilapia culture.<br />
In terms of cost and return analysis, all treatments had negative returns due to low number of stocks<br />
recovered during harvest (data not shown). Nevertheless, it is clear elimination of fishmeal and reducing<br />
the amount of crude protein in the diet provides a significant costs savings in feeds, which constitutes 60-<br />
70% of total production costs for growout of tilapia. The costs of feeds (43 PhP = $1) used in the<br />
experiments were as follows: PhP30.75 kg -1 for 31% CP with 6% fishmeal (treatment 1), PhP29.00 kg -1<br />
for 26% CP + AA with fishmeal (treatment 2), PhP29.65 kg -1 for 31% CP with 0% fishmeal (treatment 3),<br />
and PhP27.20 kg -1 for 26% CP + AA with 0% fishmeal (treatment 4). With reference to the standard 31%<br />
CP with 6% fishmeal diet, the 26% CP with fishmeal diet costs 5.69%, the 31% CP with 0% fishmeal<br />
costs 3.58%, and the 26% CP with 0% fishmeal costs 11.54% less per kg than the standard diet.<br />
Collectively, the results suggest and confirms our earlier report (Borski et al. 2011) that elimination of<br />
fishmeal from a standard 31% CP diet can produce a significant costs savings in feeds with no<br />
appreciable effect on growth performance and yield of tilapia raised in ponds. Here, we show that<br />
reductions in the amount of dietary CP, so long as the amino acid composition remains similar, can<br />
produce additional cost savings in feed of up to a 5.69% if fishmeal is included in the diet or up to<br />
11.69% if fishmeal is not included in the lower protein diets. Hence, this work demonstrates that both<br />
elimination of fishmeal and reductions in the amount of crude protein or both significantly reduces the<br />
costs of feeds for growout of tilapia with little overall impact on growth parameters, survival or yield of<br />
fish.<br />
Study 3 – Evaluation of dietary inclusion of nutritive protein binders and pellet processing aids on<br />
pellet durability and water stability of tilapia feeds.<br />
The majority of the tilapia feed sold to farmers is in the form of extruded pellets, which increases the cost of<br />
the feed. The development of a pellet that is manufactured with a ring die pellet mill would reduce the<br />
manufacturing cost of the diets sold to farmers. Also, the number of manufacturers of aquatic feeds could<br />
be expanded if semi-sinking pelleted fish feeds rather than extruded feeds could be used, since many feed<br />
mills that currently produce pelleted feeds for livestock do not have costly extruders. The objective of this<br />
experiment was to identify pellet binders that improve the stability of pellets fed in ponds as an alternative<br />
to extruded tilapia feed. Two experiments were conducted to determine if the inclusion of nutritive protein<br />
binders and pellet processing aids would increase the durability and water stability of tilapia feed.<br />
The average particle size of the basal diet (formulation in Table 6) was 291 and 281 microns in<br />
experiment 1 and 2, respectively. Based on traditional pellet durability tests The pellet quality results in<br />
both experiment indicated that that all pellets produced during the pelleting process were high quality (><br />
96% durability). The high quality pellets were primarily a result of the fine grinding of the basal diet,<br />
which increased the relative surface area contact between particles within the pellet. There was no<br />
difference in pellet durability index (PDI) between the control (no binder) diet and the diets containing the<br />
different binders (Table 7 and 8) based on traditional evaluation methods with the exception of the NHPT<br />
90 sec test. Water stability testing was the primary method that produced significant differences between<br />
210
211<br />
TECHNICAL REPORTS: INVESTIGATIONS 2009–2011<br />
the different pellet binders. The urea formaldehyde and wheat gluten treatments produced the best pellet<br />
water stability (PWS) results in Experiment 1. The urea-formaldehyde, gelatin, and wheat gluten<br />
increased (P
TECHNICAL REPORTS: INVESTIGATIONS 2009–2011<br />
Table 11 shows the average reading of the water quality parameters monitored in this study. All water<br />
quality parameters recorded were within the ideal ranges suitable for the culture of tilapia and did not<br />
show variances among treatments that could have affected the performance of the fish stock.<br />
The costs of fishmeal-free feeds (43 PhP = $1) used in the experiments were as follows: PhP30.20 kg -1<br />
for extruded 31% CP diet (treatment I), PhP29.20 kg -1 for slow-sinking pelleted 31% CP (treatment II),<br />
PhP29.00 kg -1 for extruded 26% CP (treatment III), and PhP28.00 kg -1 for slow-sinking pelleted 26% CP<br />
feed (treatment IV). With reference to the standard extruded 31% CP diet, the 31% CP pelleted diet is<br />
3.33%, the extruded 26% CP 4.00%, and the slow-sinking 26% CP diet is 6.67% less per kg.<br />
Collectively, these studies suggest that fishmeal-free extruded low CP and high CP diets produce similar<br />
performance with regard to growth, yield and survival of Nile tilapia, confirming results of Study 2. The<br />
use of high CP slow-sinking pelleted feed had the advantage over extruded feeds insofar as the cost of<br />
feed is 3.3% cheaper and performance is similar. It appears that sinking pelleted feeds at the lower crude<br />
protein level were somewhat less effective than the extruded feed, although no signficant loss of yield<br />
was observed with this feed compared with the others. Overall, it would appear that the use of sinkingpelleted<br />
feeds may have a cost effective advantage in tilapia production, particularly at the higher protein<br />
level. The results also suggest that manufacturers do not require costly extruders to produce effective<br />
tilapia aquafeeds.<br />
CONCLUSION<br />
It is estimated that 60-80% of total variable costs for growing tilapia is attributable to feeds. Through a<br />
series of studies we have established that feed costs can be reduced through modification of diet<br />
formulation and manufacturing with no significant impact on performance or yield of tilapia grown in<br />
ponds. The results suggest that elimination of fishmeal from a standard 31% CP diet can produce a<br />
significant costs savings in feeds with no appreciable effect on growth performance and yield of tilapia<br />
raised in ponds. This confirms our earlier report whereby fishmeal-free diet provide an additional 8%<br />
cost savings in growout of tilapia over and above the > 50% savings seen with an alternate day feeding<br />
protocol (Ayoola 2010; Borski et al. 2011). Additionally, we show that a reduction of dietary CP to 26%,<br />
so long as the amino acid composition remains similar to that of the higher 31% CP feed, can produce<br />
additional cost savings in feed of up to a 5.69% if fishmeal is included in the diet or up to 11.69% if<br />
fishmeal is not included in the lower protein diets. Hence, this work demonstrates that both elimination<br />
of fishmeal and reductions in the amount of crude protein or both significantly reduces the costs of feeds<br />
for growout of tilapia with little overall impact on growth parameters, survival or yield of fish.<br />
Toward development of a less costly slow-sinking pelleted versus extruded feed we evaluated dietary<br />
binders in tilapia diets. The combination of urea-formaldehyde and gelatin were the most effective<br />
binders that maximized water stability of pelleted tilapia feeds. pelleted fishmeal-free diet over an<br />
extruded form is further effective in reducing feed costs by 3-7% with negligible impact on performance.<br />
This was particularly true of the higher 31% CP diet. The ability to produce pelleted fishmeal-free<br />
aquafeeds that are of comparable performance as extruded feeds can not only promote an additional cost<br />
savings in feed, but would allow manufacturers who lack costly extruders, which include most livestock<br />
feed companies, to expand to production of aquafeeds. Training on feed reduction strategies, least cost<br />
feed formulations and feed manufacturing technologies was provided to tilapia farmers, feed companies,<br />
government officials and the academic community through a workshop held in Batangas, Philippines, a<br />
central region of tilapia production in the Philippines.<br />
212
LITERATURE CITED<br />
213<br />
TECHNICAL REPORTS: INVESTIGATIONS 2009–2011<br />
Asian Development Bank. 2005. An evaluation of small-scale freshwater rural aquaculture development<br />
for poverty reduction. 163 pp<br />
Axe, D. 2002. Feed production and technology manual. IMC Feed Ingredients. Lake Forest, IL.<br />
Ayoola, A. 2010. Replacement of Fishmeal with Alternative Protein Source in Aquaculture Diets. M.S.<br />
Thesis. North Carolina <strong>State</strong> <strong>University</strong>. 129 pp.<br />
Bolivar, R.B., Jimenez, E.B.J. and Brown, C.L. 2006. Alternate day feeding strategy for Nile tilapia grow<br />
out in the Philippines: Marginal cost-revenue analysis. North American Journal of Aquaculture, 68:<br />
192-197.<br />
Bolivar, R.B., C.L. Brown and E.T. Jimenez. 2003. Feeding Strategies to Optimize Tilapia Production in<br />
Ponds. Book of Abstract. Aquaculture 2003. Louisville, Kentucky, USA. p. 26.<br />
Bolivar R.B., Vera Cruz E.M, Jimenez E.B.T, Sayco RMV, Argueza R.L.B, Ferket P.R., Stark C.R.,<br />
Malheiros R, Ayoola A.A., Johnstone W.M., Picha M.E., Holler B.L., Won E.T., and R.J. Borski.<br />
2010. Feeding reduction strategies and alternative feeds to reduce production costs of tilapia culture.<br />
Technical Reports: Investigations 2007-2009, <strong>AquaFish</strong> Collaborative Research Support Program.<br />
<strong>Oregon</strong> <strong>State</strong> <strong>University</strong>. Vol 1. p 50-78. (309 pp)<br />
Borski, R. J., Bolivar, R. B., Jimenez, E. B. T., Sayco, R. M. V. and Argueza, R. L. B. 2010. Growth<br />
Performance of Nile Tilapia (Oreochromis niloticus L.) in Ponds in the Philippines using Combined<br />
Feed Reduction Strategies. Aquaculture 2010 Book of Abstracts. San Diego California, USA.<br />
Borski, R.J., Bolivar, R.B., Jimenez, E.B.T., Sayco, R.M.V., Arueza, R.L.B., Stark, C.R., and Ferket, P.R.<br />
2011. Fishmeal-free diets improve the cost effectiveness of culturing Nile tilapia (Oreochromis<br />
niloticus, L.) in ponds under an alternate day feeding strategy. p 95-101. In Liping L. and and<br />
Fitzsimmons K. (eds.). Proceedings of the Ninth International Symposium on Tilapia in Aquaculture.<br />
April 21-24. Shanghai, China. 407 p<br />
Boyd, C. E. 1990. Water Quality in Ponds for Aquaculture. Alabama Agriculture Experiment<br />
Station, Auburn <strong>University</strong>, Alabama, USA.<br />
Boyd, C. E. 1998. Water Quality for Pond Aquaculture. Research and development series No. 43. pp.<br />
37. International Centre for aquaculture and aquatic Environments. Alabama Agricultural Experiment<br />
Station. Auburn <strong>University</strong>.<br />
Brown, C.L., Bolivar, R.B., Jimenez, E. T., and Szyper, J.P. 2000. Timing of the onset of supplemental<br />
feeding of Nile tilapia (Oreochromis niloticus) in ponds. p. 237-240. In: Fitzsimmons, K. and Filho,<br />
J.C. (eds.). Tilapia Aquaculture in the 21 st Century. Proceedings from the Fifth International<br />
Symposium on Tilapia Aquaculture. September 3-7. Rio de Janeiro, Brazil. 682 p.<br />
Brown, E.E. 1983. World Fish Farming: Cultivation and Economics. 2 nd edn. AVI Publishing,<br />
Westport, CT. 397 pp.<br />
Duncan, D. B. 1955. Multiple ranges and multiple F-tests. Biometrics, 11: 1-42.<br />
El-Sayed, A.F.M. 2006. Nutrition and Feeding. In: Tilapia Culture. CABI Publishing, Oxford, U.K. 277<br />
pp.<br />
European Inland Fisheries Advisory Commission. 1993. Water quality criteria for European fresh water<br />
fish. Report on Ammonia and Inland Fisheries. Water Res., 7: 1011.<br />
Ferket, P.R., E. van Heugten, T. A. van Kempen, and R. Angel, 2003. Nutritional Strategies to Reduce<br />
Environmental Emissions from Non-Ruminants. J. An. Sci. 80(Electronic Supplement 2): 2289<br />
http://www.asas.org/jas/symposia/esupp2/default.asp<br />
Jackson, A.J., B.S. Caper, A.J. Matty. 1982. Evaluation of some plant proteins in complete diets for the<br />
tilapia Sarotherodon mossambicus. Aquaculture 27:97-109.<br />
Leonard, G.O., S. Divakaran, A.G. Tacon. 2002. Methods for determining the physical stability of shrimp in<br />
water. Aquaculture Research, 33, pp 369-377.
TECHNICAL REPORTS: INVESTIGATIONS 2009–2011<br />
Li, M.H., Lim, C.E., and Webster, C.D. 2006. Feed Formulation and Manufacture. In: Tilapia: Biology,<br />
culture and nutrition. C.E. Lim and C.D. Webster (Eds). The Haworth Press, Inc., New York. 517-<br />
559.<br />
Lim, C.E. and Webster,C.D. 2006. Nutrient Requirement. In: Tilapia: Biology, culture and nutrition.<br />
C.E. Lim and C.D. Webster (Eds). The Haworth Press, Inc., New York. 469-501.<br />
Middleton, T.F, P.R. Ferket, L.C. Boyd, H.V. Daniels, and M.L Gallagher. 2001. An evaluation of coextruded<br />
poultry silage and culled jewel sweet potatoes as a feed ingredient for hybrid Tilapia<br />
(Oreochromis niloticus X O. mossambicus). Aquaculture 198:269-280.<br />
Liti, D. M., Mac’Were, O. E. and Veverica, K. L. 2002. Growth performance and economic benefits of<br />
Oreochromis niloticus/Clarias gariepinus polyculture fed on three supplementary feeds in fertilized<br />
tropical ponds. In: K. McElwee, K. Lewis, M. Nidiffer, and P. Buitrago (eds.). Nineteenth Annual<br />
Technical Report. Pond Dynamics/Aquaculture <strong>CRSP</strong>, <strong>Oregon</strong> <strong>State</strong> <strong>University</strong>, Corvallis, <strong>Oregon</strong>.<br />
pp. 11-16.<br />
National Research Council. 1993. Nutrient Requirements of Fish. National Academic Press,<br />
Washington, DC.<br />
Rokey, G. and G. Huber. 2005. Aquatic Feed: Extrusion processing for aquaculture feeds. Feed<br />
Technology V. E. Schofield, ed. American Feed Industry Assn. Arlington, VA. pp 292-293.<br />
Soderberg, R. W. 1997. Factors affecting fish growth and production. p. 199-213. In: H. S. Egna and C.<br />
E. Boyd (eds.). Dynamics of Pond Aquaculture. CRC Press. New York, USA. 437 pp.<br />
Teichert-Coddington, D. R., Popma, T. J. and Lovshin, L. L. 1997. Attributes of Tropical Pond-cultured<br />
Fish. p. 183-198. In: H. S. Egna and C. E. Boyd (eds.). Dynamics of Pond Aquaculture. CRC Press.<br />
New York, USA. 437 pp.<br />
214
215<br />
TECHNICAL REPORTS: INVESTIGATIONS 2009–2011<br />
Figure 1. Average weight of Nile tilapia after 120 days of culture in ponds under combined feed<br />
reduction strategies: Treatment I – 67% daily feeding until harvest; Treatment II - 67% daily feeding for<br />
60 days followed by 50% daily feeding until harvest; and Treatment III - 67% daily feeding for 60 days,<br />
followed by 100% alternate day feeding until harvest.<br />
Table 1. Growth performance of Nile tilapia in ponds using combined feed reduction strategies.<br />
Parameters<br />
67% daily feeding<br />
until harvest<br />
Treatments<br />
67% daily feeding<br />
for 60 days, 50%<br />
daily feeding until<br />
harvest<br />
67% daily feeding for<br />
60 days, 100%<br />
alternate day feeding<br />
until harvest<br />
Initial weight (g) 0.36 a 0.36 a 0.36 a<br />
Final average weight (g) 183.1 + 77.1 a 168.5 + 39.9 a 183.1 + 16.0 a<br />
Initial length (cm) 2.8 a 2.8 a 2.8 a<br />
Final average length (cm) 20.1+ 2.9 a 19.9 + 1.4 a 20.5 + 0.6 a<br />
Gain in weight (g) 182.7 + 77.1 a 168.1 + 39.9 a 182.7 + 16.0 a<br />
Daily gain in weight (g) 1.5 + 0.6 a 1.4 + 0.3 a 1.5 + 0.1 a<br />
Gain in length (cm) 17.3 + 2.9 a 17.1 + 1.4 a 17.7 + 0.6 a<br />
Daily gain in length (cm) 0.14 + 0.02 a 0.14 + 0.01 a 0.15 + 0.00 a<br />
Feed Conversion Ratio 1.8 + 0.3 a 2.0 + 0.1 a 2.0 + 0.2 a<br />
Yield per hectare (kg ha -1 ) 2968.7 + 439.6 a 1980.7 + 541.8 b 2024.7 + 329.0 b<br />
Feed consumed per hectare (kg ha -1 ) 5201.1 + 1238 a 3965.2 + 1037 a 4045.3 + 1104 a<br />
Survival (%) 46.9 + 24.1 a 29.3 + 4.7 a 27.7 + 4.1 a<br />
Means with the same letter superscipt are not significantly different (P
TECHNICAL REPORTS: INVESTIGATIONS 2009–2011<br />
Table 2. Average minimum and maximum reading for water quality parameters in ponds of Nile<br />
tilapia grown out for 120 days under combined feed reduction strategies.<br />
Parameters<br />
67% daily feeding<br />
until harvest<br />
216<br />
67% daily<br />
feeding for 60<br />
days, 50% daily<br />
feeding until<br />
harvest<br />
67% daily feeding<br />
for 60 days, 100%<br />
alternate day<br />
feeding until<br />
harvest<br />
Min Max Min Max Min Max<br />
Dissolved Oxygen (9AM) (mg-L -1 ) 0.98 7.78 1.20 3.89 1.39 6.64<br />
Dissolved Oxygen (3PM) (mg-L -1 ) 3.64 12.87 4.67 11.41 5.36 13.67<br />
Water Temperature (9AM) ( o C) 28.43 31.90 28.53 31.77 28.50 31.97<br />
Water Temperature (3PM) ( o C) 31.70 36.37 31.57 36.27 32.00 37.50<br />
Hydrogen-Ion (pH) 7.07 8.37 6.97 8.20 6.93 8.27<br />
Total Ammonia Nitrogen (mg L -1 ) 0.017 1.090 0.018 1.456 0.022 0.942<br />
Nitrite-Nitrogen (mg L -1 ) 0.067 0.075 0.067 0.075 0.075 0.075<br />
Secchi Disc Visibility (cm) 23.3 72.7 22.3 78.3 24.3 57.7
217<br />
TECHNICAL REPORTS: INVESTIGATIONS 2009–2011<br />
Table 3. Ingredients (inclusion rate in kg ton -1 of feed) and proximate composition of caloric balanced<br />
extruded grower test diets formulated with 31% crude protein (CP) or 26% CP supplemented with amino<br />
acids (AA) with 6% fishmeal and 0% fishmeal (fishmeal substituted with porkmeal).<br />
RAW MATERIALS 31% CP with 26% CP + AA with 31% CP with 26% CP + AA with<br />
6% fishmeal 6% fishmeal 0% fishmeal 0% fishmeal<br />
Soybean Meal (HP) 45% 422.00 250.00 400.00 240.00<br />
Corn Gluten 50.00 40.00 53.00 40.00<br />
Hydrolyzed Animal Protein 30.00 30.00 30.00 30.00<br />
Fishmeal Tuna 55% 60.00 60.00 0.00 0.00<br />
Pork Meat Meal 55% 0.00 0.00 74.00 74.00<br />
Copra Cake 73.00 111.20 76.00 135.00<br />
Rice Bran 178.20 259.00 182.90 226.65<br />
Cassava Meal 150.00 200.00 150.00 214.20<br />
Fish Oil (Local) 5.50 5.00 5.00 5.00<br />
Coconut Oil 5.00 15.00 5.00 10.00<br />
Mono di-calcium phosphate 12.00 6.00 10.00 2.00<br />
Salt 5.00 5.00 5.00 5.00<br />
Mineral Premix 3.00 3.00 3.00 3.00<br />
Vitamin Premix 6.30 5.80 6.10 5.80<br />
L-Threonine 0.00 2.50 0.00 2.50<br />
L-Lysine 0.00 6.00 0.00 5.25<br />
DL-Methionine 0.00 1.50 0.00 1.60<br />
TOTAL WEIGHT 1000.00 1000.00 1000.00 1000.00<br />
DE Fish (kcal/kg) 2477.92 2455.75 2484.50 2443.86<br />
Crude Protein (%) 30.99 25.71 31.07 25.66<br />
Crude Fat (%) 6.21 6.87 6.23 6.67<br />
Crude Fiber (%) 4.41 4.31 4.29 4.26<br />
Starch (%) 17.36 22.33 17.40 22.57<br />
Ash (%) 8.20 10.23 9.05 10.21<br />
Ca (%) 0.96 0.94 0.91 0.92<br />
Avail. Phosphorus (%) 0.67 0.64 0.66 0.64<br />
Lysine (%) 1.51 1.50 1.50 1.49<br />
Methionine (%) 0.54 0.54 0.50 0.53<br />
Methionine+Cysteine (%) 0.97 0.87 0.96 0.89<br />
Threonine (%) 1.06 1.05 1.07 1.07<br />
Tryptophan (%) 0.33 0.25 0.42 0.34
TECHNICAL REPORTS: INVESTIGATIONS 2009–2011<br />
Figure 2. Average weight of Nile tilapia grown in ponds and fed extruded grower test diets formulated<br />
with 31% crude protein (CP) or 26% CP supplemented with amino acids with 6% fishmeal and 0% fishmeal<br />
(fishmeal substituted with porkmeal). Fish were fed different diets during the last 60 days of the 120-day<br />
culture period in ponds. Treatment 1 – 31% CP with 6% fishmeal; Treatment 2 - 26% CP supplemented<br />
with amino acids with 6% fishmeal; Treatment 3 - 31% CP extruded feed with 0% fishmeal; Treatment 4 -<br />
26% CP supplemented with amino acids with 0% fishmeal. All diets were extruded and least cost<br />
formulated.<br />
218
219<br />
TECHNICAL REPORTS: INVESTIGATIONS 2009–2011<br />
Table 4. Summary on growth performance, survival and yield of Nile tilapia fed extruded grower test<br />
diets formulated with 31% crude protein (CP) or 26% CP supplemented with amino acids (AA) with 6%<br />
fishmeal and 0% fishmeal (fishmeal substituted with porkmeal). Fish were fed diets during the last 60<br />
days of the 120-day culture period in earthen ponds.<br />
PARAMETERS TREATMENTS<br />
31% CP<br />
with 6%<br />
fishmeal<br />
26% CP + AA<br />
with 6%<br />
fishmeal<br />
31% CP<br />
with 0%<br />
fishmeal<br />
26% CP + AA<br />
with 0%<br />
fishmeal<br />
Initial Average weight (g) 0.162 + 0 0.162 + 0 0.162 + 0 0.162 + 0<br />
Final Average Weight (g) 254.416 + 59.2 243.917 + 12 287.722 + 48.1 269.226 + 50.8<br />
Initial Average Length (cm) 2.337 + 0 2.337 + 0 2.337 + 0 2.337 + 0<br />
Final Average Length (cm) 22.3 + 1.3 22.1 + 0.2 23.3 + 1.2 22.7 + 1.1<br />
Gain in Weight (g) 254.254 + 59.2 243.755 + 12 287.560 + 48.1 269.064 + 50.8<br />
Daily Gain in Weight (g) 2.119 + 0.49 2.031 + 0.10 2.396 + 0.40 2.242 + 0.42<br />
Specific Growth Rate (%) 6.118 + 0.19 6.097 + 0.04 6.227 + 0.15 6.169 + 0.16<br />
Gain in Length (cm) 20.0 + 1.3 19.8 + 0.2 21.0 + 1.2 20.4 + 1.1<br />
Daily Gain in Length (cm) 0.167 + 0.011 0.165 + 0.002 0.175 + 0.010 0.170 + 0.009<br />
Feed Conversion Ratio 3.4 + 0.7 3.5 + 0.9 3.2 + 0.3 2.8 + 0.7<br />
Feed Conversion Efficiency 30.5 + 6.7 30.3 + 9.1 31.0 + 2.5 37.0 + 9.1<br />
Yield per Hectare (kgs/ha) 2036.0 + 501.8 1918.7 + 452.6 2183.3 + 242.7 2506.7 + 691.1<br />
Feed consumed per Hectare<br />
(kgs/ha)<br />
6651.5 + 624 6382.6 + 555 7017.0 + 210 6729.1 + 355<br />
Survival (%) 20.3 + 6.6 20.6 + 5.0 19.1 + 2.3 23.3 + 5.9
TECHNICAL REPORTS: INVESTIGATIONS 2009–2011<br />
Figure 3. Weekly pond temperatures of Nile tilapia fed extruded grower test diets formulated with 31%<br />
crude protein (CP) or 26% CP supplemented with amino acids with 6% fishmeal and 0% fishmeal (fishmeal<br />
substituted with porkmeal). Fish were fed different diets during the last 60 days of the 120-day culture<br />
period in ponds. Treatment 1 – 31% CP with 6% fishmeal; Treatment 2 - 26% CP supplemented with<br />
amino acids with 6% fishmeal; Treatment 3 - 31% CP extruded feed with 0% fishmeal; Treatment 4 - 26%<br />
CP supplemented with amino acids with 0% fishmeal.<br />
220
221<br />
TECHNICAL REPORTS: INVESTIGATIONS 2009–2011<br />
Table 5. Minimum and maximum mean values of pond water quality parameters measured over a 120<br />
day culture period in which fish were fed extruded grower test diets formulated with 31% crude protein<br />
(CP) or 26% CP supplemented with amino acids (AA) with 6% fishmeal and 0% fishmeal (fishmeal<br />
substituted with porkmeal). Fish were fed diets during the last 60 days of the 120-day culture period in<br />
earthen ponds.<br />
PARAMETERS TREATMENTS<br />
Dissolved Oxygen<br />
(mg- l -1 )<br />
Water Temperature ( o C)<br />
Hydrogen Ion<br />
Concentration (pH)<br />
31% CP<br />
with 6%<br />
fishmeal<br />
26% CP + AA<br />
with 6%<br />
fishmeal<br />
31% CP<br />
with 0%<br />
fishmeal<br />
26% CP + AA<br />
with 0%<br />
fishmeal<br />
1.98 – 6.10 2.09 – 6.25 2.03 – 6.39 2.98 – 6.36<br />
22.57 – 28.57 22.77 – 28.53 22.53 – 28.43 22.53 – 28.50<br />
6.87 – 8.43 6.57 – 8.63 7.27 – 8.63 7.37 – 8.67<br />
Alkalinity (mg- l -1 ) 172.67 – 251.00 169.33 – 248.33 190.67 – 284.00 171.00 – 243.00<br />
Total Ammonia Nitrogen<br />
(mg- l -1 )<br />
Total Phosphorus<br />
(mg- l -1 )<br />
Carbon Dioxide<br />
Concentration (mg- l -1 )<br />
0.045 – 0.827 0.031 – 0.817 0.047 – 0.876 0.045 – 0.846<br />
0.287 – 0.498 0.210 – 0.493 0.292 – 0.502 0.237 – 0.520<br />
0.00 – 36.33 3.67 – 35.00 2.67 – 34.67 0.00 – 24.67<br />
Total Hardness (mg- l -1 ) 122.67 – 146.67 126.67 – 142.00 141.33 – 171.33 113.33 – 132.00<br />
Secchi Disc Visibility (cm) 24.33 – 43.00 21.00 – 33.67 16.67 – 32.00 15.33 – 45.33<br />
Table 6. The composition of the basal tilapia grower diet used to assess inclusion of nutritive<br />
protein binders on pellet durability and water stability. CP, crude protein.<br />
Ingredient % Calculated analysis<br />
Corn 33.75 ME, kcal/kg 2650<br />
Soybean meal (48 % CP) 25.00 Protein, % 25.50<br />
Distillers Dried Grains w/ sol. 5.00 Ca, % 0.90<br />
Rice bran 22.00 Available P, % 0.62<br />
Poultry by-product meal, 65% CP 10.00 Total Lys, % 1.49<br />
Poultry fat<br />
0.50<br />
Limestone 0.45<br />
Dicalcium phosphate 1.55<br />
L-Lysine 0.30<br />
DL-Methionine 0.15<br />
Salt 0.50<br />
Vitamin premix 0.50<br />
Choline chloride (60%) 0.10<br />
Trace mineral premix 0.20
TECHNICAL REPORTS: INVESTIGATIONS 2009–2011<br />
Table 7. Pellet quality and water stability of tilapia feed with the addition of pellet binder.<br />
Binder<br />
Treatment<br />
NHPT<br />
30 1<br />
NHPT<br />
60 2<br />
PDI 2<br />
222<br />
adjPDI 3<br />
%<br />
PWS 4<br />
PCS 5<br />
Control 96.4 93.1 97.8 84.5 50.1 ab 10.5 12.7<br />
Urea-formaldehyde<br />
(0.2%)<br />
MC 6<br />
96.9 94.0 97.8 86.8 68.8 d 10.5 12.7<br />
Gelatin (0.1%) 96.5 93.1 97.3 a 85.6 53.0 ac 10.0 12.6<br />
Wheat Gluten<br />
(2.0%)<br />
96.9 93.8 98.0 87.3 60.0 cd 10.2 12.8<br />
Carob Bean 97.0 93.9 97.7 85.2 48.8 a 10.2 13.4 a<br />
SEM 0.15 0.27 0.14 0.67 3.00 0.28 0.17<br />
Source of Variation<br />
P-value<br />
0.0588 0.0550 0.0468 0.0810 0.0004 0.7259 0.0423<br />
Table 8. Pellet quality and water stability of tilapia feed with the addition of pellet binder.<br />
Binder<br />
Treatment<br />
NHPT<br />
30 1<br />
NHPT<br />
60 1<br />
Control 96.8 94.2 91.5 a<br />
Wheat Gluten<br />
(WG – 2%)<br />
96.9 94.3 91.8 a<br />
Gelatin (G - 0.1%) 97.2 94.8 93.3 b<br />
Urea formaldehyde (UF<br />
– 0.2%) 7 97.0 95.3 93.0 ab<br />
UF(0.2%) + G(0.1%) 97.2 95.5 93.5 b<br />
UF(0.2%) + WG (2%) 96.8 95.0 92.7 ab<br />
NHPT<br />
90 1 PDI 2 MPDI 3<br />
PWS 4<br />
%<br />
97.5 91.1 68.2 d<br />
MC 6<br />
11.47<br />
96.7 91.7 67.7 d 11.36<br />
97.7 91.9 72.8 bc<br />
11.53<br />
97.4 92.6 75.1 ac 11.50<br />
97.8 92.9 78.4 a<br />
97.6 92.1 69.1 d<br />
11.53<br />
11.93<br />
SEM 0.28 0.30 0.41 0.22 0.43 1.11 0.11<br />
Source of variation<br />
P-value<br />
0.9023 0.0806 0.0441 0.1495 0.1428 0.0005 0.0423<br />
1 New Holmen Pellet Tester at 68 mbar and 30, 60, or 90 seconds.<br />
2 Pellet durability index, ASAE S269.3 Cubes, Pellets and Crumbles - Definitions and Methods for Determining Density,<br />
Durability, and Moisture Content.<br />
3 Modified pellet durability index ASAE S269.3 with the addition of three 19 mm hex nuts.<br />
4 Duplicate 50g samples of pellets from each treatment were place on a sieve with 3 mm diameter openings. The sample was<br />
slowly immersed in deionized water (24 o C) for 10 min. The sieve was removed from water and drained for 1 min, oven-dried at<br />
105 o C for 9 h, cooled in a desiccator, and reweighed. Pellet water stability (PWS) was calculated as the percentage difference in<br />
sample weight after re-weighing and expressed as % of dry matter.<br />
5 Pellet compression strength, which was determined with a manually operated compression pellet tester (Amandas Kahl Nachf,<br />
2057 Reinbek. Germany).<br />
6 Moisture content, American Association of Cereal Chemists. 1995. AACC Method 44-15A: Moisture—Air-Oven Method. In<br />
Approved Methods of the American Association of Analytical Chemists. Vol. 2. AACC, St. Paul, MN.<br />
7 Not approved for aquaculture feeds in the United <strong>State</strong>s.
223<br />
TECHNICAL REPORTS: INVESTIGATIONS 2009–2011<br />
Table 9. Ingredients (inclusion rate in kg ton -1 of feed) and proximate composition of caloric balanced<br />
floating extruded and slow-sinking pelleted grower test diets formulated with 31% crude protein (CP) or<br />
26% CP supplemented with amino acids (AA). All diets contained 0% fishmeal (fishmeal substituted<br />
with porkmeal). Slow-sinking pelleted grower test diets contained 0.2% urea-formaldehyde + 0.1%<br />
gelatin to enhance pellet water stability and durability.<br />
RAW MATERIALS Treatment I<br />
31% CP floating<br />
extruded feed<br />
Binder (%) Urea-<br />
Formaldehyde<br />
Treatment II<br />
31% CP<br />
slow-sinking<br />
pelleted feed<br />
Treatment III<br />
26% CP<br />
floating<br />
extruded feed<br />
Treatment IV<br />
26% CP<br />
slow-sinking<br />
pelleted feed<br />
0.00 2.00 0.00 2.00<br />
Binder (%) Gelatin Based 0.00 1.00 0.00 1.00<br />
Soybean Meal (HP) 45% 400.00 400.00 240.00 240.00<br />
Corn Gluten 53.00 53.00 40.00 40.00<br />
Hydrolized Animal Protein 30.00 30.00 30.00 30.00<br />
Fishmeal Tuna 55% 0.00 0.00 0.00 0.00<br />
Pork Meat Meal 55% 74.00 74.00 74.00 74.00<br />
Copra Cake 76.00 76.00 135.00 135.00<br />
Rice Bran 182.90 179.90 226.65 223.65<br />
Cassava Meal 150.00 150.00 214.20 214.20<br />
Fish Oil (Local) 5.00 5.00 5.00 5.00<br />
Coconut Oil 5.00 5.00 0.00 0.00<br />
Mono di-calcium phosphate 10.00 10.00 10.00 10.00<br />
Limestone 0.00 0.00 2.00 2.00<br />
Salt 5.00 5.00 5.00 5.00<br />
Mineral Premix 3.00 3.00 3.00 3.00<br />
Vitamin Premix 6.10 6.10 5.80 5.80<br />
L-Threonine 0.00 0.00 2.50 2.50<br />
L-Lysine 0.00 0.00 5.25 5.25<br />
DL-Methionine 0.00 0.00 1.60 1.60<br />
TOTAL WEIGHT 1000.00 1000.00 1000.00 1000.00<br />
DE Fish (kcal/kg) 2,484.50 2,486.94 2,443.86 2,443.41<br />
Crude Protein (%) 31.00 31.00 26.00 26.00<br />
Crude Fat (%) 6.23 6.22 6.67 6.67<br />
Crude Fiber (%) 4.29 4.25 4.26 4.24<br />
Starch (%) 17.40 17.32 22.57 21.86<br />
Ash (%) 9.05 8.91 10.21 9.32<br />
Ca (%) 0.91 0.91 0.92 0.92<br />
Avail. Phosphorus (%) 0.66 0.66 0.64 0.64<br />
Lysine (%) 1.50 1.49 1.49 1.49<br />
Methionine (%) 0.50 0.50 0.53 0.53<br />
Methionine+Cysteine (%) 0.96 0.93 0.89 0.88<br />
Threonine (%) 1.07 1.07 1.07 1.07<br />
Tryptophan (%) 0.42 0.42 0.34 0.34
TECHNICAL REPORTS: INVESTIGATIONS 2009–2011<br />
Culture Period (days)<br />
Figure 4. Average weight of Nile tilapia grown in ponds and fed floating extruded or slow-sinking<br />
pelleted, fishmeal-free grower test diets formulated with 31% crude protein (CP) or 26% CP<br />
supplemented with amino acids. Fish were fed different diets during the last 60 days of the 135-day<br />
culture period in ponds. Treatment 1 – 31% CP floating extruded feed; Treatment II - 31% CP slowsinking<br />
pelleted feed; Treatment III - 26% CP floating extruded feed; Treatment IV - 26% CP slowsinking<br />
pelleted feed. All diets were least cost formulated. Diets with 26% CP were supplemented with<br />
amino acids to provide similar amino acid profiles as the 31% CP diets. All slow-sinking pelleted diets<br />
contained 0.2% urea-formaldehyde and 0.1% gelatin to enhance pellet water stability.<br />
224
225<br />
TECHNICAL REPORTS: INVESTIGATIONS 2009–2011<br />
Table 10. Average weight of Nile tilapia grown in ponds and fed floating extruded or slow-sinking<br />
pelleted, fishmeal-free grower test diets formulated with 31% crude protein (CP) or 26% CP<br />
supplemented with amino acids. Fish were grown for 135 days and treatment diets were applied from day<br />
75 until harvest. mean + SEM<br />
PARAMETERS<br />
Treatment I<br />
31% CP<br />
floating<br />
extruded feed<br />
Treatment II<br />
31% CP<br />
slow-sinking<br />
pelleted feed<br />
Treatment III<br />
26% CP<br />
floating<br />
extruded feed<br />
Treatment IV<br />
26% CP<br />
slow-sinking<br />
pelleted feed<br />
Initial Average Body Weight (g) 0.170 + 0.0 0.170 + 0.0 0.170 + 0.0 0.170 + 0.0<br />
Final Average Body Weight (g) 180.667 + 3.01 a 227.947 + 5.46 b 237.457 + 7.87 b 136.637 + 2.03 c<br />
Initial Average Total Length (cm) 2.288 + 0.0 2.288 + 0.0 2.288 + 0.0 2.288 + 0.0<br />
Final Average Total Length (cm) 20.526 + 0.60 a 21.110 + 0.15 a 21.033 + 0.21 a 18.160 + 0.10 b<br />
Daily Gain in Weight (g/day) 1.504 + 0.14 1.898 + 0.47 1.977 + 0.72 1.137 + 0.05<br />
Daily gain in Total length (cm/day) 0.152 + 0.01 0.157 + 0.01 0.156 + 0.02 0.132 + 0.00<br />
Specific Growth Rate (%) 5.800 + 0.08 5.948 + 0.21 5.932 + 0.29 5.573 + 0.04<br />
Survival Rate (%) 48.4 + 2.20 44.7 + 11.6 42.1 + 11.6 50.6 + 3.9<br />
Extrapolated Fish Yield per Hectare<br />
(kg/ha)<br />
Extrapolated Feed Consumed per<br />
Hectare (kg/ha)<br />
3214.0 + 194.0 3288.7 + 626.5 3026.7 + 147.3 2650.7 + 147.6<br />
5986.6 + 238.5 6007.7 + 533.8 6062.1 + 633.2 5167.0 + 313.9<br />
Feed Conversion Ratio 1.9 + 0.05 1.9 + 0.20 2.0 + 0.12 2.0 + 0.01<br />
Feed Conversion Efficiency (%) 53.5 + 1.3 53.8 + 5.7 50.4 + 3.0 51.2 + 0.3
TECHNICAL REPORTS: INVESTIGATIONS 2009–2011<br />
Table 11. Mean and range values for water quality parameters recorded weekly for Nile tilapia grown<br />
in ponds and fed floating extruded or slow-sinking pelleted, fishmeal-free grower test diets formulated<br />
with 31% crude protein (CP) or 26% CP supplemented with amino acids. Fish were grown for 135<br />
days and treatment diets were applied from day 75 until harvest.<br />
DO (mg l -1 )<br />
Temperature ( o C)<br />
pH<br />
Total Alkalinity<br />
(mg l -1 )<br />
Total Ammonia<br />
Nitrogen (mg l -1 )<br />
Total Phosphorus<br />
(mg l -1 )<br />
Secchi Disc<br />
Visibility (cm)<br />
Parameters<br />
Treatment I<br />
31% CP<br />
floating<br />
extruded feed<br />
226<br />
Treatment II<br />
31% CP<br />
slow-sinking<br />
pelleted feed<br />
Treatments<br />
Treatment III<br />
26% CP<br />
floating<br />
extruded feed<br />
Treatment IV<br />
26% CP<br />
slow-sinking<br />
pelleted feed<br />
Mean 3.53 3.86 3.84 3.70<br />
Min - Max 1.07-8.50 1.46-6.35 1.56-7.35 1.14-9.32<br />
Mean 29.4 29.4 29.3 29.5<br />
Min - Max 24.8-31.7 24.8-31.8 24.6-31.5 25.0-31.7<br />
Mean 8.2 8.2 8.2 8.2<br />
Min - Max 7.2-9.0 7.1-9.2 7.4-9.3 7.3-9.3<br />
Mean 200.5 211.9 202.0 201.4<br />
Min - Max 168.3-237.0 168.0-253.7 166.7-245.0 169.3-243.7<br />
Mean 0.090 0.094 0.084 0.083<br />
Min - Max 0.007-0.199 0.018-0.238 0.012-0.237 0.009-0.174<br />
Mean 0.323 0.394 0.347 0.378<br />
Min - Max 0.120-0.685 0.173-0.675 0.142-0.628 0.200-0.677<br />
Mean 25.9 24.5 26.2 24.2<br />
Min - Max 16.7-76.7 18.0-63.3 17.3-73.3 19.3-73.3
227<br />
TECHNICAL REPORTS: INVESTIGATIONS 2009–2011<br />
Develop Feeding Strategies for Moringa Oleifera and Leucaena Leucocephala<br />
as Protein Sources in Tilapia Diets<br />
Sustainable Feed Technology/Experiment/09SFT05PU<br />
Rebecca Lochmann, Carole Engle, and Tom Kasiga<br />
<strong>University</strong> of Arkansas at Pine Bluff<br />
Pine Bluff, Arkansas, USA<br />
Sebastian W. Chenyambuga, Hegi Shighulu, Nazael Madalla, and Berno V. Mnembuka<br />
Sokoine <strong>University</strong> of Agriculture,<br />
Morogoro, Tanzania<br />
Kwamena Quagrainie<br />
Purdue <strong>University</strong><br />
West Lafayette, Indiana, USA<br />
ABSTRACT<br />
Digestibility and feeding trials were performed to evaluate Moringa oleifera and Leucaena leucocephala<br />
leaf meals as protein sources (compared to soybean meal) in Nile tilapia diets. Both leaf meals were<br />
obtained from Tanzania. The leaf meals were soaked in water to reduce anti-nutritional factors, dried, and<br />
ground to a small particle size before incorporation into diets. Five diets were made for both trials: the<br />
control diet contained 50% soybean meal (SOY), and diets 15 MOR and 30 MOR were made by<br />
substituting 15 and 30% of the soybean protein with Moringa protein. Diets 15 LEU and 30 LEU were<br />
made by substituting 15 and 30% of the soybean protein with Leucaena protein. For the digestibility trial,<br />
diets containing 32% crude protein were used. Diets with 36% protein were used for the feeding trial due<br />
to the small initial fish size. The digestibility trial was carried out using mixed sex Nile tilapia of 200-400<br />
g in 150-L indoor tanks in a recirculating system with dechlorinated municipal water maintained at 28 0 C.<br />
Other water quality parameters were kept at optimum levels for Nile tilapia. Fish were conditioned to the<br />
experimental diets and the fecal removal process (fresh, floating feces were collected with a net) for 1<br />
week. Fecal collection was conducted 8-10 hours after the last meal in the evening, as well as the next<br />
morning before feeding. The fecal samples were dried at 50 0 C for 12 hours and then frozen until analysis.<br />
The apparent protein digestibility (APD, mean+SE, %) of the SOY diet (86.35±0.87) was higher than all<br />
others. The APD of the 15 MOR (84.69±0.59) and 30 MOR (83.34±1.10) diets were similar to each other<br />
and higher than the APD of the 15 LEU (78.49±0.91) and 30 LEU (74.70±0.52) diets. The APD of 30<br />
LEU was also lower than that of the 15 LEU diet. Overall, leaf meals reduced protein digestibility<br />
compared to soybean meal, but diets containing Moringa were digested better than those containing<br />
Leucaena. There was no difference in the apparent lipid digestibility (%) of the SOY (95.83±0.34) and 15<br />
MOR (95.19±0.62) diets. Lipid digestibility of the SOY diet was higher than that of 30 MOR<br />
(92.99±1.17), 15 LEU (94.46±0.06), and 30 LEU (92.98±0.24) diets. Lipid digestibility of the 30 MOR<br />
and 30 LEU diets was lower than that of the other diets. Both protein and lipid digestibility were inversely<br />
related to concentration of dietary fiber. For the feeding trial, 100 mixed-sex Nile tilapia, averaging 5.16 g<br />
individually were stocked in 1500-L outdoor circular plastic tanks supplied with reservoir water. The
TECHNICAL REPORTS: INVESTIGATIONS 2009–2011<br />
tanks were maintained as static systems except for periodic flushing when water quality parameters fell<br />
below the optimum for Nile tilapia. Subsamples of 30-50 fish were weighed every two weeks and water<br />
quality parameters were monitored weekly. The trial was terminated after 60 days. There were no<br />
differences in growth, feed conversion, survival, lysozyme, or proteolytic enzyme activity among<br />
treatments. Proximate and fatty acid composition of whole fish is still in progress.<br />
INTRODUCTION<br />
Over the last 30 years, aquaculture has grown worldwide faster than any other animal production sector<br />
(FAO 2007a). The average annual growth rate of aquacultural production was 10% compared with 3% in<br />
the cattle industry and 1.6% in captured aquatic species from natural environments. The rapid rise in<br />
aquaculture has generated an increase in the production of aquatic animal feeds. The estimated increase in<br />
production of aquaculture feeds from 2000 to 2010 was from about 13 million metric tonnes (mmt) to 30<br />
mmt (Francis et al. 2001). Securing raw materials for these feeds will be a continuous challenge for the<br />
aquaculture industry.<br />
In Africa, economic studies have demonstrated that fish farming is a viable enterprise combining high<br />
gains with minimal costs (Molnar et al. 1991). Wijkstrom and MacPherson (1990) indicated that largescale<br />
and intensive aquaculture enterprises are beyond the means of most farmers in Africa, but smallscale<br />
aquaculture with commercial orientation can be a profitable economic activity.<br />
Some of the problems that make tilapia farming in Tanzania unprofitable include low productivity<br />
resulting from poor management, and low seed and feed quality (FAO 2006). Low productivity has a<br />
nutritional component due to the imbalance of energy and protein in fish diets commonly used by smallscale<br />
farmers. In Tanzania, farmers use naturally available feeds or feedstuffs in fish culture. Ponds are<br />
commonly fertilized with domesticated animal droppings or tender leaves as compost manure to stimulate<br />
plankton growth. The most frequently used feeds are rice and maize bran, kitchen leftovers, and garden<br />
remains. These are of low quality, and fish reared on these feeds are unable to meet their maintenance and<br />
production requirements, especially for protein. This prolongs the time to reach market weight and<br />
consequently leads to production of poor-quality fish and hence, low profitability of fish farming.<br />
In formulation of fish feeds, the nutrient requirements of fish, as well as the nutrient composition of<br />
feedstuffs, price, palatability quality, and availability of various feedstuffs should be considered (De Silva<br />
and Anderson 1998). Protein is a critical component in complete fish diets and is always given a high<br />
priority in formulation of complete feeds. Protein inadequacy may lead to poor growth and generally<br />
inferior performance. Protein is also usually the most expensive component of fish feeds, accounting for<br />
more than 50% of total feed costs in intensive aquaculture (Thompson et al. 2005). In semi-intensive<br />
systems with abundant natural foods, the protein content of supplementary feeds may be reduced and the<br />
carbohydrate content increased (Hepher 1988).<br />
Consequently, efforts have been shifted to evaluating potential alternative protein sources for use in fish<br />
diets. Alternative protein sources include soybean meals, protein concentrates (Refstie et al. 1998), meat<br />
meals (Williams et al. 2003) and blood meals (Bureau et al. 1999). Soybean meal has been the focus of<br />
attention for fish meal substitution because of its advantage in terms of protein quality, competitive price<br />
and adequate supply. However, soybean meals and agro-industrial by-products have not been readily<br />
228
229<br />
TECHNICAL REPORTS: INVESTIGATIONS 2009–2011<br />
adopted by small-scale fish farmers in sub-Saharan Africa due to cost and limited supplies. There is a<br />
need to identify less expensive alternative sources of protein from locally available feed resources and to<br />
select protein sources that do not conflict with human food security interests (El-Sayed 1999; El-Saidy<br />
and Gaber 2002). For instance, fish meal, soybean meal, meat meal and blood meal are likely to be<br />
reserved for human rather than animal diets in Tanzania.<br />
Leguminous tree leaves and their pods seem to be appropriate alternative protein sources to fish meal and<br />
soybean meal (Fernandes et al. 1999; El-Saidy and Gaber 2003; Kaushik et al. 2004). In particular<br />
Leucaena leucocephala (Pantastico and Baldia 1980; Ferraris et al. 1986; Santiago and Lovell 1988) and<br />
Moringa oleifera leaf meals (Richter et al. 2003; Afuang et al. 2003) may lower feed costs and increase<br />
the profitability of fish farming enterprises because leaf meals are cheaper than fish meal or soybean<br />
meal.<br />
Moringa oleifera (hereafter referred to as Moringa) has positive agronomic attributes such as the ability<br />
to resist adverse soil and climatic conditions and yet sustain a reasonably high yield (Palada and Chang<br />
2003). More than 11,300 hectares of Moringa trees have been planted in various parts of Tanzania,<br />
primarily for its oil seeds (Creighton, 2001). The potential of Moringa oleifera as an ingredient in fish<br />
feed formulations lies in its local availability, affordability and relatively good nutritional profile. Another<br />
advantage is its multiple uses, which potentially could serve as a source of additional income to the<br />
farmers. For instance, oil from Moringa seeds is used in perfumes and lubrication of fine machinery,<br />
while powder from the seed kernel has coagulant properties which can be used to clarify turbid water<br />
(Palada and Chang 2003).<br />
The amino acid pattern of Leucaena (hereafter referred to as Leucaena) is comparable to that of soybean<br />
and fish meal (Ter’ Meulen et al. 1979) or other animal feed sources available in developing countries<br />
(D’Mello and Thomas 1977; Ter’ Meulen et al. 1979; Kale et al. 1987). The protein concentration in<br />
Leucaena is about 23.5-31.5% (Kimbi 1997; El-Hassan et al. 2000; Kimoro 2003). Leucaena is now<br />
being grown in most parts of Tanzania due to its outstanding nutritional value to ruminants ( (1994).<br />
Overall, the information on the feeding value of Leucaena and Moringa is not conclusive; particularly,<br />
the digestibility and the effects of Leucaena and Moringa on overall performance and enzyme activity in<br />
Nile tilapia. Hence there is a need to find out the extent to which these leguminous tree leaves can replace<br />
fish meal or soybean meal as protein sources in small-scale tilapia production.<br />
The greater abundance of vegetable products has attracted research interest as ingredients for fish feed<br />
production (El-Sayed 1999). The use of raw vegetables is limited, however, by their antinutritional factors<br />
(Table 2) which are grouped into three categories: (1) those affecting protein utilization and digestion; (2)<br />
those affecting mineral utilization; and (3) anti-vitamins and toxic substances (Francis et al. 2001).<br />
Higher replacement levels (>50%) of fish meal or soybean meal by plant ingredients can also reduce<br />
palatability (Hassan et al. 1997), nutrient utilisation (Eusebio et al. 2004), growth (Eusebio and Coloso<br />
2000), or cause poor reproductive performance (Santiago and Lovell 1988).<br />
In this study we hypothesize that the replacement of soybean meal with Leucaena leaf meal and Moringa<br />
leaf meal as protein sources in fish diets may lower feed costs and hence increase the profitability of fish
TECHNICAL REPORTS: INVESTIGATIONS 2009–2011<br />
farming enterprises. The major objective of this study is to evaluate the feeding value of Leucaena and<br />
Moringa leaf meals as protein sources in Nile tilapia diets as assessed by the following sub-objectives:<br />
1) To compare feeding levels at 5, 7.5, and 10% of body weight on growth performance and feed<br />
conversion efficiency of tilapia fed diets containing sunflower seed cake, Moringa oleifera and<br />
Leucaena leucocephala as protein sources (Sokoine <strong>University</strong> of Agriculture, Tanzania).<br />
2) To compare alternate day feeding with daily feeding on growth performance and feed conversion<br />
efficiency of tilapia fed diets containing sunflower seed cake, Moringa oleifera and Leucaena<br />
leucocephala as protein sources (Sokoine <strong>University</strong> of Agriculture, Tanzania).<br />
3) To evaluate the digestibility of Moringa oleifera and Leucaena leucocephala leaf meals using mixed<br />
sex Nile tilapia Oreochromis niloticus (<strong>University</strong> of Arkansas at Pine Bluff, USA).<br />
4) To evaluate the effect of feeding Moringa oleifera and Leucaena leucocephala on growth<br />
performance, feed conversion ratio, survival, proximate and fatty acid composition of whole body,<br />
nonspecific immune responses, and proteolytic enzyme activity of mixed sex Nile tilapia (<strong>University</strong><br />
of Arkansas at Pine Bluff, USA).<br />
METHODS<br />
Objectives 1 and 2<br />
These objectives were being achieved from studies in Tanzania at Sokoine <strong>University</strong> of Agriculture<br />
(SUA). A preliminary study first developed ten different diets from three protein sources, i.e., soybean,<br />
sunflower seed cake and Moringa leaf (Table 1). The diets were then tested at different inclusion levels of<br />
the three protein sources. Preliminary results suggest Diet 3 (Table 1) performed better compared to the<br />
other diets, and consequently is being used in experiments to address objectives 2 & 3 in pond feeding<br />
trials using SUA’s standard protocols. These experiments did not begin on schedule due to funding<br />
delays, and could not be conducted concurrently due to limitations on numbers of ponds available for the<br />
trials. The expected completion date for these objectives is April, 2012.<br />
Objectives 3 & 4<br />
The study consisted of two different trials: 1) A digestibility trial; and 2) A feeding trial. The digestibility<br />
trial was carried out in a recirculating system in indoor tanks in the UAPB fish nutrition wet lab, and the<br />
growth trial was conducted in a static system in outdoor tanks at the UAPB aquaculture research station.<br />
After the trials were completed, all live fish were returned to the UAPB aquaculture research station.<br />
Source of fish<br />
Oreochromis niloticus (2500) from stocks maintained at the UAPB aquaculture station were used for the<br />
digestibility study, and smaller fish for the growth trial were obtained from a commercial farm in<br />
Alabama.<br />
Source and preparation of Leucaena and Moringa meals<br />
The test ingredients (Moringa and Leucaena) were obtained from Tanzania. Prior to shipment to the US,<br />
Sebastian Chenyambuga (Soloine <strong>University</strong>, Tanzania) soaked the leaves in water to reduce antinutrients<br />
and sun-dried them. Upon arrival at UAPB, the leaf meals were soaked again (for 3 days at room<br />
temperature) to further reduce mimosine (Hassan et al. 1994; Wee and Wang 1987), a toxin in Leucaena,<br />
and saponins in Moringa (Tacon 1985). During soaking at UAPB, the leaf meal-water mixtures were<br />
stirred for 1 h daily. After three days of soaking, the mixtures were filtered through a 0.5-mm sieve. The<br />
230
231<br />
TECHNICAL REPORTS: INVESTIGATIONS 2009–2011<br />
residue was fan-dried for 24 h and then lyophilized for 60 h using an MD3053 model freeze drier (Mill<br />
Rock Technologies., San Diego, California). The dried leaves of Moringa and Leucaena were then finely<br />
ground before incorporation into diets.<br />
Proximate composition of Moringa and Leucaena meals<br />
Protein, crude fiber, dry matter and ash content of the two leaf meals, formulated diets, feces, and whole<br />
fish from the feeding trial were analyzed according to Standard Methods (AOAC 1995). The Folch<br />
method (Folch et al. 1957) was used to analyze the total lipids. The Kjeldahl method (AOAC 1995) was<br />
used for crude protein, and the Ankom 200 fiber analyzer (Ankom Technology Corp., Fairport, New<br />
York) was used for crude fiber. Lipid extracts from the leaf meals, diets, and whole body will be used for<br />
fatty acid analysis (leaf meals and diets only). Fatty acid methyl esters (FAME) were analyzed (Morrison<br />
and Smith 1964) using a flame ionization gas chromatograph (Varian, Model CP-3800 fitted with a CP-<br />
8200 autosampler, Walnut Creek, CA) with helium as the carrier gas. The FAMEs were separated on a<br />
fused silica capillary column (15m x 0.25 mm ID; Varian CP select for Fame #CP8510). Injection volume<br />
was 1 l, with an injector and detector temperature of 250C and 315C, respectively. The column<br />
temperature was held initially at 100C for 10 min., increased to 160C at a rate of 15C/min. and held for<br />
4 min., then increased to 250C at a rate of 2.5C/min. Each sample had a total analysis time of 60 min.<br />
The FAMEs were identified and quantified by comparing the retention time and peak area to those of<br />
serially diluted mixtures of reference standards (GLC-96, GLC-473b, Nu-Check Prep, Elysian, MN). The<br />
results of the individual fatty acids were expressed as g/100g of total identified FAMEs.<br />
Diet composition<br />
Five isonitrogenous (32% crude protein) and isocaloric diets (18 KJ/g) were formulated for the<br />
digestibility trial, whereas diets for the feeding trial contained 36% protein because smaller fish were<br />
used. The protein-to-energy ratio of the diets will be 100 mg of protein per Kcal of energy (Suresh 2003).<br />
The reference diet contained soybean meal as the primary protein source (Table 3). Four other diets<br />
contained the alternative protein sources Leucaena or Moringa. These ingredients replaced soybean meal<br />
on an equal protein basis, at 15% or 30%. This resulted in a total of five diets: diet 1 was the reference<br />
diet, and 15 % and 30% of the protein in soybean meal in the reference diet was replaced with Moringa to<br />
make diets 2 and 3. Diets 4 and 5 were produced by replacing 15% and 30% of the protein in the soybean<br />
meal diet with the protein in Leucaena. Similar diet formulas (with the exception of protein amount) were<br />
used for both the digestibility and feeding trials. For the digestibility trial chromic oxide was added as an<br />
inert marker, and for the growth trial, chromic oxide was replaced by wheat middlings.<br />
Preparation of diet<br />
All ingredients were finely ground (1-2 mm) in a Wiley mill at UAPB prior to inclusion in diets. The<br />
diets were prepared in the fish nutrition lab at UAPB by slowly adding the micro-ingredients (vitamin and<br />
mineral premixes) to the macro-ingredients to ensure a homogenous mixture. Between 400 and 450 mL of<br />
distilled water was added per kilogram of diet to achieve a consistent mixture that produced stable pellets.<br />
A meat grinder fitted with 6.25- or 3.125-cm dies was used to produce different sized pellets, which were<br />
fan dried for 8 h and stored at -18 o C until use. The bigger pellets were used for the digestibility trial.<br />
Digestibility trial<br />
Mixed sex fish (N=10), weighing 200-400 g in individual weight were stocked in each 150-L tank. The<br />
gender of the fish was manually determined and a fixed gender ratio of 9 males to 1 female was used in
TECHNICAL REPORTS: INVESTIGATIONS 2009–2011<br />
all tanks. Three replicate tanks were used per diet. Fish were maintained in a recirculating system<br />
supplied with dechlorinated municipal tap water. The temperature was maintained near 28˚C, which is<br />
considered the optimal temperature for growth for Oreochromis niloticus (Popma and Masser 1999).<br />
Temperature will be recorded daily. The flow rate in each tank was set at 1.1 L/min, which resulted in the<br />
total replacement of tank water volume every 2 hours to ensure proper clearance of ammonia. Each tank<br />
had individual water and air valves and was aerated by individual air stones. The water quality parameters<br />
monitored were pH ( UB-10 pH/ mV meter, Denver Instruments, Colorado), total hardness<br />
(EDTA/ManVer method), dissolved oxygen (YSI 55, YSI Incorporated, Yellow springs, Ohio), and total<br />
ammonia nitrogen (TAN) (salicylate/cyanurate method, pH adjusted to 7, DR/890 colorimeter/high range<br />
Test’N ® Tube, Hach Company, Loveland, Colorado). Equations from Emerson et al. (1975) were used to<br />
calculate the percentage of unionized ammonia from total ammonia. Calcium chloride was added to the<br />
water to maintain hardness > 50 mg/L as calcium carbonate. The fish were fed their respective diets to<br />
apparent satiation once daily for 5-7 days prior to collection of feces to allow them to adjust to the diets.<br />
Sampling feces<br />
We attempted stripping feces from the fish, but they were apparently stressed by the procedure and<br />
refused feed for days after each stripping period. Therefore, evacuated feces were collected by siphoning<br />
each day for a week instead. Fecal collection was conducted 8-10 hours after the last meal in the evening,<br />
as well as the next morning before feeding. All feces collected from each tank were combined in the same<br />
aluminum pan and frozen between collections. Once sufficient feces were collected (>10grams per tank),<br />
the pans containing feces were dried in the oven at 50 0 C for 12 hours, and then stored at -20 0 C until<br />
analyzed.<br />
Calculation of apparent digestibility<br />
We assumed that there was no variation in the content of chromic oxide in the feces. Chromic oxide<br />
concentrations in the diets and the feces were determined by AOAC (1995) methods.<br />
The concentration factor (CF) was determined by the method of Sugiura (2000):<br />
CF= chromic oxide concentration in feces / chromic oxide concentration in diet.<br />
The CF indicates a portion of the feces that corresponds to a unit amount of the diet, therefore the nutrient<br />
content in the feces was divided by the CF.<br />
Digestibility (%) = 100X {nutrient concentration in the diet - Concentration of nutrients in<br />
feces/CF}/nutrient concentration in the diet.<br />
Growth trial<br />
Stocking density and feeding for the growth trial<br />
The growth trial was conducted using mixed-sex fish, but the fish were too small to identify gender prior<br />
to stocking so fixed ratios of males and females could not be achieved. Individual initial mean weight of<br />
fish was 5.2+0.02. One hundred fish were stocked into 20 1500-L outdoor tanks (4 tanks per diet) in a<br />
static system supplied with reservoir water. Fish were fed twice daily to satiation for 60 days. Water<br />
quality parameters were monitored as described for the digestibility trial. In addition, chlorophyll a<br />
(chloroform–methanol extraction, Lloyd and Tucker 1988) was measured in the feeding trial. When water<br />
quality in any tank fell below acceptable limits for Nile tilapia, (> 0.05 ppm un-ionized ammonia, > 8 or <<br />
6.5 pH), 50% of the water in all the pools was flushed with fresh water to restore the water quality to<br />
acceptable conditions. Each tank was filled separately with a tap and had an individual stand pipe for<br />
232
233<br />
TECHNICAL REPORTS: INVESTIGATIONS 2009–2011<br />
drainage and air stone for aeration. Subsamples of fish were weighed every two weeks throughout the<br />
trial to assess growth and adjust feed rations. Feed intake and mortalities were recorded daily. The<br />
average protein deposition was calculated by determining the difference in the protein content of fish<br />
before and after the growth trial. The average protein intake was calculated as the dry protein in feed (g)<br />
in the feed consumed. At harvest, the overall growth, feed conversion, survival, non-specific immune<br />
function, digestive enzyme activity, and body composition were evaluated.<br />
Determination of growth rate and individual weight gain<br />
Growth rate = 100X (final weight-initial weight) / days in cycle.<br />
The mean individual weight gain = mean final individual weight-mean initial individual weight.<br />
Determination of feed conversion ratio (FCR)<br />
FCR= Feed consumed (g of dry matter) / live weight gain (g).<br />
Determination of apparent net protein utilization (ANPU)<br />
ANPU= Average protein deposition/ average protein intake.<br />
Lysozyme activity<br />
Blood samples (1mL) were obtained from 3 randomly selected fish per tank at the end of the growth trial.<br />
Blood was drawn from the caudal vasculature using heparinized syringes. The blood plasma was assayed<br />
for lysozyme activity (Hutchinson and Manning 1996). Bled carcasses were frozen for later proximate<br />
analyses.<br />
Digestive proteolytic enzyme activity<br />
Three additional fish per tank were used for the proteolytic enzyme activity assays on whole intestines at<br />
the end of the growth trial. The fish were anaesthetized by adding tricaine methanesulfonate at a rate of<br />
30 mg/L and then killed by cervical separation, about 24h after the last meal. The guts were removed by<br />
dissection, placed on ice, and uncoiled. The stomachs were excised. The whole intestine was then frozen<br />
in liquid nitrogen. The entire procedure for each fish was completed in about 3 min and the samples were<br />
stored at −80°C until analyzed. Frozen intestine were homogenized by sonification for 1 min, and<br />
centrifuged at 9,400×g for 2 min at 4°C. Following centrifugation, the homogenate was collected and<br />
stored in small aliquots (100–200 μl) at −80°C until just before use in colorimetric assays of proteolytic<br />
enzyme activities. All pH values listed for buffers were measured at room temperature (22°C), and all<br />
reactions were run at saturating substrate concentrations as determined for the proteolytic enzyme at 4°C.<br />
Blanks consisting of substrate only and homogenate only (in buffer) were conducted simultaneously to<br />
account for endogenous substrate and/or product in the tissue homogenates and substrate solutions<br />
(German et al. 2009).<br />
Total proteolytic activity<br />
Total protease activity was quantified by detection of primary amines resulting from proteolysis.<br />
Succinylated casein was used as a substrate for protein hydrolysis by all proteases within the intestine and<br />
compared to trypsin standards. Hydrolysis of the casein substrate results in the release of peptide<br />
fragments with free amino-terminal groups. These peptides react with trinitrobenzene sulfonic acid, which<br />
forms a colorimetric reaction and formation of yellow trinitrobenzene-peptide products. The color
TECHNICAL REPORTS: INVESTIGATIONS 2009–2011<br />
intensity was measured at 540 nm and was directly proportional to the enzyme activity of proteases in the<br />
sample (Bubnis and Ofner 1992; Hatakeyama et al. 1992).<br />
Proximate and fatty acid analyses of the whole body<br />
The body composition of 5 individual fish was analyzed initially before starting the growth trial in<br />
outdoor tanks, and after the trial 3 fish per tank (12 per diet) were reserved from the health assays for<br />
proximate and fatty acid analysis. The reserved fish were finely ground to get one homogenous sample<br />
per tank and subjected to the same procedures described in the digestibility trial, except that fiber analysis<br />
was not performed on fish.<br />
Statistical analysis of the digestibility trial data<br />
The mean data per replicate for digestibility, body composition, weight gain (growth rate), survival, PDC,<br />
FCR, ANPU, lysozyme activity, and proteolytic enzyme activity will be analyzed by one way Analysis of<br />
Variance (ANOVA) with StatView (SAS Institute Inc., Cary, North Carolina) to test for differences<br />
among experimental groups. When the differences among treatment means are significant (P < 0.05 for<br />
the indoor digestibility trial; P
235<br />
TECHNICAL REPORTS: INVESTIGATIONS 2009–2011<br />
increasing fish size, but further analysis is required to interpret this result. Proximate and fatty analysis of<br />
whole fish from the feeding trial is still in progress.<br />
DISCUSSION<br />
Objectives 3 & 4<br />
The most likely explanation for reduced nutrient digestibility of the leaf meals compared with soybean<br />
meal is the higher fiber content of the leaf meals. Fiber is indigestible to monogastric animals such as fish<br />
and can reduce the overall energy and essential nutrients available from the diet (NRC 2011). Despite<br />
differences in nutrient availability among diets, fish growth, feed conversion, survival, lysozyme activity,<br />
and proteolytic enzyme activity were similar among treatments in the feeding trial. It is likely that the<br />
tilapia compensated for any nutrient deficiencies by consuming algae and other natural foods in the<br />
outdoor tanks. It is worthy of note that the tilapia were able to make up for diet differences even at a<br />
young age, and young fish are usually more sensitive to diet differences than larger fish. The results look<br />
promising for increasing use of Moringa and Leucaena in tilapia diets to reduce diet cost and improve<br />
profitability, but the diets need to be tested in a longer study where fish are grown to market size. In<br />
addition, economic analysis is needed to help identify the most cost-effective diets for tilapia production.<br />
REFERENCES<br />
Afuang, W., P. Siddhuranju, and K. Becker. 2003. Comparative nutritional evaluation of raw, methanol<br />
extract residues and methanol extract of Moringa (Moringa oleifera Lam.) leaves on growth<br />
performance and feed utilization in Nile Tilapia (Oreochromis niloticus L.). Aquaculture<br />
Research 34:1147-1159.<br />
AOAC (Association of Official Analytical Chemists). 1995. Official methods of analysis. Arlington,<br />
Virginia.<br />
Bubnis, W. A., and C. M. Ofner, III. 1992. The determination of e-amino groups in soluble and poorly<br />
soluble proteinaceous materials by a spectrophotometric method using trinitrobenzenesulfonic<br />
acid. Analytical Biochemistry 207:129-133.<br />
Bureau, D. P., A. M. Harris, and C. Y. Cho. 1998. The effects of purified alcohol extracts from soy<br />
products on feed intake and growth of Chinook salmon (Oncorhynchus tshawytscha) and rainbow<br />
trout (Oncorhynchus mykiss). Aquaculture 161:27-43.<br />
Creighton, W. 2001. Moringa oleifera seed production in Tanzania. In: Anonymous Proceedings of the<br />
workshop on development potential for Moringa products held in Dar es Salaam, Tanzania from<br />
29 October- 2nd November 2001, pp. [Online] available at<br />
http://www.moringanews.org/actes/optima_en.doc Accessed: 1/19/2011.<br />
D'Mello, F. J. P, and D. Thomas. 1977. Animal feed. Pages 30-32 in F. R. Rushkin, editor. Leucaena:<br />
promising forage and tree crops for the tropics. National Academy of Sciences, Washington. DC.<br />
D’Mello, F. J. P. 1991. Toxic amino acids. Pages 22-48 in F. J. P. D’Mello., C. M. Duffus and J. H.<br />
Duffus, editors. Toxic substances in crop plants. The Royal Society of Chemistry, Thomas<br />
Graham House, Science Park, Cambridge CB4 4WF, Cambridge.<br />
De Silva, S. S., and T. A. Anderson. 1998. Fish nutrition in aquaculture. Chapman and Hall, London.<br />
El-Hassan, S. M., A. Lahlou, C. J. Kessi., R. J. Newbold, and C. J. Wallace. 2000. Chemical composition<br />
and degradation characteristics of forage of some African multipurpose trees. Animal Feed<br />
Science and Technology 86:27-37.<br />
El-Saidy, D. M. S. D. and M. M. A. Gaber. 2002. Complete replacement of fish meal by soybean meal<br />
with dietary L-lysine supplementation for Nile tilapia Oreochromis niloticus (L.) fingerlings.<br />
Journal of the World Aquaculture Society 33:297-306.
TECHNICAL REPORTS: INVESTIGATIONS 2009–2011<br />
El-Saidy, D. M. S. D. and M. M. A. Gaber. 2003. Replacement of fish meal with a mixture of different<br />
plant protein sources in juvenile Nile tilapia, Oreochromis niloticus (L.) diets. Aquaculture<br />
Research 34:1119-1127.<br />
Emerson, J. J., R. C. Russo, R. E. Lund, and R. V. Thurston. 1975. Aqueous ammonia equilibrium<br />
calculations: effect of pH and temperature. Journal of the Fisheries Research Board of Canada<br />
32:2379-2383.<br />
Eusebio, P. S., and R. M. Coloso. 2000. Nutritional evaluation of various plant protein sources in diets for<br />
Asian sea bass Lates calcarifer. Journal of Applied Ichthyology 16:56-60.<br />
Eusebio, P. S., R.M. Coloso, and R. E. P. Mamauag. 2004. Apparent digestibility of selected ingredients<br />
in diets for juvenile grouper, Epinephelus coioides (Hamilton). Aquaculture Research 35:1261-<br />
1269.<br />
Fernandes, A. E., M. A. Gomes, R. Henriques, and J. Combra. 1999. Replacement of fish meal by plant<br />
proteins in the diet of Nile tilapia: digestibility and growth performance. Aquaculture<br />
International 7:57-67.<br />
Ferraris, R. P., M. R. Catacutan, R. L. Mabelin, and A. P. Jazul. 1986. Digestibility in milkfish, Chanos<br />
chanos (Forsskal): effects of protein source, fish size and salinity. Aquaculture 59:93-105.<br />
Folch, J., M. Lees, and G. H. Sloane-Stanley. 1957. A simple method for the isolation and purification of<br />
total lipids from animal tissues. Journal of Biological Chemistry 226:497-509.<br />
Food and Agriculture Organization of the United Nations (FAO). 2006. National Aquaculture Sector<br />
Overview. United Republic of Tanzania Fact Sheets. Rome, Italy.<br />
Food and Agriculture Organization of the United Nations (FAO). 2007. Fishstat Plus: Universal software<br />
for fishery statistical time series. Version 2.3. 2000. Rome, Italy: FAO Fisheries Department,<br />
Fishery Information, Data and Statistics Unit.<br />
Francis G., H. P. S. Makkar, and K. Becker. 2001. Antinutritional factors present in plant-derived<br />
alternate fish feed ingredients and their effects in fish. Aquaculture 199: 197-227.<br />
German, D. P, B. C. Nagle, J. M. Villeda, A. M. Ruiz., A. W. Thomson, S. Contreras-Balderas, and H.<br />
Evans. 2009. Evolution of herbivory in a carnivorous clade of minnows (Teleostei: Cyprinidae):<br />
effects on gut size and digestive physiology. Physiological and Biochemical Zoology 83:1-18.<br />
Hassan, M. R., D. J. Macintosh, and K. Jauncey. 1997. Evaluation of some plant ingredients as dietary<br />
protein sources for common carp (Cyprinus carpio L.) fry. Aquaculture 151:55-70.<br />
Hassan, M. R., P. K. Roy, and A. M. Akand. 1994. Evaluation of Leucaena leaf meal as a dietary protein<br />
source for Indian major carp (Labeo rohita) fingerlings. Aquaculture 124:65-66.<br />
Hatakeyama, T., H. Kohzaki, and N. Yamasaki. 1992. A micro-assay for proteases using succinylcasein<br />
as a substrate. Analytical Biochemistry 204: 181-184.<br />
Hepher, B. 1988. Nutrition of pond fishes. Cambridge <strong>University</strong> Press, United Kingdom.<br />
Hutchinson, T. H., and M. J. Manning. 1996. Seasonal trends in serum lysozyme activity and total protein<br />
concentration in dab (Limanda limanda L.) sampled from Lyme Bay, U.K. Fish and Shellfish<br />
Immunology 6:473–482.<br />
Kale, A. U. 1987. Nutritive value of Leucaena leucocephala (subabul). Doctoral dissertation, <strong>University</strong><br />
of Bombay, Bombay, India.<br />
Kaushik, S. J., D. Coves, G. Dutto, and D. Blanc. 2004. Almost total replacement of fish meal by plant<br />
protein sources in the diet of a marine teleost, the European sea bass, Dicentrarchus labrax.<br />
Aquaculture 230:391–404.<br />
Kimbi, E. F. C. 1997. The effects of substituting Leucaena leucocephala forage for cotton seed cake as<br />
protein supplement for urea treated maize Stover on performance of goat weaner. Master’s of<br />
Agriculture Thesis, Sokoine <strong>University</strong> of Agriculture Morogoro, Tanzania, Africa.<br />
Kimoro, B. N. 2003. Potential of selected tropical multipurpose trees as protein supplements for growing<br />
goats fed maize Stover basal diet. Master’s of Agriculture Thesis, Sokoine <strong>University</strong> of<br />
Agriculture, Morogoro, Tanzania, Africa.<br />
Lloyd, S. W., and C. S. Tucker. 1988. Comparison of three solvent systems for extraction of chlorophyll a<br />
from fish pond phytoplankton communities. Journal of the World Aquaculture Society 19:36–40.<br />
236
237<br />
TECHNICAL REPORTS: INVESTIGATIONS 2009–2011<br />
Molnar, J. J., A. Rubagumya, and V. Adjavon. 1991. Sustainability of aquaculture as a farm enterprise in<br />
Rwanda. Journal of Applied Aquaculture 1:37–62.<br />
Moon, H. Y., and D. M Gatlin III. 1991. Total sulfur amino acid requirement of juvenile red drum,<br />
Sciaenops ocellatus. Aquaculture 95:97-106.<br />
Morrison, W. R., and L. M. Smith. 1964. Preparation of fatty acid methyl esters and dimethyl esters and<br />
dimethylacetals from lipids with boron fluoride-methanol. Journal of Lipid Research 5:600-608.<br />
Norton, B. W. 1994. Browse legumes as supplements. Pages 245–257 in R. C. Gutteridge and H. M.<br />
Shelton, editors. Forage tree legumes in tropical Agriculture. CAB International, Wallingford,<br />
UK.<br />
NRC (National Research Council). 2011. Nutrient requirements of fish and shrimp. National Academy<br />
Press, Washington, D.C.<br />
Palada, M. C., and L. C. Chang. 2003. Suggested cultural practices for Moringa. Asian Vegetable<br />
Research and Development Center, Publication no. 03-545, Shanhua Taiwan.<br />
Pantastico, J. B., and J. P. Baldia. 1980. Ipil-ipil leaf meal as supplemental feed for T. nilotica in cages.<br />
Fisheries Research Journal of the Philippines 5:63-68.<br />
Popma T., and M. Masser. 1999. Tilapia life history and biology. Southern Regional Aquaculture Center<br />
(SRAC), Publication no. 283, Mississippi <strong>State</strong> <strong>University</strong>, Stoneville.<br />
Refstie, S., T. Storebakken, and A. J. Roem. 1998. Feed consumption and conversion in Atlantic salmon<br />
(Salmo salar) fed diets with fish meal, extracted soybean meal or soybean meal with reduced<br />
content of oligosaccharides, trypsin inhibitors, lectins and soya antigens. Aquaculture 162:301–<br />
312.<br />
Richter, N., B. Siddhuraju, and K. Becker. 2003. Evaluation of nutritional quality of Moringa (Moringa<br />
oleifera Lam.) leaves as an alternative protein source for Nile tilapia (Oreochromis niloticus L.).<br />
Aquaculture 217:599-611.<br />
Santiago, C. B., and R. T. Lovell. 1988. Amino acid requirements for growth of Nile tilapia. Journal of<br />
Nutrition 118:1540-1546.<br />
Sugiura, S. H., 2000. Digestibility. Pages 209-218 in R.R. Stickney, editor. Encyclopedia of aquaculture.<br />
John Wiley and Sons, Inc., New York.<br />
Spannhof, L., and H. Plantikow. 1983. Studies on carbohydrate digestion in rainbow trout. Aquaculture<br />
30:95-108.<br />
Spinelli, J., C. R. Houle, and J. C. Wekell. 1983. The effect of phytates on the growth of rainbow trout<br />
(Salmo gairdneri) fed purified diets containing varying quantities of calcium and magnesium.<br />
Aquaculture 30:71-83.<br />
Suresh, V. 2003. Tilapias. Pages 321-345 in J. S. Lucas and P. C. Southgate, editors. Aquaculture:<br />
farming of aquatic animals and plants, Blackwell Publishing, Oxford. United Kingdom.<br />
Tacon, A. G. J. 1985. Nutritional fish pathology. Food and Agriculture Organization of the United<br />
Nations. Rome, Italy.<br />
Tacon, A. G. J., and A. J. Jackson. 1985. Utilization of conventional and unconventional protein sources<br />
in practical fish feeds. Pages 119-145 in C. B. Cowey, A. M. Mackie and J. G. Bell, editors.<br />
Nutrition and feeding in fish. Academic Press, London.<br />
Ter’ Meulen, U., S. Struck, E. Schulke, and E. A. El-Harith. 1979. A review on the nutritive value and<br />
toxic aspects of Leucaena leucocephala. Tropical Animal Production 4:113-26.<br />
Thompson, K. R., L. A. Muzinic, L. S. Engler, and C. D. Webster. 2005. Evaluation of practical diets<br />
containing different protein levels, with or without fish meal, for juvenile Australian red claw<br />
crayfish (Cherax quadricarinatus). Aquaculture 244: 241-249.<br />
Wee, K. L., and S. S. Wang. 1987. Nutritive value of Leucaena leaf meal in pelleted feed for Nile tilapia.<br />
Aquaculture 62:97-108.<br />
Wijkstrom, U. N., and N. J. MacPherson. 1990. A cost benefit analysis of culture based fisheries<br />
development in small dams and dugouts. Food and Agriculture Organization of the United<br />
Nations Field work paper 1: The Economics of Culture Based Fisheries, Rome, Italy.
TECHNICAL REPORTS: INVESTIGATIONS 2009–2011<br />
Williams, K. C., C. G. Barlow, L. J. Rodgers, and I. Ruscoe. 2003. Potential of meat meal to replace fish<br />
meal in extruded dry diets for barramundi, Lates calcarifer (Bloch). I. Growth performance.<br />
Aquaculture Research 34: 23–32.<br />
238
TABLE 1: - The % composition of 10 diets using different ingredients<br />
Diets<br />
239<br />
TECHNICAL REPORTS: INVESTIGATIONS 2009–2011<br />
Ingredients D1 D2 D3 D4 D5 D6 D7 D8 D9<br />
SFC 84 66 41 21 0 0 0 0 0<br />
SBM 0 0 0 0 0 25 24 20 13<br />
MLM 0 22 41 63 80 0 7 20 39<br />
HM 10 6 12 10 14 69 63 54 42<br />
SFO 3 3 3 3 3 3 3 3 3<br />
MIN. 1 1 1 1 1 1 1 1 1<br />
WM 2 2 2 2 2 2 2 2 2<br />
Total 100 100 100 100 100 100 100 100 100<br />
SFC = Sunflower seed cake, SBM= Soybean meal, MLM= Moringa leaf meal, HM= Hominy meal, SFO=<br />
Sunflower oil, MIN= Mineral, WM= Wheat meal<br />
TABLE 2. —The major categories of antinutritional factors (Tacon 1985).<br />
Group Antinutritional factor<br />
Proteins Protease inhibitors, hemagglutinins.<br />
Glycosides Goitrogens, cyanogens, saponins, estrogens.<br />
Phenols Gossypol, tannins.<br />
Miscellaneous<br />
Anti-minerals (e.g. phytic acid), anti-vitamins, anti-enzymes, food allergens,<br />
microbial/plant carcinogens, toxic amino acids<br />
TABLE 3. —Composition of the reference diet for a digestibility trial with Nile tilapia. The control diet<br />
for the feeding trial was similar but contained 36% protein and wheat midds in place of chromic oxide.<br />
Ingredients Percentage inclusion<br />
Soybean meal 50.00<br />
Cottonseed meal 7.50<br />
Corn 16.50<br />
Wheat middlings 22.00<br />
Fish oil/soy oil (1:1) 2.00<br />
Vitamin mixture a 1.00<br />
Mineral mixture a 1.00<br />
Chromium oxide b 0.005<br />
a Same as Moon and Gatlin (1991).<br />
b Chromic oxide will be purchased from Sigma-Aldrich Corp., St. Louis, Missouri.
TECHNICAL REPORTS: INVESTIGATIONS 2009–2011<br />
Impact Assessment of <strong>CRSP</strong> Activities in the Philippines and Indonesia<br />
Sustainable Feed Technology/Activity/09SFT06NC<br />
Remedios B. Bolivar<br />
Central Luzon <strong>State</strong> <strong>University</strong><br />
Science City of Muñoz, Philippines<br />
Evelyn Grace T. de Jesus-Ayson and Maria Rovilla J. Luhan<br />
Southeast Asian Fisheries Development Centre – Aquaculture Division<br />
Iloilo, Philippines<br />
Hasan Hasanuddin and Coco Kokarkin<br />
Ujung Batee Aquaculture Center<br />
Banda Aceh, Indonesia<br />
Upton Hatch<br />
North Carolina <strong>State</strong> <strong>University</strong><br />
Raleigh, North Carolina, USA<br />
Kevin Fitzsimmons<br />
<strong>University</strong> of Arizona<br />
Tucson, Arizona, USA<br />
Russell J. Borski<br />
North Carolina <strong>State</strong> <strong>University</strong><br />
Raleigh, North Carolina, USA<br />
ABSTRACT<br />
A series of activities to promote training and to assess the impact of technologies and management<br />
practices aimed at improving incomes for small-scale aquaculture farmers in the Philippines and<br />
Indonesia was undertaken. In the first phase a workshop consisting with 66 stakeholders was held to<br />
provide additional training on reduced feeding practices and least-cost feed formulations and<br />
manufacturing technologies that limit the cost of producing tilapia. A survey was also conducted to<br />
assess the current production practices of tilapia aquaculture with particular emphasis on evaluating the<br />
adoption rate of reduced feeding strategies developed under the <strong>CRSP</strong> project. Fifty-eight individuals<br />
were interviewed and approximately half used reduced feeding strategies, mostly the delayed onset of<br />
feeding practice, where feed costs are reduced with little impact on total yield. Based on the survey data,<br />
total feed costs were reduced and net return was improved by 46% when the feed reduction strategy was<br />
utilized. Based on these results it would appear that tilapia farmers are adopting feed reduction strategies<br />
at a high rate and that this results in improved incomes. Considering the size of the tilapia industry,<br />
which is the fourth largest in the world, it would appear <strong>CRSP</strong> research and outreach has positively<br />
impacted the livelihoods of an untold number of families.<br />
In a second phase of this investigation we expanded our training on milkfish integrative production<br />
systems and feed management practices and on value-added processing of seaweed and milkfish to<br />
various islands in the Philippines, including Mindanao, Palawan and Iloilo. Informal interviews and<br />
consultation with farmers, operators, investors, and government personnel revealed 3 major constraints to<br />
240
241<br />
TECHNICAL REPORTS: INVESTIGATIONS 2009–2011<br />
production – reliable source and consistent supply of good quality fingerlings, prohibitive cost of feeds,<br />
and marketing. An additional concern in some locations was the periodic low water quality associated<br />
with milkfish cage clusters that result in emergency harvests. To address these concerns <strong>CRSP</strong> personnel<br />
conducted four workshops that provided information and training on how production and economic<br />
efficiencies can be improved through some technical interventions. This included ways to improve<br />
feeding strategies and management such as the utilization of alternate day feeding strategies shown<br />
through recent <strong>CRSP</strong> research to reduce feed inputs by as much as 30%. Growers are now currently<br />
testing this on farm in production marine cages. Another way is to apply the concept of polyculture or<br />
integrated multi-trophic aquaculture in the grow-out of milkfish to increase profit and reduce negative<br />
impact to the environment. SEAFDEC – <strong>CRSP</strong> project personnel provided information on integrative<br />
culture systems that incorporate sandfish (sea cucumber), seaweed and rabbitfish into milkfish systems.<br />
To enhance women’s opportunity to improve household welfare through sale of products in local market,<br />
a final workshop provided training on seafood safety; marketing techniques; milkfish processing,<br />
deboning and marinating; and on seaweed preparation and cookery. Twenty-five women participated in<br />
the workshops with the intent on supplementing their household incomes through local market sale of<br />
value-added products and for enhancing household nutrition.<br />
The <strong>AquaFish</strong> <strong>CRSP</strong> aquaculture program in Aceh, Indonesia has focused on promoting the adoption of<br />
best aquaculture practices for seaweed-shrimp/finfish polyculture systems. These systems involve a more<br />
sustainable use of small-scale tambak culture systems that incorporate seaweed (gracellaria), shrimp and<br />
fish. The third phase of these studies was to assess the impact training activities had on adoption of<br />
seaweed-shrimp/finfish polyculture in Aceh, based on interviews, farm visits and data collection. We<br />
found that 100 farmers with around 400 ha of farm area have adopted polyculture practices for shrimp<br />
and/or finfish growout in various Aceh communities. This is a relatively new culture practice that has<br />
recently been adopted. A marketing agreement has been achieved for purchase of seaweeds, which should<br />
provide additional income for fish/shrimp farmers that adopt more sustainable polyculture techniques.<br />
Our fourth objective was to develop additional extension podcast modules to promote impacts of<br />
<strong>AquaFish</strong> <strong>CRSP</strong> research and outreach activities. The podcast approach is far thriftier, more easily<br />
updated, and more efficient than the distribution of printed media. With the continued growth of smart<br />
phones, MP3 players, computers and other devices in throughout the world we anticipate the Podcast will<br />
be a highly attractive extension tool for dissemination of information on aquaculture. To this end three<br />
podcasts were produced and uploaded onto iTunesU to demonstrate how alternate-day feeding can reduce<br />
costs of milkfish culture in marine cages and brackishwater ponds. Two of these podcasts reflect<br />
translations to Tagalog, the primary Filipino language, and Ilonggo, the primary dialect with in the Iloilo<br />
region of the Philippines, where milkfish culture is an important form of livelihood. Four other podcasts<br />
highlighting the activity of <strong>CRSP</strong> programs in other countries are currently under development.<br />
INTRODUCTION<br />
A series of activities were completed to promote additional training and to assess the impact of<br />
technologies and management practices aimed at improving incomes for small-scale aquaculture farmers<br />
in the Philippines and Indonesia. They included work to promote accomplishments from the previous<br />
Aquaculture <strong>CRSP</strong> as well as our current <strong>AquaFish</strong> <strong>CRSP</strong> projects.<br />
<strong>AquaFish</strong> <strong>CRSP</strong> work in the Philippines and Indonesia was designed to develop and implement strategies<br />
that will improve the cost effectiveness, sustainability and income opportunities of farming fish in the<br />
Philippines and Indonesia and the subsequent livelihood of their people. Tilapia and milkfish are the two<br />
most prominent finfishes cultured in the Philippines and their culture is expanding rapidly both in inland<br />
and coastal regions. Feed is the most costly component of fish farming, representing as much as 80% of<br />
total production costs for tilapia and 60-70% for milkfish. Therefore, procedures that reduce the amount<br />
of feed or its cost without negatively impacting harvest quality or yield can improve farmers’ incomes.
TECHNICAL REPORTS: INVESTIGATIONS 2009–2011<br />
Through delayed onset, alternate day, or sub-satiation feeding, or a combination of the three, research has<br />
shown that the amount of feed required to culture tilapia in ponds can be reduced by as much as 50% with<br />
little or no impact on the total yield of harvested fish. These practical strategies to improve production<br />
efficiency of tilapia can increase the incomes of farmers. Anecdotal information has suggested some<br />
farmers are adopting these new feeding strategies in the Philippines, including those who conducted the<br />
original research trials on their farms, but the extent to which this has occurred was uncertain, prior to this<br />
assessment. This may arise from the lack of farmers’ knowledge of alternate feeding strategies.<br />
Alternatively, farmers may be utilizing new methods, but this had not been quantified. Therefore, one of<br />
the aims of this investigation was to conduct additional training on alternative feeding practices to farmers<br />
and to survey households to assess the extent to which new feeding practices are being adopted by the<br />
tilapia farming communities. These are critical elements to promoting new technologies developed by<br />
<strong>CRSP</strong> as well as assessing the impacts of the technologies.<br />
Milkfish culture is the largest finfish aquaculture industry in the Philippines. As part of the Philippine<br />
government’s food security and poverty alleviation programs, expansion of milkfish culture is a high<br />
priority, both to wean fishers off capture fisheries and to increase income of farmers and fishers alike,<br />
whose poverty levels are disproportionately high. Much of the growth in milkfish production is in cage<br />
culture in marine or brackishwater coastal areas. Cage culture of milkfish is done at higher densities and<br />
with significantly greater inputs of artificial feeds. This practice, however, has led to wastage of artificial<br />
feeds and to excessive nutrient loading in receiving waters, exacerbating pollution problems and<br />
contributing to periodic fish kills in areas of intensive milkfish culture. It also appears many farmers use<br />
substantially more feeds than recommended. Our research results suggest that a reduction of 2-3% below<br />
the recommended daily feed ration during the early fingerling stage can produce fish without substantially<br />
reduced yields. Moreover, feeding on alternate days rather than the typical daily practice can produce a<br />
substantial cost savings in feeds by as much as 50% with limited impact on yield. We have also recently<br />
evaluated an integrative milkfish culture system that utilizes co-culture of seaweeds, sea cucumber, and/or<br />
rabbitfish with milkfish. The integrative, polyculture system has potential to reduce nutrient overload<br />
seen around milkfish culture clusters while simultaneously providing additional income opportunities to<br />
farmers through seaweed, sea cucumber and rabbitfish markets. In this investigation we expanded<br />
training on alternative feeding practices and on integrative culture systems for milkfish from one location<br />
in Guimaras to additional islands where milkfish culture is gaining popularity or is even more prominent,<br />
namely in the Mindanao as well as other areas within Visayas regions of the Philippines. Expansion of<br />
workshops to these regions has provided wider outreach and training to farmers and communities while<br />
enhancing capacity building through the participation of additional local and regional government<br />
agencies and other stakeholders in the Philippines.<br />
In Indonesia and the Philippines, interest has heightened in diversifying aquaculture crops, following the<br />
realization that intensive shrimp farming practices contributed to the deterioration of water quality in the<br />
mangrove coastal habitat. In our recently completed <strong>AquaFish</strong> <strong>CRSP</strong> project, we have conducted a series<br />
of workshops on incorporating seaweed in the polyculture of shrimp and fish as a more sustainable and<br />
environmentally benign, and profitable form of aquaculture. Although some farmers have adopted these<br />
polyculture practices, the number of farmers, hectareage, and communities impacted had not been<br />
assessed. Therefore, we conducted farmer surveys in Aceh, Indonesia. The project collaborated with the<br />
Host Country Institute, Ujung Batee Aquaculture Center, the primary research and extension center in the<br />
Aceh province of Indonesia, to collate data and provide a full assessment of the impact of <strong>CRSP</strong>-funded<br />
training programs on alternative and sustainable management practices for shrimp and finfish farming<br />
communities of Aceh.<br />
Podcasting is a wide-open, attractive format for digitizing procedures, technologies, pictures,<br />
data, and video clips set to music that can accommodate practically any digitized material that is desired.<br />
Unlike traditional brochures or fact sheets, it can be updated quickly and easily, and the updates are<br />
242
243<br />
TECHNICAL REPORTS: INVESTIGATIONS 2009–2011<br />
distributed automatically; unlike journals, texts, and fact sheets, they do not become obsolete. New<br />
advances can be incorporated into updates of old presentations for automatic distribution to holders of<br />
free subscriptions. Podcasts are an excellent means to convey information to the public, to include<br />
farmers, agribusinesses, extension personnel, congress, USAID and other stakeholders. We have<br />
produced of a series of short podcasts to introduce aquaculture technology and other information focused<br />
on best management practices and feed reduction strategies for improving the efficiency of Nile tilapia<br />
culture, developed primarily in the Philippines. An integral part of these podcasts has been the<br />
presentation of specific impacts that target indicators for the new Developmental Themes Advisory Panel<br />
reporting requirements of USAID. As a final component of this investigation, we expanded development<br />
of podcasts modules beyond those related solely to extending information on cost-effective tilapia culture<br />
technologies and best management practices, to conveying information on feeding practices that reduce<br />
milkfish production costs and sustainability. We are also in the process of completing several other<br />
podcasts that highlight some successes of research at other <strong>AquaFish</strong> <strong>CRSP</strong> sites in Southeast Asia, Latin<br />
America and Africa.<br />
Collectively, this investigation has addressed two primary goals: 1) the promotion of technologies to<br />
improve incomes and livelihood of farmers and fishers, and 2) the assessment of the impact of research<br />
conducted under the <strong>AquaFish</strong> <strong>CRSP</strong> and previous <strong>CRSP</strong> programs.<br />
OBJECTIVES<br />
1. Provide training for and assess the impact of technologies and management practices that can improve<br />
incomes for small-scale aquaculture farmers in the Philippines and Indonesia.<br />
2. Conduct extension activities and assess the impact of feed reduction strategies on tilapia culture in<br />
Central Luzon, Philippines<br />
3. Enhance capacity building, provide training and assess impacts of alternative feeding practices,<br />
integrative culture systems, and value-added processing for milkfish production across a broader range<br />
of the Philippines.<br />
4. Assess impacts of seaweed polyculture on fish and shrimp farming in Aceh, Indonesia<br />
5. Produce podcast modules to promote outreach and impacts of <strong>AquaFish</strong> <strong>CRSP</strong> research in the<br />
Philippines, Indonesia and other host country sites in Southeast Asia, Latin American and Africa.<br />
1. Conduct Extension Activities and Assess the Impact of Feed Reduction Strategies on<br />
Tilapia Culture in Central Luzon, Philippines<br />
Additional training on alternative feeding practices and least-cost feed formulations and manufacturing<br />
technologies that reduce the costs of producing tilapia was provided to farmers, feed manufacturers and<br />
extension personnel. A survey of tilapia farming households was also done to assess the extent to which<br />
new feeding practices are being adopted by the tilapia farming communities. These are critical elements<br />
to promoting new technologies developed by <strong>CRSP</strong> as well as assessing the impacts of the technologies.<br />
Extension Activities: A workshop on “Tilapia Feeding Strategies and Feed Manufacturing: Meeting<br />
Global Challenges” was conducted at the Philippine Carabao Center, adjacent to the Central Luzon <strong>State</strong><br />
<strong>University</strong> campus in Nueva Ecija, Philippines in August 2011. This area lies within the primary tilapia<br />
aquaculture area of Central Luzon, and CLSU is central to disseminating new technologies to the tilapia<br />
industry. 66 people attended the workshop. This included farmers, representatives of the 5 primary<br />
tilapia feed manufacturing companies, and government (Bureau of Fisheries and Aquatic Resources) and<br />
university research and extension personnel who are key in informing the industry on new culture<br />
practices. A series of presentations and discussions on the cost benefits of delayed onset, alternate day,
TECHNICAL REPORTS: INVESTIGATIONS 2009–2011<br />
or sub-satiation feeding was provided. This included presentations by farmers who participated in the onfarm<br />
trials that originally demonstrated the improved cost-effectiveness of utilizing delayed and/or<br />
reduced feeding strategies over the standard, daily feeding protocol in pond growout of tilapia. Other<br />
presentations provided information on hatchery best management practices and the value of utilizing<br />
lower cost fishmeal free and low protein diets in growout of tilapia. Various Podcast modules showing<br />
the cost-benefit analyses of using delayed or reduced feeding protocols were also shown. This workshop<br />
complemented an additional one previously conducted in the Pampangas region of Central Luzon (see<br />
investigation 09SFT04NC) where information on cost-effective feeding strategies and diets was also<br />
disseminated to farmers and others in the tilapia supply chain.<br />
IMPACT ASSESSMENT<br />
METHODS<br />
A survey was conducted in 2011 to assess the current production practices of tilapia aquaculture with<br />
particular emphasis on the feeding strategies involved in the <strong>AquaFish</strong> <strong>CRSP</strong> project. The project<br />
focused on research at the Freshwater Aquaculture Center (FAC) at Central Luzon <strong>State</strong> <strong>University</strong><br />
(CLSU) led by Dr. Remedios Bolivar of CLSU in collaboration with Dr. Russell Borski of North Carolina<br />
<strong>State</strong> <strong>University</strong> (NCSU). The project’s central research goal hypothesis was investigation of the<br />
feasibility of reduced feeding as an improved management strategy that reduces costs of tilapia culture<br />
and can improve incomes of farmers. The results of the research were disseminated to private and public<br />
aquaculture sectors through CLSU training sessions, presentations and individual interactions.<br />
The survey was led by Drs. Remedios Bolivar of CLSU and Upton Hatch of NCSU and conducted by<br />
CLSU and NCSU interviewers using a structured interview methodology with tilapia managers and<br />
owners in the major tilapia growing region centered in the Pampangas area. Data from 58 completed<br />
responses were compiled into a database and a summary of these results is presented in Table 1. The<br />
selection of survey participants was largely based on past interaction with CLSU extension personnel,<br />
activities and training workshops. The database and discussion of these results are organized into sections<br />
on respondent socio-demographics, farm characteristics, and management practices. The number of<br />
survey observations was adequate to provide an assessment of current production practices, and evolving<br />
use of reduced feeding strategies, of the typical Philippine tilapia producer in the dominant growing<br />
region. The supply chain analysis of Drs. Wilfred Jamandre of CLSU and Upton Hatch of NCSU, that<br />
was a separate investigation of this project, clearly demonstrated the dynamic growth and evolving nature<br />
of tilapia production in the Philippines. Philippine tilapia producers pursue a growing array of production<br />
and marketing strategies to meet this growing demand.<br />
RESULTS AND DISCUSSION<br />
Socio-demographics (Table 1). The region covered by the survey was concentrated in Pampangas but<br />
also included a few respondents from Bulucan and Nueva Ecija; The respondents included 33 owneroperators,<br />
23 caretakers, one family member and one hired professional manager; 47 were male and 11<br />
were female. Average age of owners was 47 with a range of 28 to 71; age of operators and caretakers was<br />
43 with a range of 18 to 72. The typical tenure status was traditional ownership (40), but leasing was also<br />
common (14) and there were 4 respondents who managed ponds under both of these arrangements. Share<br />
tenant status (kasama) was thought to be a possibility, and the project team prior to conducting the survey<br />
interviews expected such respondents, but none were present in the final completed data set. Lease cost<br />
in Philippine pesos (Php/ha/crop) ranged from 7,000 to 20,000; experience of survey respondents with<br />
tilapia farming averaged 10 years and ranged from 1 to 25. Eight respondents used a P. vannamei<br />
polyculture and one used catfish.<br />
244
245<br />
TECHNICAL REPORTS: INVESTIGATIONS 2009–2011<br />
Farm Characteristics (Table 1). Pond area owned or managed by the respondents averaged about 5<br />
ponds totaling 17 ha and most ponds (approx 80%) were between 1 and 10 ha; the entire farm was<br />
approximately 21 ha. Three were under 1 ha - the smallest farm was only one pond of 0.3 ha. There were<br />
9 respondents with 10 or more ha; the farm with the greatest area was 282 ha and the most ponds were 50.<br />
In summary, the socio-demographic profile of the typical respondent was a male in his 40’s who lived in<br />
the Pampangas region and owned and operated a 20 ha farm that had 5 ponds averaging approximately 3<br />
ha each.<br />
Water source was an irrigation canal (31) or river (20), pond depth averaged 1.7 m, and soil type was<br />
either clay (45) or clay-loam (13). Salinity during low tide was 0, but at high tide there were 22 farms<br />
that had non-zero pH measurements that were typically in the 3-8 pH range. The ponds with these higher<br />
high tide salinity measurements often used polyculture of P. vannamei and tended to stock T.<br />
mossambica.<br />
Management Practices (Table 1). The FaST strain of tilapia dominated (41) and BFAR-GetEXCel (11)<br />
and GIFT (6) were also used; most purchased their fingerlings from private sources (53) and only 5<br />
depended solely on raising and stocking their own fingerlings. Density averaged about 50,000 per ha,<br />
size was typically 22 (grading size); average price per fingerling was 0.39 PhP and ranged from 0.34 to<br />
0.50.<br />
The average harvest yield was 5,000 kg/ha comprised of 200 g fish and accomplished in a 5-month<br />
culture period. The size at harvest ranged from 4 to 7 per kg and averaged 4.9 per kilogram or about 205<br />
g. According to the supply chain analysis of Wilfred Jamandre and Upton Hatch, this size range targets<br />
local live markets (150-200g) and only the largest (250g and above) have potential to be marketed<br />
through higher volume urban grocery market outlets. The analysis found that fish destined for the latter<br />
market were often culled and re-stocked into specialized finishing ponds at lower stocking densities to<br />
increase average size demanded by this rapidly growing market opportunity. The lower ranges in the<br />
culture period and average sizes obtained from assessment survey respondents may indicate this culling<br />
strategy. A large array of production and marketing constraints were mentioned by respondents. Climate<br />
related fish kills (26) and typhoons (8) were the most common mentioned. Ten suggested predation from<br />
turtles was their most important source of yield loss. Also mentioned were: fish disease from fungi, water<br />
quality, availability, cost and quality of fingerlings, feed and market and finance issues.<br />
Almost half the farmers (28 of 58) had adopted the <strong>CRSP</strong>-CLSU reduced feeding strategy. Respondents<br />
typical feeding schedule was completed in 5 months with a range of 4 to 6 months. Of those farmers<br />
using reduced feeding, the majority employed the delayed feeding strategy; the most common delay was a<br />
week and the average was about 2 weeks; there was one farmer who delayed feeding for a month and two<br />
who used a 45 day delay. Reduced daily feeding with an alternate day strategy and percent daily<br />
reductions of 50% and 67% were additional possibilities included in <strong>CRSP</strong>-CLSU research, training<br />
sessions and the assessment survey; three survey respondents used these strategies. One used 50%<br />
feeding for 2 months and another for 3 months; another respondent used alternate day for 2 months; no<br />
respondents used 67% reduced daily feeding. In summary, about half the farmers were willing to try the<br />
<strong>CRSP</strong>-CLSU reduced feeding regimens and the most common was 2-week delayed feeding.<br />
Monthly feeding was accomplished with a staged approach using fry mash, pre-starter, starter, grower and<br />
finisher feed formulations. Typically each stage lasted about one month. In the first month all farmers<br />
used fry mash (13kg/ha), but depending on growth results, feed availability and marketing strategy, many<br />
farmers followed different patterns of formulation use. In month 2, only about 20% used pre-starter; most<br />
skipped pre-starter and used about 35 kg/ha of starter. In month 3, most farmers moved to grower<br />
formulation with a 62 kg/ha average feeding amount. By month 4, almost all farmers (85%) were feeding<br />
grower, averaging 85 kg/ha. Most farmers (72%)) harvested and marketed the crop in month 5, using an
TECHNICAL REPORTS: INVESTIGATIONS 2009–2011<br />
average of 70 kg/ha with an even split between grower and finisher. The farmers that waited until the 6 th<br />
month to harvest their ponds may have faced an array of impediments. In the previous section, the<br />
constraints that farmers mentioned to interviewers were typically related to climate, predation, and<br />
financial/marketing problems. The total cost of feed (210,116 Php/ha/crop) was predominantly for<br />
grower (54%) and finisher (21%).<br />
Over ¾ of the farmers (79%) used fertilizer and of those 90% purchased inorganic fertilizers with an<br />
average total cost of 1,435 PhP/ha/crop. The most common formulation was 16-20-0 used by 31 farmers<br />
at an average rate about 1.55 bags per ha and a price of 950 PhP/bag. The second most used fertilizer was<br />
46-0-0 by 18 farmers with an average rate of 1.02 bags/ha and a cost of 1,032 PhP/bag. A small number<br />
of respondents also used 21-0-0 or 14-14-1.4.<br />
As discussed above, 48 respondents hired labor and the average cost was 2,770 PhP/ha/crop.<br />
Thirty six farmers reported using chemicals; the most common was lime. Also used were: zeolite,<br />
sodium, dolomite, probiotics, and deocare. Total average chemical cost was 1,358 PhP/ha/crop.<br />
246
247<br />
TECHNICAL REPORTS: INVESTIGATIONS 2009–2011<br />
Table 1. <strong>CRSP</strong> Assessment Survey Descriptive Statistics: Philippines. Tilapia. 2011.<br />
Item Range Average Number<br />
Min Max<br />
Owner-Operator<br />
Owner<br />
Age (yrs) 28 72 47<br />
Gender 47 Male<br />
11 Female<br />
Operator<br />
Age (yrs) 18 72 43<br />
Gender 53 Male<br />
5 Female<br />
Experience (yrs) 1 25 10<br />
Water<br />
Pond<br />
Area (ha) 0.3 282 17<br />
Size (ha) 0.1 10.4 2.8<br />
Water Source<br />
Well 6<br />
Irrigation Canal 28<br />
Well + Canal 3<br />
River 20<br />
Harvest<br />
Weight (kg/ha) 1,857 8,800 5,195<br />
Avg size (#/kg) 4 7 4.9<br />
Price (PhP/kg) 49 70.5 61.4<br />
Culture period (mo) 4 6 5.1<br />
Stocking<br />
Species Strain<br />
GIFT 6<br />
BFAR-GetEXCel 11<br />
FaST 41<br />
Fingerling<br />
Source<br />
Own 5<br />
Private 53<br />
Size (Sorting Screen)<br />
22 49<br />
20 6<br />
17 3<br />
Density (000/ha) 35 71 49<br />
Cost (PP/kg) 0.35 0.5 0.40<br />
Feed<br />
Method<br />
Daily full feeding 31<br />
50% daily<br />
Months 1 & 2 1<br />
Month 3 1<br />
67% daily 0<br />
Alternate day<br />
Last 2 months 1<br />
Delayed
TECHNICAL REPORTS: INVESTIGATIONS 2009–2011<br />
Table 1. <strong>CRSP</strong> Assessment Survey Descriptive Statistics: Philippines. Tilapia. 2011.<br />
Item Range Average Number<br />
Min Max<br />
7 11<br />
14 7<br />
21 4<br />
30 1<br />
45 2<br />
Schedule<br />
Month 1<br />
Type 1 1 1 1<br />
Amount (kg/ha) 1.0 40.0 13.0<br />
Month 2<br />
Type 1 4 2.6<br />
Amount 4.5 120.0 34.4<br />
Month 3<br />
Type 3 4 3.7<br />
Amount 7.1 150.0 62.0<br />
Month 4<br />
Type 3 5 4.1<br />
Amount 14.3 166.7 84.7<br />
Month 5<br />
Type 3 5 4.4<br />
Amount 14.3 166.7 70.0<br />
Month 6<br />
Type 3 5 4.6<br />
Amount 17.9 138.9 59.9<br />
Total Feed Cost 210,116<br />
Fry Mash 429 35,880 8,350 (4%)<br />
Pre-starter 3,384 21,000 10,595 (5%)<br />
Starter 4,107 163,567 32,612 (16%)<br />
Grower 16,311 270,000 114,183 (54%)<br />
Finisher 12,321 88,889 44,376 (21%)<br />
1 1=fry mash; 2=pre-starter; 3=starter; 4= grower; 5=finisher<br />
Fertilizer<br />
Use fertilizer<br />
Y 46<br />
N<br />
Type<br />
12<br />
Organic 5<br />
Inorganic 40<br />
Both<br />
Formulation (NPK)<br />
1<br />
16-20-0 31<br />
Amount (bags/ha) 0 6 1.55<br />
Price (Php/bag) 1,000 890 951<br />
46-0-0 18<br />
Amount (bags/ha) 0 5 1.02<br />
Price (Php/bag) 1,070 1,000 1,032<br />
21-0-0 2<br />
Amount (bags/ha) 0 2.19 1.09<br />
248
249<br />
TECHNICAL REPORTS: INVESTIGATIONS 2009–2011<br />
Table 1. <strong>CRSP</strong> Assessment Survey Descriptive Statistics: Philippines. Tilapia. 2011.<br />
Item Range Average Number<br />
Min Max<br />
Price (Php/bag) 780 680 730<br />
14-14-14 5<br />
Amount (bags/ha) 0 2 .86<br />
Price (Php/bag) 1,370 1,370 1,370<br />
Total fertilizer cost<br />
(PhP/ha/crop)<br />
Labor<br />
1,435<br />
Family 10<br />
Hired 48<br />
Cost (PhP/ha/crop)<br />
Chemical use<br />
0 15,000<br />
Chemicals<br />
2,770<br />
Y 36<br />
N<br />
Type<br />
19<br />
Zeolite 2<br />
Sodium 9<br />
Dolomite 4<br />
Lime 22<br />
Probiotics 2<br />
Deocare 2<br />
Total chemical cost<br />
(PhP/ha/crop)<br />
1,358<br />
Effects of Reduced Feeding Management Strategy. Table 2 summarizes the comparison of traditional<br />
daily full feeding with the <strong>CRSP</strong> CLSU reduced feeding regimens. Following the survey results<br />
discussion above, a focus on the comparison of the farmer management systems used by farmers who<br />
adopted reduced feeding with those farmers who continued to use daily full feeding will provide insights<br />
into the benefits and costs of the reduced feeding regimen. The effects on production, cost and net returns<br />
are all a major focus of the survey and its analysis.<br />
Table 2. <strong>CRSP</strong>-CLSU Assessment Survey: Production, Cost, and Net Return Estimates. Daily Full<br />
Feeding vs. Reduced Feeding. Philippines. Tilapia. 2011.<br />
Item Feeding Strategy<br />
Daily Full Reduced Change<br />
Amount Percent<br />
Production<br />
Yield (kg/ha/crop) 5,195 5,359 164 3<br />
Average Size (#/kg) 4.9 4.0 0 0<br />
Culture period (months) 5.0 5.1 0.1 2<br />
Total Revenue<br />
Total Revenue (PhP/ha/crop)<br />
(Price = PhP 61)<br />
316,895 326,899 10,004 3<br />
Input Cost (PhP/ha/crop)<br />
Feed 210,116 183,103 -27,013 -13<br />
Fertilizer 1,435 1,409 -26 -2
TECHNICAL REPORTS: INVESTIGATIONS 2009–2011<br />
Labor 2,770 3,238 462 17<br />
Chemical 1,358 2,054 696 51<br />
Fingerlings 19,460 19,460 0 0<br />
Total Cost<br />
Total Cost (PhP/ha/crop) 235,139 209,264 -25,875 -11<br />
Net Returns<br />
Net Return (PhP/ha/crop) 80,435 117,635 37,200 46<br />
The survey had 27 respondents who used reduced feeding and the most common regimen was 2-week<br />
delayed feeding, used by 20 farmers. Over 5 MT were produced per hectare per crop for both regimens<br />
with reduced feeding resulting in a small increase of 164 kg or a 3% yield increase. Based on a relatively<br />
small sample size, these results should be interpreted to indicate no evidence that these yields are different<br />
in terms of total weight harvested, which is supported by previous experimental trials. The average size<br />
was slightly smaller for reduced feeding.<br />
<strong>CRSP</strong>-CLSU on farm trials show that reduced daily feeding and alternate day feeding profoundly reduce<br />
feed costs with little impact on yield relative to full daily feeding. However, the sample size in this<br />
survey was very small for a comparative analysis to the on-farm research trials. Nevertheless, it appears<br />
some farmers are adopting the practice.<br />
In light of the evidence above that reduced feeding will not affect harvest weight but could have negative<br />
effects on average size, an examination of cost is crucial in assessing the strategies overall economic and<br />
financial advantages. These data indicate a 13% reduction in feed cost amounting to over 27,000 PhP<br />
savings per hectare per crop, definitely a strong incentive to adopt a delayed feeding strategy. Fertilizer<br />
use also somewhat declined by around 2%. Labor showed an increase largely due to the fixed nature of<br />
many labor arrangements used by owners who hire labor and managers for their ponds. Chemical costs<br />
increased. Stocking densities were not different for the reduced feeding regimens, thus fingerling cost<br />
was unchanged. Overall, total cost decreased by 11% with the delayed feeding strategy.<br />
Because some cost are not included, net returns as used in this report might be better viewed as change in<br />
net returns, not an absolute estimate of total net returns. That is, the analysis concentrates on aspects of<br />
the management regimen that are expected to be different; other costs, e.g. lease debt financing,<br />
marketing, are not investigated. Overall, we found that net returns increased by 46% with the delayed<br />
feeding providing a net return of almost 37,200 PhP/ha. These results are in line with the expectations of<br />
farm trials conducted by the <strong>CRSP</strong>-CLSU team. Their central hypothesis that reduced feeding could<br />
result in lower costs without reducing yield is supported by survey responses. The potential economic<br />
effects of smaller sized fish with delayed feeding cannot be assessed within the scope of the survey.<br />
CONCLUSIONS<br />
Table 3 summarizes the performance indicators for the <strong>CRSP</strong> project in the Philippines, much of which<br />
has already been discussed. Participation of local farmers was encouraging and assessment visits,<br />
interviews and survey have indicated encouraging production results, shedding light on project<br />
accomplishments. Approximately half of the farmers surveyed used reduced feeding strategies and their<br />
responses supported previous on-farm production trials that showed the cost of feed can be reduced with<br />
little impact on total yield. It appears through these surveys that farmers have adopted reduced feeding<br />
strategies at a high rate and that they are also showing a substantial increase in net returns with this<br />
management practice. Hence, <strong>CRSP</strong> research and extension appears to have been effective in improving<br />
farm management practices and the potential income of tilapia farmers in the Philippines. Since, the<br />
effectiveness of alternate day and subsatiation daily feeding protocols in reducing production costs was<br />
demonstrated later than the delayed feeding practice, it is possible that these procedures may be adopted<br />
250
251<br />
TECHNICAL REPORTS: INVESTIGATIONS 2009–2011<br />
with greater frequency in the future. Additional and more extensive surveys should be conducted<br />
throughout Central Luzon to grasp the full impact of <strong>CRSP</strong> research on the tilapia community and its<br />
estimated 15,000 ha of farms.<br />
Table 3. Assessment Indicators for <strong>CRSP</strong>-supported Technologies: Reduced Feeding in<br />
Philippines. 2007-2011.<br />
Participation<br />
<strong>CRSP</strong> supported technology Survey indicated about ½ of farmers were using reduced<br />
feeding.<br />
Interviewed/surveyed 58 survey respondents in Pampangas, Nueva Ecija and<br />
Bulucan districts.<br />
Production<br />
Yield Reduced feeding did not reduce yield in terms of weight<br />
but may have affected size<br />
Area (ha) Survey indicated about ½ of hectares were managed<br />
using reduced feeding.<br />
Household consumption and nutrition No change<br />
Resources and Cost<br />
Time No change<br />
Purchased Inputs<br />
Fixed No change<br />
Variable<br />
Labor (PhP/ha/crop) +17%<br />
Fertilizer -2%<br />
Feed (PhP/ha/crop) -13%<br />
Chemical (PhP/ha/crop) +51%<br />
Stocking (PhP/ha/crop) No Change<br />
Returns<br />
Gross (PhP/ha/crop)<br />
No change<br />
Net (PhP/ha/crop) +46%<br />
Risk Management<br />
Biological No change<br />
Economic Reduced feeding decreases dependence on most<br />
expensive purchased input - feed
TECHNICAL REPORTS: INVESTIGATIONS 2009–2011<br />
2. Enhance Training, Capacity Building and Impacts of Alternative Feeding Practices and<br />
Integrative Production Systems for Milkfish Culture in the Philippines.<br />
We expanded our training on integrative production systems and feed management practices for milkfish<br />
culture from Guimaras Island (Investigation 09MNE02NC) to Mindanao island where milkfish culture<br />
predominates, e.g. Panabo City and Tababuli-Digos, Davao or on Palawan island (Visayas region) and to<br />
Palawan island where the industry is beginning to emerge.<br />
The Mariculture Park (MP) was conceptualized by the Philippines Department of Agriculture-Bureau of<br />
Fisheries and Aquatic Resources (DA-BFAR) in view of its recognition of the potential of mariculture in<br />
increasing aquaculture production and its contribution in meeting targets set in the Comprehensive<br />
National Fisheries Development Plan (2006-2025). The objectives of the Mariculture Parks Program<br />
include the following: 1) provide employment and an alternative source of livelihood for marginalized<br />
and sustenance fisherfolk; 2) develop an area with appropriate infrastructure that will allow fishermen,<br />
fish farmers and investors to operate cost-effectively and securely; 3) develop skilled and technically<br />
capable fisherfolk to support the mariculture industry; and 4) promote the use of environment-friendly<br />
inputs and farm management practices. From the first MP established by BFAR at Samal Island in Davao<br />
in 2001, there are as of April 2011, 63 operational mariculture parks, with seven to be launched. BFAR<br />
pr<br />
ovides the infrastructure and technical assistance while local government units provide the legal<br />
framework and support for the establishment of MPs in their respective areas. Only a few of the MPs<br />
established by BFAR has attracted more than 50 locators with about half still being operated by BFAR or<br />
local government units (LGUs )as demonstration sites. Nevertheless, production from marine fish cages<br />
and fishpens dramatically increased from 4,282 MT in 2001 to over 87,000 MT in 2010 with<br />
corresponding increase in production value from P648 million to P8.4 billion. Because of this<br />
intensification, it has become imperative to develop more sustainable methods that limit nutrient input in<br />
the environment. Indeed, some of these MPs are experiencing poor water quality (low oxygen, high<br />
nitrogen, and high sulfides in sediments) and higher risks of crop loss.<br />
Two 5-day survey cum informal workshops on cage culture of milkfish and other species that included<br />
interviews with farmers/operators, investors, local government officials and BFAR and Regional<br />
Fisheries Training Center (RFTC) personnel was conducted in the Panabu City MP and Tagabuli Bay<br />
Park from June 27-July 1 and August 7-13, 2011, respectively. These workshops included the<br />
participation of 30 milkfish farmers, operators and technicians. The project examines the technological,<br />
environmental, socio-economic and financial components of the operations of the mariculture parks and is<br />
outlined in greater detail in the workshop reports submitted. Almost all of the cages are stocked with<br />
milkfish. Interviews and consultations revealed 3 major constraints to production – reliable source and<br />
consistent supply of good quality fingerlings, prohibitive cost of feeds, and marketing. An additional<br />
concern at Tagabuli Bay Park was the periodic low water quality associated with milkfish cage clusters<br />
that result in emergency harvests.<br />
To address these concerns SEAFDEC personnel provided information, including that established through<br />
<strong>AquaFish</strong> <strong>CRSP</strong> research on how production and economic efficiencies can be further improved by some<br />
technical interventions. First, is the establishment of multispecies marine fish breeding center and<br />
satellite hatcheries, which will consequently produce a stable supply of fry and fingerlings and lower their<br />
cost. Second is to improve feeding strategies and management such as the utilization of alternate day<br />
feeding strategies shown through recent <strong>CRSP</strong> research to reduce feed inputs by as much as 30%. To<br />
help address the issue on feed costs, RFTC XI Director Andrew Ventura announced that RFTC will set up<br />
demo production cages, using alternate day feeding strategies with production runs currently in progress.<br />
Additionally, a discussion of the advantages of on-farm feed production using locally-available cheap<br />
252
253<br />
TECHNICAL REPORTS: INVESTIGATIONS 2009–2011<br />
inputs was provided. E.G. Ayson informed the group of the study being conducted by R. Bolivar in CLSU<br />
in collaboration with R. Borski and his team in NCSU using fermented chicken as protein source. The<br />
use of fermented milkfish by-products from processing/value adding activities as replacement for<br />
fishmeal is being tried by one enterprising farmer/investor, which is reportedly 30% cheaper than<br />
commercial feeds and results in comparable, if not better growth and survival. Third, is to apply the<br />
concept of polyculture or Integrated Multi-trophic Aquaculture (IMTA) in the grow-out of milkfish to<br />
increase profit and reduce negative impact to the environment. SEAFDEC personnel provided<br />
information on integrative culture systems that incorporate sandfish (sea cucumber), seaweed and<br />
rabbitfish into milkfish systems.<br />
Two additional workshops on milkfish culture technologies and best management practices to include<br />
integrative culture systems and feeding strategies were conducted in Palawan in Peurto Princessa and<br />
Narra. We had originally planned to conduct these in Leyte. However, due to the relatively pristine<br />
condition of Palawan, the rapid emergence of coastal seaweed, milkfish and marine finfish culture, and<br />
the limited training available in the region, BFAR was particularly interested in building capacity and the<br />
training in sustainable culture techniques. They BFAR training center helped sponsor the workshops.<br />
Twenty-one and 37 individuals participated in these workshops, which were met with considerable<br />
enthusiasm. Drs. E.G. Ayson, F. Ayson, M. Luhan and R. Borski and others presented information on<br />
gender awareness; milkfish and finfish nursery and growout, feeding strategies, and integrative culture<br />
systems.<br />
We also conducted additional workshops on value-added processing of seaweed and milkfish in Leganes,<br />
Iloilo (Visayas region) geared to women to enhance their continued participation in aquaculture and<br />
opportunity to improve household welfare through sale of products in local markets. Maria Luhan<br />
conducted the one-day training workshop that included initial lectures on seafood safety; marketing<br />
techniques; milkfish processing, deboning and marinating; and on seaweed preparation and cookery.<br />
Recipes were provided. This was followed by skills enhancement exercises in milkfish deboning and<br />
practicums on utilizing seaweeds to make crackers, tortillas, salads, and other items that can be marketed<br />
locally and/or consumed by households. Twenty-five women participated in the workshops with the<br />
intent on supplementing their household incomes with through local market sale of value-added products<br />
and for enhancing household nutrition.<br />
3. Assessing Impacts of Polyculture Training on Fish and Shrimp Farming in Aceh,<br />
Indonesia<br />
The <strong>AquaFish</strong> <strong>CRSP</strong> aquaculture program in Aceh, Indonesia has focused on promoting the adoption of<br />
best aquaculture practices for seaweed-shrimp/finfish polyculture systems. These systems involve a more<br />
sustainable use of small-scale tambak culture systems that incorporate seaweed (gracellaria), shrimp and<br />
fish and that were destroyed in the 2004 tsunami. Based on interviews, farm visits and data collection,<br />
this section will provide an assessment of the program’s economic impact.<br />
MATERIALS AND METHODS<br />
Visits were made and interviews (20 farmers) conducted during August 2010 and August 2011 at UBAC<br />
in Banda Aceh; ACIAR (Australia Centre International Agriculture Research (ACIAR) Samalanga<br />
demonstration site in Bireun District; Lancang in Pidie District; Trengadring Multi Species Hatchery in<br />
Pidie Jaya District; and Bayu in Aceh Utara District. Negotiations were conducted in Medan and Pidie by<br />
Kokarkin, Hasanuddin, Hatch and Fitzsimmons with a buyer and farmers to facilitate a seaweed purchase
TECHNICAL REPORTS: INVESTIGATIONS 2009–2011<br />
agreement in August 2011. These negotiations were successfully concluded and the agreement<br />
commenced in October 2011.<br />
The performance criteria used in economic impact assessment will center on the extent to which future<br />
incomes of small-scale aquaculture farmers in Indonesia will improve through the seaweed polyculture<br />
system recommended by the <strong>CRSP</strong> UBAC program. Has the project has put in place a system that will<br />
facilitate farmer’s ability to augment their incomes and family nutrition?<br />
The discussion will proceed with a general description of the existing fish farming system that the<br />
polyculture of seaweed will need to complement, followed by some observations on seaweed polyculture.<br />
The existing system imposes constraints on the opportunity for seaweed polyculture, but it also provides<br />
an opportunity to benefit farmers not only through its own culture but also on positive interaction with the<br />
existing system. That is, an evaluation of the economic contribution of seaweed polyculture must be<br />
analyzed not solely in the cost and returns to seaweed, but of equal importance the effects on the cost and<br />
returns to the other crops in the polyculture system. This contribution can be viewed as a pond<br />
management strategy that reduces both biological and economic risk. Benefits of biological risk<br />
reduction are largely related to potential disease and water quality improvements and economic risk<br />
management is addressed through portfolio diversification that ameliorates potential yield and price<br />
fluctuations.<br />
RESULTS AND DISCUSSION<br />
Current aquaculture system. The existing aquaculture system has centered on shrimp, milkfish and<br />
tilapia. Cultural practices (BMP’s) for these fish and seafood crops and their combinations in various<br />
polyculture systems are relatively established. However, optimal stocking and feeding rates have not<br />
been extensively researched under local conditions; most of these recommendation and actual farmer<br />
practices are based on trial and error and tilapia production in other locations. In addition, optimal feeds,<br />
e.g. optimal protein level, and product quality have not been studied. Consequently, although farmers are<br />
reasonably satisfied with the benefits to aquaculture, they felt they could benefit from more research that<br />
documents the best stocking densities, feeding rates and feed quality and also marketing opportunity.<br />
fish is an extensively cultured, inexpensive source of fish protein for local markets and its culture has a<br />
long consistent history of successful production and marketing. Shrimp culture has experienced severe<br />
disease problems with white spot virus; there generally have been few disease problems with milkfish or<br />
tilapia. Common shrimp harvest size ranges from 20-40/kg and tilapia are sold at about 400-500g.<br />
Typical stocking of tilapia and milkfish is in the range of 2,000-3,000 per ha; feeding at these densities<br />
will be 200 kg/ha/crop with a typical price of 6,000 -10,000 rupiah per kg based on feed quality. This<br />
feeding rate results in final harvest of about 550kg total (tilapia and milkfish). Seed are often from seed<br />
collectors who capture wild stocks.<br />
Tilapia culture is still evolving both in production and marketing sense. Hired labor is generally not used.<br />
Neighbors help each other harvest and each farmer does the various tasks during the season on his own.<br />
Harvest labor is the only task that requires a substantial effort in a constrained period of time. Sales are<br />
almost totally to brokers; however, some farmers rent stalls in local markets with some success. The<br />
consumer expects the seller to clean fish as requested. Current 2011 prices per kg are approximately<br />
15,000 rupiah for black tilapia (nilotica), 8,000 for red tilapia (mozambica) and 15,000 for milkfish. The<br />
possibility of cross breeding existing strains with Tilpaia honorum has been suggested to increase male<br />
population, but not rigorously tested.<br />
Issues and observations. Although initial community demonstration racks for seaweed drying were<br />
provided by the <strong>AquaFish</strong> <strong>CRSP</strong>, the number of racks has been inadequate. The minimum quantity that<br />
the market will purchase is 15 MT as a truckload from a buyer/assembler in Medan. This load provided<br />
by the Aceh producers will assist in augmenting product from other sources in the Medan area to reach<br />
254
255<br />
TECHNICAL REPORTS: INVESTIGATIONS 2009–2011<br />
the minimum size that the buyer/assembler will need to achieve to sell his product on international<br />
markets using a freighter load of 500 MT. For the Aceh farmers to participate successfully in this market<br />
supply chain, the capacity of seaweed drying racks is inadequate and expanding this capacity was an<br />
important element of buyer arrangement recently concluded.<br />
Seaweed marketing and processing. Although <strong>AquaFish</strong> <strong>CRSP</strong> has recently completed additional<br />
training on drying and preparation of seaweed, farmers may need more instruction and experience with<br />
post-harvest processing and inventory activities. Processing involves weighing, drying, cleaning and<br />
packaging and inventory considerations will require storage capacity and time delay to obtain sufficient<br />
product to meet minimum buyer load size. These inventory issues will result in a lag before production<br />
receipts are received. Polyculture with seaweed will not be an economic success unless this minimum<br />
market size can be reached and farmers learn how to prepare seaweed for market efficiently. These<br />
processing and inventory requirements are substantially different processes than most fish culture farmers<br />
are familiar with.<br />
This forward contracting system for seaweed will depend on establishing trust between farmers and<br />
brokers. A forward contracting system will stabilize price for farmers and quantity/quality for brokers;<br />
neither the buyer nor seller have any established history or relationship that underlies confidence that both<br />
ends of contract will be met. With the help of a trusted government entity, e.g., UBAC, to initiate the<br />
process, an evolving market maturation process will lead to eventual functioning of the market without<br />
public sector facilitation. Assurance to buyers that the minimum quantity/quality will be available on a<br />
consistent basis is crucial on the demand side and price stability is crucial on supply side for Aceh<br />
seaweed producers.<br />
Odor. The relationship between seaweed culture and odor in fish harvested is a concern to farmers and<br />
consumers that should be investigated more thoroughly. Best management practices need to be<br />
established and explained to farmers that minimize odor problem related to seaweed in polyculture ponds.<br />
There seems to be some confusion among farmers, extension and researchers, as to the exact context and<br />
process that is occurring as it relates to negative odors of fish and shrimp harvested from seaweed<br />
polyculture ponds. Several observations were provided that indicate the odor in fish and seafood<br />
marketed from polyculture ponds need serious scrutiny. Seaweed start to die within 1-2 months of the<br />
culture cycle; at this time, it is not possible to remove affected seaweed due to damage to<br />
shrimp/milkfish/tilapia. The odor is mostly a problem in fish – milkfish and tilapia, and particularly<br />
milkfish – not shrimp. Several hypotheses are being suggested that should be investigated: that (1)<br />
shrimp are able to move under seaweed or mangrove roots to remain unaffected and (2) as long as<br />
seaweed coverage in pond area is under 30%, dyeing seaweed and resulting odor in fish, is not likely to<br />
occur. These suggestions and others should be investigated to gain farmer’s greater confidence in<br />
seaweed polyculture.<br />
Shrimp virus. White spot virus in shrimp may be mitigated by polyculture with seaweed and tilapia.<br />
This virus, carried by crustaceans, has decimated shrimp culture in the Aceh area. The possibility that<br />
these polyculture systems reduce disease risk in shrimp is a major potential benefit to farmers. It is<br />
suggested that tilapia in pond canals and polyculture of shrimp with milkfish and seaweed in pond may<br />
have excellent disease management benefits. Also, there is evidence that rotation of pond, i.e. not<br />
growing same species in same pond each crop cycle, is also a potential strategy to reduce white spot<br />
damage.<br />
Some farmers overstock in anticipation of losses due to oxygen deficiency related to dying seaweed.<br />
Because, in general, shrimp die early in cycle (1-2 months), overstocking may be appropriate because<br />
feed will not have been wasted on shrimp that are not eventually harvested. Polyculture with shrimp also<br />
mitigates damage of white spot by allowing farmers to continue with fish crops if shrimp are severely
TECHNICAL REPORTS: INVESTIGATIONS 2009–2011<br />
damaged. Although lower shrimp stocking density is yet another potential solution to the white spot<br />
virus, these lower densities will likely reduce net returns to the shrimp culture substantially. It might be<br />
possible to increase stocking densities of the fish polycultures with the lower shrimp density, but the<br />
returns to milkfish and tilapia have been substantially lower than shrimp. The obvious conclusion from<br />
this discussion is that more research on BMP’s to mitigate white spot is needed.<br />
Current status of seaweed culture. Seaweed polyculture has an excellent opportunity to be<br />
incorporated into and provide several important benefits to the existing aquaculture system. However,<br />
this potential contribution is only beginning to materialize. Efforts to address several marketing and<br />
production constraints have been initiated, but results from these efforts are still pending. Reducing risk<br />
and uncertainty inherent in these constraints undercuts attempts to increase adoption and farmer risk<br />
attitudes are both expected and addressing them is key to establishing seaweed polyculture as an accepted<br />
alternative for aquaculture farmers.<br />
Current production constraints are generally related to seaweed polyculture interaction with other aspects<br />
of the polyculture system, e.g., yield, odor, shrimp virus. Support is needed to initiate and continue<br />
applied research and extension on (1) relationship between white spot virus and other polyculture (tilapia,<br />
milkfish, and seaweed); (2) interaction of odor and crops in polyculture system (tilapia, shrimp, milkfish,<br />
and seaweed) and (3) continuous updating of appropriate polyculture BMP’s, e.g., species mix, stocking<br />
densities, complementarities.<br />
Post-harvest processing and marketing issues are clearly constraining, and are as important as production<br />
constraints in establishing Aceh farmer’s long-term viable competitive position in the seaweed market<br />
supply chain. These are activities that farmers are generally not aware of or well skilled in. The postharvest<br />
chain of events – drying, weighing, cleaning, packaging, storage, selling, and transport – each<br />
involve challenges.<br />
Marketing agreement. Although at the end of the <strong>CRSP</strong> project seaweed had not been marketed,<br />
arrangements were in place for a buyer/assembler to purchase one 15 MT truckload of dried, cleaned,<br />
packaged seaweed weekly. Approximately 400 ha of seaweed are ready for harvest and at least 20<br />
farmers are prepared to be part of the arrangement. The incentive for the buyer is based on his need to<br />
provide a minimum freighter load of 500 MT; this volume requirement has been difficult to obtain from<br />
nearby producers in Medan. The buyer will provide the transportation and a small loan to assist in buying<br />
materials and paying a labor cost to expand drying rack capacity. The loan will be paid through<br />
payments, subtracting 25% of debt from receipts due to farmers. It is anticipated that both of these levels<br />
of participation will expand dramatically once profitability is demonstrated.<br />
A farmer representative was designated who will play a key role in the arrangement’s potential success;<br />
the buyer will deal exclusively with this individual. Sales transactions will be undertaken by the<br />
representative. In addition, this representative will be responsible for managing the weighing, drying,<br />
cleaning, packaging and storage. The seaweed will be stored in 25 kg bales until the minimum quantity is<br />
reached for scheduled deliveries. As success is demonstrated, other seaweed growing areas in Aceh are<br />
expected to begin harvesting and additional representatives will be needed in these other locations.<br />
Success of this representative will be important in determining whether this marketing arrangement is<br />
sustainable and whether other representatives will perform this function as production capacity expands.<br />
The process was initiated in October and is currently still operating at a mutually acceptable level. UBAC<br />
plans to provide farmer assistance after the <strong>CRSP</strong> project termination. If this arrangement is successful, it<br />
will provide a mutually beneficial opportunity in assuring that the buyer can meet freighter minimum<br />
volume and quality and that the farmers will have an additional income source with a very low input cost.<br />
256
CONCLUSIONS<br />
257<br />
TECHNICAL REPORTS: INVESTIGATIONS 2009–2011<br />
Table 4 summarizes the major performance indicators for the <strong>CRSP</strong>-UBAC program that has been<br />
already discussed in detail in earlier sections of this report. Overall, participation of local farmers was<br />
encouraging and assessment visits, interviews and survey have indicated encouraging production results,<br />
shedding light on project accomplishments and challenges. An estimated 100 farmers and 400 ha of farm<br />
area have adopted seaweed polyculture due in large part to the effort of <strong>AquaFish</strong> <strong>CRSP</strong>-UBAC program.<br />
A marketing agreement has been achieved for purchase of seaweeds, which should provide additional<br />
income for fish/shrimp farmers. Household consumption of nutritious seaweeds and the potential to<br />
market foods locally has been enhanced through post harvest training in processing, seaweed cookery,<br />
and value-added product development. Future work should be directed at optimizing polyculture systems<br />
and continued training in processing, inventory, and marketing activities.<br />
Table 4. Assessment Indicators for <strong>CRSP</strong>-supported Technologies: Reduced Feeding in<br />
Philippines. 2007-2011.<br />
<strong>CRSP</strong> supported technology<br />
Participation<br />
100 estimated farmers have seeded seaweed in their<br />
ponds.<br />
Interviewed/surveyed 20 farmers interviewed in Bireun, Pidie, Jaya and<br />
Utara districts.<br />
Production<br />
Yield 1 MT/ha 1<br />
Area (ha) 400 ha of seaweed is available for harvest. 1<br />
Household consumption and nutrition Small amount may be consumed in household.<br />
Resources and Cost<br />
Time<br />
Purchased Inputs<br />
High - harvesting, drying, cleaning and packaging<br />
Fixed<br />
Variable<br />
Drying racks/tables – buyer loan<br />
Labor (PhP/ha/crop) Labor cost increased substantially<br />
Fertilizer 0<br />
Feed (PhP/ha/crop) 0<br />
Chemical (PhP/ha/crop) 0<br />
Stocking (PhP/ha/crop) Transplants from previous crop<br />
Returns<br />
Gross (PhP/ha/crop)<br />
Additional income from polyculture or fallowed<br />
pond<br />
Net (PhP/ha/crop) Increased cash income – increased labor time and<br />
cost<br />
Risk Management<br />
Biological Seaweed polyculture can mitigate biological risks<br />
associated with tilapia, shrimp and milk fish culture<br />
systems<br />
Economic Portfolio diversification of products from pond<br />
reduces vulnerability to price fluctuation
TECHNICAL REPORTS: INVESTIGATIONS 2009–2011<br />
4. Podcasting to Promote Impacts of <strong>AquaFish</strong> <strong>CRSP</strong> Research and Outreach Activities<br />
A database of raw materials, pictures, and graphs were assembled for the development of 3 podcasts on<br />
milkfish culture. Specifically, the podcasts disseminate work showing the effectiveness of alternate day<br />
feeding in reducing feed costs by as much as 30-56% for growout of milkfish in sea cages and<br />
brackishwater ponds. One of the podcasts are produced in the English language and two others were<br />
modified and translated into Tagalog, the primary Philippines language, and Ilonggo, a primary dialect in<br />
the Iloilo, Visayas region of the Philippines. The podcasts are as follows:<br />
1) Alternate-Day Feeding Strategy for Reducing Cost of Milkfish Culture in Brackishwater Ponds and<br />
Marine Cages in the Philippines (English)<br />
2) Pag-aalaga ng Bangus sa tubig alat at tabsing sa pamamagitan ng pagbibigay ng pakain batay sa<br />
halinhinang araw ng pagpapakain (Tagalog) (English translation: Alternate-Day Feeding Strategy for<br />
Reducing Cost of Milkfish Culture in Brackishwater Ponds and Marine Cages in the Philippines)<br />
3) Alternate-Day Feeding Strategy for Reducing Cost of Milkfish Culture in Brackishwater Ponds and<br />
Marine Cages in the Philippines (Ilonggo)(Only the verbal language has been translated from English<br />
to Ilonggo)<br />
Scripts were all pre-written in an interview style prior to recordings. Original music soundtracks recorded<br />
by Dr. Gary Wikfors of the NOAA Biotechnology Branch (Milford, Connecticut), were also incorporated<br />
into the podcasts. Podcasts were reviewed by the team, modified where appropriate and then uploaded at<br />
the NCSU iTunesU site where downloads, and other data for podcasts will be collected<br />
(http://itunes.apple.com/us/itunes-u/milkfish-aquaculture-alternate/id499954016).<br />
We are also in the process of completing several other podcasts that highlight some successes of research<br />
at other <strong>AquaFish</strong> <strong>CRSP</strong> sites in Southeast Asia, Latin America and Africa.<br />
Due to the tight schedules amongst the US PI and host country PIs it has been difficult to arrange travel<br />
for collection of resources for development of the podcasts. Albeit more difficult, this is now being<br />
handled electronically. A new student has also been trained in podcasting to replace the one previously<br />
involved in production. One podcast is largely written and will be assembled, reviewed and uploaded<br />
shortly (Southeast Asia: Determining the Environmental Performance of Marine Shrimp Culture using<br />
Life Cycle Assessment). Others (Mexico, Africa, Southeast Asia) are at different stages toward<br />
completion, which we anticipate will occur over the next 45 days.<br />
258
259<br />
TECHNICAL REPORTS: INVESTIGATIONS 2009–2011<br />
Sustainable Feed and Improved Stocking Densities for<br />
Gar (Atractosteus spp.) Culture<br />
Sustainable Feed Technology/Experiment/09SFT07UM<br />
Solomon David and James S. Diana<br />
<strong>University</strong> of Michigan<br />
Ann Arbor, Michigan, USA<br />
Wilfrido M. Contreras-Sanchez<br />
Universidad Juarez Autonoma de Tabasco<br />
Villahermosa, Tabasco, Mexico<br />
Two experiments were proposed for this study. The first experiment investigates multiple treatments of<br />
fish-meal substitution (using animal by-products in place of fish meal at 0, 25, 50, 75, 100% substitution)<br />
in feed for two species of Atractosteus gars, the Cuban gar (A. tristoechus) and tropical gar (A. tropicus).<br />
The experiment using Cuban gars would take place at the <strong>University</strong> of Michigan (U-M), United <strong>State</strong>s,<br />
and the experiment using tropical gars at Universidad Juarez Autonoma de Tabasco (UJAT) in Tabasco,<br />
Mexico. The second experiment investigates improved stocking densities of tropical gars and would take<br />
place in Tabasco only. Stocking density treatments will be 25, 50, and 100 fish/m 3 .<br />
Aquacultured tropical gars were acquired by UJAT and pellet trained for feeding experiments. We are<br />
currently awaiting materials for production of the appropriate feed to be used in both Cuban gar and<br />
tropical gar experiments. Upon receipt of materials, feeding trials will commence on both species at their<br />
respective locations. Improved stocking density experiments will also begin at UJAT upon receipt of<br />
funds.<br />
CUBAN GAR EXPERIMENTS<br />
Cuban gars (~13-15 cm) were acquired through multiple shipments during March-June 2011 and were<br />
pellet-trained for experimental trials from June-August 2011.<br />
An initial feeding trial using live feed (fathead minnows Pimephales promelas) was run for 52 days to<br />
establish a baseline for growth rate at 0% fishmeal substitution. The pilot study used 4 replicates each<br />
with 3 gars in experimental aquaria. Individuals fed ad libitum on live fish had a mean increase in weight<br />
of 395% over the experimental period. Cuban gars (N = 45) are currently prepared for experimental trials<br />
at U-M that will begin in 1-2 weeks upon arrival of appropriate experimental feed from UJAT.<br />
A second pilot experiment was carried out to investigate growth rates of Cuban gars on different feed<br />
types. Experimental feed consisted of frozen fish (anchovies, used as a proxy for 100% fish meal), freeze<br />
dried krill (high-protein non-fish-meal feed), and a high-quality pellet (New Life Spectrum Pellet;<br />
primary ingredients were fish meal and krill meal). Initial feed amount was based on 10% of mean fish<br />
body weight for each tank. Fish were allowed to feed ad libitum for 30 min, at which point uneaten feed<br />
was removed. Amount of feed consumed was also monitored by subtracting weight of remaining feed<br />
from amount initially fed. Wet weights and dry weights of each feed type were calculated in order to<br />
accurately compare consumption across feed types. Water chemistry (pH, ammonia, nitrite, and nitrate)<br />
was also monitored weekly to test for localized effects of feed type on water chemistry. We expected<br />
insignificant differences in water chemistry among treatments due to the recirculating aspects of the<br />
system. Duration of experiment was 21 days (November 8 – November 29, 2011).
TECHNICAL REPORTS: INVESTIGATIONS 2009–2011<br />
Cuban gars were divided into 3 groups of 3 replicates per group. Group 1 (FISH feed) consisted of 3<br />
replicates, n = 4 fish per replicate; Group 2 (KRILL feed) consisted of 3 replicates, n = 5 fish per<br />
replicate; Group 3 (PELLET feed) consisted of 3 replicates, n = 5 fish per replicate. Total N = 42 fish.<br />
Individuals were maintained in 170 L fiberglass tanks (1 replicate group per tank) which were connected<br />
to a closed recirculating filtration system. Water temperature was maintained at approximately 27 °C<br />
using heaters in each tank for the duration of the experiment.<br />
Length and weight were measured 3 times over the course of the experiment (days 1, 14, 21) to determine<br />
percent growth and growth rates. Descriptive statistics and ANOVA were used to analyze growth and<br />
consumption data. After experiment concluded fish were removed from tanks and placed into a single<br />
round 1,000 L tank with high-capacity canister filtration. Fish are currently being fed a combination of<br />
pellet and krill feed in preparation for arrival of experimental feed from Mexico (expected in mid-late<br />
February 2012).<br />
Mean length did not significantly increase over time in any of the treatments, but this was expected due to<br />
the short duration of the experiment. Mean weight increased significantly in fish feed treatment, but not<br />
significantly in krill or pellet feed treatments. ANOVA tests indicated that both fish and krill feed<br />
treatments experienced significantly higher growth than pellet treatment, however, fish and krill feed<br />
treatments were not significantly different from each other. Consumption rates were significantly<br />
different among all treatments. Consumption was highest with fish feed (23.97 g/feeding), followed by<br />
pellet (15.26 g/feeding), and finally krill (11.48 g/feeding). Krill feed had the highest body mass gained<br />
per gram of feed consumed compared to other feed types. As expected, water chemistry did not vary<br />
significantly among any treatments likely due high water turnover rate by the recirculating system.<br />
Descriptive statistics for the experiment are found in Table C1.<br />
Table C1. Descriptive statistics for second pilot study of Cuban gar growth (weight) for 3 different feed<br />
types. All values are in grams unless otherwise noted. Day 1 and Day 21 are mean weight ± 1 standard<br />
error. Fish feed type was the only type to experience significant increase in mass compared to starting<br />
mass. Final mass of fish and krill feed treatments were significantly greater than pellet feed treatment.<br />
Mean consumption was significantly different among all feed types.<br />
Feed<br />
Type<br />
Day 1 Range<br />
Std.<br />
Dev.<br />
Day 21 Range<br />
260<br />
Std.<br />
Dev.<br />
Percent<br />
Growth<br />
Mean<br />
Consumption<br />
(g/feeding)<br />
Fish 44.60 ± 4.31 30.80-88.20 15.55 59.27 ± 5.50 42.50-109.60 19.04 31.78* 23.97*<br />
Krill 43.93 ± 4.75 20.20-98.20 18.41 54.87 ± 5.43 28.60-114.50 21.01 24.92 11.48*<br />
Pellet 54.53 ± 9.08 18.10-122.40 35.15 59.03 ± 9.30 22.40-128.40 36.02 8.25 15.26*<br />
*indicates significant difference based on ANOVA tests<br />
We believe the fish and krill feed treatments experienced greater growth for several possible reasons.<br />
Although all fish were trained to consume all three types of feed prior to the experiment, certain feed<br />
types seemed to hold greater appeal to the gars and therefore may have played a role in consumption and<br />
therefore growth. Fish feed is the most natural feed type to gars; even though feed was non-live chopped<br />
fish, the gars readily accepted this feed type and are naturally able to metabolize the food. Krill feed has a<br />
bright color and strong odor, both of which attracted the gars. Krill has also been shown to be highly<br />
digestible, and gars of all species have been shown to consume invertebrates such as insects and<br />
crustaceans. The pellet feed was not brightly colored, and did not have as strong an odor as krill. Both of<br />
these differences may have made the feed less appealing to the gars. Additionally, the pellet feed<br />
consisted of additional materials (wheat meal, brewer’s yeast, spirulina) which may not have been as
261<br />
TECHNICAL REPORTS: INVESTIGATIONS 2009–2011<br />
digestible to the gars compared to fish and krill meal, therefore growth may not have been optimal on<br />
pellet feed.<br />
These issues will all play a role in the full experiment, and we will adjust accordingly. All feed in the<br />
primary experiment will be pellet feed, so “appeal” of feed should not be as large a factor. Digestibility<br />
of non-fishmeal components will likely be the largest factor. Given these results, we hypothesize that the<br />
feed type with the highest amount of fishmeal will experience the highest consumption and the highest<br />
growth.<br />
TROPICAL GAR EXPERIMENTS<br />
Gars are top-level predators in their native ecosystems and are characterized by their elongated jaws,<br />
cylindrical bodies, and diamond-shaped ganoid scales. Their maximum size and age varies with species<br />
from approximately 80 cm and 10 years (shortnose gar) to 300 cm and over 70 years (alligator gar). Gars<br />
are generally polyandrous in reproductive strategy, with multiple male individuals spawning with 1-2<br />
females. Gars spawn during late spring and early summer in temperate regions and during the rainy<br />
season in tropical regions. Growth is extremely rapid, with all species capable of reaching 30 cm or more<br />
in their first growing season (young–of-the-year alligator gar can reach over 30 cm, 250 g in 3 months).<br />
Gars are excellent candidates for aquaculture as they exhibit rapid growth to large sizes, are highly<br />
resistant to disease, can be maintained at high densities, readily adapt to artificial feed at early life stages,<br />
and are highly tolerant to low water quality conditions due to their air-breathing abilities (Alfaro et al.<br />
2008). Their tolerance of low water quality via aerial respiration also allows for a less complicated<br />
technological system for aquaculture, as opposed to other fishes which may require considerable aeration<br />
and water turnover. Gars are therefore well-suited for culture in developing regions.<br />
Much progress has already been made in the aquaculture of Atractosteus gars (tropical, Cuban, alligator),<br />
primarily in regions of Mexico, Cuba, and the southern United <strong>State</strong>s. Broodstock for all three species<br />
have been established and are currently maintained in their native regions, and juveniles have been<br />
released to help restock diminishing wild populations. Further efforts are being made in the southern US<br />
to protect alligator gar populations and manage them as a viable sport fishery, as well as increase its<br />
potential as a food fish. Gars are already popular food fish in various regions of Mexico and Cuba.<br />
Due to their unique appearance and predatory nature, gars are becoming increasingly popular in the<br />
ornamental fish trade. Gars have been sought-after aquarium fish in Southeast Asia for many years, and<br />
are growing in popularity in the United <strong>State</strong>s and other countries. The Florida gar, native to only a small<br />
portion of the southeastern United <strong>State</strong>s, is the most popular aquarium species of gar in the US (usually<br />
wild-caught) and most readily available abroad. Prices in the United <strong>State</strong>s range from $15-$40 USD for<br />
20-35 cm individuals. Other gar species at similar sizes command a much higher price largely due to<br />
their rarity in the aquarium hobby, such as $200 USD for an individual tropical gar and over $300 USD<br />
for a Cuban gar (in the United <strong>State</strong>s). Tropical and Cuban gars are also highly valued overseas; in<br />
Singapore 15 cm tropical gars average $150 USD and Cuban gars $ 400 USD. Ironically, tropical and<br />
Cuban gars are among the most commonly cultured gar species. Specimens exhibiting genetic mutations<br />
in pattern or coloration (i.e. melanistic, xanthochroic, leucistic) command an even higher price, ranging<br />
from $1000 to over $5000 USD. Hybrid gars, although rare in the trade, are also much sought-after.<br />
In this study we aim to determine optimal stocking densities for grow-out and the possibility to substitute<br />
fishmeal, using by-products.
TECHNICAL REPORTS: INVESTIGATIONS 2009–2011<br />
Experiment 1. Determine Optimal Densities for Rearing Tropical Gars<br />
METHODS AND MATERIALS<br />
This study started using tropical gars averaging 13.00 g in weight and 15.66 cm in length. Fish were<br />
randomly allocated in a recirculation system composed of 1m 3 -tanks in three treatments (25, 50 and 100<br />
fish/m 3 ) run with three replicates. Every 15 days we registered growth in total weight and length. During<br />
the experiment we registered temperature, dissolved oxygen and pH. Tanks are cleaned by siphoning the<br />
bottom to eliminate wastes from fishes and remaining feed. All fish were fed ad libitum three times a day<br />
and total food consumed was recorded daily. Mortality was observed daily in every tank.<br />
Results were analyzed using a one way ANOVA to determined if there were significant differences<br />
(p0.05). At this time, fish stocked at 100 fish/m 3 had<br />
a mean weight (SD) of 14.94 g (1.13), with 15.56 g (1.22) for 50 fish/m 3 and 17.42 g (0.98) for 25<br />
fish/m 3 . Average length ranged from 15.98 to 16.54 cm. Despite no indication of significant differences,<br />
the fish with lower density had a slight tendency for better growth. This pattern was confirmed at 30 days<br />
of experimentation when statistical differences between densities were detected (ANOVA; P
263<br />
TECHNICAL REPORTS: INVESTIGATIONS 2009–2011<br />
Experiment 2. Determine the Degree to Which Fishmeal Can Be Replaced<br />
Using By-Products in Gar Feeds<br />
In this case we used fish weighing 14.40 g with an average length of 15.79 cm. Four treatments were<br />
evaluated (25, 50, 75 and 100% fishmeal substitution) run in three replicates. The fishes were placed in a<br />
recirculation system (every tank stocked with 10 fish). Fish length and weight will be measured every 15<br />
days to determine growth over the course of the experiment. From these growth data we will determine<br />
optimal feed types and stocking densities. From these trials we hope to develop low-cost and<br />
environmentally friendly methods (such as using lower-fishmeal content feeds) for culture of the tropical<br />
gar.<br />
This experiment was recently started. Fish averaged 14.40 g in weight and 15.79 cm in length. No<br />
significant differences were detected among treatments at the beginning of the experiment (ANOVA; P><br />
0.05). Fish will be sampled every 15 days to determine significant differences using a one-way ANOVA.<br />
Figure 1. Average weight and length for the three densities evaluated in this study after 30 days of<br />
experiment.<br />
Weight ( g )<br />
40 a<br />
30<br />
20<br />
10<br />
0<br />
a<br />
25 50 100 fish/m 3<br />
Treatments<br />
b<br />
Length ( cm )<br />
25<br />
20<br />
15<br />
10<br />
5<br />
0<br />
a<br />
25 50 100 fish/m 3<br />
Treatments<br />
Figure 2. Average weight and length for the three densities evaluated in this study after 45 days of<br />
experiment.<br />
a<br />
b
TECHNICAL REPORTS: INVESTIGATIONS 2009–2011<br />
SPOTTED GAR EXPERIMENTS<br />
In addition to growth experiments for Cuban gars, we conducted growth experiments comparing two<br />
populations (“peripheral” from the Great Lakes region and “core” from the Mississippi River basin) of<br />
spotted gars (Lepisosteus oculatus) to test for effects of latitudinal and countergradient variation in growth<br />
rates between populations (Figure 1). Identifying populations of fishes with higher growth rates at<br />
different temperatures can be beneficial in aquaculture by increasing production due to optimal growth.<br />
These “strains” of fishes would be the ideal choice for optimizing production (as seen in other species<br />
such as salmonids and centrarchids).<br />
Several northern populations of fishes have been shown to have faster growth rates than conspecifics<br />
from southern latitudes when reared in common garden environments. We tested for this variation in<br />
growth of young of the year (YOY) spotted gars in the following experiments. Based on our findings,<br />
other aquacultured lepisosteids, such as the much larger alligator gar (A. spatula) or more commonly<br />
cultured tropical gar, may exhibit similar interpopulation variation in growth. We propose to expand our<br />
research to other gar species and air-breathing fishes as well.<br />
Countergradient variation, or more generally, latitudinal variation, has not been studied in gars; the<br />
disjunct distribution and primitive ancestry of the spotted gar makes it a unique model species for<br />
investigation of this phenomenon. To explore potential differences in core and peripheral gar populations<br />
in the context of countergradient variation theory, we compared growth rates for the first growing season<br />
between core and peripheral populations of the spotted gar. Our primary objective was to investigate<br />
differences in life history patterns, specifically growth rate in the first growing season, between the Great<br />
Lakes (peripheral) and southern United <strong>State</strong>s populations (core) of spotted gars using common garden<br />
experiments. Our second objective was to determine whether any potential variation in growth rate might<br />
be explained by countergradient variation theory. We hypothesized that spotted gars from the peripheral<br />
population would exhibit a faster growth rate and higher capacity for growth at all temperatures than<br />
spotted gars from the core population. And further, we hypothesized that this variation in growth rate<br />
between populations is evidence of countergradient variation in growth of spotted gars.<br />
METHODS<br />
Spotted gars were acquired from two major sources to represent the core and peripheral populations.<br />
Core population representatives were collected via colleagues at Nicholls <strong>State</strong> <strong>University</strong> (Thibodaux,<br />
LA) in late spring 2009 from several localities in southwestern Louisiana using experimental gill nets, and<br />
peripheral population representatives were acquired from several inland lakes in southern Michigan. Fish<br />
from Louisiana were the progeny of wild-caught individuals from 2 localities in the Barataria estuary<br />
system (Bayou Chevreuil and Golden Ranch) and 1 locality in the Terrebone estuary system (Chacahoula<br />
Swamp) collected in March-April 2009. Individuals from the core populations were intermixed in order<br />
to reduce potential genetic bias from a single locality, and the same was done for individuals from<br />
peripheral populations. Adult fish from all core populations were maintained together in an indoor tank,<br />
and spawning was induced at 21°C using Ovaprim (Syndel Laboratories) injections at a concentration<br />
of 2.0 mL/kg body weight. Ovaprim was introduced via intramuscular injection near the anterior base<br />
of the dorsal fin, and spawning occurred within 24-48 hrs of injection. Viable embryos from this<br />
spawning event were then collected from the tank and approximately 150 specimens were shipped<br />
overnight to the <strong>University</strong> of Michigan.<br />
Adult peripheral population representatives were collected in late spring (May) 2009 from five different<br />
inland lake localities in southern Michigan using a boom electrofishing boat. Marble and East Long lakes<br />
are part of the St. Joseph River watershed, and Round, Carpenter, and Sugarloaf lakes are part of the<br />
Grand River watershed. Adults from peripheral populations were maintained together in an indoor tank<br />
similar to that of core population fish. Spawning was similarly induced using Ovaprim but was not as<br />
successful, therefore several adult fish were stripped of milt and eggs to create embryos (approximately<br />
264
265<br />
TECHNICAL REPORTS: INVESTIGATIONS 2009–2011<br />
200 specimens). Core population gars will be referred to as LA fish and peripheral population gars as MI<br />
fish from henceforth.<br />
Embryos from both populations were raised in separate 38 L aquaria using aeration and daily 50% water<br />
changes to maintain water quality. A 25-watt heater was used to maintain consistent temperature (21-23<br />
°C) during the incubation period as well as post-hatch. Sac-fry and free-swimming larvae were<br />
maintained in multiple aquaria separated into core or peripheral populations. Once larvae were<br />
zooplanktivorous, they were further separated into 3 aquaria per population to better maintain water<br />
quality. Zooplanktivorous larvae were first fed small Daphnia sp, and then larger Artemia adults. Larvae<br />
were fed 2-3 times daily to maintain a constant supply of food. Larvae from both populations were fed<br />
small (3.0 cm) fathead minnows Pimephales promelas upon converting to piscivory. Larvae were further<br />
separated roughly based on size into 3 aquaria per population to reduce cannibalism. To estimate early<br />
life growth rates during the period from 1-100 days after hatch (DAH) preceding experiment 1, 30<br />
individuals from each population were randomly selected weekly for measurements of length (0.1 cm)<br />
and weight (0.1 g). Mean growth rates (cm•d-1 and g•d-1) were then calculated for each population.<br />
Once juvenile gars were regularly feeding on medium-sized (4.5-6.0 cm, size range used in experiments)<br />
fathead minnows, individuals were randomly selected from each population and placed into experimental<br />
aquariums. All selected individuals were acclimated to experimental aquariums for 4-5 days prior to the<br />
start of experiment 1. Excess individuals were maintained in separate aquaria (based on population) as<br />
replacements if needed and for experiment 2.<br />
Experiment 1<br />
Twenty 75 L aquaria were used for housing YOY spotted gars from both populations (N = 30 fish from<br />
each population). Each aquarium was divided equally into three compartments using thin fiberglass<br />
screening, which allowed passage of water, but not other gars or feeder minnows. Each individual<br />
compartment housed one gar (3 gars per aquarium, total of 60 gars). Each aquarium also contained an air<br />
pump-operated sponge filter to maintain water quality and a 50-watt heater to maintain consistent<br />
temperature of 22-24 °C. Temperature range was selected based on mean temperatures experienced<br />
during the growing season by both populations (Redmond 1964, Echelle and Riggs 1972, Simon and<br />
Wallus 1989, Simon and Tyberghein 1991, personal observation). To further maintain water quality, 50%<br />
of the water was changed weekly for each tank, with waste material removed via siphon. Overhead<br />
fluorescent lights on electronic timers were used to maintain a consistent 12-hour photoperiod during the<br />
experiment. Individual spotted gars were fed fathead minnows ad libitum for the duration of the<br />
experiment, 62 days for LA fish and 63 days for MI fish. To accomplish ad libitum feeding, a small<br />
group of minnows (approximately 5.0-7.0 g total mass) was consistently maintained in each experimental<br />
compartment; consumed minnows were replaced and dead minnows were removed to prevent<br />
deterioration of water quality.<br />
Individual gars were removed from compartments to measure length and weight weekly as well as at the<br />
beginning and end of the experimental period. Mean length and weight were used to determine increase<br />
in growth and growth rate (cm•d-1 and g•d-1) over the experimental period. One-way analysis of<br />
variance (ANOVA) was used to test for significant differences in initial and end mean length and weight<br />
for both populations. Analysis of covariance (ANCOVA), with population and DAH as fixed factors,<br />
was used to determine significant differences in growth rates between populations, if any. I assumed a<br />
linear model for growth during the experimental period of development for both populations of spotted<br />
gars. Increase in length and weight for each population was plotted versus time (DAH or days of<br />
experiment) and analyzed using linear regression to generate growth models. Length-weight relationships<br />
were also analyzed with ANOVA and used as a proxy for comparing energy storage between populations.<br />
Experiment 2<br />
To investigate potential differences in growth rate between populations at different temperatures, spotted<br />
gars from both populations were divided into three temperature groups; 16 °C, 23 °C, and 30 °C, for a<br />
total of six groups (one peripheral group and one core group per temperature treatment). Each group was
TECHNICAL REPORTS: INVESTIGATIONS 2009–2011<br />
comprised of six spotted gars for a total of 36 gars in the experiment. Fish were randomly selected from<br />
both experiment 1 as well as excess individuals, and were all reared under the same temperature (23 °C)<br />
and feeding (ad libitum) regime for at least 30 days prior to beginning the experiment.<br />
Each group of gars was placed in a 190 L fiberglass tank containing a stand pipe connected to a large<br />
recirculating system for constant water filtration. Temperature was maintained using 75-watt heaters in<br />
the control and warm treatment group tanks, and was monitored daily. All groups were acclimated to<br />
respective temperature treatments for at least 7 days prior to beginning the experiment. Spotted gars in all<br />
tanks were given unlimited ration of fathead minnows, and photoperiod was maintained at 12 hours<br />
light/dark. Within each tank individual fish were identified by a single fin clip from the right/left<br />
pectoral fin, right/left pelvic fin, anal fin, or no fin clip. Marked fins were re-clipped as necessary (due to<br />
fin regeneration) on measurement days over the course of the experiment. Length and weight of all fish<br />
were measured at the beginning of the experiment as well as weekly for five weeks. Total duration of the<br />
experiment was 42 days.<br />
Mean length and weight were determined for both populations in each treatment weekly, and growth rate<br />
was calculated as in experiment 1. Length-weight relationships were also calculated and analyzed for<br />
each temperature treatment and used as a proxy for energy storage similarly to experiment 1. Due to<br />
limitations in replication because of low numbers of available fish and tanks (only 1 replicate of 6 fish for<br />
each population per temperature treatment), primarily descriptive statistics were used to analyze<br />
experiment 2.<br />
In addition to descriptive statistics, ANOVA tests were run using each fish as a replicate (N = 6 replicates<br />
per population in each treatment) to further investigate differences in growth rate and length-weight<br />
relationships between populations at each temperature. ANCOVA with temperature and population as<br />
fixed factors was performed for analysis of growth rate. All statistical analyses were carried out using<br />
JMP SAS (2001) software with significance levels set at α = 0.05.<br />
RESULTS<br />
Eggs from both populations hatched 6-7 days after fertilization. Hatching success was 70-80% for both<br />
populations, and newly hatched larvae were approximately 1.0 cm in length and weighed approximately<br />
0.5 g. Larval gars consumed their yolk sacs 6-7 DAH and began feeding on Daphnia and Artemia.<br />
Juveniles from both populations began eating small fathead minnows 35-40 DAH; 30 fish from each<br />
population were then randomly selected and moved into experimental tanks for acclimation.<br />
Growth rates in length and weight during early life were significantly higher (ANCOVA, p
267<br />
TECHNICAL REPORTS: INVESTIGATIONS 2009–2011<br />
In experiment 2, both populations responded differently to temperature treatments (Table 2, Figure 7).<br />
Fish from both populations at 16 °C exhibited very low increases in length (MI fish = 0.02 cm, LA fish =<br />
0.10 cm) and decreased in weight (MI fish = -1.18 g, LA fish = -0.38 g) during the 42-day period.<br />
Clipped fins (used to identify individual fish) did not regenerate on any individuals in either cool<br />
treatment, and consumption of fathead minnows was very low compared to other temperature treatments.<br />
Fish in the 23 °C and 30 °C treatments frequently required re-clipping of marked fins, as well as much<br />
more frequent replacement of fathead minnows. MI fish at 23 °C and 30 °C experienced larger mean<br />
increase in growth and growth rate (weight) compared to LA fish. One-way ANOVA tests comparing<br />
growth rates among all temperature treatments indicated that both populations experienced lowest growth<br />
rates at 16 °C, higher growth rates at 23 °C, and highest growth rates at 30 °C (Figure 8). Comparing<br />
growth rates within populations at different temperatures, MI fish experienced significantly higher growth<br />
in length from 16 °C to 23 °C, but not from 23 °C to 30 °C. LA fish experienced significantly higher<br />
growth in length among all three temperature treatments. MI fish experienced significantly higher growth<br />
in weight across all temperature treatments, while LA fish experienced significantly higher growth in<br />
weight from 16 °C to 23 °C, but not from 23 °C to 30 °C. The 16 °C treatment may have been near the<br />
point at which growth ceases in both populations of spotted gars.<br />
DISCUSSION<br />
We hypothesized that spotted gars from two disjunct population segments would exhibit latitudinal<br />
compensation in growth similar to several other fish species (Conover et al. 2009), and that under<br />
common environment conditions, fish from higher latitude would grow faster than those from lower<br />
latitude. Our experiments showed that in a common environment simulating periods within the first<br />
growing season (experiment 1: T = 23 ºC, duration approximately 60 days, 95-155 DAH; experiment 2: T<br />
= 16, 23, or 30 ºC, duration = 42 days), peripheral population spotted gars had a significantly higher<br />
growth rate than core population spotted gars, suggesting that important genetic and physiological<br />
differences exist between the two major population segments. Although lack of replication limited the<br />
extent of our statistical analyses in experiment 2, results clearly suggest that MI spotted gars maintained a<br />
higher growth rate than core population spotted gars even at warmer temperatures, and that both<br />
populations had similar thermal minima for growth. These results strongly support evidence for CnGV in<br />
growth rate in spotted gars.<br />
As in Atlantic silversides, the model species used to investigate CnGV in growth by Conover and Present<br />
(1990) (see also Conover 1992, Present and Conover 1992, Munch and Conover 2002), spotted gars begin<br />
spawning at approximately the same temperature (23 ºC) but later in the year with increasing latitude<br />
(Redmond 1964, Holt 1973, Trautman 1981, Becker 1983, Snedden 1999). Conover et al. (1990) also<br />
noted that later initiation of spawning and earlier onset of winter resulted in a much shorter growing<br />
season at higher latitudes. Although the length of growing season decreases as latitude increases, mean<br />
size at the end of first growing season does not decrease for several populations of fish species with<br />
increasing latitude (Conover et al. 2009). Therefore populations of these species at higher latitudes are<br />
able to compensate for shorter growing seasons by evolving faster growth rates than lower-latitude<br />
populations (Conover 1992).<br />
These differences in growth rate may be indicative of other potentially interesting eco-evolutionary<br />
dynamics between core and peripheral populations of spotted gars (explored in chapter 2) such as<br />
differences in life history patterns, as well as morphological and genetic variation. From an evolutionary<br />
ecology perspective, my results suggest that a rapid adaptation in growth rate has occurred even in<br />
relatively slowly-evolving fishes such as gars (Wiley 1976, Conover et al. 2009, Grande 2010, Carlson et<br />
al. 2011). The spotted gar, a warmwater species, entered the Great Lakes region via connections to the<br />
Mississippi River drainage (southern refugium) following the last glaciation no more than 8,000 years ago<br />
(Bailey and Smith 1981, Hocutt and Wiley 1986). Therefore adaptation of growth rate to length of<br />
growing season was relatively recent. Similarly, Mach et al. (2011) showed that in Atlantic silversides,<br />
another species expanding northward from a single southern refugium post-glaciation, regional adaptation
TECHNICAL REPORTS: INVESTIGATIONS 2009–2011<br />
(e.g. CnGV) and phenotypic patterns developed relatively recently. Using Pacific salmonids, Carlson et<br />
al. (2011) showed that shifts in body size due to selection over even a single generation can have large<br />
and lasting evolutionary impacts on both species and ecosystems.<br />
The scope of our study was limited to two major populations (core and peripheral) of spotted gars;<br />
including more populations in future experiments may provide a better picture of gradient in growth rate<br />
with increasing latitude. Despite this limitation, our study populations did represent a natural break in the<br />
distribution of spotted gars, in that the species is completely disjunct between the Great Lakes and<br />
Mississippi River basins (Page and Burr 1991), therefore our population comparisons are realistic if not<br />
comprehensive. The core population does span a greater latitudinal range than the peripheral population<br />
(approximately 1550 km compared to 220 km), therefore growth rate comparisons among fish from<br />
multiple core populations are recommended.<br />
Although CnGV has been observed in a diversity of ectotherms, most frequently in fishes, it has not been<br />
previously observed in gars. Furthermore, our study is the first to use common garden experiments to test<br />
for latitudinal variation in a non-teleost fish; an under-studied group in such investigations, because of<br />
their typically late maturation and long generation time (Ferrara 2001), as well as high energy<br />
requirements (Alfaro et al. 2008) compared to teleosts in similar studies (Conover and Present 1990,<br />
Schultz et al. 1996, Arendt and Wilson 1997, Power and McKinley 1997, Conover et al. 2009, Baumann<br />
and Conover 2010). Our results suggest that CnGV may exist in other evolutionarily and economically<br />
significant non-teleost species (i.e. lungfishes, sturgeons, alligator gar).<br />
Countergradient variation in growth of spotted gars may also have implications in the context of climate<br />
change and range expansion. Using the weak latitudinal temperature gradient of the Pacific silversides<br />
Atherinops affinis as a proxy for the gradual effects of climate change, Baumann and Conover (2010)<br />
showed that two species, Atlantic and Pacific silversides, each experiencing very different latitudinal<br />
temperature gradients, still exhibited CnGV in growth. Their study indicated that ectotherms have<br />
evolved growth adaptations to even weak climate gradients, and that a pole-ward migration of genotypes<br />
will be a likely result of an increasingly warmer climate. As a warmwater species exhibiting CnGV,<br />
spotted gars would likely successfully increase their range northward even with gradual increases in<br />
temperature.<br />
Previous studies have shown that in aquatic systems, species at higher trophic levels are at higher risk and<br />
are more frequently lost than those at lower trophic levels, in part because of their relatively small<br />
population sizes (Lande 1993, Petchey et al. 2004). Piscivorous fishes, therefore, may be particularly<br />
vulnerable amidst the ongoing biodiversity crisis. Furthermore, non-game piscivorous species (e.g. gars,<br />
Lepisosteidae; bowfin, Amia calva) may be even more at risk due to their poorly-studied ecology,<br />
perceived low economic value, and the higher priority given to propagation and management of game<br />
species (centrarchids, percids, esocids); the latter often leading to the destruction of both non-game<br />
individuals and habitat (Scarnecchia 1992). Our study provides evidence of unique characteristics of the<br />
peripheral population of spotted gars, and provides more evidence for the general argument that<br />
understanding and protecting peripheral populations should be a key component of our programs to<br />
conserve natural biodiversity.<br />
LITERATURE CITED<br />
Alfaro, R.M., C.A. Gonzales, and A.M. Ferrara. 2008. Gar biology and culture: status and prospects.<br />
Aquaculture Research 39: 748-763.<br />
Allendorf, F.W. 1988. Conservation biology of fishes. Conservation Biology 2: 145-148.<br />
Baumann, H. and D.O. Conover. 2011. Adaptation to climate change: contrasting patterns of thermalreaction-norm<br />
evolution in Pacific versus Atlantic silversides. Proceedings of the Royal Society B<br />
278: 2265-2273.<br />
268
269<br />
TECHNICAL REPORTS: INVESTIGATIONS 2009–2011<br />
Bailey, R.M. and G.R. Smith. 1981. Origin and geography of the fish fauna of the Laurentian Great<br />
Lakes basin. Canadian Journal of Fisheries and Aquatic Sciences 38: 1539-1561.<br />
Becker, G.C. 1983. Fishes of Wisconsin. <strong>University</strong> of Wisconsin Press, Madison.<br />
Berrigan, D. and J.C. Koella. 1994. The evolution of reaction norms: simple models for age and size at<br />
maturity. Journal of Evolutionary Biology 7: 549-566.<br />
Billerbeck, J.M., T.E. Lankford, and D.O. Conover. 2001. Evolution of intrinsic growth and energy<br />
acquisition rates: I. tradeoffs with swimming performance in Menidia menidia. Evolution 55: 1863-<br />
1872.<br />
Breck, J.E., C.P. Simon, E.S. Rutherford, P.J. Lamberson, B.S. Low, and D.R. Swank. 2008. When to<br />
mature? New Answers from life history theory, with applications to Great Lakes salmonids. In<br />
review.<br />
Brooks, T.M., R.A. Mittermeier, G.A.B. da Fonesca, J. Gerlach, M. Hoffmann, J.F. Lamoreux, C.G.<br />
Mittermeier, J.D. Pilgrim, A.S.L. Rodrigues. 2006. Global biodiversity conservation priorities.<br />
Science 313: 58-61.<br />
Carlson, S.M., T.P. Quinn, and A.P. Hendry. 2011. Eco-evolutionary dynamics in Pacific salmon.<br />
Heredity 1-10.<br />
Carman, S.M. 2002. Special animal abstract for Lepisosteus oculatus (spotted gar). Michigan Natural<br />
Features Inventory. Lansing, MI. 1-3.<br />
Channell, R. and M.V. Lomolino. 2000. Trajectories to extinction: spatial dynamics of the contraction of<br />
geographical ranges. Journal of Biogeography 27: 169-179.<br />
Conover, D.O. 1990. The relation between capacity for growth and length of growing season: evidence<br />
for and implications of countergradient variation. Transactions of the American Fisheries Society<br />
119: 416-430.<br />
Conover, D.O., and T.M.C. Present. 1990. Countergradient variation in growth rate: compensation for<br />
length of the growing season among Atlantic silversides from different latitudes. Oecologia 83: 316-<br />
324.<br />
Conover, D.O. and E.T. Schultz. 1995. Phenotypic similarity and the evolutionary significance of<br />
countergradient variation. Trends in Ecology and Evolution 10: 248-252.<br />
Conover, D.O., S.A. Arnott, M.R. Walsh, and S.B. Munch. 2005. Darwinian fishery science: lessons<br />
from the Atlantic silverside (Menidia menidia). Canadian Journal of Fisheries and Aquatic Sciences<br />
62: 730-737.<br />
Conover, D.O., T.A. Duffy, and L.A. Hice. 2009. The covariance between genetic and environmental<br />
influences across ecological gradients. Annals of the New York Academy of Sciences 1168: 100-<br />
129.<br />
Convention on Biological Diversity. 2008. Available: http://www.cbd.int/. (November 2008)<br />
Dudgeon, D., A.H. Arthington, M.O. Gessner, Z. Kawabata, D.J. Knowler, C.Leveque, R.J. Naiman, A.<br />
Prieur-Richard, D. Soto, M.L.J. Stiassny, and C.A. Sullivan. 2006. Freshwater biodiversity:<br />
importance, threats, status and conservation challenges. Biological Reviews 81: 163-182.<br />
Echelle, A.A., and C.D. Riggs. 1972. Aspects of the early life history of gars (Lepisosteus) in Lake<br />
Texoma. Transactions of the American Fisheries Society 101: 106-112.<br />
Ferrara, A.M. 2001. Life-history strategy of Lepisosteidae: implications for the conservation and<br />
management of alligator gar. Doctoral dissertation, Auburn <strong>University</strong>, Auburn, Alabama.<br />
Ferrara, A. M. and E. R. Irwin. 2001. Standardized procedure for internal sex identification in<br />
Lepisosteidae. North American Journal of Fisheries Management 21: 956-961.<br />
Foster, S.J. and A.C.J. Vincent. 2004. Life history and ecology of seahorses: implications for<br />
conservation and management. Journal of Fish Biology 65: 1-61.<br />
Garner, A., J.L. Rachlow, and J.F. Hicks. 2005. Patterns of genetic diversity and its loss in mammalian<br />
populations. Conservation Biology 19: 1215-1221.<br />
Goodyear, C. P. 1967. Feeding habits of three species of gars, Lepisosteus, along the Mississippi gulf<br />
coast. Transactions of the American Fisheries Society 96:438- 449.
TECHNICAL REPORTS: INVESTIGATIONS 2009–2011<br />
Grande, L. 2010. An empirical synthetic pattern study of gars (Lepisosteiformes) and closely related<br />
species, based mostly on skeletal anatomy. The resurrection of holostei. American Society of<br />
Ichthyologists and Herpetologists Special Publication 6: i-x, 1-871; supplementary issue of Copeia<br />
10: 2a.<br />
Heibo, E., C. Magnhagen, and L.A. Vollestad. 2005. Latitudinal variation in life-history traits in<br />
Eurasian perch. Ecology 86: 3377-3386.<br />
Helfman, G.S. 2007. Fish Conservation. Island Press, Washington.<br />
Herrington, S.J., K.N. Hettiger, E.J. Heist, and D.B. Keeney. 2008. Hybridization between longnose and<br />
alligator gars in captivity, with comments on possibly gar hybridization in nature. Transactions of the<br />
American Fisheries Society 137: 158-164.<br />
Hocutt, C.H. and E.O. Wiley. 1986. The Zoogeography of North American Freshwater Fishes. John<br />
Wiley and Sons, New York.<br />
Holt, R. 1973. Age and growth, length-weight relationship, condition coefficient, and feeding habits of<br />
spotted gar, Lepisosteus oculatus (Winchell), within the Kentucky waters of Kentucky Reservoir.<br />
Masters thesis, Murray <strong>State</strong> <strong>University</strong>, Murray, Kentucky.<br />
Hooper, D.U., F.S. Chapin III, J.J. Ewel, A. Hector, P. Inchausti, S. Lavorel, J.H. Lawton, D.M. Lodge,<br />
M. Loreau, S. Naeem, B. Schmid, H. Setala, A.J. Symstad, J. Vandermeer, and D.A. Wardle. 2005.<br />
Effects of biodiversity on ecosystem functioning: a consensus of current knowledge. Ecological<br />
Monographs 75: 3-35.<br />
Hubbs, C.L., K.F. Lagler, and G.R. Smith. 2004. Fishes of the Great Lakes Region, revised edition. The<br />
<strong>University</strong> of Michigan Press, Ann Arbor, Michigan.<br />
Hurst, T.P. 2007. Causes and consequences of winter mortality in fishes. Journal of Fish Biology 71:<br />
315-345.<br />
Johannesson, K. and C. Andre. 2006. Life on the margin: genetic isolation and diversity loss in a<br />
peripheral marine ecosystem, the Baltic Sea. Molecular Ecology 15: 2013-2029.<br />
Johnson, B.L., and D.B. Noltie. 1996. Migratory dynamics of stream-spawning longnose gar<br />
(Lepisosteus osseus). Ecology of Freshwater Fish 5: 97-107.<br />
Johnson, B.L., and D.B. Noltie. 1997. Demography, growth, and reproductive allocation in streamspawning<br />
longnose gar. Transactions of the American Fisheries Society 126: 438-466.<br />
Jones, B., C.Gliddon, and J.E.G. Good. 2001. The conservation of variation in geographically peripheral<br />
populations: Lloydia serotina (Liliaceae) in Britain. Biological Conservation 101: 147-156.<br />
Kyle, C.J. and C. Strobeck. 2002. Connectivity of peripheral and core populations of North American<br />
wolverines. Journal of Mammalogy 83: 1141-1150.<br />
Kynard, B. 1997. Life history, latitudinal patterns, and status of the shortnose sturgeon, Acipenser<br />
brevirostrum. Environmental Biology of Fishes 48: 319-334.<br />
Lammi, A., P. Siikamaki, and K. Mustajarvi. 2001. Genetic diversity, population size, and fitness in<br />
central and peripheral populations of a rare plant Lychnis viscaria. Conservation Biology 13: 1069-<br />
1078.<br />
Lande, R. 1993. Risks of population extinction from demographic and environmental stochasticity and<br />
random catastrophes. The American Naturalist 142: 911-927.<br />
Lardies, M.A., L.D. Bacigalupe, and F. Bozinovic. 2004. Testing the metabolic cold adaptation<br />
hypothesis: an intraspecific latitudinal comparison in the common wood louse. Evolutionary Ecology<br />
Research 6: 567-578.<br />
Latta, W.C. 2003. Distribution and abundance of Michigan fishes collected 1993-2001. Michigan<br />
Department of Natural Resources, Fisheries Research Report, Ann Arbor.<br />
Lee, H., D. DeAngelis, and H. Koh. 1998. Modeling spatial distribution of the unionid mussels and the<br />
core-satellite hypothesis. Water, Science, and Technology 38: 73-79.<br />
Lesica, P. and F.W. Allendorf. 1995. When are peripheral populations valuable for conservation?<br />
Conservation Biology 9: 753-760.<br />
Love, J.W. 2002. Sexual dimorphism in spotted gar Lepisosteus oculatus from southwestern Louisiana.<br />
American Midland Naturalist 147: 393-399.<br />
270
271<br />
TECHNICAL REPORTS: INVESTIGATIONS 2009–2011<br />
Love, J.W. 2004. Age, growth, and reproduction of spotted gar, Lepisosteus oculatus (Lepisosteidae),<br />
from the Lake Pontchartrain estuary, Louisiana. The Southwestern Naturalist 49: 18-23.<br />
Luck, G.W., G.C. Daily, and P.R. Ehrlich. 2003. Population diversity and ecosystem services. Trends in<br />
Ecology and Evolution 18: 331-336.<br />
Mach, M.E., E.J. Sbrocco, L.A. Hice, T.A. Duffy, D.O. Conover, and P.H. Barber. 2011. Regional<br />
differentiation and post-glacial expansion of the Atlantic silverside, Menidia menidia, an annual fish<br />
with high dispersal potential. Marine Biology 158: 515-530.<br />
Mandrak, N.E. and E.J. Crossman. 1992. Postglacial dispersal of freshwater fishes into Ontario.<br />
Canadian Journal of Zoology 70: 2247-2259.<br />
Marcil, J., D.P. Swain, and J.A. Hutchings. 2006. Genetic and environmental components of phenotypic<br />
variation in body shape among populations of Atlantic cod (Gadus morhua L.). Biological Journal of<br />
the Linnean Society 88: 351-365.<br />
Michigan Department of Natural Resources. 2005. Species of Greatest Conservation Need. Michigan’s<br />
Wildlife Action Plan. Available:<br />
http://www.michigandnr.com/publications/pdfs/huntingwildlifehabitat/wcs/sgcn. (March 2008)<br />
Munch, S.B., M. Mangel, and D.O. Conover. 2003. Quantifying natural selection on body size from<br />
field data: winter mortality in Menidia menidia. Ecology 84: 2168-2177.<br />
National Oceanic and Atmospheric Administration National Climatic Data Center. 2011. U.S. Climate<br />
Normals 1971-2000. Available: http://cdo.ncdc.noaa.gov/cgi-bin/climatenormals/climatenormals.pl.<br />
(February 2011)<br />
Nelson, J. S. 1994. Fishes of the world, 3 rd edition. Wiley, New York.<br />
Netsch, N.F., and A. Witt, Jr. 1962. Contributions to the life history of the longnose gar, (Lepisosteus<br />
osseus) in Missouri. Transactions of the American Fisheries Society 91: 251-262.<br />
Page, L.M., and B.M. Burr. 1991. A Field Guide to Freshwater Fishes. Houghton Mifflin Company,<br />
Boston.<br />
Petchey, O.L., A.L. Downing, G.G. Mittelbach, L. Persson, C.F. Steiner, P.H. Warren, and G. Woodward.<br />
2004. Species loss and structure and functioning of multitrophic aquatic systems. Oikos 104: 467-<br />
478.<br />
Pope, K.L. and G.R. Wilde. 2003. Variation in spotted gar (Lepisosteus oculatus) mass-length<br />
relationships in Texas reservoirs. Texas Journal of Science 55: 43-48.<br />
Power, M. and R.S. McKinley. 1997. Latitudinal variation in lake sturgeon size as related to the thermal<br />
opportunity for growth. Transactions of the American Fisheries Society 126: 549-558.<br />
Redmond, L. C. 1964. Ecology of the spotted gar (Lepisosteus oculatus Winchell) in Southeastern<br />
Missouri. Master's thesis, <strong>University</strong> of Missouri, Columbia, Missouri.<br />
Robertson, C.R., S.C. Zeug, and K.O. Winemiller. 2007. Associations between hydrological<br />
connectivity and resource partitioning among sympatric gar species (Lepisosteidae) in a Texas river<br />
and associated oxbows. Ecology of Freshwater Fish 17: 119-129.<br />
Scarnecchia, D. L. 1992. A reappraisal of gars and bowfins in fishery management. Fisheries 17: 6-12.<br />
Scudder, G.G.E. 1989. The adaptive significance of marginal populations: a general perspective. in:<br />
Proceedings of the national workshop on effects of habitat alteration on salmonid stocks. C.D.<br />
Levings, L.G.Holtby, and M.A. Henderson, editors. Canadian Special Publication of Fisheries and<br />
Aquatic Science 105: 180-185.<br />
Simon, T. P. and R. Wallus.1989. Contributions to the early life histories of gar (Actinopterygii:<br />
Lepisosteidae) in the Ohio and Tennessee River basins with emphasis on larval development.<br />
Transactions of the Kentucky Academy of Science 50:59-71.<br />
Simon, T. P. and E. J. Tyberghein. 1991. Contributions to the early life history of the spotted gar,<br />
Lepisosteus oculatus Winchell, from Hatchet Creek, Alabama. Transactions of the Kentucky<br />
Academy of Science 52:124-131.
TECHNICAL REPORTS: INVESTIGATIONS 2009–2011<br />
Slaughter IV, J.E., R.A. Wright, and D.R. DeVries. 2004. The effects of age-0 body size and the<br />
predictive ability of a largemouth bass bioenergetics model. Transactions of the American Fisheries<br />
Society 133: 279-291.<br />
Slaughter IV, J.E., R.A. Wright, and D.R. DeVries. 2008. Latitudinal influence on first-year growth and<br />
survival of largemouth bass. North American Journal of Fisheries Management 28: 993-1000.<br />
Smith, G.R. 1981. Late Cenozoic freshwater fishes of North America. Annual Reviews of Ecology and<br />
Systematics 12: 163-193.<br />
Snedden, G.A., W.E. Kelso, and D.A. Rutherford. 1999. Diel and seasonal patterns of spotted gar<br />
movement and habitat use in the lower Atchafalaya River Basin, Louisiana. Transactions of the<br />
American Fisheries Society 128: 144-154.<br />
Stearns, S.C. and J.C. Koella. 1986. The evolution of phenotypic plasticity in life-history traits:<br />
predictions of reaction norms for age and size at maturity. Evolution 40: 893-913.<br />
Suttkus, R. D. 1963. Order Lepisostei. In Fishes of the Western Atlantic; Part Three, Soft-rayed fishes.<br />
Yale <strong>University</strong> Memoir Sears Foundation for Marine Research 1, eds. H.B. Bigelow et al., 61-88.<br />
New Haven, Connecticut.<br />
Trautman, M.B. 1981. The Fishes of Ohio, revised edition. Ohio <strong>State</strong> <strong>University</strong> Press, Columbus.<br />
Tyler, J. D. and M. N. Granger. 1984. Notes on the food habits, size, and spawning behavior of spotted<br />
gar in Lake Lawtonka, Oklahoma. Proceedings of the Oklahoma Academy of Sciences 64:8-10.<br />
U.S. Environmental Protection Agency. 2007. Biological Indicators of Watershed Health. Available:<br />
www.epa.gov/bioiweb1/html/fish_indicators.html. (August 2008).<br />
Wiley, E. O. 1976. The phylogeny and biogeography of fossil and recent gars (Actinopterygii:<br />
Lepisosteidae). <strong>University</strong> of Kansas Museum of Natural History Miscellaneous Publication 64:1-<br />
111.<br />
Wisely, S.M., S.W. Buskirk, G.A. Russell, K.B. Aubry, and W.J. Zielinski. 2004. Genetic diversity and<br />
structure of the fisher (Martes pennanti) in a peninsular and peripheral metapopulation. Journal of<br />
Mammalogy 85: 640-648.<br />
Wilson, B.S. and D.E. Cooke. 2004. Latitudinal variation in rates of overwinter mortality in the lizard<br />
Uta stansburiana. Ecology 85: 3406-3417.<br />
Yamahira, K. and D.O. Conover. 2002. Intra- vs. interspecific latitudinal variation in growth: adaptation<br />
to temperature or seasonality? Ecology 83: 1252-1262.<br />
272
273<br />
TECHNICAL REPORTS: INVESTIGATIONS 2009–2011<br />
Table 1. Mean length (cm) and weight (g) at initiation and completion of experiment 1, along with total<br />
growth (Final-Initial), growth rate (cm·day -1 , g·day -1 ), and descriptive statistics for LA and MI<br />
populations of spotted gars (N=30 fish per population). Experimental durations were 62 (LA) and 63<br />
(MI) days.<br />
Population Michigan Louisiana<br />
Mean Variance St Dev Mean Variance St Dev<br />
Initial Length 14.29 3.41 1.85 15.56 2.40 1.55<br />
Final Length 20.06 2.70 1.64 18.24 2.11 1.45<br />
Total Growth 5.77<br />
Growth Rate 0.09<br />
Initial Weight 7.50 9.07 3.01 10.74 10.33 3.21<br />
Final Weight 24.09 46.80 6.84 17.53 16.93 4.12<br />
Total Growth 16.59<br />
2.68<br />
0.04<br />
6.79<br />
Growth Rate 0.26 0.11
TECHNICAL REPORTS: INVESTIGATIONS 2009–2011<br />
Table 2. Mean length (cm) and weight (g) at initiation and completion of experiment 2, along with total<br />
growth (Final-Initial), growth rate (cm·day -1 , g·day -1 ), and descriptive statistics for LA and MI<br />
populations of spotted gars at 3 different temperature treatments (N = 6 fish per population in each<br />
treatment). Experimental duration was 42 days.<br />
Experimental<br />
Temperature (°C)<br />
Michigan Louisiana<br />
Mean<br />
Length<br />
Variance St Dev Mean Variance St Dev<br />
16 Initial Length 21.07 1.05 1.03 19.17 1.59 1.26<br />
Final Length 21.08 0.95 0.97 19.27 1.87 1.37<br />
Total Growth 0.02 0.10<br />
Growth Rate < 0.01 < 0.01<br />
23 Initial Length 20.75 0.67 0.82 19.85 7.30 2.70<br />
Final Length 23.52 1.26 1.12 21.33 7.37 2.72<br />
Total Growth 2.77 1.48<br />
Growth Rate 0.07 0.04<br />
30 Initial Length 22.60 6.86 2.62 20.72 0.90 0.95<br />
Final Length 25.50 2.96 1.72 23.15 1.24 1.11<br />
Total Growth 2.90 2.43<br />
Growth Rate 0.07 0.06<br />
Weight<br />
Mean Variance St Dev Mean Variance St Dev<br />
16 Initial Weight 27.73 22.41 4.73 21.77 24.25 4.92<br />
Final Weight 26.55 18.58 4.31 21.38 25.16 5.02<br />
Total Growth -1.18 -0.38<br />
Growth Rate -0.03 -0.01<br />
23 Initial Weight 24.63 10.61 3.26 23.73 96.48 9.82<br />
Final Weight 37.12 44.87 6.70 30.05 195.19 13.97<br />
Total Growth 12.48 6.32<br />
Growth Rate 0.30 0.15<br />
30 Initial Weight 32.50 134.49 11.60 25.27 20.06 4.48<br />
Final Weight 51.97 108.97 10.44 36.32 41.93 6.48<br />
Total Growth 19.47 11.05<br />
Growth Rate 0.46 0.26<br />
274
275<br />
TECHNICAL REPORTS: INVESTIGATIONS 2009–2011<br />
Figure 1. Distribution of core and peripheral populations of the spotted gar Lepisosteus oculatus. Note<br />
disjunction between populations. Modified from Page and Burr (1991).<br />
Length (cm)<br />
18<br />
16<br />
14<br />
12<br />
10<br />
8<br />
6<br />
4<br />
2<br />
0<br />
y = 0.1526x + 0.9975<br />
R² = 0.9985<br />
y = 0.1387x + 1.1061<br />
R² = 0.994<br />
0 20 40 60 80 100 120<br />
Age (DAH)<br />
Figure 2. Comparison of early life stage length at age (period prior to start of experiment 1) of LA and<br />
MI populations of spotted gars held at 23 ºC (N = 30 fish per population). Larval fish from both<br />
populations hatched at approximately 1.0 cm. Linear regression models (dashed = LA, solid = MI) and<br />
R 2 values were also calculated.<br />
MI<br />
LA
TECHNICAL REPORTS: INVESTIGATIONS 2009–2011<br />
Weight (g)<br />
12<br />
10<br />
8<br />
6<br />
4<br />
2<br />
0<br />
y = 0.4719e 0.0318x<br />
R² = 0.9988<br />
y = 0.4497e 0.028x<br />
R² = 0.9596<br />
0 20 40 60 80 100 120<br />
Figure 3. Comparison of early life stage weight at age (period prior to start of experiment 1) of LA and<br />
MI populations of spotted gars held at 23 ºC (N = 30 fish per population). Larval fish from both<br />
populations hatched at approximately 0.5 g. Exponential regression models (dashed = LA, solid = MI)<br />
and R 2 values were also calculated.<br />
Increase in length (cm)<br />
7.00<br />
6.00<br />
5.00<br />
4.00<br />
3.00<br />
2.00<br />
1.00<br />
Age (DAH)<br />
y = 0.0924x - 9.0734<br />
R² = 0.9988<br />
Figure 4. Increase in length over time for LA and MI populations of spotted gars held at 23 ºC in<br />
experiment 1 (N = 30 fish per population). Linear regression models (dashed = LA, solid = MI) and R 2<br />
values were also calculated.<br />
276<br />
y = 0.0414x - 3.9157<br />
R² = 0.9914<br />
0.00<br />
95 105 115 125 135 145 155 165<br />
Age (DAH)<br />
MI<br />
LA<br />
MI<br />
LA
Increase in weight (g)<br />
18.00<br />
16.00<br />
14.00<br />
12.00<br />
10.00<br />
8.00<br />
6.00<br />
4.00<br />
2.00<br />
y = 0.279x - 28.884<br />
R² = 0.9739<br />
277<br />
TECHNICAL REPORTS: INVESTIGATIONS 2009–2011<br />
y = 0.1035x - 10.063<br />
R² = 0.9809<br />
0.00<br />
95 105 115 125 135 145 155 165<br />
Age (DAH)<br />
Figure 5. Increase in weight over time for LA and MI populations of spotted gars held at 23 ºC in<br />
experiment 1 (N = 30 fish per population). Linear regression models (dashed = LA, solid = MI) and R 2<br />
values were also calculated.<br />
Weight-Length Ratio<br />
1.3<br />
1.2<br />
1.1<br />
1<br />
0.9<br />
0.8<br />
0.7<br />
0.6<br />
0.5<br />
y = 0.0115x - 0.6536<br />
R² = 0.9793<br />
y = 0.0041x + 0.2889<br />
R² = 0.9699<br />
0.4<br />
95 105 115 125 135 145 155 165<br />
Age (DAH)<br />
Figure 6. Mean weight-length ratios over time for LA and MI populations of spotted gars held at 23 ºC<br />
in experiment 1 (N = 30 fish per population). Linear regression models (dashed = LA, solid = MI) and R 2<br />
values were also calculated.<br />
MI<br />
LA<br />
MI<br />
LA
TECHNICAL REPORTS: INVESTIGATIONS 2009–2011<br />
A. 16 °C<br />
Mean Length (cm)<br />
B. 23 °C<br />
Mean Length (cm)<br />
0.05<br />
-0.05<br />
C. 30 °C<br />
Mean Length (cm)<br />
0.2<br />
0.15<br />
0.1<br />
3<br />
2.5<br />
2<br />
1.5<br />
1<br />
0.5<br />
0<br />
4<br />
3<br />
2<br />
1<br />
0<br />
0<br />
0 20 40<br />
Days<br />
0 20 40<br />
Days<br />
0 20 40<br />
Days<br />
Mean Weight (g)<br />
Mean Weight (g)<br />
Mean Weight (g)<br />
Figure 7. Changes in mean length and weight for MI (solid line) and LA (dashed line) populations of<br />
spotted gars at 3 temperature treatments (A = 16 °C, B = 23 °C, C = 30 °C; N = 6 fish per population in<br />
each treatment) in experiment 2 (experimental duration = 42 days).<br />
278<br />
0<br />
-0.5<br />
-1<br />
-1.5<br />
15<br />
10<br />
5<br />
0<br />
25<br />
20<br />
15<br />
10<br />
5<br />
0<br />
0 20<br />
Days<br />
40<br />
0 20 40<br />
Days<br />
0 20 40<br />
Days
B.<br />
Mean daily growth rate (cm/day)<br />
Mean daily growth rate (g/day)<br />
0.09<br />
0.08<br />
0.07<br />
0.06<br />
0.05<br />
0.04<br />
0.03<br />
0.02<br />
0.01<br />
0<br />
-0.01<br />
15 20 25<br />
Experimental temperature (°C)<br />
30<br />
0.6<br />
0.5<br />
0.4<br />
0.3<br />
0.2<br />
0.1<br />
*<br />
0<br />
15 20 25 30<br />
-0.1<br />
Experimental temperature (°C)<br />
*<br />
*<br />
279<br />
TECHNICAL REPORTS: INVESTIGATIONS 2009–2011<br />
Figure 8. Mean daily growth rates for length (A) and weight (B) of LA and MI populations of spotted<br />
gars at three temperature treatments (16 °C, 23 °C, 30 °C; N = 6 fish per population in each treatment) in<br />
experiment 2 (experimental duration = 42 days). Error bars indicate ±1 standard error, * indicates<br />
significant difference between populations at temperature treatment.<br />
*<br />
MI<br />
LA<br />
MI<br />
LA
FINAL REPORTS: INVESTIGATIONS 2009–2011<br />
Developing Hatchery Methods for the Mangrove Oyster, Crassostrea<br />
corteziensis for the Pacific Coast of Mexico<br />
Indigenous Species Development/Study/09IND01UH<br />
Eladio Gaxiola Camacho<br />
Autonomous <strong>University</strong> of Sinaloa<br />
Culiacán, Sinaloa, Mexico<br />
Guillermo Rodriguez Dominguez and Olga Olivia Zamudio Armenta<br />
Autonomous <strong>University</strong> of Sinaloa<br />
Mazatlán, Sinaloa, Mexico<br />
Maria Haws<br />
<strong>University</strong> of Hawai’i at Hilo<br />
Hilo, Hawai’i, USA<br />
John Supan<br />
Louisiana <strong>State</strong> <strong>University</strong><br />
Baton Rouge, Louisiana, USA<br />
Graduate Students:<br />
Luis Javier Álvarez Bajo, Gilberto Hernández Llamas, José Evaristo Varela Valenzuela and Rosalba<br />
Nayely Perea Juárez<br />
Autonomous <strong>University</strong> of Sinaloa<br />
Culiacán, Sinaloa, Mexico<br />
ABSTRACT<br />
Crassotrea corteziensis is an important oyster culture species in the Mexican <strong>State</strong> of Nayarit where it<br />
forms the basis of a thirty-year old industry. This industry is based on spat collection, which has been<br />
primarily successful only in the <strong>State</strong> of Nayarit. This limits its potential for other areas of Pacific<br />
Mexico. This investigation was designed to develop the capacity and methods to reliably produced eyelarvae<br />
in a hatchery based at the School of Marine Sciences (FACIMAR) at the Autonomous <strong>University</strong><br />
of Sinaloa, Mazatlan Campus. This hatchery and associated training and demonstration farm would allow<br />
FACIMAR to conduct research and provide training to a wide range of stakeholders.<br />
Most of the objectives of the investigation were achieved, including development of a successful<br />
microalgae production facility and successful broodstock conditioning system. High mortality of the<br />
larvae occurred due to bacterial and protozoan infections, which prevented production of spat for the<br />
community groups involved in this work. The bacterial infections are believed to be associated with<br />
water pollution in the waters surrounding Mazatlan. Work will continue to improve the water treatment<br />
system at FACIMAR and larviculture will be attempted again in early 2012.<br />
INTRODUCTION<br />
Mexican aquaculture is focused on shrimp culture, although diversification of aquaculture has been<br />
identified as a national development priority. Bivalves offer a multitude of possibilities to diversify<br />
aquaculture if specific obstacles can be addressed. Oyster production is currently stable, producing<br />
280
281<br />
FINAL REPORTS: INVESTIGATIONS 2009–2011<br />
between 40,000 to 50,000 tons annually with the Gulf of Mexico industry based on Crassostrea virginica<br />
representing 90% of this (CONAPESCA 2009).<br />
Oyster production on the Pacific Coast of Mexico depends on two introduced species, the Pacific Oyster<br />
(Crassostrea gigas) and more recently, the Kumamoto Oyster (C. sikamea). Both species readily adapt to<br />
local conditions and grow rapidly. Much of the seed for these species is imported from the United <strong>State</strong>s,<br />
and local seed production has been decreasing due to disease and temperature issues (CIAD 2003; Tapia<br />
et al. 2008). C. gigas also suffers from production issues related to its tendency to become “spawny” or<br />
“thin” during the reproductive and post-reproductive season. Mortalities also occur during the warmer<br />
months and may be related to the “summer mortality” phenomena observed for this species in the Pacific<br />
Northwest of the United <strong>State</strong>s.<br />
C. corteziensis, on the other hand, does not suffer from these issues and has a high level of local<br />
acceptance. It has been cultured primarily in Nayarit <strong>State</strong> for over 30 years but expansion of the industry<br />
locally, and to other areas in Mexico, is hampered by lack of hatchery production. This species has been<br />
produced on a limited scale in a few hatcheries previously, but techniques were considered proprietary<br />
information.<br />
The objectives of this investigation were therefore to develop methods to condition C. corteziensis<br />
broodstock and for hatchery production of eye-larvae. This also included establishing a microalgae<br />
production facility at FACIMAR/UAS and training staff and students in all methods. It was also hoped<br />
that a small demonstration farm could be established in the waters adjacent to the FACIMAR facilities for<br />
research and training. If successful, this would enable FACIMAR staff to produce larvae for research<br />
purposes, and to supply small community-based farms. Training courses and student classes would utilize<br />
these facilities. Methods would also be shared with several stakeholders, including a cooperative shrimp<br />
hatchery, to encourage private sector development of oyster hatcheries.<br />
METHODS<br />
Development of the hatchery<br />
The School of Marine Sciences (FACIMAR) at UAS is an education institution conducting research,<br />
extension and academic training in marine sciences and aquaculture. It is located in Mazatlan, Sinaloa,<br />
Mexico. The facility is adjacent to the main seawall of the city (Figure 1). Three small laboratory<br />
facilities were developed at FACIMAR: 1) hatchery; 2) microalgae production facility; and 3) a<br />
broodstock conditioning system.<br />
Study 1: Evaluation of the adequacy of adjacent water areas for holding oysters.<br />
Juvenile C. corteziensis were obtained from farms and distributed in mesh bags, which were hung on a<br />
long line in the area adjacent to FACIMAR to determine if these conditions were adequate for<br />
conditioning and maintaining broodstock (Figure 2). Growth was monitored for 5 months. Water quality<br />
parameters such as temperature, salinity, pH and turbidity were also monitored for the same period of<br />
time. Bacteriological analysis was also conducted for Vibrio and coliform bacteria in oyster tissues and<br />
water.<br />
Collection and maintenance of oyster broodstock<br />
Approximately 100 adult oysters were collected from different locations and kept in the oyster<br />
conditioning system at FACIMAR. This consisted of recirculation tanks with salinity at 30 ‰ and<br />
temperature at 24 ºC (same as the collection sites). Aeration was also provided. Feed consisted of three<br />
species of microalgae, Isochrysis sp., Tetraselmis sp. and Chaetoceros sp. These were supplied in three<br />
daily rations of 200,000 cells per ml, supplemented with a 0.5 g daily ration of mixed corn starch and rice<br />
flour. The tanks were cleaned before the first feeding of the day and the entire system was cleaned<br />
weekly. Figure 3 shows aspects of the broodstock and microalgae systems.
FINAL REPORTS: INVESTIGATIONS 2009–2011<br />
Figure 1. Location of the School of Marine Sciences (FACIMAR) in Mazatlan, Sinaloa, Mexico. Arrows<br />
indicate the location of the hatchery and oyster holding areas.<br />
Figure 2. Transplanting of oyster broodstock to oyster holding area near FACIMAR (a and b);<br />
students and staff measuring oysters (c and d).<br />
Figure 3. Collecting broodstock (a), recirculation system for holding broodstock (b), microalgae culture<br />
in 20 liter containers (c) and larger batch culture (d).<br />
Microalgae culture<br />
Microalgae cultures were started in test tubes and the volume was scaled up to 20 liters, using standard<br />
algae culture methods. The 20 liter cultures were used to inoculate 900 liter semi-batch culture vessels<br />
(Hoff and Snell 1987) (Figure 3).<br />
282
283<br />
FINAL REPORTS: INVESTIGATIONS 2009–2011<br />
Spawning<br />
Two methods were used for spawning: thermostimulation and strip spawning. The first utilized rapid<br />
temperature changes varying between 18 and 20 ºC, with changes every 30 minutes. When oysters began<br />
to spawn, they were separated into separate containers with clean, filtered seawater. When spawning was<br />
completed, sperm was added to the eggs for fertilization. When broodstock failed to respond to<br />
thermostimulation, these were sacrificed, opened and the gonadal tissue excised using gentle scraping<br />
with a scalpel.<br />
Larviculture<br />
D-stage larvae were transferred into 200 liter tanks filled with filtered seawater at an initial density of 8<br />
larvae per ml. Feed consisted of Chaetoceras sp. (2 million cells/ml/day). Light aeration was also<br />
supplied. Larvae were sieved out every forty-eight hours, the tanks cleaned and the water was exchanged<br />
(Figure 4).<br />
Figure 4. Induction of spawning (e and f); sieving larvae (g and h) and microscopic vie of D-stage larvae<br />
(i).<br />
RESULTS<br />
Evaluation of oyster holding area in adjacent waters<br />
The oyster kept in waters adjacent to FACIMAR showed no significant growth either in length, width or<br />
weight (Figures 5, 6 and 7). Weight was maintained at 12.5 g and length at 4.4 cm over the five month<br />
period. Survival was low at 82% of the initial count after 5 months of holding.<br />
Lenght (cm)<br />
8.0<br />
7.0<br />
6.0<br />
5.0<br />
4.0<br />
3.0<br />
2.0<br />
1.0<br />
may jun jul ago sep<br />
Figure 5. Monthly mean lengths (DVM) for oysters held near FACIMAR.
FINAL REPORTS: INVESTIGATIONS 2009–2011<br />
Weight (g)<br />
22<br />
20<br />
18<br />
16<br />
14<br />
12<br />
10<br />
8<br />
6<br />
4<br />
2<br />
may jun jul ago sep<br />
Figure 6. Monthly mean weights for oysters held near FACIMAR.<br />
Survival %<br />
Figure 7. Monthly survival of oysters held near FACIMAR.<br />
Dissolved oxygen<br />
mg/l<br />
150.0<br />
100.0<br />
7<br />
6<br />
5<br />
4<br />
3<br />
2<br />
1<br />
0<br />
50.0<br />
0.0<br />
may jun jul ago sep<br />
may jun jul ago sep<br />
Figure 8. Dissolved oxygen levels at FACIMAR oyster holding area.<br />
284
285<br />
FINAL REPORTS: INVESTIGATIONS 2009–2011<br />
Figure 9. Mean monthly sea surface temperature at FACIMAR oyster holding area.<br />
Salinity ‰<br />
Temperature °C<br />
36<br />
35<br />
34<br />
33<br />
32<br />
31<br />
30<br />
29<br />
34<br />
32<br />
30<br />
28<br />
26<br />
24<br />
22<br />
20<br />
may jun jul ago sep<br />
may jun jul ago sep<br />
Figure 10. Mean monthly salinities for FACIMAR oyster holding area.<br />
Transparency (m)<br />
2<br />
1.8<br />
1.6<br />
1.4<br />
1.2<br />
1<br />
may jun jul ago sep<br />
Figure 11. Mean monthly turbidity at FACIMAR oyster holding area.
FINAL REPORTS: INVESTIGATIONS 2009–2011<br />
Dissolved oxygen levels were lowest in August (3.7 mg/l) and September (4.5 mg/l) (Figure 8). From<br />
May to July, water temperatures were stable at 25 °C, and then rose in August and September. The<br />
maximum temperature occurred in August (32.9 °C) (Figure 9). Salinity rose from May to June (35.3‰)<br />
then declined to 31.3 ‰ in September (Figure 10). Turbidity had a mean value of 1.5 m during the five<br />
month period (Figure 11).<br />
Vibrios and coliform bacteria in oyster tissues and seawater<br />
Table 1 shows Vibrio values for oyster tissues and the seawater at the FACIMAR holding area. Yellow<br />
colonies were particularly prevalent.<br />
Table 1. Results of Vibrio analysis<br />
Month Sample no.<br />
UFC/ g in oyster<br />
tissues UFC/ml in seawater<br />
Yellow Green Yellow Green<br />
MAY 1 60333 265833 167 0<br />
2 333 0 0 0<br />
JUN 1 0 333 0 0<br />
2 5000 2333 0 0<br />
3 0 0 0 0<br />
JUL 1 333 167 25000 0<br />
2 2167 0 0 0<br />
3 0 0 0 0<br />
AGU 1 167 0 0 0<br />
2 0 0 167 0<br />
3 0 0 1167 0<br />
SEP 1 0 0 0 0<br />
2 52500 0 X X<br />
Table 2 shows results from testing for coliform bacteria (total and fecal) in oyster tissues and seawater.<br />
Most of the higher counts exceed the regulatory standards for acceptable limits (NOM031-SSA1-199) in<br />
shellfish growing areas.<br />
Broodstock conditioning and maintenance<br />
Broodstock conditioning in the recirculation system was successful before and after spawning. The<br />
mixed microalgae diet of 200,000 cells/ml along with a 0.5 g supplement of corn starch and rice flour was<br />
adequate to achieve maturation of gametes. The temperature of 23 °C and 25 ‰ salinity also appeared to<br />
be adequate.<br />
Larviculture<br />
Although larvae were consistently produced using thermostimulation to induce spawning, several<br />
attempts to raise larvae to the setting stage all failed with mass mortalities of larvae observed concurrently<br />
with the appearance of protozoans and other ciliated organisms. Larvae also showed signs of bacterial<br />
infections.<br />
286
Table 2. Total and fecal coliform bacteria in seawater and oyster tissues.<br />
287<br />
FINAL REPORTS: INVESTIGATIONS 2009–2011<br />
Seawater Oyster tissues<br />
NMP/100ml NMP/100 ml NMP/100 g NMP/100 g<br />
Month Sample no. Total Fecal Total Fecal<br />
MAY 1 >2400 15 >2400 0<br />
2 215 20 507 98<br />
JUN 1 >2400 2050 >2400 >2400<br />
2 >2400 45 >2400 0<br />
3 850 >2400 >2400 >2400<br />
JUL 1 70 70 721 298<br />
2 1750 1750 426 315<br />
3 >2400 70 >2400 375<br />
AGU 1 1100 >2400 482 129<br />
2 1750 35 >2400 >2400<br />
3 110 25 >2400 192<br />
SEP 1 >2400 >2400 1345 350<br />
2 X X >2400 >2400<br />
DISCUSSION<br />
The high mortality rate and lack of growth exhibited by the oysters kept at the FACIMAR oyster holding<br />
area demonstrate that this site has inadequate conditions to maintain oysters. Hence, establishment of a<br />
training and research farm at this site is not possible. Given that the temperatures were within the range<br />
considered conducive to the species (21 to 31 °C) and that salinities (31 to 39‰) were also within the<br />
documented tolerances (Gongora Gomez et al. 2006), lack of adequate food may be to blame. C.<br />
corteziensis is an estuarine species and needs a high level of phytoplankton to thrive (Chavez Villalba et<br />
al. 2008). The mean secchi disk reading of 1.5 m suggests that this water has low levels of primary<br />
productivity (Fench et al. 1982; Shapiro et al. 1975).<br />
An additional indication of the poor water quality of the holding area is the high levels of Vibrios and<br />
coliform bacteria. While species level identification was not possible, certain colony colors often indicate<br />
well known groups. In particular, the predominance of yellow colonies of Vibrios are indicative of<br />
species which can harm oysters or affect humans (e.g. V. alginolyticus, V. tubiashii, V. fluvialis). Green<br />
colonies may include V. parahaemolyticus, V. vulnificus, V. damsel and V. mimicus. The first two can be<br />
injurious to humans. Vibriosis in general is well known to be a cause of mass mortalities in bivalve larvae<br />
hatcheries (Caceres-Martinez and Vazquez-Yeomans 2001).<br />
The failure to produce larvae to setting stage is discouraging, but further attempts to improve water<br />
treatment to eliminate bacterial sources of contamination in the source water, as well as to eliminate<br />
contamination of the algae cultures will continue in early 2012. The basic facilities and capacity to<br />
operate a small research hatchery were successfully established during this work. Efforts will also be<br />
made to locate another location for the research and demonstration farm. Four <strong>CRSP</strong>-sponsored students<br />
were also trained as part of this research.
FINAL REPORTS: INVESTIGATIONS 2009–2011<br />
LITERATURE CITED<br />
Cáceres-Martínez, J. y R. Vázquez Yeomans. 2001. Manual de enfermedades de moluscos. Boletín del<br />
Programa Nacional de Sanidad Acuícola y la Red de Diagnóstico. CONAPESCA. Año 4, Volumen 4,<br />
Número 16.<br />
Chavez-Villalba J. A. Hernandez-Ibarra, M. R. Lopez-Tapia, and J. M. Mazon Suastegui, 2008.<br />
Prospective culture of the Cortez oyster Crassostrea corteziensis from northwestern Mexico: growth,<br />
gametogenic activity, and condition index. Journal of Shellfisheries Research Vol. 27, No. 4, 711–<br />
720.<br />
CIAD. 2003. Manual de Buenas Prácticas de Producción Acuícola de Moluscos Bivalvos para la<br />
Inocuidad Alimentaria. Centro de Investigación en Alimentación y Desarrollo. Mazatlán, Sinaloa.<br />
CONAPESCA, 2009. Anuario estadístico de pesca 2009. México, Secretaría de Agricultura, Ganadería,<br />
Pesca y Alimentación (www.sagarpa.gob.mx/conapesca/ index.htm).<br />
French, R. H.; J. J. Cooper y S. Vigg. 1982. Secchi disc relationships. Water Res. Bull., 18: 12 1-123.<br />
Hoff, H. F. y T. W. Snell. 1987. Plankton Culture Manual. 5 th Edition. Florida Aqua Farms, Inc. Dade<br />
City, Florida 162 p.<br />
Tapia Vázquez, O.; H. M. González A.: L. M. Sáenz G. y R. García H. 2008. Manual de en granjas<br />
ostrícolas de San Quintín, Baja California, México. Comité Estatal de Sanidad Acuícola de Baja<br />
California A.C. 36 p.<br />
Wyer M.D., Kay D., Jackson G.F., Dawson H.M., Yeo J. y Tanguy L. 1995. Indicator organism sources<br />
and coastal water quality: a catchment study on the island of Jersey. J. Appl. Bacteriol<br />
Shapiro, J.; J. B. Lundquist & R. E. Carlson. 1975. Involving the public in limnology - an approach to<br />
communication. Verh. Internat. Verein. Limnol., 19: 866-874.<br />
288
289<br />
FINAL REPORTS: INVESTIGATIONS 2009–2011<br />
Sustainable Snakehead Aquaculture Development in the Lower Mekong<br />
River Basin of Cambodia and Vietnam<br />
Indigenous Species Development/Study/09IND02UC<br />
Part 1: Breeding and Weaning of Striped Snakehead (Channa Striata)<br />
in Cambodia<br />
So Nam<br />
Inland Fisheries Research and Development Institute<br />
Phnom Penh, Cambodia<br />
Sam Narith<br />
Freshwater Aquaculture Research and Development Center<br />
Prey Veng Province, Cambodia<br />
Bui Minh Tam and Tran Thi Thanh Hien<br />
Can Tho <strong>University</strong><br />
Can Tho, Vietnam<br />
Robert S. Pomeroy<br />
<strong>University</strong> of Connecticut–Avery Point<br />
Groton, Connecticut, USA<br />
INTRODUCTION<br />
Cambodia aquaculture represents about 10% of the total fisheries production (So Nam & Touch<br />
Bauntheng, 2011), while the Mekong delta in Vietnam nearly 60% (Le Xuan Sinh and Pomeroy, 2009).<br />
They have expanded, diversified and intensified; their contributions to aquatic food production have<br />
increased gradually and potentially. They are highly diverse and consist of a broad spectrum of systems,<br />
practices and operations, ranging from simple backyard small, household pond systems to large-scale,<br />
highly intensive, commercially oriented practices. The annual growth rate of aquaculture production in<br />
Cambodia is approximately 20% for the past decade (2001-2010) (So Nam & Touch Bunthang, 2011).<br />
According to a study conducted in FiA data 3,257 farmers own 16,547 cages representing 52% of the<br />
total production. Most of the freshwater cages are in Kandal (79%) with more than 12,000 cages. Other<br />
provinces around the Tonle Sap Lake and Mekong River have a lower number of cages, between 400 and<br />
600 cages per province: Kampong Cham (4%), Siem Reap (4%), Pursat (3%), Battambang(3%),<br />
Kampong Chhnang (2%). Pangasius (in monoculture or polyculture associated with catfish, Leptobarbus<br />
hoevenii or carps and tilapia) and snakehead are the dominant species accounting for more than 90% of<br />
the cages. There are 40,479 earthen ponds owned by 52,284 farmers in the whole country. Most of the<br />
ponds are in southern part of Cambodia: Takeo province (19,046 ponds), Svay Rieng (9,315 ponds), Prey<br />
Veng (5,398 ponds), and Kampong Speu (3,986 ponds). Other provinces around Tonle Sap Lake have a<br />
lower number of ponds, between 250 and 1,100 ponds per province (So Nam & Srun Lim Song, 2011).<br />
Pangasius, hybrid catfish, snakehead, Chinese and Indian carps, and tilapia are preferably cultured in<br />
earthen ponds. The pond aquaculture production is estimated to about 42%.
FINAL REPORTS: INVESTIGATIONS 2009–2011<br />
In Vietnam, about 4,639 fish cages are operated in four Mekong delta provinces, especially in An Giang<br />
and Dong Thap provinces, while about 17,000 ha of earthen ponds are used for fish culture there (So et al,<br />
2010). The most commonly cultured fish species in the Lower Mekong Basin of Cambodia and Vietnam<br />
are snakehead (Channa micropeltes and C. striata), pangasiid catfish (Pangasianodon hypophthalmus),<br />
hybrid clarias catfish (C. btrachus x C. gariepinus), and giant freshwater prawn (Macrobrachium<br />
rosenbergii). Aquaculture of these carnivorous and omnivorous fish species is highly dependent on inland<br />
fisheries of small-sized fish species for sourcing key dietary nutrient inputs. It is estimated that approx.<br />
50,000 ton of freshwater small-sized fish is used for the above aquaculture development in Cambodia (So<br />
Nam et al., 2005). So Nam et al (2009) has identified approx. 200 small-sized fish species, which were<br />
used as feed for aquaculture development in the Lower Mekong basin of Cambodia and Vietnam.<br />
The striped snakehead Channa striata is an obligatory air breathing fish, which can survive dry season by<br />
burrowing in bottom mud of lakes, canals and swamps as long as skin and air-breathing apparatus remain<br />
moist and subsists on the stored fat. The snakehead inhabits ponds, streams and rivers, preferring stagnant<br />
and muddy water of plains and is found mainly in swamps, but also occurs in the lowland rivers, more<br />
common in relatively deep (1-2 m), still water. The striped snakehead is a voracious carnivore feeding on<br />
fish, frogs, snakes, insects, earthworms, tadpoles and crustaceans. It is a nest-breeding species. The nest is<br />
prepared by the parent fish by clearing an area at the water surface of aquatic and emergent vegetation. It<br />
undertakes lateral migration from the Mekong mainstream or other permanent water bodies, to flooded<br />
areas during the flood season and returns to the permanent water bodies at the onset of the dry season.<br />
The striped snakehead is commonly used for processing into prahoc, mam-ruot, and mam-ca-loc<br />
(varieties of fish paste) in Cambodia and Vietnam. It is very economic important on both cultures and<br />
captures throughout southern and southeastern Asia. The maximal total length published is 100 cm or<br />
maximal weight 3,000 g, but commonly found 60 cm (Vidthayanon 2002; Sokheng et al., 1999; Menon,<br />
1999).<br />
The government of Cambodia put a ban on snakehead farming in May 2005 and the reasons for this was<br />
the potential negative impacts on wild fish populations from wasteful snakehead seed collection and on<br />
other fish species diversity, and also potential negative effects on poor consumer groups from decreased<br />
availability of small-sized/low valued fish (So et al, 2007). After the ban on snakehead culture in<br />
Cambodia, snakeheads have illegally been imported from the neighboring countries, particularly from<br />
Vietnam, to supply high local market demands in Cambodia. Furthermore, the study showed that<br />
freshwater small-sized fish have illegally been exported to Vietnam for feeding the significantly and<br />
commercially developed snakehead aquaculture in Vietnam. The first phase study funded by <strong>AquaFish</strong><br />
<strong>CRSP</strong> revealed that the incentives for choosing snakehead before other fish species by tens of thousands<br />
of fish farmers are strong as it generates more than 10 times higher profits than other fish species (So et<br />
al., 2009). Therefore, the ban does not only result in positive impacts on poor consumer groups from<br />
increased availability of freshwater small-sized fish in Cambodia, but also providing negative effects on<br />
livelihood of tens of thousands of snakehead farmers who depend on this livelihood for generating<br />
household income. In other words, these snakehead fish farmers have lost their important livelihoods and<br />
household income. Moreover, the ban also does not provide positive impacts on snakehead wild stocks as<br />
fishing pressure on wild snakehead using illegal and destructive fishing gears particularly electroshockers<br />
has been increased for the recent years in order to supply local and external markets (So et al.,<br />
2009).<br />
In Vietnam, snakehead fish have been domesticated for almost two decades in the Mekong Delta (So,<br />
2009). Aquaculture of this domesticated snakehead fish has commonly and wisely been practiced, and<br />
recently intensified by using freshwater and marine small-sized fish as direct feed. The snakehead<br />
aquaculture production increased from 30,000 ton in 2009 (Le Xuan Sinh and Do Minh Chung, 2009) to<br />
40,000 ton in 2010 (Le Xuan Sinh, pers. comm., 2011). As a result, environmental issue and outbreak of<br />
290
291<br />
FINAL REPORTS: INVESTIGATIONS 2009–2011<br />
fish disease are the biggest problems, which cause high fish mortality due to poor water quality, and cause<br />
decreased income of hundred thousands of snakehead farmers in the Mekong Delta in Vietnam. As<br />
intensive snakehead aquaculture has been developed, many kinds of pathogens may cause serious<br />
diseases.<br />
Some fish farmers in Cambodia have illegally imported snakehead fingerlings or broodstocks from<br />
Vietnam to continue their livelihood activity. Bringing snakehead seed and broodstocks from Vietnam<br />
may also bring diseases into Cambodia fish farms then into natural water bodies in Cambodia. As a result,<br />
wild snakehead will be infected by diseased farmed snakehead imported from Vietnam. So development<br />
of Cambodian indigenous snakehead broodstocks by domestication breeding and weaning with<br />
formulated diets will contribute positively to socio-economic development of tens of thousands of fish<br />
farmer communities as well as protect natural aquatic ecosystems. At the same time, the development of<br />
indigenous snakeheads for aquaculture in Cambodia must be approached in a responsible manner that<br />
diminishes the chance for negative environmental, technical, and social impacts. Therefore, domestication<br />
breeding and weaning of wild snakehead in Cambodia and study of water quality as well as pathogenic<br />
agents in Vietnam is practical and necessary in order to reopen snakehead aquaculture in Cambodia and to<br />
sustain snakehead aquaculture in Vietnam. Moreover, lessons learnt from Vietnam will be carried over to<br />
Cambodia. The Minister of Ministry of Agriculture, Forestry and Fisheries of Cambodia, in his letter<br />
banning snakehead culture on September 3, 2004, clearly indicated that detailed impact assessment of<br />
snakehead culture, and domesticated snakehead seed and formulated feed for weaning and growing out<br />
snakehead fish are available, the ban will be lifted.<br />
OBJECTIVES<br />
The specific objectives of this investigation are as follows.<br />
1. To domesticate breeding of wild snakehead to address the snakehead banning issue in Cambodia<br />
in order to lift the ban on snakehead culture in Cambodia;<br />
2. To study environment impacts, fish diseases and biosecurity of snakehead farming in Vietnam;<br />
and<br />
3. To provide recommendations for policy and best practices development of snakehead farming.<br />
The objectives 1 and 3 will be achieved by the following studies of Part 1, while the objectives 2 as well<br />
as the objective 3 will be achieved by the studies of Part 2: snakehead fish diseases and water quality<br />
analysis, under the same investigation 09IND02UC.<br />
RESULTS<br />
Study 1: Semi-artificial breeding of the striped snakehead Channa striata<br />
1.1 Introduction<br />
The striped snakehead Channa striata is widely considered an excellent food fish in Asian countries,<br />
especially in the Lower Mekong Basin countries, including Cambodia, Laos, Thailand and Vietnam, and<br />
interest in farming this snakehead is growing. One key constraint to the culture of this species is the ban<br />
on snakehead culture in Cambodia due to lack of hatchery domestication breeding fingerlings as seed<br />
material. The collection of stocking material from the wild is not sustainable. Induced spawning may be a<br />
dependable alternative for obtaining high quality seed material. The mammalian hormone, human<br />
chorionic gonadotropin (HCG) has been used as an inducing agent for ovulation and spawning in<br />
snakeheads by colleagues at Can Tho <strong>University</strong> in Vietnam and initial results have been published in the<br />
<strong>University</strong> journal in Vietnamese language (Nguyen Van Trieu et al., 2005; Nguyen Huan and Duong<br />
Nhut Long, 2008; Bui Minh Tam et al., 2008). The success of induced breeding this species also depends<br />
on the amount of HCG (dose), number of injections and injection period (Bui Minh Tam et al., 2008).<br />
The effects between doses of the inducing agent and the injection period combinations on the spawning
FINAL REPORTS: INVESTIGATIONS 2009–2011<br />
performance of the recipient female have not been carefully studied. Hence, in the present study the<br />
breeding performance and larvae production of Channa striata was investigated at different doses of<br />
HCG, number of injections and the injection period combinations.<br />
1.2 Materials and methods<br />
Training and technology transfer<br />
Before the set up of experimental designs at the Freshwater Aquaculture Research and Development<br />
Center (FARDeC), its researchers have received training on snakehead on breeding, weaning, feeding<br />
strategies and feed formulation techniques (feed formulation based on the optimal diet composition:<br />
protein, lipid, mineral, fiber and energy obtained from the <strong>AquaFish</strong> <strong>CRSP</strong> first phase Investigation<br />
07SFT01UC, and on supplemented information from Samantary and Mohanty, 1997; Arockiaraj et al,<br />
1999) at Aquaculture and Fisheries College of Can Tho <strong>University</strong>, Vietnam. Practical work,<br />
experimental set up and snakehead farms and feed mill visits were also provided to the trainees. After the<br />
training, researchers from Can Tho <strong>University</strong>, Vietnam visited FARDeC, Cambodia to assist the trained<br />
staff to set up breeding and weaning experimental trials, prepare formulated diets and to provide advice<br />
on feeding strategies for the striped snakehead Channa striata.<br />
Broodstock collection and culture<br />
Thirty nine male and forty five female breeders of Channa striata were collected from the natural water<br />
bodies of Tonle Sap Great Lake in Kampong Thom province and stocked in the 300 m 2 earthen pond at<br />
Freshwater Aquaculture Research and Development Center (FARDeC) (Figure 1). The body weight of<br />
the breeders ranged from 650 gram per fish to 800 gram per fish. Low value or small-sized fish were fed<br />
to the fish with a feeding rate of 2% of body weight of fish per day. Broodstock of snakehead was<br />
monthly sampled for checking fish maturation based on the methods of Nikolsky (1963) (Table 1; Table 2<br />
and Table 3). Total length, standard length and body weight distribution of the striped snakehead Channa<br />
striata used as experimental fish were measured and the sex of each specimen recorded in Table 4.<br />
Hormone composition<br />
The hormone used in this study is a commercial preparation of HCG (human chorionic gonadotropin). It<br />
comes as a white, lyophilized crystalline plug containing 5,000 international units (IU) per vial. Each vial<br />
of freeze-dried HCG is supplied with 5 ml of solvent containing phosphate-buffered water. The HCG was<br />
purchased and reconstituted in 1 ml of solvent provided with the pack. That was further diluted with<br />
normal saline solution to get required concentrations of injectable HCG.<br />
Experimental designs<br />
Experiment 1:Three groups of females were injected with 500, 1,000 and 1,500 IU HCG per kg body<br />
weight on day 2 after the last injection of three groups of males with the same dose of 1,500 IU HCG per<br />
body weight (Figure 2; Table 5). Each group of fish comprised three females or three males. The control<br />
group comprising three females and three males received 0.05 ml of solvent. Each pair of HCG treated<br />
fish (1 female: 1male) and control fish were semi-artificially bred in a 2,000-L cement tank where aquatic<br />
plants were applied to make nests for fish to lay/scatter eggs into.<br />
Experiment 2: Three doses 2,500, 3,000 and 3,500 IU HCG per kg body weight were administered to<br />
three groups of tested males, with the tested three groups of tested females receiving a dose of 1,000 IU<br />
HCG (Table 6). All male fish received two injections from each dose for two days, while all female fish<br />
were injected with only one injection on the second day.<br />
Experiment 3: This Experiment was set up similar to Experiment 2, but all tested male fish received three<br />
injections of HCG for three days from each of the three doses 3,000, 3,500 and 4,000 IU HCG per kg<br />
body weight (Table 7). All female fish were injected with only one injection on the third day at a dose of<br />
1,000 IU HCG per body weight.<br />
292
293<br />
FINAL REPORTS: INVESTIGATIONS 2009–2011<br />
Experiment 4: This Experiment was conducted to assess the potency of 3,500 IU HCG per body weight<br />
using larger number of fish than the Experiment 1, 2 and 3. Six trials were conducted, utilizing twelve<br />
male and female fish, receiving 3,500 IU HCG and 1,000 IU HCG per body weight, respectively (Table<br />
8). Control fish were always paired with hormone-treated fish.<br />
All experiments were conducted in twelve (2 x 1 x 1 m) cement tanks for semi-artificial breeding and<br />
twelve (1.2 x 0.8 x 0. 5 m) fiberglass aquaria for egg hatching of the striped snakehead Channa striata<br />
(Figure 3). The physico-chemical parameters of hatchery water viz. temperature, pH, dissolved oxygen<br />
and total alkalinity were 27–29 °C, 6.8–7.5, 5.6–6.9 ppm and 125–132 ppm, respectively during<br />
experimental period. Each female was selected from a pool of broodstocks based on the presence of fullyyolked<br />
oocytes, using canulating method, and each male was selected based on the presence of long<br />
genital. Each female or male was conditioned in their respective cement tank for one day before the<br />
experiment commenced.<br />
Data collection<br />
For the Experiments 1, 2 and 3 the following data were collected, including spawning time (hour),<br />
spawning success (%), egg quantity (eggs/kg body weight), fertilization rate (%), and hatching rate (%) at<br />
the end of each period, while number of normal larvae (no. larvae/kg female) and survival rate of fish<br />
larvae (%) were also counted and recorded in Experiment 4.<br />
Data analysis<br />
The above collected data which are different among treatments of the same experiments were determined<br />
by one way ANOVA, with means separated using Duncan’s Multiple Range test at p = 0.05 using the<br />
Software Program SPSS 11.0.<br />
1.3 Results and Discussions<br />
Broodstock development and maturation<br />
Four stages of gonadal development of Channa striata were obtained in fish sampled as shown in Table 2<br />
and Table 3. The egg diameter varied from 0.2 – 0.71 mm in stage II to 0.96 – 1.62 mm in stage IV (Table<br />
2). All collected fish from Tonle Sap Great Lake reared in the earthen pond at Freshwater Aquaculture<br />
Research and Development Center (FARDeC) were mature. In May 46.7% of males and 60.5% of<br />
females were mature in stage IV, and this maturation rate of males and females increased to 88.8% and<br />
80.8%, respectively in July (Table 3), the highest values that could be considered as the best month for<br />
semi-artificial breeding of the striped snakehead Channa striata.<br />
Sex ratio and length and weight distribution<br />
Out of 84 specimens examined, 39 were males and 45 were females, giving a sex ratio of 1.0: 1.2 (Table<br />
4). The sex ratio showed an insignificant departure from the 1:1 sex ratio (P > 0.05). The mean body<br />
weight of males and females was 801.6 ± 4.9 g and 768.3 ± 10.2 g, which were not significantly different,<br />
while there were significant differences in the lengths between males and females for total length and<br />
standard length (Table 4).<br />
Experiment 1: Evaluation of HCG doses for injecting male and female striped snakehead Channa stirata<br />
on spawning performance and larval hatching during spawning induction: All females injected with<br />
1,000 IU HCG successfully spawned and provided a significantly higher number of eggs per kg body<br />
weight than females injected with 500 IU HCG and 1,500 IU HCG per kg body weight and non treated or<br />
control females (Table 5). There were no significant differences in spawning time (number of hours)<br />
among females injected with HCG doses of 1,000 IU HCG and 1,500 IU HCG per kg body weight, while<br />
these treatments were significantly different from the treatment of females injected with 500 IU HCG per<br />
kg body weight. For the control groups, no females manifested any signs of ovulation or spawning,
FINAL REPORTS: INVESTIGATIONS 2009–2011<br />
probably due to the lack of environment and physiological cues that would trigger final oocyte<br />
maturation. There was no fertilization among all HCG treated and non-treated or control females in this<br />
experiment, probably due to the HCG doses provided to all male fish that would be too low, resulted in<br />
the lack of physiological conditions to trigger the release of sperm.<br />
Experiment 2 Evaluation of HCG doses for two injections for the male striped snakehead Channa stirata<br />
on spawning performance and larval hatching during spawning inductionI: There were no significant<br />
differences in fertilization rate between males treated with 3,000 IU HCG and 3,500 IU HCG per kg body<br />
weight, while male fish treated with a HCG dose of 3,500 IU per kg body weight provided a significant<br />
higher hatching rate than male fish treated with 3,000 IU HCG per kg body weight (Table 6). No<br />
fertilization and hatching was observed when all males treated with 2,500 IU HCG per kg body weight.<br />
Experiment 3 Evaluation of HCG doses for three injections for the male striped snakehead Channa<br />
stirata on spawning performance and larval hatching during spawning induction: All HCG treated fish<br />
successfully spawned and provided no significant differences in spawning time (Table 7). All males<br />
treated with 3,500 IU HCG per kg body weight and females treated with 1,000 per kg body weight<br />
provided a significant higher number of eggs per kg body weight, fertilization rate and hatching rate than<br />
male fish injected with 3,000 IU and 4,000 IU HCG per body weight.<br />
Experiment 4: In this experiment, the difference in spawning success between control and hormonetreated<br />
(1,000 IU HCG per kg body weight for females and 3,500 IU HCG for males) fish groups was<br />
highly significant (Table 8). The average hatching rate was 72.6%, working fecundity (number of normal<br />
larvae per kg female) 21,124 and survival rate of fish larvae after absorbing the yolk on day 3 after hatch<br />
was approx. 72%. These larvae were used for weaning experiments (See below sections).<br />
Therefore, the best spawning performance or success (100%), highest hatching rate (81%) and highest<br />
larval productions or survival rate (72%) for the striped snakehead Channa striata were obtained when<br />
fish were injected with a total dose of 4,500 IU HCG at 27–29 °C, i.e. female fish receiving only one<br />
injection at a dose of 1,000 IU HCG, and male fish receiving 3 injections at a dose of 3,500 IU HCG<br />
within a period of three days or 72 hours. Ovulation or spawning occurred within 9-10 hours.<br />
The report of Nguyen Van Trieu et al. (2005) in Vietnamese language demonstrated that they<br />
administered 2,000 IU HCG per kg body weight to female Channa striata and did not report the<br />
spawning success, but observed 75% hatching rate and 74% survival rate of 3-day old larvae. However,<br />
the lack of information on the selection criteria of breeders prior to injection, it is very difficult to<br />
compare their results with our present findings. Nguyen Huan and Duong Nhut Long (2008) reported in<br />
Vietnamese language that a dose of 1,000 IU HCG is effective for induced spawning in the giant<br />
snakehead Channa micropeltes, while Bui Minh Tam et al. (2008) found doses of 2,000-3,000 IU HCG<br />
per kg male and a dose of 500 IU per kg female to be effective for induced spawning in the giant<br />
snakehead, which are lower than the doses of the present study. The males were injected 2-3 days before<br />
the females, which this injection method is similar to the method of the present study.<br />
Successful spawning induction was also reported by Sahoo et al. (2007) using doses of 3,000-4,000 IU<br />
HCG per kg female at 14-17 h latency. The most effective dose observed from the present study is within<br />
the recommended hormone level for induction of ovulation or spawning in the Nile tilapia (3,500 IU.kg -1 ;<br />
Garcia-Abiado et al., 1994), African catfish (4,000 IU.kg -1 ; Eding et al., 1982), Japanese flounder (2,600-<br />
8,400 IU.kg -1 ; Hirose et al., 1979), silver carp (2,750 IU.kg -1 ; Burlakov and Khachaeva, 1983), rabbitfish<br />
(2,000 IU.kg -1 , Agson, 1991), and snapper (1,000 IU.kg -1 ; Pamkhurst and Carragher, 1992), but greater in<br />
sea bream (400 IU.kg -1 ; Eckstein et al., 1978; Gordon and Zohar, 1978; Zohar and Gordon, 1979), and<br />
grouper (600 IU.kg -1 ; Tseng and Poon, 1983). However, the dose is significantly less than that<br />
recommended by Kuo (1975) for mullet (60,000 IU.kg -1 ).<br />
294
295<br />
FINAL REPORTS: INVESTIGATIONS 2009–2011<br />
Study 2: Weaning wild striped snakehead (Channa striata) using formulated feed<br />
2.1 Introduction<br />
Aquaculture of snakeheads in Cambodia is mainly dependent on freshwater small-sized fish (FSF) for<br />
sourcing key dietary nutrient inputs (So Nam et al., 2009; So Nam et al., 2005), and feeding cost is the<br />
highest cost for the fish farmer. The recent study by So Nam et al. (2009) revealed that more than 200<br />
FSF species, with nearly 50,000 ton (accounting more than 10% of total freshwater fisheries production in<br />
Cambodia; So Nam et al., 2005) are used for aquaculture in Cambodia. Many problems are raised among<br />
many snakehead farms. The main problems are poor quality of FSF and variable nutritional composition<br />
because of inappropriate storage. Risk of disease introduction and outbreaks, environmental pollution and<br />
high feed conversion in snakehead rearing contributed more concerns. Moreover, the growing<br />
competition between human and aquaculture usage of FSF led to increasing its price to the farmer (Le<br />
Xuan Sinh et al, 2009; So Nam et al., 2009; Rachmansyah et al., 2009; So Nam et al., 2007). One key<br />
constraint and challenge to the culture of this species is the ban on snakehead culture by the government<br />
of Cambodia due to the lack of formulated diets (So Nam et al., 2009). To address the above key issues,<br />
Tran Thhi Thu Hien and her colleagues at Can Tho <strong>University</strong> in Vietnam and <strong>University</strong> of Rhode<br />
Island, USA (Tran Thhi Thu Hien Bengtson, 2009) had successfully develop cost-effective and highperforming<br />
compounded feeds under laboratory and on-farm trial conditions that would allow less<br />
reliance on FSF and would have lower environmental impacts, the so called <strong>AquaFish</strong> <strong>CRSP</strong> Snakehead<br />
Formulated Feed (Figure 4). This study, therefore, was designed to wean wild striped snakehead (Channa<br />
striata) using this formulated feed in order to produce fingerlings and first generation broodstrocks (i.e. F1<br />
breeders) at the hatchery of Freshwater Aquaculture Research and Development Center (FARDeC) in<br />
Cambodia.<br />
2.2 Materials and methods<br />
Training and technology transfer<br />
The same as and please see section 1.2.<br />
Experiment 1: Effects of weaning methods using formulated feed for the striped snakehead (Channa<br />
striata) on survival rate, dead rate and cannibalism rate<br />
Experimental fish<br />
Before starting the experiment, all 3-day old larvae after hatch were nursed in 1000-L fiber tanks (Figure<br />
5) and fed with Moina for 7 days, then fed with Moina and freshwater small-sized fish (FSF) for 10 days,<br />
20 days and 30 days to obtain 20 day-old fish, 30 day-old fish and 40 day-old fish, respectively.<br />
Replacement of Moina by FSF was applied gradually at a rate 10%.day -1 until 100% of Moina was<br />
substituted by FSF.<br />
Experimental design<br />
We tested three ages of fish to begin weaning with freshwater small-sized fish gradually replaced by 45%<br />
crude protein formulated feed (Table 9; Tran Thi Thu Hien and Bengtson, 2009) for 30 days: 20 day-old<br />
(20-dof), 30 day-old (30-dof) and 40 day-old (40-dof) fish (Table 10). For 20-dof treatments, the weaning<br />
procedure consisted of 10% of freshwater small-sized fish replaced daily, every two days and every three<br />
days by formulated feed until fish were fed exclusively on formulated feed. Similarly, for the 30-dof and<br />
40-dof treatments, freshwater small-sized fish biomass was replaced by formulated diet at a rate of 10%<br />
per day, per two days and per three day for each treatment. Control treatment, 20-dof fish were fed with<br />
Moina replaced by freshwater small-size fish 20% per day within five consecutive days and then fed with<br />
freshwater small-sized fish until the end of the experiment (Table 10).<br />
Fish were randomly assigned in 30 (2 x 1 x 1 m) hapas placed in 2,000 m 2 ponds, i.e. 10 treatments and 3<br />
replicates per treatment, at a stocking density of 200 fish/hapa or 100 fish/m 2 . The fish were fed to
FINAL REPORTS: INVESTIGATIONS 2009–2011<br />
satiation by hand twice daily at 09:00 h and 16:00. Dead fish and cannibalism were weekly recorded<br />
(Table 11). Water temperature, pH and dissolved oxygen also recorded weekly, ranging from 28.2 – 29.5;<br />
5.4 – 6.7; and 5.7 – 6.9 ppm, respectively. Differences among treatments were determined by one way<br />
ANOVA with means separated using Duncan’s Multiple Range test at p = 0.05 using SPSS 11.0.<br />
Experiment 2: On-station trial on growth-out of the striped snakehead Channa striata fed with freshwater<br />
small-sized fish vs. formulated feed<br />
Experimental fish and designs<br />
Before starting the experiments, all the 30 day-old fish were reared in 10 (5 x 3 x 1.5 m) hapas, placed in<br />
2,000 m 2 ponds, with a stocking density of 100 fish/m 2 and fed with freshwater small-sized fish combined<br />
with 45% crude protein formulated feed (Table 9) for 30 days at the hatchery of Freshwater Aquaculture<br />
Research and Development Center (FARDeC), Cambodia. Replacement of freshwater small-sized fish by<br />
formulated feed was applied gradually at a rate 10% every three days until 100% of freshwater smallsized<br />
fish was substituted by pellet feed, then the fish were fed with formulated or pellet feed till day 30 th<br />
(i.e. the age of the fish was 60 days old).<br />
Experiment 2 was set up by using the above 60 day-old fish of the striped snakehead Channa striata to<br />
evaluate effects of freshwater small-sized fish and 40% crude protein pellet feed on growth performance,<br />
survival rate, feed intake, feed conversion ratio, and abnormal rate, and to develop first generation of<br />
broodstock (F1) for further domestication breeding. Fish were randomly stocked in six (5 x 3 x 1.5 m)<br />
hapas placed in 2,000 m 2 ponds (Figure 6) at a stocking density of 750 fish/hapa, i.e. being three hapas for<br />
fish fed with freshwater small-sized fish and three hapas for fish fed with pellet feed. The fish were fed to<br />
satiation by hand twice daily at 09:00 h and 16:00. Total fish weight in each hapa was determined every<br />
month and dead fish were recorded and weighed for calculating feed conversion ratio (FCR). After<br />
feeding, the remaining feed was weighed daily. Water temperature, pH and dissolved oxygen were<br />
measured biweekly, ranging from 27.9 - 30.5 o C; 5.2 – 6.7; and 5.4 –7.1 ppm, respectively. The<br />
experiment lasted 10 months. Collected data, which were different among treatments, were determined<br />
by one way ANOVA with means separated using Duncan’s Multiple Range test at p = 0.05 using SPSS<br />
11.0.<br />
2.3 Results and Discussions<br />
Experiment 1: Effects of weaning methods using formulated feed for the striped snakehead (Channa<br />
striata) on survival rate, dead rate and cannibalism rate: Survival rates of fish in treatments 20-dof-1, 20dof-2<br />
and 20-dof-3 were significantly lower than those of all other treatments, while these treatments had<br />
significantly higher cannibalism than those of all other treatments (Table 11). This reveals that the age of<br />
these fish is too young to accept formulated feed resulting in significant higher cannibalism (18 – 26%).<br />
Survival rate and cannibalism rate of fish in treatment 30-dof-3 was 75% and 12%, respectively, and were<br />
not significantly different from those of fish in the control treatment (fish fed with Moina and freshwater<br />
small-sized fish) and in treatment 40-dof-3, but significantly higher than those of fish in treatments 30dof-2,<br />
30-dof-2, 20-dof-1, 20-dof-2 and 20-dof-3. Therefore, the fish aging 30 days old can gradually and<br />
successful accept formulated feed in replacement of small-sized fish in the rate of 10% every three days.<br />
Experiment 2: On-station trial on growth-out of the striped snakehead Channa striata fed with freshwater<br />
small-sized fish vs. formulated feed: The final weight of fish fed with freshwater small-sized fish (468 g)<br />
significantly higher than that of fish fed with formulated or pellet feed (314 g) (Table 12), but this figure<br />
is lower than the striped snakehead fed with small-sized fish in the Mekong delta of Vietnam (0.5 -1.1<br />
kg/fish; So Nam, 2009; Le Xuan Sinh and Pomeroy, 2009). Similarly the final weight of the snakehead<br />
fish fed with pellet feed in this study is lower than the fish fed with pellet feed in Dong Thap and An<br />
Giang provinces (467 - 726 g/fish; Tran Thi Thanh Hien and Bengtson, 2011). This higher growth rate in<br />
both cases reflects the longer and successful domestication captive breeding of striped snakehead in the<br />
Mekong Delta of Vietnam. However the survival rate of fish in both treatments was not significantly<br />
296
297<br />
FINAL REPORTS: INVESTIGATIONS 2009–2011<br />
different after a growth-out period of 10 months, although a slightly higher survival rate was found in<br />
treatment of fish fed with freshwater small-sized fish (60%) than that (56%) in treatment of fish fed with<br />
pellet feed. These survival rates are similar to the rates of striped snakehead fed with small-sized fish (45-<br />
60%; So Nam, 2009; Le Xuan Sinh and Pomeroy, 2009) and to the fish fed with pellet feed (56-73%;<br />
Tran Thi Thanh Hien and Bengtson, 2011) in the Mekong Delta of Vietnam. The high mortality rate of<br />
striped snakehead fed with small-sized fish found in the Mekong Delta is caused by parasite infected<br />
diseases (40-50%; Pham Minh Duc et al., 2011; Le Xuan Sinh and Pomeroy, 2009).<br />
Table 13 shows that FI and FCR were significantly higher in treatment of fish fed with freshwater smallsized<br />
fish (3.9 g.fish-1.day -1 and 4.2, respectively) than in treatment of fish fed with pellet feed (1.25<br />
g.fish-1.day -1 and 1.68, respectively), but no significant differences were seen in PER. It is likely that the<br />
significant reductions in FI and FCR were due to different moisture levels in the diets that the fish<br />
received, since the moisture of freshwater small-sized fish is 72.7 %, whereas formulated feed is 9.38%<br />
(Tran Thi Thu Hien and Bengtson, 2009). The treatment of fish fed with pellet feed (17.4%) had a<br />
significantly higher abnormal rate than the treatment of fish fed with freshwater small-sized fish. The<br />
FCR of striped snakehead fed with small-sized fish in the Mekong Delta of Vietnam (3.7 - 4.5; Tran Thi<br />
Thanh Hien and Bengtson, 2011; Le Xuan Sinh and Pomeroy, 2009) is similar to the FCR in this study,<br />
while the FCR of fish fed with pellet feed in this study is higher than the that of fish fed with pellet feed<br />
in the Mekong Delta of Vietnam (1.3 - 1.6).<br />
In this study, the poorer growth rate of fish fed with pellet feed compared with fish fed with freshwater<br />
small-sized fish, probably due to that the experimental fish used originate from the wild breeders, which<br />
have been collected from Tonle Sap Great Lake and first time brought into the hatchery of FARDeC for<br />
induced spawning. In order words, the experimental fish used in this study are wild fish, while the<br />
experimental fish of the same species used in the study of Tran Thi Thu Hien and Bengtson (2009) at Can<br />
Tho <strong>University</strong>, Vietnam have been successfully domestication induced spawning for nearly two decades<br />
at hatcheries in Vietnam. Similarly, the study conducted by colleagues at Can Tho <strong>University</strong> showed that<br />
the growth rate and survival rate of the giant snakehead Channa micropeltes fed with formulated feed is<br />
significantly lower or poorer than the fish fed with small-sized or low value fish in Vietnam (Tran Thi<br />
Thu Hien, pers. comm., 2011), probably due to that the giant snakehead have been just recently<br />
domestication breeding for nearly 5 years.<br />
The striped snakehead Channa striata is an obligatory air breathing and a carnivorous fish species. In this<br />
study, although they were weaned from freshwater small-sized fish to formulated feed, live food is still<br />
their favorite feed. The diet containing no freshwater small-sized fish reduced attraction of fish to feed<br />
(Tran Thi Thu Hien and Bengtson, 2009). Utilization of commercial pellet feed nowadays is more<br />
popular, especially for carnivorous fish in order to reduce the dependence on small-sized fish or low value<br />
fish, feeding cost and environmental impact. Several studies on replacing of small-sized fish or low value<br />
fish by formulated feed in several species achieved better growth rate and more profit, such as this species<br />
(Tran Thi Thu Hien and Bengtson, 2009); tiger grouper, Epinephelus fuscoguttatus (Rachmansyah et al.,<br />
2009); Japanese sea bass, Lateolabrax japonicus and red drum, Sciaenops ocellata (Cremer et al., 2001);<br />
Sea bass, Lates calcarifer (Aquacop et al., 1989). Cremer et al. (2001) replaced small-sized fish or low<br />
value fish with formulated diets in cage culture of red drum (Sciaenops ocellata) (172g/fish in initial<br />
weight) and Japanese sea bass Lateolabrax japonicus) (74g/fish) and concluded that fish consuming<br />
formulated diet (43% crude protein, 12% lipid) with 35% soybean meal showed better growth and less<br />
feeding cost than fish fed with small-sized fish.<br />
In this study, Channa striata showed a high cannibalism in pellet feed treatments. Lower survival rate<br />
may be related to snakehead behavior. Conversely, Hung et al. (1999) reported that Pangasius bocourti<br />
had a low cannibalism even in the artificial feeding treatment. Simply providing formulated feeds led to<br />
cannibalism in Channa striata in a previous study (Qin et al., 1996). In fishes, cannibalism is usually
FINAL REPORTS: INVESTIGATIONS 2009–2011<br />
associated with heterogeneous size variation, lack of food, high density, lack of refuge area and light<br />
condition. Among these variables, size variation and unsuitable food are considered the primary causes of<br />
cannibalism (Tran Thi Thu Hien and Bengtson, 2009).<br />
CONCLUSIONS<br />
The present investigation demonstrated that the wild striped snakehead Channa striata broodstocks can<br />
successfully be developed, mature and semi-artificially induced spawning using HCG at doses of 1,000<br />
IU.kg -1 for female fish and 3,500 IU.kg -1 for male fish at the hatchery of Freshwater Aquaculture<br />
Research and Development Center (FARDeC), Cambodia. The male fish receive 2-3 injections within 2-3<br />
days before the female fish, which is received only 1 injection. With this optimal HCG doses, the<br />
spawning success is 100%; spawning time after the last injection of female and male fish is 9 hours;<br />
number of eggs spawned per kg female is 32,000; the fertilization rate is 87%; hatching rate is 73%; and<br />
the larval production and survival rate is 21,000 larvae per kg female and 72%, respectively.<br />
The striped snakehead Channa straita aging 30 days old after hatch can gradually and successful accept<br />
formulated feed in replacement of small-sized fish in the rate of 10% every three days for a period of 30<br />
days of feeding, and then be successfully grown out with a complete 40% crude protein pellet feed for a<br />
period of ten months to achieve a final weight of 314 g.fish -1 , a survival rate of 56%, and a FCR of 1.68.<br />
The F1 broodstocks which can accept formulated or pellet feed are available for future domestication<br />
breeding and weaning at FARDeC, Cambodia. This has very important implications for protecting<br />
freshwater small-sized fish, which are usually fed to snakehead.<br />
RECOMMENDATIONS<br />
The following recommendations should be carefully considered for policy and action plan development in<br />
order to lift the ban on snakehead and achieve sustainable development snakehead aquaculture in<br />
Cambodia:<br />
To collect from different natural water bodies over the country and develop sufficient numbers of<br />
Channa striata broodstcoks at hatcheries in Cambodia in order to conduct R & D on breeding and<br />
weaning techniques to produce high quality fish seed for sustainable snakehead aquaculture<br />
development;<br />
To biologically characterize the snakehead Channa striata from different populations within<br />
Cambodia freshwater bodies (i.e. Tonle Sap Great Lake, upper and lower stretch of Mekong<br />
River and Bassac River, their associated floodplains) for determining good or favorable traits for<br />
aquaculture development;<br />
To assess genetic diversity and populations of snakehead collected from different locations within<br />
Cambodia for maintaining diversity of wild stocks and overall conservation of this species, and<br />
for enhancing the diversity of snakehead breeders when conducting domestication/breeding<br />
program for this fish;<br />
To domesticate breeding of wild snakehead to address the snakehead banning issue in Cambodia<br />
in order to lift the ban on snakehead culture in Cambodia;<br />
To develop practical formulated diets for broodstock, nursery and grow-out culture of snakehead<br />
to replace small-sized fish from captured fisheries;<br />
To evaluate the growth performance of snakehead in different culture systems by using practical<br />
formulated diets; and<br />
Provide extension services to snakehead farmers regarding technologies of snakehead breeding,<br />
weaning and growth-out using formulated diets; and<br />
298
299<br />
FINAL REPORTS: INVESTIGATIONS 2009–2011<br />
To encourage the involvement of public and private sectors and development partners to invest on<br />
the value chain of snakehead aquaculture development, especially the private sector to formulate<br />
and improve commercially manufactured feed for snakehead aquaculture; it can be better<br />
integrated into local economy with less import of ingredient, and be market at a lower price.<br />
ACKNOWLEDGEMENTS<br />
This study was funded by <strong>AquaFish</strong> <strong>CRSP</strong>. We thank the Cambodia's Fisheries Administration and Tonle<br />
Sap Fisheries Conservation Center for field support and collaboration. We thank colleagues, field<br />
researchers and graduate and under graduate students of Inland Fisheries Research and Development<br />
Institute (IFReDI) in Phnom Penh for conducting snakehead breeding and weaning experiments at<br />
Freshwater Aquaculture Research and Development Center (FARDeC), and College of Aquaculture and<br />
Fisheries Can Tho <strong>University</strong> in Vietnam for providing trainings on snakehead breeding and weaning and<br />
their kind cooperation.<br />
REFERENCES<br />
Agson FC (1991). Induced spawning of rabbitfish Signus guttatus (Bloch) using human chorionic<br />
gonadotrophin (HCG). Aquaculture 95: 133-137.<br />
Aquacop, G. Cuzon, R. Chou and J. Fuchs, 1989. Nutrition of the Seabass (Lates calcarifer). Advances in<br />
tropical aquaculture Tahiti. 9: 757-763.<br />
Arockiaraj, A.J., M. Muruganandam, K. Marimuthu and M.A. Haniffa. 1999. Utilization of carbohydrates<br />
as a dietary energy source by striped murrel, Channa striatus (Bloch) fingerlings. Acta Zool.Taiwan<br />
10: 103-111.<br />
Bui Minh Tam, Nguyen Thanh Phuong and Duong Nhut Long (2008). Effects of HCG dosages and<br />
injection methods on semi-artificial propagation of giant snakehead (Channa micropeltes).<br />
Aquaculture and Fisheries College, Can Tho <strong>University</strong>, Vietnam (Tap chi Khao hoc 2008 (2): 76:81)<br />
Cremer, M.C., Z. Jian and H.P. Lan, 2001. Cage Production of Japanese Sea bass Weaned From Trash<br />
Fish to Extruded Feed at Sub-Market Size. Results of ASA/China Feeding Trial 35-01-128.<br />
Eckstein BM, Abraham BM and Zohar Y (1978). Production of steroid hormones by male and female<br />
gonads of Sparus aurata (Teleost, Sparidae). Comparative Biochemistry and Physiology 60B:93-97<br />
Eding EH, Jansen JAL, Klein GHJ and Ritcher CJJ (1982). Effects of human chorionic gonadotrophin<br />
(HCG) on maturation and ovulation of oocytes in the catfish Clarias lazera (C &V). Proceedings of<br />
the internation symposium of rpeorduction and physiological fisheries, Pudoc, Wageningen, the<br />
Netherlands: 195.<br />
Gacia-Abiado MAR, Pascual LP and Mair GC (1994). Use of Human Chorionic Gonadotropin (hCG) for<br />
Induced Spawning in Tilapia Under Laboratory Conditions. Asian Fisheries Science 7: 225-231<br />
Gordin H and Zohar Y (1978). Induce spawning of Sparus aurata L. by means of hormonal treatments.<br />
Annals de Biologie Biophyisque 18 (4):985-990.<br />
Hirose K, Machida Y and Donaldson EM (1979). Induced ovulation of Japanese flounder (Limauda<br />
yokohamae) with human chorionic gonadotrophin (HCG) and salmon gonadotrophin, with special<br />
references to changes in quality of eegs retained in the ovarian cavity after ovulation. Bulletin-<br />
Japanese Society of Scientific Fisheries 45 (1): 31-36<br />
Hung, L.T., B.M. Tam, P.Cacot and J.Lazard, 1999. Larval rearing of the Mekong catfish, Pangasius<br />
bocourti (Pangasidae, Siluroidei): Substitution of Artemia nauplii with live and artificial feed.<br />
Aquatic Living Resource, 12(3):229-232<br />
Kuo CM (1975). Recent progress on the control of ovarian developmentand induced spawning of the grey<br />
mullet (Mugil cephalus L.). Aquaculture 5: 19-29.<br />
Kurlakov AB and Khachaeva EV (1983). Oocyte maturation in silver carp, Hypopthalichthys molitirx<br />
(Cyprinidae) and in vitro effect of estrogens, androgens and gestogens in relation to in vivo sensitivity<br />
to human chorionic gonadotrophin (HCG). Journal of Ichthyology 23 94): 124-132.
FINAL REPORTS: INVESTIGATIONS 2009–2011<br />
Lê Xuân Sinh và Đỗ Minh Chung. 2009. Hiện trạng và những thách thức cho nghề nuôi cá lóc (Channa<br />
micropeltes và Channa striatus) ở ĐBSCL. Báo cáo trình bày tại Hội thảo kết thúc giai đoạn 1 – Dự<br />
án Cá Tạp - Khoa Thủy sản - ĐHCT, 8-12/20<br />
Le Xuan Sinh and Pomeroy (2009). Competition And Impacts Between Uses Of Low Value Fish For<br />
Aquaculture Feed Versus Uses For Human Food In The Lower Mekong Basin Of Cambodia &<br />
Vietnam. Final Technical Report of <strong>AquaFish</strong> <strong>CRSP</strong> USAID Grant No.: EPP-A-00-06-00012-00. Can<br />
Tho <strong>University</strong>, Vietnam and <strong>University</strong> of Connecticut, USA.<br />
Menon, A.G.K. 1999 Check list - fresh water fishes of India. Rec. Zool. Surv. India, Misc. Publ., Occas.<br />
Pap. No. 175, 366 p.<br />
Nguyen Huan and Duong Nhut Long (2008). The hatchery status and technical aspects for snakehead<br />
spawning (Channa micropeltes). Aquaculture and Fisheries College, Can Tho <strong>University</strong>, Vietnam<br />
(Tap chi Khao hoc 2008 (2): 20:28)<br />
Nguyen Van Trieu, Duong Nhut Long, Le Son Trang (2005). Seed production technology of Snakehead<br />
Fish (Channa striatus Bloch). Aquaculture and Fisheries College, Can Tho <strong>University</strong>, Vietnam<br />
Nikolsky GV (1963). The ecology of fishes. Academic Press. London and New York. p. 352.<br />
Pankhurst NW and CarragherJF (1992). Oocyte maturation and changes in plasma steroid levels in<br />
snapper Pagrus (=Chrysophrys) auratus (Sparidae) following treatment with human chorionic<br />
gonadotrophin (HCG). Aquaculture 101:337-347.<br />
Qin, J., A.W.F., 1996. Size and feed dependent cannibalism with juvenile snakehead Channa striatus.<br />
Aquculture 4, 313-320.<br />
Rachmansyah, U., Palinggi, N.N. and Williams, K., 2009. Formulated feed for tiger grouper grow-out,<br />
AquacultureAsia Magazine, pp. 30-35.<br />
S K Sahoo, S S Giri, S Chandra, A K Sahu (2007). Spawning performance and egg quality of Asian<br />
catfish Clarias batrachus (Linn .) at various doses of human chorionic gonadotropin ( HCG )<br />
injection and latency periods during spawning induction. Aquaculture, 266: 289-292<br />
Samantaray, K. and S.S. Mohanty (1997). Interactions of dietary levels of protein and energy on<br />
fingerling snakehead, Channa striata. Aquaculture 156: 245-253.<br />
So Nam & Touch Bunthang (2011). Fisheries Resources in Cambodia: Implications for Food Security,<br />
Human Nutrition and Conversation. International Conference on Asian Food Security (ICAFS2011) -<br />
- “Feeding Asia in the 21st Century: Building Urban – Rural Alliances”, 10-12 August 2011 at the<br />
Grand Copthorne Hotel, Singapore.<br />
So Nam (2009). Snakehead culture in the Mekong Delta of Vietnam. Trip Report of <strong>AquaFish</strong> <strong>CRSP</strong><br />
USAID Grant No.: EPP-A-00-06-00012-00. Inland Fisheries Research and Development Institute,<br />
Phnom Penh.<br />
So Nam and Haing L (2007). Assessment of Freshwater Fish Seed Resources in Cambodia. In: MG<br />
Bondad-Reantaso (ed.): FAO Fisheries Technical Paper No. 501: Assessment of Freshwater fish seed<br />
resources for sustainable aquaculture pp. 145-170.<br />
So Nam and Srun Lim Song (2011). Fisheries Management and Development in Tonle Sap Great Lake,<br />
Cambodia. Paper presented at Consultation Workshop On Development Trends In Fisheries And<br />
Aquaculture In Asian Lakes And Reservoirs, September, 2011 at Institute of Hydrobiology, Chinese<br />
Academy of Sciences, Wuhan, PR China.<br />
So Nam, Eng Tong, Souen Norng and Kent Hortle (2005). Use of freshwater low value fish for<br />
aquaculture development in the Cambodia's Mekong basin. Consultancy report for Mekong River<br />
Commission – Assessment of Mekong Capture Fisheries Project. Inland Fisheries Research and<br />
Development Institute, Department of Fisheries, Phnom Penh, Cambodia.<br />
So Nam, Leng Sy Vann, Prum Somany, Le Xuan Sinh, and Pomeroy Robert (2009). Assessment Of<br />
Diversity And Bioecological Characteristics Of Low Value/Small-Sized Fish In The Lower Mekong<br />
River Basin Of Cambodia And Vietnam. Final Technical Report of <strong>AquaFish</strong> <strong>CRSP</strong> USAID Grant<br />
No.: EPP-A-00-06-00012-00. Inland Fisheries Research Development Institute, Phnom Penh and<br />
<strong>University</strong> of Connecticut, USA.<br />
300
301<br />
FINAL REPORTS: INVESTIGATIONS 2009–2011<br />
Sokheng, C., C.K. Chhea, S. Viravong, K. Bouakhamvongsa, U. Suntornratana, N. Yoorong, N.T. Tung,<br />
T.Q. Bao, A.F. Poulsen and J.V. Jørgensen 1999 Fish migrations and spawning habits in the Mekong<br />
mainstream: a survey using local knowledge (basin-wide). Assessment of Mekong fisheries: Fish<br />
Migrations and Spawning and the Impact of Water Management Project (AMFC). AMFP Report<br />
2/99. Vientiane, Lao, P.D.R.<br />
Tran Thi Thanh Hien and Bengtson D (2011). Alternative Feeds for Freshwater Aquaculture Species.<br />
Final Technical Report of <strong>AquaFish</strong> <strong>CRSP</strong> USAID Grant No.: EPP-A-00-06-00012-00. Can Though<br />
<strong>University</strong>, Vietnam and <strong>University</strong> of Rhode Island, USA.<br />
Tran Thi Thanh Hien and Bengtson D (2009). Alternative Feeds for Freshwater Aquaculture Species.<br />
Final Technical Report of USAID Grant No.: EPP-A-00-06-00012-00. Can Though <strong>University</strong>,<br />
Vietnam and <strong>University</strong> of Rhode Island, USA.<br />
Tseng WY and Poon CT (1983). Hybridization of Epinephalus species. Aquaculture 34: 177-182.<br />
Vidthayanon, C. 2002 Peat swamp fishes of Thailand. Office of Environmental Policy and Planning,<br />
Bangkok, Thailand, 136<br />
Zohar Y and Gordin H (1979). Spawning kenetics in gillhead seabream Sparus aurata L., after low doses<br />
of human chorionic gonadotrophin (HCG). Journal of Fish Biology 15: 665:670.
FINAL REPORTS: INVESTIGATIONS 2009–2011<br />
LIST OF FIGURES<br />
Figure 1. <strong>AquaFish</strong> <strong>CRSP</strong> earthen pond of wild striped snakehead breeders (Channa striata) collected<br />
from the Tonle Sap Great Lake at the FARDeC hatchery, Cambodia<br />
Figure 2 Conditioning and HCG injection of tested male and female breeders of the striped snakehead<br />
Channa striata<br />
302
303<br />
FINAL REPORTS: INVESTIGATIONS 2009–2011<br />
Figure 3 Breeding cement tanks (2 x 1 x 1 m), with aquatic plants for the striped snakehead Channa<br />
striata scatter their eggs into<br />
Figure 4 <strong>AquaFish</strong> <strong>CRSP</strong> snakehead formulated feed by College of Aquaculture and Fisheries, Can Tho<br />
<strong>University</strong>, Vietnam
FINAL REPORTS: INVESTIGATIONS 2009–2011<br />
Figure 5 Fiber tanks used for nursing larvae of the striped snakehead Channa striata at FARDeC<br />
hatchery, Cambodia<br />
Figure 6 Hapas used for growing out striped snakehead (Channa striata) fed with formulated feed at<br />
FARDeC, Cambodia<br />
304
LIST OF TABLES<br />
Table 1 Stages of gonad development classified by Nikolsky (1963)<br />
305<br />
FINAL REPORTS: INVESTIGATIONS 2009–2011<br />
Variable Stage Gonad development<br />
Immaturity I Young individuals which have not yet engaged in reproduction. Gonads<br />
of very small size.<br />
Resting<br />
II Sexual products have not yet begun to develop. Gonads of very small<br />
eggs not distinguished to the naked eyes.<br />
Maturation III Eggs distinguishable to the naked eyes. A very rapid increase in weight<br />
of the gonad in progress, testes changes from transparent to a pale rose<br />
color.<br />
Maturity IV Sexual product, ripe gonads have achieved their maximum weights but<br />
the sexual products are not still extruded when light pressure is applied.<br />
Reproduction V Sexual products are extruded in responses to very light pressure on the<br />
belly. Weight of the gonads decreases rapidly from the start of spawning<br />
to its completion.<br />
Spent VI The sexual products have been discharged, genital aperture is inflamed,<br />
gonads have appearance of a deflated sac and ovaries usually containing<br />
a few left over eggs and the testes contain residual sperm.<br />
Table 2 Four stages of gonad development of the striped snakehead Channa striata<br />
Variable Stage Egg diameter (mm) Gonad development<br />
Immaturity I Slightly granular Slightly granular, transparent with clear nucleus.<br />
Resting II 0.20 – 0.71 Clearly granular, not visible nucleus, some spherical shape<br />
and opaque.<br />
Maturation III 0.72 – 0.95 Spherical, yellow in color with oil globules and large ova<br />
translucent.<br />
Maturity IV 0.96 – 1.62 Spherical, golden yellow, translucent with oil globules.<br />
Table 3 Monthly maturation rate of gonad development stages of the male and female striped snakehead<br />
Channa striata<br />
Month Stage I (%) Stage II (%) Stage III (%) Stage IV (%) Stage V (%)<br />
Male Female Male Female Male Female Male Female Male Female<br />
March 3.4 7.9 20.2 15.3 76.4 53.3 0.0 23.5<br />
April 2.6 5.5 9.7 81.2 42.9 13.3 44.8<br />
May 2.1 3.6 51.2 35.9 46.7 60.5<br />
June 35.7 27.5 64.3 72.5<br />
July 11.2 19.2 88.8 80.8<br />
August 60.5 63.5 39.5 36.5
FINAL REPORTS: INVESTIGATIONS 2009–2011<br />
Table 4 Total length, standard length and body weight distribution of the striped snakehead Channa<br />
striata used as experimental fish<br />
Parameter Sex Number Range Mean<br />
Total length (cm) Male 39 45.9 – 55.3 46.8 ± 3.2 a<br />
Female 45 41.4 – 60.1 42.6 ± 2.7 b<br />
Standard length (cm) Male 39 42.3 – 49.7 43.2 ± 2.5 a<br />
Female 45 38.6 – 52.5 39.8 ± 1.3 b<br />
Body weight (g) Male 39 692.4 – 855.4 801.6 ± 4.9 a<br />
Female 45 625.7 – 785.7 768.3 ± 10.2 a<br />
Table 5 Evaluation of HCG doses for injecting male and female striped snakehead Channa stirata on<br />
spawning performance and larval hatching during spawning induction<br />
Description Dose of HCG (IU) per kg body weight<br />
Control Male Female<br />
0 1,500 500 1,000 1,500<br />
Day 1 0 500 0 0 0<br />
Day 2 0 1000 500 1000 1500<br />
Spawning time (h) 1 - 15.8 ± 2.2 a 10.5 ± 0.8 b 8.6 ± 2.6 b<br />
Spawning success (%) 2 0 33.3 100.0 66.7<br />
Egg quantity (eggs/kg) 0 5,198 ± 688 a 22,115 ± 1019 b 15,939 ± 1251 c<br />
Fertilization rate (%) 0 0 0 0<br />
Hatching rate (%) 0 0 0 0<br />
Data are means of three observations ± SE. Means in the same row with different superscripts are significantly different<br />
(P
307<br />
FINAL REPORTS: INVESTIGATIONS 2009–2011<br />
Table 7 Evaluation of HCG doses for three injections for the male striped snakehead Channa stirata on<br />
spawning performance and larval hatching during spawning induction<br />
Description Dose of HCG (IU) per kg body weight<br />
Female Male<br />
1,000 3,000 3,500 4,000<br />
Day 1 0 500 500 500<br />
Day 2 0 1,000 1,000 1,000<br />
Day 3 1,000 1500 2,000 2,500<br />
Spawning time (h) 1 12.3 ± 0.4 a 10.1 ± 0.9 a 8.3 ± 2.7 a<br />
Spawning success (%) 2 100.0 100.0 100.0<br />
Egg quantity (eggs/kg) 22,835 ± 2,407 a 33,088 ± 2,971 b 17,985 ± 1,911 c<br />
Fertilization rate (%) 81.2 ± 1.9 a 93.6 ± 2.2 b 49.2 ± 5.3 c<br />
Hatching rate (%) 65.4 ± 2.7 a 79.8 ± 3.7 b 40.9 ± 4.4 c<br />
Data are means of three observations ± SE. Means in the same row with different superscripts are significantly different<br />
(P
FINAL REPORTS: INVESTIGATIONS 2009–2011<br />
Table 9 The formulation of formulated feed (45% crude protein and 4.5 gross energy per g) for<br />
the striped snakehead Channa striata developed by Tran Thi Thu Hien and Bengtson (2009)<br />
Ingredient Ratio (%)<br />
Fish meal 32.7<br />
Soy bean meal 31.8<br />
Rice bran 20.0<br />
Cassava meal 7.12<br />
Vitamin 1.00<br />
Mineral 1.00<br />
Fish oil 3.32<br />
Binder 0.29<br />
Lysine 0.44<br />
Methionine 0.28<br />
Threonine 0.40<br />
Fish solution attractant 1.5<br />
Phytase 0.02<br />
Total 100.00<br />
Table 10 Experimental designs for replacing freshwater small-sized fish by 10% formulated feed fed to<br />
three ages of experimental fish for every day, every two days and every three days: 20 days, 30 days and<br />
40 days old fish (20-dof-1, 2, 3; 30-dof-1, 2, 3 and 40-dof-1, 2, 3)<br />
Treatment Feed Fish age (day) Replacement ratio<br />
Control Moina + FSF 20 20% FSF every day<br />
20-dof-1 FSF + formulated feed 20 10% formulated feed per day<br />
20-dof-2 FSF + formulated feed 20 10% formulated feed every two days<br />
20-dof-3 FSF + formulated feed 20 10% formulated feed every three days<br />
30-dof-1 FSF + formulated feed 30 10% formulated feed per day<br />
30-dof-2 FSF + formulated feed 30 10% formulated feed every two days<br />
30-dof-3 FSF + formulated feed 30 10% formulated feed every three days<br />
40-dof-1 FSF + formulated feed 40 10% formulated feed per day<br />
40-dof-2 FSF + formulated feed 40 10% formulated feed every two days<br />
40-dof-3 FSF + formulated feed 40 10% formulated feed every three days<br />
FSF: Freshwater small-sized fish<br />
Table 11 Survival rate, dead rate and cannibalism rate of three different ages of striped snakehead<br />
(Channa striata) gradually fed with formulated feed<br />
Treatment Survival rate (%) Dead rate (%) Cannibalism rate (%)<br />
Control 85.6 ± 4.2 a 9.6 ± 3.2 a 4.8 ± 4.5 a<br />
20-dof-1 36.2 ± 6.3 bc 45.9 ± 6.8 b 17.9 ±10.1 bc<br />
20-dof-2 38.9 ± 3.7 c 40.4 ± 8.5 bc 20.7 ± 7.6 bc<br />
20-dof-3 41.1 ± 15.3 c 33.1 ± 11.2 c 25.8 ± 5.1 c<br />
30-dof-1 68.9 ± 6.9 d 21.7 ± 6.3 d 9.4 ± 15.3 d<br />
30-dof-2 62.2 ± 9.6 d 17.4 ± 10.2 d 20.4± 3.3 d<br />
30-dof-3 74.6 ± 7.1 ae 13.3 ± 2.1 ae 12.1 ± 2.9 ae<br />
40-dof-1 63.9 ± 9.4 e 29.7 ± 15.5 be 6.4 ± 5.1 e<br />
40-dof-2 80.4 ± 5.4 ae 14.7 ± 13.9 ae 4.9 ± 4.4 e<br />
40-dof-3 82.5 ± 2.3 ae 8.1 ± 2.8 ae 9.4 ± 3.9 ae<br />
Data are means of three observations ± SE. Means in the same column with the same superscript are not significantly different<br />
(P
309<br />
FINAL REPORTS: INVESTIGATIONS 2009–2011<br />
Table 12 Total body weight gain (g.fish -1 ), daily weight gain (g.fish-1.day -1 ) and survival rate (%) of<br />
Channa striata in treatments where freshwater small-sized fish and formulated feed applied<br />
Feed Initial Final weight Total weight Daily weight Survival<br />
weight<br />
gain<br />
gain<br />
rate<br />
Freshwater small sized fish 9.8 ± 0.05 a 467.9 ± 92.8 a 458.1 ± 92.6 a 1.5 ± 0.3 a 60.2 ± 8.1 a<br />
Pellet feed 9.7 ± 0.17 a 313.5 ± 110.4b 303.8 ± 110.2 b 1.0 ± 0.4 b 55.9 ± 12.3 a<br />
Data are means of three observations ± SE. Means in the same column with the same superscript are not significantly different<br />
(P
FINAL REPORTS: INVESTIGATIONS 2009–2011<br />
Part 2: Striped Snakehead Fish Diseases and Water Quality Analysis<br />
INTRODUCTION<br />
Pham Minh Duc and Tran Thi Thanh Hien<br />
Can Tho <strong>University</strong><br />
Can Tho, Vietnam<br />
So Nam<br />
Inland Fisheries Research and Development Institute<br />
Phnom Penh, Cambodia<br />
Robert S. Pomeroy<br />
<strong>University</strong> of Connecticut – Avery Point<br />
Groton, Connecticut, USA<br />
In the recent years, aquaculture played an economically important strength in Mekong Delta. Catfish,<br />
snakehead fish and freshwater prawn contributed in increasing of freshwater aquaculture production. Of<br />
which, snakehead was an important species in culture in Mekong Delta (Nguyen Van Thuong, 2004).<br />
There are some popular culture systems, including of pond culture, hapa culture, cage culture and nylon<br />
tank (Le Xuan Sinh and Do Minh Chung, 2010). Collecting information of provinces in Mekong Delta<br />
showed that the snakehead production in region was about 30,000 tons, of which Channa micropelte was<br />
7,500 tons (2009). However, the farmers in Mekong Delta attended to small scale systems and<br />
spontaneous systems (Le Xuan Sinh and Do Minh Chung, 2010). There are 4 species of Chanidae in<br />
Mekong Delta, comprising of Channa gachua, Channa lucius, Channa striata, Channa micropelte.<br />
Channa striata and Channa micropelte are main cultured species in Mekong Delta now.<br />
Intensive culture in snakehead connected to increasing in culture stocking density. This result in<br />
ordinarily out-breaks of diseases in aquatic animals which is quite disadvantageous for aquaculture<br />
activity. Some disease agents affecting to snakehead was recorded, including of bacteria, parasites and<br />
fungi that influenced to farmer’s income.<br />
Objectives of this study are to define disease agents infecting cultured striped snakehead (Channa<br />
striata), and to study water quality in snakehead culture ponds. These results will provide the basic<br />
information of disease and water quality problems of snakehead culture.<br />
To achieve these objectives, the following studies were conducted: (1) assessment of water quality in<br />
snakehead culture ponds in An Giang, Dong Thap and Can Tho provinces; (2) study on status of<br />
snakehead farming in Dong Thap province; (3) isolation and identification of pathogens, which are<br />
parasites, fungi and bacteria infecting fingerling and grown-out snakehead in An Giang and Dong Thap<br />
provinces; and (4) pathogenicity of fungi and bacteria isolated from fingerling snakehead.<br />
RESULTS<br />
Study 1: Assesment of water quality in snakehead culture ponds<br />
1.1 Introdution<br />
Water quality plays an important role in aquaculture activities because of all activities of aquatic animals<br />
were under the water. The degree of intensive culture in aquaculture well developed with higher culture<br />
stocking density, more feeding and chemicals utilization. These affect water quality, namely some water<br />
quality parameters in culture ponds. Rich-nutrition factor in the water impacts the balance in the<br />
relationship between the host, pathogens and environment in a cultured pond. This stimulates for higher<br />
310
311<br />
FINAL REPORTS: INVESTIGATIONS 2009–2011<br />
sensitivity in host to the pathogens then diseases outbreaks. Moreover, the cultured snakehead in Mekong<br />
Delta were fed with small-sized fish, which affects indirectlty to the fish health. Besides, using more<br />
chemicals to prevent and treat diseased fish was and are popular that results in reducing the water quality.<br />
However, study on snakehead culture pond’s conditions was not considered. Therefore, present study was<br />
carried out to asses the water quality in cultured snakehead ponds in An Giang and Dong Thap provinces<br />
and to provide the basic information on changing of water quality parameters during culture period,<br />
especially in the dry and wet seasons.<br />
1.2 Methodology<br />
The study was conducted in snakehead culture ponds in Long Xuyen and Chau Thanh district (An Giang<br />
province) and Lap Vo and Tam Nong district (Dong thap province) and Co Do district (Can Tho city)<br />
from February to August, 2010. Some water quality factors, comprising of pH, DO, N-NH4 + , N-NO2ˉ, N-<br />
NO3ˉ was collected once for month at 8:00-9:00 am in 6 months (Table 1, Table 2 and Table 3).<br />
Temperature was measure by thermometer in sampling point. The other factors were sampled by<br />
preresentative samples, which were collected at 5 sampling points, mixed and sampled. Samples were<br />
frozen by Horiba D-58 machine (manufactured by Japan).<br />
1.3 Results<br />
The results of water quality factors surveyed in An Giang, Dong Thap and Can Tho was illustrated in<br />
Table 1, Table 2 and Table 3. The average temperature of snakehead cultured ponds fluctuated from 28.3<br />
to 32.7 o C, from 26.7 to 32.5 o C and from 28.05 to 28.8 o C in An Giang, Dong Thap and Can Tho,<br />
respectively. Two main reasons for the small variation of temperature in cultured ponds were the water<br />
deep (2.5-4.0 m) and the water exchange time of these ponds (2-4 times/day). Therefore, oscillate<br />
amplitude of pond water was less than water temperature in the inlet drainage.<br />
The pH value of snakehead cultured ponds varied from 7.25 to 8.75 which was similar to the value<br />
reported by Truong Quoc Phu (2006) that the suitable pH value for fish culture is 6.5–9. The average pH<br />
value of cultured ponds in An Giang province flutuated from 7.25-7.81, Dong Thap province from 7.33-<br />
7.80 and Can Tho city from 8.18-8.75. The pH value highly fluctuated in the third sampling month of<br />
snakehead culture, which constituted 7.25 in An Giang and 7.32 in Dong Thap and the fourth sampling<br />
month which was 7.95 in An Giang and 7.63 in Dong Thap. This was explained that fish in the ponds in<br />
this period were infected by parasites and bacteria, and pond water were exhanged more time to decrease<br />
the organic matter, which was from intensive feeding, and reduce pathogent infections; this resulted in<br />
low density of phytoplankton in the ponds. Farmers limed the pond’s bank making the pH value in the<br />
pond higher than in the inlet drainage with 6.93-7.49 in An Giang and 7.06-7.11 and Dong Thap<br />
provinces.<br />
N-NH4 + concentration in snakehead culture ponds fluctuated from 1.25 to 1.95 ppm. This value was in<br />
suitable value for fish growth (0.2-2 ppm) (Boyd, 1990). In sampling period, the first sampling was<br />
lowest value of N-NH4 + and gradually increased in continuous months. However, the fluctuation of N-<br />
NH4 + content was higher than the end of culture period because of more water exchange time. The<br />
unequal content of N-NH4 + in culture ponds and inlet drainage was recorded, 1.25-1.84 ppm compared to<br />
0.04-0.41 ppm in An Giang province, 1.28-1.95 ppm compared to 0.03-0.08 ppm in Dong Thap province<br />
and 1.54-1.59 ppm compared to 0.09-1.62 ppm in Can Tho city.<br />
N-NO2 - concentration in culture ponds in An Giang province was 0.066-0.329 ppm, Dong Thap province<br />
0.040-0.209 ppm and Can Tho city 0.03-0.08 ppm. Boyd (1990) recommended the concentration of N-<br />
NO2 - for fish culture should be lower than 1 ppm. This is concluded that N-NO2 - concentration in<br />
snakehead culture ponds is optimal. Similarily, N-NH4 - concentration was higher in snakehead ponds<br />
compared to inlet drainage in An Giang and Dong Thap provinces, while in Can Tho N-NH4 -<br />
concentration was higher in inlet drainage than in the snakehead ponds.
FINAL REPORTS: INVESTIGATIONS 2009–2011<br />
N-NO3 - concentration in sampling ponds was gradually reduced in the end of culture period. N-NO3 -<br />
concentration in inlet drainage in An Giang (0.033-0.163 ppm), Dong Thap (0.072-0.224 ppm) and Can<br />
Tho (0.06-0.07 ppm) was recorded and considerably lower than the concentration in culure ponds in An<br />
Giang (0.434–1.735 ppm), Dong Thap (0.266–1.229 ppm) and Can Tho (0.04-0.53 ppm).<br />
In conclusion, the temperature variation in snakehead culture ponds in An Giang and Dong Thap<br />
provinces was low. N-NH4 + and N-NO2 - concentration gradually increased in the end of culture period,<br />
while N-NO3 - concentration gradually decreased. The sudden fluctuation of water quality, espectively in<br />
the second, third and fourth culture months affected snakehead culture health. However, in Can tho city,<br />
all water quality parameters increased for the whole culture period.<br />
Study 2: Study on diseases in striped snakehead (Channa striata)<br />
2.1 Introduction<br />
Disease problems in aquaculture are essensially considered, espectively in intensive more popular culture<br />
systems. The development of culture area and diversification of cultured species that incurred the<br />
concerns on seed quality, feed supply, custody skills and management in fish health. In culture condition,<br />
diseases ordinarily occur in conditions of high denisity and rich nutrition, which both affect the balance<br />
between fish and pathogens and fish will be more sensitive to pathogens (Bui Quang Te, 2006).<br />
Snakehead with Channa striata and Channa micropelte were cultured popularly in Mekong Delta with<br />
many kinds of systems such as pond culture, hapas culture and cage culture. In recent years, studies on<br />
snakehead was carried out by Le Xuan Sinh and Do Minh Chung, 2009; Nguyen Thi Diep Thuy, 2010;<br />
and Sarowar et al., 2010. These studies were provided the data on general information of snakehead<br />
culture systems as well as information of disease problems that occurred in cultured snakehead. Basing on<br />
the previous studies, some pathogens were confirmed infecting snakehead, comprising of parasites, fungi<br />
and bacteria. The prevalence infection of each pathogen was different and based on the culture conditions.<br />
However, a specific study on the pathogens that infecting to snakehead in two provinces of An Giang and<br />
Dong Thap was not carried out. Therefore, this study was conducted to determine the sorts of pathogen<br />
infecting to snakehead in rearing and culturing conditions.<br />
2.1 Methodology<br />
2.1.1 Investigation on status of snakehead farming in Dong Thap province<br />
The investigation was carried out from February to May, 2011 in Tam Nong district, Dong Thap<br />
province.<br />
Methods of secondary data collecting: secondary data were collected from the reports of local agencies<br />
and sectors consisted of Fisheries Stations of Tam Nong (Dong Thap provine), Department of Fisheries<br />
Resources Management of Dong Thap province, newspapers and magazines of aquaculture, websites of<br />
aquaculture and relating aquaculture documentations.<br />
Methods of primarily data collecting: primarily data were recorded by directly interviews with 20 farmers<br />
in Dong Thap province using questionnare with information on farmer’s information, culture skills,<br />
custody and fish health management and status of diseases out breaks.<br />
2.1.2 Study on parasites infecting reared and cultured snakehead fish<br />
The study on parasites infecting reared and cultured snakehead fish was performed from 02-05/2011 and<br />
02-08/2010, respectively, in An Giang and Dong Thap. Parasites were identified basing on morphology<br />
that was described by Ha Ky and Bui Quang Te (2007). Moreover, the prevalence of parasite infection<br />
and infection intensity of parasites were calculated basing on Dogiel (1960) (cited by Nguyen Thi Thu<br />
Hang et al., 2008)<br />
312
313<br />
FINAL REPORTS: INVESTIGATIONS 2009–2011<br />
Methods of identification of ectoparasites: wet smear of muscus in skin and fin and examined under<br />
microscope with X 200 magnification. When parasites were observed the camera was used to take<br />
pictures and to identify.<br />
Methods of identification of indoparasites: fish were operated and segrerated internal organs (intestine<br />
and stomach) successively. Wet smear was used and observed under microscope. Parasites presented in<br />
the smear, photographs were taken and parasites were identified and classified.<br />
2.1.3 Study on fungi infecting reared and cultured snakehead fish<br />
Study samples were collected from 03-04/2011 (reared fish) and from 02-08/2010 (cultured fish) in An<br />
Giang and Dong Thap provinces. Samples were isolated and identified in the Department of Aquatic<br />
Biology and Pathology, College of Aquaculture and Fisheries, Can Tho <strong>University</strong>.<br />
Wet mount observation: fish apparent was observed by naked eyes with cotton-like in fish skin; wet<br />
mount observation was carried out based on Gam et al. (1980) and Hatai et al. (2000). Wet mount<br />
preparation was described by cutting a small specimen with a drop of cotton-blue stain in the slide and<br />
observing under a light microscope in magnification of x200 or x400 to define the existence of hyphae or<br />
conidia.<br />
Isolation: wet mount observation with existence of fungi, fish samples was performed to isolate fungi.<br />
The procedure was illustrated by steps: 2 mm diameter of specimen was washed 3 times in sterile<br />
physiological saline; and sample was inoculated on GYA (1% glucose, 0.25% yeast-extract and 1.5%<br />
agar). Ampicilin and streptomycin were added with 500g/ml for each to the medium to inhibit bacterial<br />
growth. Plates were incubated at 25-30 º C for 1-4 days and subcultured into fresh GYA plates in 3 times to<br />
have pured fungal isolates (Hatai et al., 2000).<br />
Identification: fungi were identified based on Coker (1923), Johnson (1956), Scott (1961) and Seymour<br />
(1970) (for lower fungi) and de Hoog et al. (2000) (for higher fungi) with morphological characteristics.<br />
2.1.4 Study on bacteria infecting reared and cultured snakehead fish<br />
Fish samples were collected in culture ponds in An Giang and Dong Thap provinces from February to<br />
August, 2010. Samples were isolated and identified at the Department of Aquatic Biology and Pathology,<br />
College of Aquaculture and Fisheries, Can Tho <strong>University</strong>.<br />
Isolation: fish were killed and weighted. Observation by naked eyes and disease syndromes were<br />
recorded. Fish were cleaned by alcohol (70%) and then samples were taken by incision in the infectinous<br />
area or internal organs (liver, kidney, spleen) with sterile incision knife. Samples were taken by sterile<br />
loop and culture on the TSA medium plates. Plates were incubated at 28°C for 24-48 hours. Recoding<br />
coloni colour, shape and subculture were performed until pure culture plates.<br />
Identification: bacterial strains were identified acording to methods of Barrow and Feltham (1993) and<br />
test kit API 20E, manufactured by BIO MÉRIEUX company, was used to identify based on<br />
morphological and biochemical characteristics.<br />
2.1.5 Pathogenicity<br />
a. Pathogenicity to snakehead of Achlya sp. VN1101<br />
Experimental fish: snakehead (10 g/fish) were collected in reared pond in Can Tho. 50 fish were<br />
acclimatized in fibreglass tanks for one week before experiment started at the College of Aquaculture and<br />
Fisheries, Can Tho <strong>University</strong> in April, 2011. Fish were fed with commercial feed to satisfaction.
FINAL REPORTS: INVESTIGATIONS 2009–2011<br />
Fungal preparation: isolate of Achlya sp. VN1101 was isolated in diseased snakehead fingerling in<br />
clinical sign of cotton-like in the fish body. Fungal specimen of Achlya sp. VN1101 was cultured in GY<br />
broth (1% glucose, 0,25% yeast-extract) at 28 o C in 2-3 days, rinsed 3 times in sterile tap water and placed<br />
in 25 ml of sterile tap water in 18 hours. The spore suspensions were filtered throught two layers of sterile<br />
medical gauze to obtain spore suspension without hyphae. The number of spore was defined by counting<br />
in a haemocytometer and adjusted to 5x10 5 (high dose) and 2.5x10 3 (low dose) spores/ml.<br />
Pathogenicity test: the experiment included 3 treatments which were 1 control treatment (1 replicate) and<br />
2 experimental treatment (2 replicates). Plastic tanks was used with 10 individuals and 20 L of fresh water<br />
for each. Fish were directly inoculated into the left dorsal trunk muscle under dorsal fin of 0.1 ml of spore<br />
suspension in experiment group and 0.1 ml sterile distilled water in control group. The challenged fish<br />
were fed by commercial feed daily two times. Challenged fish were observed twice a day and noted the<br />
disease symptom and mortality. Re-isolation and re-identification were carried out in diseased fish<br />
observed.<br />
b. Pathogenicity to snakehead of Aeromonas hydrophila<br />
Experimental fish: snakehead (20±5.0 g/fish) were collected in reared pond in Can Tho. 180 fish were<br />
acclimatized in fibreglass tanks (250 L) one week before experiment started at the College of Aquaculture<br />
and Fisheries, Can Tho <strong>University</strong> in May, 2011. Fish were fed with commercial feed to satiation.<br />
Bacterial preparation: Aeromonas hydrophila CĐ1012 was isolated from diseased snakehead fish with<br />
separation and hemorrhage in the fish body in Co Do district, Can Tho city. Bacterial strain was cultured<br />
in agar plates at 28 o C in 24h, centrifuged in 3 times and suspended in sterile physiological saline (0.85%<br />
NaCl). Ten-fold dilution method was used to adjust the bacterial suspension with desired dilution. The<br />
concentrations of bacteria were 3.67x10 4 , 3.67x10 5 , 3.67x10 6 , 3.67x10 7 CFU/ml which was used to form<br />
the challenge test.<br />
Pathogenicity test: the challenge test comprised 6 treatments corresponding to 1 negative control test, 1<br />
possitive control test and 4 concentrations of bacterial suspension. 15 fish were introduced into each tank.<br />
Each treatment composed 2 replicates and was randomly set. Each fish was injected with 0.1 ml of<br />
bacterial suspension in the peritoneum in experiement group and 0.1 ml sterile sanility in positive control<br />
treatment and without injection to negative control treatment. Fish were not fed during the experiment<br />
period of 14 days. Fish activity and mortality were noted. Lethargic fish were sampled, re-isolated and reidentified<br />
by traditional method and PCR technique.<br />
2.2 Results and discussions<br />
2.2.1 Investigation on status of snakehead farming in Dong Thap province<br />
Culture system: snakehead culture systems in Dong Thap province were well developed (Fig. 1). Hapa<br />
system with different sizes placed in eathern ponds was effective system because of being easy in manage<br />
of water quality and feeding. Almost ponds had feed tray for holding feed for snakehead to catch.<br />
Snakehead feed was commonly small-sized fish.<br />
Age and education level of snakehead farm owners: the average age of owners was 44.7±9,12 years old.<br />
The minimum and maximum age of the owners was 26 and 60 years old, respectively. The age of 40-60<br />
years old contributed to 70% and under 40 year old was remaining. Education level of owners was<br />
primary (60%), secondary (20%) and senior high school (20%).<br />
Experiences and culture skill improvement: the results of the investigation showed the average number of<br />
years farmers spent for culturing snakehead was 9±4,4, and the farmers having shortest experience was 4<br />
years and longest experience was 20 years. Although, difficulties in culture commonly happened by the<br />
water pollution and diseases outbreaks. The owners improved culture skills based on the former’s<br />
314
315<br />
FINAL REPORTS: INVESTIGATIONS 2009–2011<br />
experiences and attending additional trainings provided by provincial fisheries officers, which constituted<br />
50% of total farmers.<br />
Water quality management: 75% of owners used test kit for testing key water quality parameters and 25%<br />
was sensory. Water exchange in culture ponds was carried out directly from rivers without any treatment.<br />
This maybe cause difficulty in control of fish disease outbreaks.<br />
Status of diseases in snakehead fingerling: some common disease outbreaks in snakehead fingerling<br />
were illustrated in Fig. 2. Parasites infecting the fish was recorded in a very high proportion of 70%.<br />
Parasite infection in culture fish usually occured in the period of April to October. Moreover, fungal<br />
infection leading to 30-50% fish mortlity occurred from August to November annually. Futhermore,<br />
bacterial infection regconized from April to August, which resulted in 15-40% mortality. White spot in<br />
fish liver has just recorded, and was harmful to culture fish, causing high mortality. Treatment of such<br />
disease was difficult and farmers lost their production and income. The common methods used for<br />
treatment of diseased fish was water exchange and chemicals utilization such as sulfate copper (CuSO4)<br />
used for parasite infection disease and iodine for fungal infection disease.<br />
2.2.2 Study on parasites infecting reared and cultured snakehead fish<br />
a. snakehead fingerlings in nursery ponds<br />
Total of 142 samples were identified for parasite infection on snakehead fingerlings. The results showed<br />
that 8 parasite genera, of which 5 ectoparasite genera and 3 indoparasite genera, were identified and<br />
classified from snakehead fingerlings.<br />
Ectoparasites<br />
Ectoparasites infecting snakehead fingerlings included Trichodina, Epistylis, Chilodonella, Dactylogyrus,<br />
Trianchoratus (Fig. 2). The main infected organs were fish skin and gills.<br />
Trichodina: microscopic observation was demonstrated Trichodina was classified with saucer-shaped,<br />
adhesive disc concave with denticulate ring (Fig. 2A), similar to the description of Shwani et al. (2010).<br />
The prevalence infection and infection intensity of Trichodina were 93.7% and ++, respectively.<br />
Trichodina probably damage snakehead fingerling. These findings agree with Ha Ky and Bui Quang Te<br />
(2007) results of the prevalence infection and infection intensity of Trichodina, with 90-100% and 50-100<br />
individuals/len.<br />
Epistylis: morphology of Epistilis was observed with bell-shaped, oral disc and collar and a stalk;<br />
Epistilis branch from parasitic area (Fig. 2B). The prevelance of infection with Epistylis was 71.8% and<br />
infection intensity was ++; in this situation, Epistilis migh affect snakehead fingerlings. However,<br />
Epistilis ordinarily estimated as an indicator organism to assess water quality (Nguyen Thi Thu Hang et<br />
al., 2008). Therefore, the presence of Epistilis in culture conditions should be linked to poor water quality<br />
of snakehead ponds.<br />
Henneguya: Henneguya was observed in the wet smear which was described as ellipsoidal shape, a polar<br />
capsule and a tail (Fig. 2C). Henneguya was also recorded by Azevedo and Matos (1996). The prevelance<br />
of infection was 3.52%, being lower than the rate rported by Azevedo and Matos (1996) in Hoplias<br />
malabaricus (6.7%) and the infection intensity was low (+), probably not affecting snakehead fingerlings.<br />
Chilodonella: Chilodonella is a oval to foliate shape. The body has ciliary band in the ventral right side<br />
(Fig. 2D). Morphological characteristics of Chilodonella was illustrated by Reda (2011). The prevelance<br />
of Chilodonella in snakehead fingerling was 13.4% and intensity of infection was low (+). Therefore<br />
Chilodonella did not affect snakehead fingerlings and cause fish mortality and was not harmful to fish<br />
health.
FINAL REPORTS: INVESTIGATIONS 2009–2011<br />
Trianchoratus: the body is tube-shaped, eyespots and adhesive disc which included of 7 pairs of margin<br />
hooks and 2 pairs of central hooks (Fig. 2E). Trianchoratus was noted as a parasite in snakehead in<br />
Thailand with infection prevelannce was 40% and intensity was 13 (Theerawoot, 2008), showing a higher<br />
infection rate than this study (5.63%) and lower infection intensity (+).<br />
Gyrodactylus: there is a similarity in morphological characteristics between Trianchoratus and<br />
Gyrodactylus, but no eyespot is found in Gyrodactylus. Adhesive disc has 2 ventral hooks and 16<br />
marginal hooks (Fig. 2F). The prevalence of infection was 12.7% and intensity was 4 individuals/slide.<br />
Based on the prevalence and intensity, Gyrodactylus was probably non-affective to snakehead fingerlings.<br />
Indoparasites<br />
Indoparasites were identified in snakehead fingerlings, comprising of 5 genera with Proteocephalus,<br />
Spinitectus, Pallisentis (Fig. 3). Indoparasites parasite on fish intestine and stomach.<br />
Spinitectus: Spinitectus colonize in fish stomach. The body is cylindrical, bifurcate distal tip of spicule,<br />
of which 16-26 spines for each and the number of spicule increasingly in body endian. Spinitectus body<br />
was observed with tapering posterior end (Fig. 3C). The prevalence of Spinitectus was 19% and intensity<br />
was 15 individuals/stomach. Higher infection prevalence (63.8%) and lower intensity (1 individual/<br />
stomach) was report in knife-fish by Bui Quang Te (2001).<br />
Pallisentis: Pallisentis parasite in fish intestine. Pallisentis body is cylindrical, vermiform, with a knoblike<br />
anterior and a tapering posterior end. The anterior portion includes proboscis, comprising of 4 circles<br />
of hook with 10 hooks in each circle. This was also described by Farooqi (1958) in freshwater eel. The<br />
prevalence of Pallisentis detected from snakehead fingerlings was 16.9% and intensity was 2-11<br />
individuals/intestine.<br />
Proteocephalus: Proteocephalus was found in fish intestine. The body is cylindrical, aspinose with 4<br />
suckers and lot of smaller hooks surrounding apical disc (Fig. 3B). Proteocephalus was also regnonized<br />
in Sinocyclocheilus grahami by Pin (1997). The prevalence and intensity of Proteocephalus detected from<br />
snakehead fingerlings was 3,52% and 5 individuals/slide, respectively.<br />
b. Cultured snakehead in grow-out ponds<br />
Total of 296 samples of grown-out snakehead were collected. The results showed that 23 parasite genera<br />
were detected (Table 4). Infested area was different in different parasites which were demonstrated in<br />
Table 5. The present study was noted the prevalence infection and intensity infection of parasites in<br />
grown-out snakehead were considerably high. Gyrodactylus infested with highest prevalence infection of<br />
72.6% and intensity of 13 indiciduals/slide on fish skin. However, Lamproglena infested with lowest<br />
prevalence and intensity of 0.7% and 2 individuals/slide, respectively. Parasite infection was noted in<br />
correlating to bacterial infection in ordinarily. In conclusion, parasites was a secondary pathogen that<br />
infested to grown-out snakehead.<br />
Protozoa infested to grown-out snakehead included of Myxobolus, Trichodina, Chilodonella, Epistylis,<br />
Tripartiella, Apiosoma, Henneguya. Genus of protozoa colonized on fish skin and gills. Infection was<br />
usually recorded in the early months of cultured period. These parasites were also reported by Bui Quang<br />
Te (2001),<br />
Myxobolus and Henneguya: Myxobolus infested fish with prevalence of infection was 37.2% and<br />
intensity was low (+). Sitja-Bobadilla et al. (1993) assesed that Myxobolus parasites on organs of<br />
freshwater fish with prevalence of 68%. Moreover, prevalence of Myxobolus in carp which was 96% was<br />
regconized (Ha Ky and Bui Quang Te, 2000).<br />
316
317<br />
FINAL REPORTS: INVESTIGATIONS 2009–2011<br />
Henneguya was found in snakehead gills in the first and third sampling months of culture period (in An<br />
Giang province) and the second month (in Dong Thap province). The prevalence of infection was 4.4%<br />
and intensity was low (+). This genus, however, was not found other samples. In Mekong Delta,<br />
Henneguya infested Anabas testudineus and Ophiocephalus micropeltes with average prevalence of<br />
infection of 66.7% and high intensity (Ha Ky and Bui Quang Te, 2007). So, the infection prevalence and<br />
intensity of this genus in this study did not affect cultured snakehead in An Giang and Dong Thap<br />
provinces.<br />
Trichodina and Tripartiella: Trichodina and Tripartiella belong to the Family Trichodonidae, Order<br />
Mobilina (Ha Ky and Bui Quang Te, 2007). The prevalence of infection and intensity of Trichodina and<br />
Tripartiella in grown-out snakehead was 31.8% and 14.2%, respectively. The intensity of both parasites<br />
was low (+). Trichodina and Tripartiella were found in gills and skin which contributed low percentage.<br />
The infection of Trichodina and Tripartiella in this study did not affect grown-out snakehead because of<br />
the lower prevalence and intensity infection. However, Ha Ky and Bui Quang Te (2000) reported that fish<br />
were infected with 90-100% and 50-100 individuals/slide of prevalence and intensity, respectively.<br />
Chilodonella: Chilodonella belong to the Family Chilodonellidae, Order Cyrtophorida (Ha Ky and Bui<br />
Quang Te, 2007). Chilodonella was found in fish gills in the second and third sampling month in An<br />
Giang and Dong Thap provinces, respectively. The prevalence of infection was 1.7% and the intensity<br />
was high with +++. Arthur and Te (2006) reported that Chilodonella exists in culture condition when the<br />
water quality is poor and stocking density was high. This estimation was similar to snakehead culture<br />
condition in sampling time. However, it is concluded that Chilodonella was not an important pathogen<br />
infecting grown-out snakehead.<br />
Epistylis and Apiosoma: Epistylis and Apiosoma belong the Family Epistylididae, Order Peritrichida (Ha<br />
Ky and Bui Quang Te, 2007). Epistylis and Apiosoma was found from the second to fouth sampling<br />
month in An Giang province and in the first sampling month in Dong Thap province. The prevalence and<br />
intensity of Epistilis and Apiosoma in cultured snakehead was 17.2% and ++ and 13.9% and +,<br />
respectively. The prevalence and intensity of Epistilis and Apiosoma of this study was lower than the<br />
study of Nguyen Thi Thu Hang et al. (2008) in catfish: 2.7% and 30 individuals/len and 5.3% and 7<br />
individuals/len, respectively.<br />
Trianchoratus: Trianchoratus belong to the Family Ancyrocephalidae, Order Dactylogyridea (Ha Ky and<br />
Bui Quang Te, 2007). Trianchoratus was found in snakehead gills. Bui Quang Te and Vu Thi Tam (2000)<br />
concluded that Trianchoratus parasite on fish gills was advantageous for other pathogens such as fungi,<br />
bacteria and other organisms.<br />
Gyrodactylus: Gyrodactylus classificated to the Family Gyrodactylidae (Ha Ky and Bui Quang Te, 2007).<br />
The prevalence and intensity of infection of Gyrodactylus were 72.6% and 6 individuals/slide,<br />
respectively. Gyrodactylus was found in fish skin and gills.<br />
Cestoidea: Cestoidea were found in fish intestine in the third sampling month (in An Giang province) and<br />
the second sampling month (in Dong Thap provin). The prevalence and intensity of infection of Cestoidea<br />
were 1.4% and 1 individuals/intestine. Similar findings were reported by Ha Ky and Bui Quang Te (2007)<br />
in Polyonchobothrium (Fig. 3A) colony in fish intestine and liver in Mekong Delta with low prevalence<br />
(7.4%) and intensity (1-3 individuals/intestine). In this study, the prevalence and intensity of infection of<br />
Proteocephalus were 2.0% and 2 individuals/intestine, respectively. Proteocephalus mainly presented in<br />
fish intestine which sampled in the second sampling month (An Giang) and the third sampling month<br />
(Dong Thap).
FINAL REPORTS: INVESTIGATIONS 2009–2011<br />
Trematoda: Exochis belong to the Family Cryptogonimidae, Order Opisthorchiida (Ha Ky and Bui<br />
Quang Te, 2007). Metacercaria of Exochis was detected only one time in the fourth sampling month (in<br />
An Giang) in fish fins, with prevalence of 3.0% and intensity of 2 individuals/slide. In addition,<br />
Metacercaria of Clonorchis was also found in the fish fins, with prevalence of 3.7% and intensity of 2<br />
individuals/slide. Clonorchis (Fig. 10B) belong to the Family Opisthorchidae, Order Opisthorchiida (Ha<br />
Ky and Bui Quang Te, 2007). Moreover, the spore of Haplorchis was found in fish fins in the second<br />
sampling month (An Giang), with prevalence of 5.1% and intensity of 3 individuals/slide. Haplorchis<br />
belong to the Family Galactosomidae, Order Strigeata (Ha Ky and Bui Quang Te, 2007). Thien et al.<br />
(2009) revealed that this parasite infest fish in the stage of Metacercaria. This agrees with the present<br />
study. Scolex infection to grown-out snakehead was in stage of Metacercaria, with small spot in fish<br />
muscle. Furthermore, scolex also infected snakehead cultured in Nam Binh and Nam Đinh provinces with<br />
higher prevalenc (18.5%) and intensity (21-50 individuals/slide) (Kino et al., 1998; Ha Ky and Bui Quang<br />
Te, 2007).<br />
Nematoda: Nematoda was found in fish stomach, only Neocamallanus in both fish stomach and intestine.<br />
Spinitectus infested snakehead with prevalence of 17.9% and intensity of 5 individuals/stomach.<br />
Spinitectus was found in all sampling periods, with healthy and unhealthy fish. Neocamallanus existed in<br />
snakehead intestine, stomach and bladder (Fig. 3D). The prevalence and intensity of Neocamallanus was<br />
4.7% and 1-3 individuals/organ, respectively. Moreover, Gnathostoma and Capillaria was found only in<br />
the second and fourth sampling month in An Giang province with prevalence of 1.4% and 1.0% and<br />
intensity of 2 individuals/stomach and 1 individual/stomach, respectively (Fig. 3E and 3F). Gnathostoma<br />
was found in snakehead stomach for the first time. In addition, Capillaria parasites were mainly found on<br />
fish fingerling (Moravec et al., 2001). This agrees with our findings.<br />
Acanthocephala: Pallisentis was found in fish intestine in sampling months of 1, 2, 3, 5 (An Giang) and<br />
1, 2, 4, 6 (Dong Thap). The prevalence of infection of Pallisentis was 27.4% and 2 individuals/intestine,<br />
respectively. Pallisentis belong to the Family Quadrigyridae, Order Acanthogyrida (Ha Ky and Bui<br />
Quang Te, 2007). Bui Quang Te (2001), reported that Pallisentis colonized in intestine of snakehead with<br />
the prevalence of 20% and intensity of 3-53 individuals/intestine.<br />
Crustacea: Ergasilus existed in snakehead gills with the prevalence of 6.4% and intensity of 2<br />
individuals/fish. Ergasilus belong to the Family Ergasilidae, Order Copepoda (Ha Ky and Bui Quang Te,<br />
2007). Ergasilus was found in the second sampling month in both An Giang and Dong Thap provinces.<br />
Ergasilus was noted by Yunia et al., 2007 that they infected freshwater and marine fish. Ha Ky and Bui<br />
Quang Te (2007) regconized Ergasilus infecting snakehead gills, with the prevalence of 11.3% and<br />
intensity of 2 individuals/fish. This result showed a lower prevalence and intensity infection of Ergasilus<br />
in cultured snakehead in An Giang and Dong Thap provinces.<br />
Besides, Lamproglena was found in fish gills, with with the prevalence of 0.7% and intensity of 2<br />
individuals/fish. Lamproglena was only found in the second sampling month in An Giang province.<br />
Lamproglena chinensis not only infected snakehead but also knife-fish and climbing perch with higher<br />
prevalence of 5,6% and similar intensity (Tran Ngoc Tuan, 2010).<br />
Moreover, Lernaea was found in the sampling months of 1 and 4 (An Giang) and 3 (Dong Thap). The<br />
prevalence of infection of Lernaea was 2.0% and 1 individual/fish, respectively. Kabata (1981) defined<br />
that Lernaea infected different stages of freshwater fish, but mainly in fingerling stage. In addition,<br />
Argulus was observed in the sampling months of 3 and 4 in An Giang and Dong Thap provinces, with the<br />
prevalence of 4.7% and intensity of 2 individuals/fish. In the previous study, Argulus chinensis was<br />
recorded in Channa striata and Ophiocephalus micropeltes (0.4-0.8 kg), with the intensity of 30-50<br />
individuals/fish, which cause high fish mortality (Bui Quang Te, 2008). Therefore, Argulus may be<br />
harmful to grown-out snakehead.<br />
318
319<br />
FINAL REPORTS: INVESTIGATIONS 2009–2011<br />
2.2.3 Study on fungi infecting snakehead fingerlings and grown-out snakehead<br />
a. Snakehead fingerlings in nursey ponds<br />
Isolation and identification<br />
Total of 14 isolates of fungi were isolated from snakehead fingerlings, with clinical signs (Fig. 4). Fungal<br />
isolates were named from VN1101 to VN1114 (Table 6). The morphological characteristics of fungal<br />
isolates were similarity. The isolates VN1101 was studied for morphology. The colony grew rapidly on<br />
GYA medium at 28 o C with 60 mm in diameter (in 3-4 days of incubation). Colony colour was whitish.<br />
Aerial mycelium was abundant and dense (Fig. 5A). The hyphae was stout, non-septate and apical<br />
zoosporangia formation. Zoospores were spherical shape produced in zooaporangium (Fig. 5B).<br />
Zoospores release and aggregate at the tip of zoosporangium as irregular ball (Fig. 5D). Cysts rise to<br />
secondary zoospores, further encyst and then germinate into hyphae (Fig. 5E). Based on morphological<br />
characteristics, comprising of hyphae and zoospores and the key of Coker (1923) identificated that the<br />
isolates VN1101 isolated from snakehead fingerling in Dong Thap province belonged to genera of<br />
Achlya. Frequency of genera of Achlya was 46%. Achlya belong to the Class Oomycetes, Order<br />
Saprolegniales, Family Saprolegniaceae (Neish and Hughes, 1980).<br />
Pathogenicity of isolate Achlya sp. VN1101 isolated from snakehead fingerling with clinical signs of<br />
fungal infection was carried out (Fig. 6). After 7 days of challenged test, the result of experiment was<br />
recorded, clinical signs (Fig. 7A) and mortality were considerably high in both low dose and high dose,<br />
which were illustrated in Table 8. Moreover, re-isolation and re-identification of fungi in challenged fish<br />
were performed. The results showed that Achlya was isolated from unhealthy fish (Fig. 7B). However, no<br />
fungi was isolated from healthy fish in control treatment. Therefore, Achlya sp. VN1101 was primitive<br />
pathogen in cotton-like disease in snakehead fingerlings (5-10 g/fish).<br />
b. Cultured snakehead in grow-out ponds<br />
Isolation and identification<br />
14 isolates fungi, including of 3 isolates of lower fungi and 11 isolates of higher fungi, were isolated from<br />
grown-out snakehead with clinical signs (Table 6). Basing on morphological characteristics, growth<br />
ability and hypae and conidia characteristics, fungal isolates identified were genera Achlya (A001, A002<br />
và A003), genera Fusarium (Fu001 và Fu002), genera Acremonium (Ac001, Ac002, Ac003, Ac004 và<br />
Ac005) and genera Geotrichum (Ge001, Ge002, Ge003 và Ge004), which were showed in Table 5.<br />
However, no fungi were isolated from snakehead without clinical signs. The Figure 16 showed the<br />
frequency of fungal isolates isolated from grown-out snakehead.<br />
Achlya<br />
The clinical signs of cultured snakehead infested by Achlya showed reduction in appetite, abnormal body,<br />
floating on the water surface or the head out of the water, darker skin and ulcerative formation. The<br />
mycelium grow in the infectinous places with whitish colour and cotton-like. Snakehead samples,<br />
weighting of 96.6±38.4 g to 165±28.6 g, were collected in culture ponds in An Giang and Dong Thap<br />
provinces. Achlya was isolated only in the first sampling month in ponds.<br />
Fungal colony grew quickly on GYA at 28 o C with 58 mm in diameter after 4 days incubated. Colony had<br />
white colour with aerial mycelium, which were white and floccose. The hyphae were stout and aseptate.<br />
Cultivation on low nutrient medium, after 18 hours, the hyphae grew rapidly with a septate nearly to the<br />
hyphal tip and formed spores agglomerating in portion of septate to hyphal tip. Sporangium was<br />
11.5±0.68x3.8±2.83 µm in size. Zoospores released and clustered in the sporangium tip. Spores were<br />
spherical or elipsoid with flagella and good swimmers. Based on morphological characteristics and the<br />
classification key of Scott (1961), fungi isolates isolated from cultured snakehead was genera Achlya with<br />
frequency of 21.4%. Achlya belong to Oomycetes, the Family Saprolegniaceae, Order Saprolegniales<br />
(Scott, 1961).
FINAL REPORTS: INVESTIGATIONS 2009–2011<br />
Acremonium<br />
Snakehead were infected by Acremonium in cultured ponds, with body weight of 244±42.3 g to 313±18.3<br />
g. Clinical signs were recorded with swimming along pond banks, dense muscus on the body surface and<br />
white spot in whole body (Fig. 8A). Acremonium was isolated from fish skin in the second sampling<br />
month in An Giang and the second and third month in Dong Thap.<br />
Colony grew rapidly on GYA at 28 o C with 40 mm in diameter after 6 days of incubation. Fungal colony<br />
was applenate and smooth. Colony colour was white in margin and yelowish in center (Fig. 8B). The<br />
hyphae were septate, hyaline, branching and dense with 1-2 µm (Fig. 8C). Conidia were normally 1-cell,<br />
hyaline, spherical or ellipsoid shape with 3.1±0.82x1.3±0.22 µm, accumulate in conodiophore apex (Fig.<br />
8D). Conidiospore, branched from creeping hyphae, was phialide shape, tapering toward ot the apex with<br />
visible collarete and casually septate visibility in the basal cells (Fig. 8E). Based on morphological<br />
chacteristics and classification key of de Hoog et al. (2000), fungal isolated from cultured snakehead was<br />
belonging to genera Acremonium with frequency of 35.7%. Acremonium belong to Class Hyphomycete,<br />
Family Hypocreaceae, Order Hypocreales (de Hoog et al., 2000).<br />
Acremonium was recorded as a pathogent in black gill disease in marine crustacean (Duc et al., 2009). In<br />
previous study, Acremonium sp. was isolated from climbing perch with fungal infection” (Tran Ngoc<br />
Tuan, 2010). This is the first time Acremonium was isolated from cultured snakehead in An Giang and<br />
Dong Thap province.<br />
Fusarium<br />
Snakehead were infected by Fusarium in cultured ponds in weighting of 258±32.3 g to 288±17.5 g.<br />
Clinical signs were recorded with poor swim, swim with head out of water, dense muscus on the body<br />
surface, scabrous scales, swelling adomen and haemorrhage in visceral organs (Fig. 9A). Fusarium was<br />
isolated from cultured snakehead in the second and the third sampling month in An Giang and the second<br />
and third month in Dong Thap.<br />
Colony grew rapidly on GYA at 28 o C with 46 mm in diameter after 6 days of incubation. Fungal colony<br />
was applenate and smooth. Colony colour was white, pinkish (Fig. 9B). The aerial mycelium were white,<br />
abundant and softly floccose. The hyphae were septate and branching with 2.3-5.2 µm in diameter (Fig.<br />
9C). Macroconidia were 1-5 septate, dosiventral, falcate, slightly curved with sometimes foot-shape basal<br />
cells, 19.8±3.61x2.9±0.63 µm in size (Fig. 9E). Basing on morphological chacteristics and key of de<br />
Hoog et al. (2000), fungal isolated from cultured snakehead was belonging to genera Fusarium with<br />
frequency of 14.3%. Fusarium belong to the Class Hyphomycete, Family Hypocreaceae, Order<br />
Hypocreales (de Hoog et al., 2000).<br />
In similar to Acremonium, Fusarium was studied in black gills of marine crustacean (Alderman and<br />
Polglase, 1985; Rhoobunjongde et al., 1991; Khoa et al., 2004; Khoa and Hatai, 2005). Moreover,<br />
according to Theo nghiên cứu của Hatai et al. (1986), Fusarium was also a main pathogen infecting red sea<br />
bream Sparagus sp. with white spots in the body surface (Hatai et al., 1986). In addition, Fusarium was<br />
isolated from climing perch Anabas testudineus with fungal infection (Tran Ngoc Tuan, 2010). This is the<br />
first time Fusarium was isolated in cultured snakehead in An Giang and Dong Thap provinces.<br />
Geotrichum<br />
Geotrichum was recorded infecting snakehead of 258±18.6 g to 338±23.3 g in the second and third<br />
sampling month in An Giang and Dong thap provinces. Fish were noted to the clinical signs with poor<br />
swimmers, exothalmic, dense muscus in body surface, white spot in body and scabrous scales (Fig. 10A<br />
and 10B).<br />
320
321<br />
FINAL REPORTS: INVESTIGATIONS 2009–2011<br />
Colony grew on GYA at 28 o C with 35 mm in diameter after 6 days of incubation. Fungal colony was<br />
applenate, smooth and yelowish in colony center (Fig. 10C). The hyphae were hyaline, branching and<br />
septate (Fig 10D). Conidia were formed in the hyphae tip, conidiophores, or by arthroconidia (Fig. 10E<br />
and 10F). Conidia were hyaline, 0-3 septate, spherical or cylindrical shape with shape with<br />
8.6±2.28x2.6±0.81 µm (Fig. 10F). Basing on morphological chacteristics and key of de Hoog et al.<br />
(2000), fungal isolated from cultured snakehead was belonging to genera Geotrichum with frequency of<br />
28.6%. Geotrichum belong to the Class Hemiascomycetes, Family Dipodascaceae, Order<br />
Saccharomycetaceae (de Hoog et al., 2000).<br />
In previous sudy, Geotrichum sp. was isolated from fungal infection in climbing perch with clinical signs of<br />
scabrous scales and dense muscus in the fish body (Tran Ngoc Tuan, 2010). Such clinical signs were also<br />
recorded in this study.<br />
2.2.2.4 Study on bacteria infecting reared and cultured snakehead fish<br />
Total of 296 snakehead samples was isolated and identified to 81 strains of bacteria infecting cultured<br />
snakehead with the clinical signs. Based on morphological characteristics and biochemical and<br />
physiological tests, bacterial strains were classified in 5 genera (Table 7), including of Aeromonas (38.3%<br />
in frequency of apparence), Edwardsiella (17.3%), Vibrio (16.0%), Streptococcus (14.8%) and<br />
Pseudomonas (13.6%). However, no bacterial strains were isolated from healthy fish. The results showed<br />
that Aeromonas was isolated during the whole culture period, Edwardsiella was ordinarily isolated in the<br />
second sampling month and Streptococcus was only isolated in market size (the fifth sampling month).<br />
Aeromonas<br />
Total of 31 Aeromonas strains were isolated from cultured snakehead in An Giang (whole sampling<br />
period or 6 sampling months) and Dong Thap (5 sampling months) provinces. The clinical signs were<br />
recorded with poor swimming fish, haemorrhage and ulcerative lesion in the fish body, haemorrhage in<br />
fish fins, oral cavity and fish tongue (Fig. 11A). Moreover, red fluid with smell, bruising liver,<br />
haemorrhage in stomach, kidney and blader and intestine without feeds were noted in operating of<br />
abdominal cavity (Fig. 11B).<br />
Bacterial colony grew rapidly on TSA at 28 o C with round, whitish, slightly convex (Fig. 11C).<br />
Biochemical tests indicated that Gram-negative, rod-shape (Fig. 11D), motile, oxidase and catalasepositive,<br />
O/F-fermenting and O/129-inhibiting. Based on morphological characteristics, biochemical tests<br />
and classification key of Barrow and Feltham (1993) defined bacterial strains isolated from cultured<br />
snakehead was Aeromonas with frequency of apparence of 38.3%. Aeromonas belong to the Family<br />
Aeromonadaceae, Order Aeromonadales. The exam of API 20E kit on biochemical properties identified<br />
two isolates of 9 and 74 were Aeromonas hydrophila, but some differences were demonstrated by API<br />
20E kit on the other strains, which were classified to genus of Aeromonas.<br />
Aeromonas hydrophila was recorded as a main pathogen causing of haemorrage in cage-culture of basa<br />
catfish, carp and walking catfish with the same clinical signs shown in present study (Tanasomwang and<br />
Saitanu, 1979; Angka, 1990). Therefore, Aeromonas was a probable pathogen causing haemorrhagic<br />
signs in cultured snakehead in An Giang and Dong Thap provinces.<br />
Pathogenicity to fingerling snakehead of Aeromonas hydrophila was carried out with some biochemical<br />
characteristics, which were illustrated in Table 8. The results of experiment on pathogenicity of<br />
Aeromomas hydrophila to snakehead showed similarl clinical signs of natural snakehead infection and the<br />
cumulative mortality was noted (Fig. 12). Died fish were noted in all concentration of bacterial<br />
suspension excepting to negative control treatment. The concentration of 3,67x10 6 CFU/ml of bacteria<br />
showed the earliest time of fish dead was 15 hours after injection. In contrast, the longest was 37 hour in<br />
treatmet of concentration of 3.67x10 4 CFU/ml of bacterial suspension. The present study result was
FINAL REPORTS: INVESTIGATIONS 2009–2011<br />
similar to a previous study result of Rahman et al. (2004) in injecting A. hydrophila to Channa punctatus<br />
that the result showed LD50 of bacterial suspension was 3,42x10 7 CFU/ml after 15 days. Highest mortality<br />
was 100% when injecting to bacterial concentration of 3.42x10 9 CFU/ml. On the contrary, there were no<br />
fish was observed in the bacterial concentration of 10 5 CFU/ml. Therefore, A. hydrophila was defined as a<br />
main pathogen that caused haemorrhage in snakehead fingerlings by the traditional identification methods<br />
(Fig. 13) and PCR technique applied in which bacterial strains re-isolated had a band of 209 bp (Fig. 14).<br />
Edwardsiella<br />
Total of 14 Edwardsiella strains were isolated from cultured snakehead in the only the second sampling<br />
month in An Giang and Dong Thap provinces. The fish samples weighted 150-280 g/fish. The clinical<br />
signs were recorded with poor swimming fish, pale body sign and ulcerative lesion in the fish body with<br />
smell (Fig. 15A). Moreover, white spots existing in liver, kidney and spleen were noted in abdominal<br />
cavity (Fig. 15B).<br />
Samples were taken and cultured on TSA and incubated at 28 o C in 48 hours. Bacterial colony grew<br />
quickly with whitish colour (Fig. 15C). Biochemical tests indicated that Gram-negative (Fig. 15D), rodshape,<br />
oxidase-negative, catalase-positive and O/F-fermenting. Based on morphological characteristics,<br />
biochemical tests and classification key of Barrow and Feltham (1993) identification of bacterial strains<br />
isolated from cultured snakehead was Edwardsiellas with frequency of apparence of 17.3%. Edwardsiella<br />
belong to the Family Enterobacteriaceae, Order Enterobacteriales. API 20E kit was examined that<br />
identification of two isolates of 58 and 80 were Edwardsiella tarda, but some differences were<br />
demonstrated by API 20E kit on the other strains, which were classified to genus of Edwardsiella.<br />
Edwardsiella ictaluri was isolated in the first time on chanel catfish Ictalurus punctatus (Hawke, 1979).<br />
Furthermore, E. ictaluri was noted to cause white spot clinical sign on other catfish Ictalurus fuscatus,<br />
Ictalurus catus and Pangasianodon hyphothalmus (Plunb and Sanchez, 1983; Furguson et al., 2001). This<br />
species were also detected in cultured snakehead fish in the Mekong delta.<br />
Vibrio<br />
Total of 13 Vibrio strains were isolated from cultured snakehead in the second sampling month in An<br />
Giang and Dong Thap provinces. Vibrio was isolated in the second and third sampling month with the<br />
clinical signs which were exothalmic, fins torn, white spot on the body surface and pale liver, kidne and<br />
spleen and sweeling bladder in visceral organs.<br />
Bacterial colony grew on TSA at 28 o C in 24 hours with round, slight orange colour. Biochemical tests<br />
showed that Gram-negative, rod-shape, oxidase and catalase-positive, O/F-fermenting and O/129sensitive.<br />
Based on morphological characteristics, biochemical tests and classification key of Barrow and<br />
Feltham (1993) Vibrio widentified from cultured snakehead was Aeromonas with frequency of apparence<br />
of 16.0%. Vibrio belong to the Family Vibrionaceae, Order Vibrionales. The exam of API 20E kit on<br />
biochemical properties identified two isolates of 24 and 27 were Vibrio cholerae, but some differences<br />
were demonstrated by API 20E kit on the other strains, which were classified to genus of Vibrio.<br />
Vibrio harvegi and V. samonicida were recorded as a main pathogen damaging to fishes, bivalvia and<br />
crustacean (Toranzo and Barja, 1990; Sǿrum et al., 1992). The clinical signs are small red spot on the fish<br />
body, removing of scales and forming of ulcerative lesion and fins torn or necrosis (Tolmasky et al.,<br />
1995). A similarity was found in present study to the previous studies.<br />
Pseudomonas<br />
The study isolated a total of 11 Pseudomonas strains from cultured snakehead in An Giang and Dong<br />
Thap provinces. Bacterial strains were isolated in the third sampling month (fish weight was 280-320 g)<br />
and the sixth sampling month (fish weight was 850-1100 g). The clinical signs were noted with poor<br />
322
323<br />
FINAL REPORTS: INVESTIGATIONS 2009–2011<br />
swimming fish, spinning swim, imbalance with the head down, haemorrhage in both body sides.<br />
Moreover, swelling of liver, spleen and gallbladder were noted in abdominal cavity.<br />
After 24 hours, bacterial colony grew rapidly on TSA at 28 o C with round, whitish, slightly convex.<br />
Biochemical tests indicated that Gram-negative, rod-shape, motile, oxidase and catalase-positive, O/Fnonfermenting.<br />
Based on morphological characteristics, biochemical tests and classification key of<br />
Barrow and Feltham (1993) bacterial strains isolated from cultured snakehead was Pseudomonas with<br />
frequency of apparence of 13.6%. Pseudomonas belong to the Family Pseudomonadaceae, Order<br />
Pseudomonadales. The exam of API 20E kit on biochemical properties identified two isolates of 75 and<br />
81 were Pseudomonas fluorescens, but some differences were demonstrated by API 20E kit on the other<br />
strains, which were classified to genus of Pseudomonas.<br />
According to Sindermann (1990) defined that P. anguilliseptica, P. chlororaphus caused haemorrhage<br />
signs in marine fish. Moreover, P. flourescens and P. pseudoalcaligenes were believed that mainly<br />
distributed and caused haemorrhage in freshwater fish (Ahne et al., 1982; Wiklund et al., 1994).<br />
Pseudomonas was isolated in the cultured snakehead culture in An Giang and Dong Thap provinces,<br />
although the genus was isolated in other aquatic animals.<br />
Streptococcus<br />
Total of 12 Streptococcus strains were isolated from cultured snakehead in the only the second sampling<br />
month in An Giang and Dong Thap provinces. The fish samples weighted 580-820 g/fish (in the fifth<br />
sampling). The clinical signs were noted with abnormal swimming behavior, body swelling, scabrous<br />
scales and ulcerative lesion in the body (Fig. 16A). Moreover, necrosis of liver and kidney and normal<br />
spleen were regconized in abdominal cavity (Fig. 16B).<br />
Bacterial colony grew quickly on TSA at 28 o C in 48 hours. The colonies were round, yellow, slightly<br />
convex (Fig. 16C). The results of biochemical and physiological tests demonstrated that Gram-positive,<br />
spherical-shape, non-motile (Fig. 16D), oxidase and catalase-negative, O/F-fermenting. Basing on<br />
morphological characteristics, biochemical tests and classification key of Barrow and Feltham (1993)<br />
bacterial strains isolated from cultured snakehead was Streptococcus with frequency of apparence of<br />
14.8%. Streptococcus belong to the Family Streptococcaceae, Order Lactobacillales.<br />
Streptococcus was firstly found in Lates calcarifer and Mugil cephalus with hemorrhagic signs (Plumb et<br />
al., 1974). Furthermore, Streptococcus probably caused haemorrhage in Oreochromis niloticus,<br />
Pangasius bocourti and Cyprius carpio (Robinson and Meyer, 1966). The present study showed the first<br />
regconization of Streptococcus in cultured snakehead culturing in An Giang and Dong Thap.<br />
CONCLUSIONS<br />
The main water quality parameters are successfully recorded in this study. The results of this study<br />
illustrated that temperature and pH value in snakehead cultured ponds in An Giang and Dong Thap<br />
provinces were not considerably varied. In the whole cultured period, the concentration of N-NH4 + and N-<br />
NO2 - increased, while the concentration of N-NO3 - reduced in the posterior end.<br />
The average age of snakehead farming households was 44.7±9.12. The education level was low, with<br />
60% of households attainding primary school. On average, snakehead farming households had 9±4.4<br />
years experiences in culturing snakehead in the Mekong delta. Improvement of snakehead culture skills<br />
was mostly from the gain of experiences and participation in trainings provided by provincial fisheries<br />
officers. Water quality management was applied by the majority of household (75%) such as the use of<br />
test kits. Most of the snakehead farming household (70%) complain parasite infection to their snakehead<br />
fish. Therefore, parasite infection is the key issue in snakehead farming in the Mekong Delta of Vietnam.
FINAL REPORTS: INVESTIGATIONS 2009–2011<br />
The potential pathogens, including parasites, fungi and bacteria infesting snakehead fingerlings and<br />
cultured snakehead in An Giang and Dong Thap provinces, Vietnam are successfully identified, classified<br />
and documented. Nine genera of parasites were identified from 142 samples of snakehead fingerlings in<br />
nursery ponds, including of Dactylogyrus, Trichodina, Epistylis, Trianchoratus, Chilodonella,<br />
Proteocephalus, Spinitectus, Pallisentis. Trichodina had the highest prevalence infection of 93.7%, while<br />
Proteocephalus and Henneguya had lowest prevalence infection of 3.52% and intensity of lowest (+).<br />
There were 23 genera of parasites identified from cultured snakehead sampled from growth-out ponds in<br />
An Giang and Dong Thap provinces. Of which, 6 new genera were found in cultured snakehead,<br />
comprising of Henneguya, Chilodonella, Epistylis, Tripartiella, Gnathostoma and Capillaria.<br />
Gyrodactylus was noted with the highest prevalence infection of 72.6% and the lowest was found in<br />
Lamproglena (0.7%).<br />
Achlya sp. was isolated from snakehead fingerlings in nursery ponds in the first and second month of<br />
culture period. The frequency of apparence was 46% in the whole isolated fungi recorded. The optimum<br />
temperature for Achlya sp. VN1101 growth was 28 o C. The results demonstrated that Achlya sp. VN1101<br />
was main pathogen causing cotton-like in snakehead fingerlings revealed by pathogenicity experiment.<br />
There were 4 genera of fungi isolated from cultured snakehead in grow-out ponds in An Giang and Dong<br />
Thap provinces, including Acremonium (frequency of apparence was 35.7%), Geotrichum (28.6%),<br />
Achlya (21.4%) and Fusarium (14.3%). The fungi were regconized in the first three months of culture<br />
period, and Achlya was only noted in the first month of the cultured period when the fish was 96.6-165 g<br />
in weight.<br />
81 bacterial strains were indentified from unhealthy fish. Bacterial strains were grouped to 5 genera based<br />
on morphological and biochemical characteristics, comprising of Aeromonas (frequency of apparence of<br />
38.3%), Edwardsiella (17.3%), Vibrio (16.0%), Streptococcus (14.%) and Pseudomonas (13.6%). Of<br />
which, Edwardsiella was only isolated in the second month of the cultured period when fish was 175.7-<br />
295.3 g in weight, and Streptococcus was also detected in the fifth cultured month when fish was 620.4-<br />
850 g in weight. Besides, Aeromonas hydrophila was believed as a primary pathogen to snakehead<br />
fingerlings revealed by pathogenicity experiment. The clinical signs were observed, consisting of<br />
haemorrhage in fish body and fins, red spot in ventral area, and scales damage and loss.<br />
RECOMMENDATIONS<br />
The implement sustainable snakehead aquaculture development in the Mekong Delta of Vietnam the<br />
following recommendations are proposed for policy and action plan development for snakehead disease<br />
and health management:<br />
At least eight kinds of chemicals have been used by snakehead farmers in the Mekong Delta for<br />
treating diseases, social, envrironmental and economical risk and impact assessment should be<br />
conducted to sustain this industry;<br />
Research into traditional or low environmental impact snakehead disease treatment by using local<br />
available plants or herbs;<br />
Research into how to control and treat diseases in snakehead and how to manage fish health<br />
better.<br />
Further research into snakehead virus diseases;<br />
Promote and implement awareness raising by producing and disseminating extension materials,<br />
for example snakehead fish disease cards to snakehead farmers;<br />
324
325<br />
FINAL REPORTS: INVESTIGATIONS 2009–2011<br />
Train snakehead farmers and provincial fisheries extension officers on snakehead fish disease and<br />
health management;<br />
Knowledge, skills and information gained from this study on snakehead fish diseases should be<br />
transfer to colleagues in Cambodia;<br />
A national list of snakehead fish diseases should be development and legalized;<br />
Strengthen the national and sub-national capability in epidemiology, risk analysis, disease<br />
surveillance, contingency planning, and information management, reporting and communication<br />
related to the biosecurity of snakehead aquaculture industy;<br />
A trans-boundary framework for snakehead disease and health management between Vietnam<br />
and Cambodia should be established to prevent or reduce trans-boundary diseases caused by<br />
spread of snakehead pathogens, which have caused significant damage in recent years in Vietnam<br />
and Cambodia; and<br />
Encourage public and private sectors to invest on health management and biosecurity of<br />
snakehead aquaculture industry because of the social and economic importance of the snakead<br />
fishery and aquaculture sector.<br />
<br />
ACKNOWLEDGMENTS<br />
This study was funded by <strong>AquaFish</strong> <strong>CRSP</strong>. The authors would like to thank An Giang, Dong Thap and<br />
Can Though Rural Development and Agriculture Departments for their kind support and cooperation in<br />
data collection in the field.<br />
REFERENCES<br />
Ahne, W., W. Popp and R. Hoffmann, 1982. Pseudomonas fluorescens as a pathogen of tench (Tinca<br />
tinca). Bulletin of the European Association of Fish Pathologists, 4:56-57.<br />
Alderman, D. J. and J. L. Polglase. 1985. Fusarium tabacinum (Beyma) Gams as a gill parasite in the<br />
crayfish, Austropotamobius pallipes. Journal of Fish Diseases. 8:249-252.<br />
Angka, S.L., 1990. The Pathology of the walking catfish Clarias batrachus, infected intraperitoneally with<br />
Aeoromonas hydrophila Asian Fish S3. In Asian Fish Health Biblography and Abstracts I: Southeast<br />
Asia. Fish Health Section Asian Fisheries Society Manila, Philippines, 1992. 343-351.<br />
Arthur, R. and B.Q. Te, 2006. Checklist of the Parasites of Fishes of the Viet Nam. FAO Fisheries<br />
Technical Paper No. 369/2. Rome, 2006, 140 pp.<br />
Azevedo, C. and E. Matos, 1996. Henneguya malabarica sp. nov. (Myxozoa, Myxobolidae) in the<br />
Amazonian fish Hoplias malabaricus. Parasitol. Res. 82:222–224.<br />
Barrow, G.I. and R.K.A. Feltham. 1993. Cowan and Steel’s manual for the indentification of medical<br />
bacteria, third edition. Cambridge <strong>University</strong> press. Cambridge. 331 pp.<br />
Bùi Quang Tề và Vũ Thị Tám, 2000. Những bệnh thường gặp của tôm cá và biện pháp phòng trị. Nhà<br />
xuất bản Nông Nghiệp. 79 trang.<br />
Bùi Quang Tề, 2001. KST của một số loài cá nước ngọt ở Đồng bằng Sông Cửu Long và các giải pháp<br />
phòng trị chúng. Luận án Tiến sỹ Sinh học. Trường Đại học quốc gia Hà Nội.<br />
Coker, W.C. 1923. The Sarproleniacece with notes on other water molds. The <strong>University</strong> of North<br />
Carolina Press. Chapel Hill. 201 pp.<br />
de Hoog, G.S., J. Guarro, J. Gené and M.J. Figueras. 2000. Atlas of clinical fungi. 2nd edition.<br />
Centraalbureau voor schimmelculture. 1126p.<br />
Duc, P.M. and K. Hatai, 2009. Pathogenicity of anamorphic fungi Plectosporium oratosquillae and<br />
Acremonium sp. to mantis shrimp, Oratosquilla oratoria. Fish Pathology. 44:81-85.
FINAL REPORTS: INVESTIGATIONS 2009–2011<br />
Farooqi, H.U., 1958. A new species of the genus Pallisentis from a fresh-water eel. Z. f. Parasitenkunde,<br />
Bd. 18:457—464.<br />
Furguson, H.W, J.E. Turnbull, A. Shinn, K. Thompson, T.T. Dung and M. Crumlish. 2001. Bacillary<br />
nercrosis in farmed Pangasius hypophthalamus (Sauvage) from the Mekong Delta, Viet Nam. Journal<br />
of Fish Diseases. 24:509-513.<br />
Gams, W., H.A. van der Aa, A. J. van der Plaats-Niterink, R. A. Samson and J. A. Stalpers, 1980. CBS<br />
course of mycology. Centraalbureau voor Schimmelcultures Baarn (The Netherlands), Institute of the<br />
Royal Netherlands, Academy of Science and Letters, Amsterdam-Zuid. 109pp.<br />
Hà Ký và Bùi Quang Tề, 2007. KST nước ngọt Việt Nam. Nhà xuất bản Khoa Học và Kỹ Thuật Hà Nội.<br />
360 trang.<br />
Hatai, K., D. Roza and T. Nakayama. 2000. Identification of lower fungi isolated from larvae of<br />
mangrove crab, Scylla serrata, in Indonesia. Mycoscience. 41:565-572.<br />
Hatai, K., S. Kubota, N. Kida, S. Udagawa, 1986. Fusarium oxysporum in red sea beam, Pagrus sp.<br />
Journal Wildlife Diseases. 22:570–571.<br />
Hawke, J.P. 1979. A bacterium associated with disease of pond culture channel catfish. Journal of the<br />
Fisheries Research Board of Canada. 36:1508-1512.<br />
Johnson, T. W. 1956. The genus Achlya morpholology and taxonomy. The <strong>University</strong> of Michigan Press.<br />
180 pp.<br />
Kabata, Z., 1981. Copepoda (Crustacea) parasitic on fishes: problems and perspectives. Adv. Parasitol.<br />
19:1-71.<br />
Khoa, L.V., K. Hatai, and T. Aoki, 2004. Fusarium incarnatum isolated from black tiger shrimp Penaeus<br />
monodon Fabricius, with black gill disease cultured in Vietnam. Journal of Fish Diseases. 27:507-<br />
515.<br />
Khoa, L.V. and K. Hatai, 2005. First case of Fusarium oxysporum infection in culture Kuruma Prawn<br />
Penaeus japonicus in Japan. Fish Pathology. 40:195-196.<br />
Kino, H., H. Inaba, N.V. De, L.V. Chau, D.T. Son, H.T. Hao, N.D. Toan, L.D. Cong and M. Sano, 1998.<br />
Epidemiology of clonorchiasis in Ninh Binh Province, Vietnam. Southeast Asian J. Trop. Med. Publ.<br />
Health. 29:250-254.<br />
Lê Xuân Sinh và Đỗ Minh Chung. 2009. Hiện trạng và những thách thức cho nghề nuôi cá lóc (Channa<br />
micropeltes và Channa striatus) ở ĐBSCL. Báo cáo trình bày tại Hội thảo kết thúc giai đoạn 1 – Dự<br />
án Cá Tạp - Khoa Thủy sản - ĐHCT, 8-12/20<br />
Moravec, F., R. Aguilar and G. Salgado-Maldonado, 2001. Systematic status of Capillaria patzcuarencis<br />
Osorio-Sarabia, Perez-Ponce de Leon et Salgado-Maldonado, 1986 (Nematoda, Capillariidae) from<br />
fresh water fishes in Mexico. Acta Parasitologica. 46(1):8-11.<br />
Nguyễn Thị Diệp Thúy. 2010. Phân tích một số chỉ tiêu kinh tế - kỹ thuật của các mô hình nuôi cá lóc ở<br />
Đồng bằng sông Cửu Long. Luận văn tốt nghiệp cao học. Khoa Thủy Sản - Trường Đại Học Cần<br />
Thơ.<br />
Nguyễn Thị Thu Hằng, Đặng Thụy Mai Thy, Nguyễn Thanh Phương và Đặng Hoàng Oanh, 2008. Khảo<br />
sát sự nhiễm KST trên cá tra (Pangasinodon hypophthalmus) nuôi thâm canh ở tỉnh An Giang. Tạp<br />
chí khoa học. Đại Học Cần Thơ. 2008(1):204– 212.<br />
Nguyễn Văn Thường, 2004. Tổng quan về thành phần loài và phân bố của cá họ Channidae. Tạp chí khoa<br />
học Đại Học Cần Thơ, chuyên ngành thủy sản. (2). Trang 14-24.<br />
Pin, N., 1997. Proteocephalus sinocyclocheili n. Sp. (Cestoda: Proteocephalidae) in a fish<br />
Sinocyclocheilus grahami tingi fang from Yunnan, China. Chine,Se Journal of Oceanology and<br />
Limnology. 15:61-64.<br />
Plumb, J.A. and D.J. Sanchez, 1983. Susceptibility of 5 species of fish to Edwardsiella ictaluri. Journal of<br />
Fish Diseases. 6:261-266.<br />
Plumb, J.A., J.H. Schachte, J.L. Gaines, W. Peltier and B. Carroll, 1974. Streptococcus sp. from marine<br />
fishes along the Alabama and Northwest Florida coast of the Gulf of Mexico. Transacions of the<br />
American Fisheries Society. 2:358-361.<br />
326
327<br />
FINAL REPORTS: INVESTIGATIONS 2009–2011<br />
Rahman, M.H., S. Yesmin, M. Afzal Hussain, A.R. Khan, F. Pervin and M.A. Hossain, 2004. Aeromonas<br />
hydrophila Infection in Fish of Swamps in Bangladesh. Pakistan Journal of Biological Sciences.<br />
7(3):409-411.<br />
Reda, A.S.E., 2011. A Review of some Ecto-and Endo Protozoan Parasites Infecting Sarotherodon<br />
Galilaeus and Tilapia Zillii from Damietta Branch of River Nile, Egypt. Journal of American Science.<br />
7(3):362-373.<br />
Rhoobunjongde, W., K. Hatai, S. Wada and S. Kubota, 1991. Fusarium moniliforme isolated from gills of<br />
kuruma prawn Penaeus japonicus with black gill disease. Nippon Siusan Gakkaishi. 57:629-635.<br />
Robinson, J.A. and F.P. Meyer, 1966. Streptococcus fish pathogen. Journal of Bacteriology 92. 512 p.<br />
Sarowar, M.N., M.Z.H. Jewel, M.A. Sayeed and M.F.A. Mollah, 2010. Impacts of different diets on<br />
growth and survival of Channa striatus fry. Int. J. BioRes. 1(3):08-12.<br />
Scott, W. W. 1961. A monograph of the genus Aphanomyces. Technical Bullentin 151. Blacksburg,<br />
Virginia. 94 pp.<br />
Seymour, R. L. 1970. The genus Saprolegnia. The <strong>University</strong> of Pittsburgh, Pittsburgh, Pennsyvania.<br />
Germany. 224 pp.<br />
Sindermann, C.J., 1990. Principal Diseases of Marine Fish and Shellfish, Vol 1: Diseases of Marine Fish,<br />
2 nd edn. Academic Press, New York.<br />
Sitja-Bobadilla, P. Alvarez and P. Pellitero, 1993. Ultrastructural and cytochemical observations on the<br />
sporogenesis of Sphaerospora testicularis (Protozoa: Myxosporea) from Mediterranean sea bass,<br />
Dicentrachus labrax. European Journal of Protistology. 29 (2):219-229.<br />
Sǿrum, H., M. Roberts and J.H. Crosa, 1992. Identification and cloning of a tetra-cycline resistance gence<br />
from the fish pathogen Vibrio salmonicida. Antimicrobial Agents and Chemotherapy. 36:611-615.<br />
Tanasomwan, V. and K. Saitanu. 1979. Ulcer disease in strided catfish (Pangasius pangasius). Animal. In<br />
Asian Fish Health Biblography and Abstracts I: Southeast Asia. Fish Health Section Asian Fisheries<br />
Society Manila, Philippines, 1992. Dis 2:131-133.<br />
Thien, P.C., A. Dalsgard, N.T. Nguyen, A. Olsen and K.D. Murell, 2009. Prevalence of zoonotic<br />
Trematoda parasites in fish fry and juveniles in fish farms of Mekong Delta, Việt Nam. Aquaculture.<br />
295(1):1-5.<br />
Tolmasky, M.E., L.A Actis and J.H. Crosa, 1995. Ahistidine decarboxylase gene encoded by the Vibrio<br />
anguillarum plasmid pJM1 is essential for virulence: histamne is a precursor in the biosynthesis of<br />
anguibactin. Molecular Microbiology. 15:87-95.<br />
Toranzo, A.E. and J.L. Barja, 1990. Review of the taxonomy and seroepizootiology of Vibrio<br />
anguillarum, with special reference to acquaculture in the northwest of Spain. Diseases of Aquatic<br />
Organisms. 9:73-82.<br />
Trần Ngọc Tuấn. 2010. Phân lập và định danh nấm trên cá rô đồng (Anabas testudineus) nuôi thâm canh.<br />
Luận văn tốt nghiệp cao học. Khoa Thủy Sản - Trường Đại Học Cần Thơ.<br />
Trương Quốc Phú. 2006. Quản lý chất lượng nước nuôi trồng thủy sản. Khoa Thủy Sản. Trường Đại Học<br />
Cần Thơ. 201 trang.<br />
Wiklund, T. and L. Lonnstrom, 1994. Occurrence of Pseudomonas anguilliseptica in Finnish fish farms<br />
during 1986 – 1991. Aquaculture 126:211-217.<br />
Yunia A.T., H.W. Palm and T. Walter, 2007. Crustacean fish parasites from Segara Anakan Lagoon,<br />
Java, Indonesia. Parasitology Research, 100(6):1193-1204.
FINAL REPORTS: INVESTIGATIONS 2009–2011<br />
A B<br />
C D<br />
E F<br />
Figure 7: Experimentally infected with Achlya sp. VN1101: A) Fungal isolate Achlya sp. VN1101<br />
in broth GY; B) washed in tap water in 3 times; C) Incubation in tap water; D) conidia fillter; E)<br />
Conidia solution; F) Adjusment conidia for experiment infection; G) Intramuscularly infected with<br />
0.1 mL conidia.<br />
328<br />
G
329<br />
FINAL REPORTS: INVESTIGATIONS 2009–2011<br />
Figure 8: Experimentally infected with Achlya sp. VN1101: A) Clinical sign as siminar as fungal<br />
infection in pond (arrow); B) Reisolated fungal Achlya sp. VN1101 on GYA at 28 o C, after 3 days<br />
incubation.<br />
A<br />
B
FINAL REPORTS: INVESTIGATIONS 2009–2011<br />
B C<br />
D<br />
Figure. 9: Fungal Acremonium infected on snakehead fish in growth out pond: A) White skin with<br />
excess mucus; B) Colony of Acremonium; C) fungal with septate (1000x); D) Conidia (arrow, 1000x); E)<br />
Conidiophore (arrow, 1000x).<br />
330<br />
A<br />
E
331<br />
FINAL REPORTS: INVESTIGATIONS 2009–2011<br />
Figure. 10: Fungal Fusarium infected on snakehead fish in growth out pond: A) Concentrated mucus and<br />
rough scales; B) Colony Fusarium isolate on GYA at 28 o C after 6 days incubation; C) Fungal hyphae<br />
with septate (arrow, 1000x); D) Conidiophore (arrow) (stained with cotton-blue, 1000x); E) Conidia with<br />
septate (arrow, 1000x).
FINAL REPORTS: INVESTIGATIONS 2009–2011<br />
A B<br />
C<br />
E<br />
Figure 11: Fungus Geotrichum infected on snakehead fish in growth out pond: A) access mucus and<br />
rough scales; B) white spot; C) Colony Geotrichum isolate on GYA at 28 o C after 6 days incubation; D)<br />
Fungal hyphae with septate (arrow, 1000x); E) Conidiophore (arrow) (stained with cotton-blue, 1000x);<br />
E) Conidia with septate (arrow, 1000x).<br />
332<br />
D<br />
F
A<br />
C<br />
333<br />
FINAL REPORTS: INVESTIGATIONS 2009–2011<br />
Figure 12: Bacteria Aeromonas isolated from snakehead fish disease in growth out pond: A) fish with red<br />
spot on body (arrow); B) Liver with red spot (arrow); C) Colony of isolate Aeromonas on TSA; D) Short<br />
rod shape and Gram negative (1000x).<br />
B<br />
D
FINAL REPORTS: INVESTIGATIONS 2009–2011<br />
Mortality (%)<br />
100<br />
90<br />
80<br />
70<br />
60<br />
50<br />
40<br />
30<br />
20<br />
10<br />
0<br />
Control<br />
NaCl<br />
10^4<br />
10^5<br />
10^6<br />
10^7<br />
1 2 3 4 5 6 7 8 9 10 11 12 13 14<br />
Days after injection<br />
Figure 13: The cumulative mortality of snakehead fish experimentally injected with Aeromonas<br />
hydrophila CT1107.<br />
A B<br />
Figure 14: Bacterial isolate Aeromonas hydrophila CT1107 reisolated from experimental injected fish:<br />
A) Aeromonas hydrophila on TSA; B) Shape of Aeromonas hydrophia Gram negative, rod (1000x).<br />
334<br />
B
335<br />
FINAL REPORTS: INVESTIGATIONS 2009–2011<br />
Figure 15: PCR for detected Aeromonas hydrophila: Band M: Maker; Band 1: Negative control (-)<br />
Aeromonas hydrophila; Band 2: Possitive control (+) Aeromonas hydrophila; Band 3: samples isolate<br />
CT1107, Band 4: samples isolate CT1109.<br />
A B<br />
C D<br />
Figure 16: Bacteria Edwardsiella isolated from snakehead fish disease in growth out pond: A) fish with<br />
ulcerative on body; B) Kidney with white nodules; C) Colony of isolate Edwardsiella on TSA; D) Rod<br />
shape and Gram negative (1000x).
FINAL REPORTS: INVESTIGATIONS 2009–2011<br />
A B<br />
C D<br />
Figure 17: Bacteria Streptococcus isolated from snakehead fish disease in growth out pond: A) fish with<br />
ulcerative on body; B) Kidney dark red; C) Colony of isolate Streptococcus on TSA; D) Sphere shape and<br />
Gram possitive (1000x).<br />
336
Table 1: Water quality parameters on snakehead fish cultured pond in An Giang and Dong Thap Province in 2010<br />
Parameters<br />
Temperature<br />
pH<br />
DO<br />
( o C)<br />
(ppm)<br />
N-NH4 +<br />
N-NO2 -<br />
N-NO3 -<br />
(ppm)<br />
(ppm)<br />
(ppm)<br />
Location<br />
(Province)<br />
An Giang<br />
Dong Thap<br />
An Giang<br />
Dong Thap<br />
An Giang<br />
Dong Thap<br />
An Giang<br />
Dong Thap<br />
An Giang<br />
Dong Thap<br />
An Giang<br />
Dong Thap<br />
Samples<br />
site<br />
Pond 30.3±0.58<br />
337<br />
Cultured period (month)<br />
FINAL REPORTS: INVESTIGATIONS 2009–2011<br />
1 2 3 4 5 6<br />
31.7±0.58 28.3±0.58 32.7±0.00 32.0±0.00 30.3±0.29<br />
inlet 30.3±0.58 31.0±1.00 29.0±0.00 32.0±0.00 32.3±0.58 30.0±0.00<br />
Pond 31.3±0,58 30.3±0.29 26.7±0.58 32.5±0.50 30.3±0.58 31.0±0.00<br />
inlet 30.0±0.00 31.0±0.00 29.7±0.58 31.7±0.58 31.0±0.00 30.7±0.58<br />
Pond 7.48±0.05 7.65±0.05 7.25±0.09 7.95±0.57 7.81±0.52 7.80±0.25<br />
inlet 6.93±0.09 7.49±0.21 7.19±0.15 7.34±0.19 7.11±0.03 7.25±0.07<br />
Pond 7.80±0.53 7.35±0.04 7.32±0.09 7.63±0.10 7.33±0.04 7.48±0.09<br />
inlet 7.06±0.06 7.10±0.06 7.06±0.06 7.08±0.04 7.06±0.04 7.11±0.09<br />
Pond 5.18±0.11 5.10±0.23 4.91±0.89 4.58±1.79 4.38±1.35 4.11±0.21<br />
inlet 5.20±0.02 5.20±0.14 4.95±1.18 4.65±0.27 4.43±0.67 4.12±1.11<br />
Pond 4.86±1.01 4.35±0.32 4.68±0.20 4.43±0.76 4.57±0.34 4.29±0.71<br />
inlet 5.15±0.30 4.56±0.91 4.87±0.19 4.54±0.37 4.76±0.93 4.36±0.47<br />
Pond 1.25±0.98 1.75±0.51 1.39±0.11 1.53±0.13 1.58±0.22 1.84±0.33<br />
inlet 0.04±0.02 0.11±0.02 0.08±0.04 0.41±0.52 0.07±0.05 0.25±0.18<br />
Pond 1.28±0.96 1.59±0.56 1.43±0.31 1.64±1.35 1.79±0.94 1.95±0.78<br />
inlet 0.03±0.01 0.05±0.04 0.02±0.01 0.03±0.00 0.05±0.04 0.08±0.01<br />
Pond 0.066±0.013 0.083±0.051 0.225±0.028 0.304±0.057 0.321±0.061 0.329±0.216<br />
inlet 0.010±0.003 0.023±0.010 0.057±0.046 0.035±0.032 0.011±0.007 0.061±0.038<br />
Pond 0.040±0.021 0.056±0.007 0.075±0.010 0.131±0.063 0.144±0.090 0.209±0.162<br />
inlet 0.020±0.002 0.031±0.018 0.025±0.005 0.032±0.010 0.023±0.016 0.042±0.038<br />
Pond 0.434±0.348 1.735±0.532 1.196±0.490 0.472±0.160 0.520±0.233 0.470±0.278<br />
inlet 0.066±0.048 0.163±0.032 0.093±0.044 0.033±0.034 0.044±0.027 0.104±0.068<br />
Pond 1.066±0.352 1.229±0.387 0.355±0.072 0.301±0.089 0.301±0.089 0.266±0.050<br />
inlet 0.099±0.007 0.224±0.053 0.081±0.021 0.110±0.010 0.117±0.048 0.072±0.054
FINAL REPORTS: INVESTIGATIONS 2009–2011<br />
Table 2: Water quality parameters on snakehead fish cultured pond in Co Do District. Can Tho Province in 2010-2011<br />
Parameters Samples site<br />
Temperature<br />
pH<br />
DO<br />
N-NH4 +<br />
N-NO2 -<br />
N-NO3 -<br />
( o C)<br />
(ppm)<br />
(ppm)<br />
(ppm)<br />
(ppm)<br />
338<br />
Cultured period (month)<br />
2 3 4<br />
Pond 28.05±0.75 28.80±0.14 28.65±0.49<br />
inlet 27.3 28.5 27.7<br />
Pond 8.18±0.09 8.39±0.09 8.75±0.16<br />
inlet 8.36 8.43 8.78<br />
Pond 4.81±1.21 4.68±0.29 4.51±0.92<br />
inlet 5.12 4.93 4.66<br />
Pond 1.54±0.06 1.56±0.07 1.59±0.08<br />
inlet 0.09 1.26 1.62<br />
Pond 0.03±0.01 0.07±0.00 0.08±0.01<br />
inlet 0.12 0.14 0.27<br />
Pond 0.04±0.01 0.28±0.22 0.53±0.01<br />
inlet 0.07 0.06 0.07
Table 3: Water quality parameters on snakehead fish fingerling cultured pond in Tam Nong District. Dong Thap Province in 2011<br />
Parameters Location (Province) Samples site<br />
Temperature( o C) Dong Thap<br />
pH Dong Thap<br />
339<br />
Nursing period (week)<br />
2 3<br />
FINAL REPORTS: INVESTIGATIONS 2009–2011<br />
Pond 31.83±0.56 31.55±0.26<br />
inlet 31.87±0.58 31.60±0.46<br />
Pond 8.30±0.32 8.48±0.19<br />
inlet 8.43±0.45 8.10±0.26<br />
DO (ppm) Dong Thap Pond 4.52±0.12 4.23±0.97<br />
N-NH4 + (ppm)<br />
N-NO2 - (ppm)<br />
N-NO3 - (ppm)<br />
Dong Thap<br />
Dong Thap<br />
Dong Thap<br />
inlet 5.18±1.02 4.97±0.56<br />
Pond 1.16±0.31 2.27±1.14<br />
inlet 0.63±0.23 1.21±0.17<br />
Pond 0.09±0.05 0.04±0.02<br />
inlet 0.09±0.03 0.05±0.01<br />
Pond 0.31±0.18 0.31±0.24<br />
inlet 0.27±0.04 0.26±0.16
FINAL REPORTS: INVESTIGATIONS 2009–2011<br />
Table 4: Parasitic incedence on snakehead fish in growth out pond in An Giang and Dong<br />
Thap Provinces in 2010<br />
No. Parasites found Site infected Intensity of infection Infected rate (%)<br />
1 Trichodina Skin, gill 1-25 ind/observation 93.66<br />
2 Epistylis Skin, gill 2-39 ind/observation 71.83<br />
3 Chilodonella Skin, gill 1-7 ind/observation 13.38<br />
4 Gyrodactylus Gill 1-4 ind/lame 12.68<br />
5 Trianchoratus Gill 1-3 ind/lame 5.63<br />
6 Proteocephalus Intestine 1-5 ind/lame 3.52<br />
7 Spinitectus Stomach 1-15 ind/stomach 19.01<br />
8 Pallisentis Stomach 2-11 ind/intestine 16.9<br />
9 Henneguya Gill 1-5 ind/observation 3.52<br />
340
341<br />
FINAL REPORTS: INVESTIGATIONS 2009–2011<br />
Table 5: Parasites found on fish based on monthly cultured by Provinces in 2010<br />
No Parasites found<br />
1 Trichodina<br />
Site<br />
infect<br />
ed<br />
Skin<br />
An Giang Province Dong Thap Province<br />
Cultured period (Mon)<br />
Cultured period<br />
(Mon)<br />
1 2 3 4 5 6 1 2 3 4 5 6<br />
+ + +<br />
2 Apiosoma + + + +<br />
3 Myxobolus + + + + + + +<br />
4 Epistylis + + + +<br />
5 Gyrodactylus + + + + + + + + + +<br />
6 Tripartiella + + + +<br />
7 Lernaea + + +<br />
8 Argulus + + + +<br />
9 Henneguya<br />
Gill<br />
+ + +<br />
10 Chilodonella + +<br />
11 Trichodina + + + +<br />
12 Trianchoratus + +<br />
13 Lamproglena +<br />
14 Ergasilus + +<br />
15 Gyrodactylus + + + + + + + +<br />
16 Haplorchis<br />
Fin<br />
17 Clonorchis +<br />
18 Exochis +<br />
19 Polyonchobothrium<br />
Intestine<br />
+<br />
+ +<br />
20 Proteocephalus + +<br />
21 Neocamallanus + + + + + +<br />
22 Pallisentis + + + + + + +<br />
23 Spinitectus<br />
Stomach<br />
+ + + + + + + +<br />
24 Neocamallanus + + + + +<br />
25 Gnathostoma +<br />
26 Capillaria +<br />
27 Neocamallanus SB<br />
Note: SB: Swim Bladde; (+): Parasite present<br />
+
FINAL REPORTS: INVESTIGATIONS 2009–2011<br />
Table 6: Fungus infected on snakehead fish in growth out pond in An Giang and Dong Thap<br />
Provinces in 2010<br />
No. Fungus<br />
An Giang Province Dong Thap Province<br />
Cultured period<br />
(Mon)<br />
342<br />
Cultured period<br />
(Mon)<br />
1 2 3 4 5 6 1 2 3 4 5 6<br />
1 Achlya + +<br />
2 Fusarium + + +<br />
3 Acremonium + + +<br />
4 Geotrichum + + + +<br />
(+): Fungus present<br />
Table 7: Bacteria isolated from snakehead fish in growth out pond in An Giang and Dong Thap<br />
Provinces in 2010<br />
No. Bacteria<br />
An Giang Province Dong Thap Province<br />
Cultured period (Mon) Cultured period (Mon)<br />
1 2 3 4 5 6 1 2 3 4 5 6<br />
1 Pseudomonas + + + +<br />
2 Aeromonas + + + + + + + + + + +<br />
3 Edwardsiella + +<br />
4 Vibrio + + + +<br />
5 Streptococcus + +<br />
(+): Bacteria present
343<br />
FINAL REPORTS: INVESTIGATIONS 2009–2011<br />
Table 8: Biochemical characteristics of bacterial isolates from snakehead fish diseases in growth<br />
out pond in 2010-2011<br />
Bacterial isolate Namely Gram Motility Oxidase Catalase O/F O/129<br />
DT1012* - + + + +/+ -<br />
CT1101 - + + + +/+ -<br />
CT1102 - + + + +/+ -<br />
CT1103 - + + + +/+ -<br />
CT1104 - + + + +/+ -<br />
CT1105 - + + + +/+ -<br />
CT1106 - + + + +/+ -<br />
CT1107 - + + + +/+ -<br />
CT1108 - + + + +/+ -<br />
CT1109 - + + + +/+ -<br />
CT1110 - + + + +/+ -<br />
CT1111 - + + + +/+ -<br />
CT1112 - + + + +/+ -<br />
* Bacterial isolate for experimental injection<br />
DT: Dong Thap; CT: Can Tho
FINAL REPORTS: INVESTIGATIONS 2009–2011<br />
Induced Spawning and Larval Rearing of the “Chame” Dormitator<br />
latifrons in Laboratory Conditions<br />
Indigenous Species Development/Experiment/09IND03UH<br />
Gustavo A. Rodriguez Montes de Oca, Jose Cristobal Román Reyes, Eva Medina Hernandez,<br />
Jeniffer Velazquez Sandoval, Vanesa Lopez, Antonio Jiménez and Enrique Nuño<br />
Universidad Autónoma de Sinaloa<br />
Mazatlán, Sinaloa, México<br />
Maria Haws and Armando Garcia<br />
<strong>University</strong> of Hawai’i at Hilo<br />
Hilo, Hawai’i, USA<br />
Konrad Dabrowski<br />
Ohio <strong>State</strong> <strong>University</strong><br />
Columbus Ohio, USA<br />
Maria Celia Portella and Natalia de Jesus Leitão<br />
Universidade Estadual Paulista<br />
Jaboticabal, Brazil<br />
ABSTRACT<br />
The proposed research is focused on the production of chame (Pacific Fat Sleeper) juveniles for<br />
aquaculture and research purposes. Spawning was achieved using several delivery techniques for<br />
LHRHa. A series of experiments over two years have been conducted, during year 1 (2010) a trial<br />
was conducted using recently caught broodstock and for the year 2 (2011) a similar trial was carried<br />
out using breeders both males and females, with a whole year in captivity with the following<br />
treatments: control group (0.9% saline solution), Desgly 10 -Ala 6 LHRHa, Ovaprim® or a single<br />
implant of 75 µg Ovaplant®. Spawning results showed 80-100% success within 24h-48h for the<br />
Ovaplant group, 25-50% for LHRHa but 0% for Ovaprim within 48-72h for both years. Obtained<br />
data describes as oocyte size as 300 µm and a relative fecundity of 50,000 to 80,000 cells per gram.<br />
All LHRHa delivery treatments were effective to induce spermiation in volumes from 0.5 to 10 ml<br />
per male; however several males released sperm naturally up to 1 ml throughout the reproductive<br />
season. Data indicates that sperm activation time is close to 4 minutes, and overall concentration is<br />
within the range of 1 to 2X10 9 cells per milliliter. Increased sperm motility is achieved after<br />
predilution on a 1:10-1:40 ratio in Ringer´s solution. As optimal salinity values, both for<br />
fertilization and egg incubation, our results indicate that there is no sperm activation above 5‰ of<br />
salinity. Data was recorded for optimal incubation salinity, as initially no hatching was observed<br />
above 15‰ salinity, although fertilized eggs can be transferred directly to salinities between 0-12‰<br />
with no negative impact on hatching rate, total length (µm) yolk sack diameter and lipid drop size<br />
among salinity treatments. Extensive data has been recorded on incubation time at 26-28°C as 14<br />
hours, hatching size of larvae (1-1.4 mm), time for yolk absorption (26-32 hours post fertilization<br />
hpf) and eye and mouth appearance time (30-40 hpf). Several feeding trials were conducted to<br />
initiate exogenous feeding; during year 1, feeding trails included live fresh water microalgae, dry<br />
powered microalgae, yeast and probiotics, and filtrated water from rotifer and tilapia rearing tanks<br />
and biofloc either as a single feed or a combination of 2 or 3 feeding treatments at a larval density<br />
344
345<br />
FINAL REPORTS: INVESTIGATIONS 2009–2011<br />
of 0.25-0.5 larvae per ml. For year two, we conducted a series of feeding trial using enriched<br />
rotifers or dry feeds, either at 0‰ or daily increments of 1.5‰ or fixed salinities within 2-8 ‰.<br />
Larvae from all trials on year one survived for only 6 days post fertilization at rearing temperature,<br />
with 100% mortality afterwards. However, last results for year 2 indicate that the use of either<br />
artificial plankton or an artemia substitute (2-8‰ rearing salinity) had values within 20-50%<br />
survival by day 6; although no survival was recorded after utilization of enriched rotifers. As<br />
preliminary conclusion, there is an apparent feeding on organic particulate matter for early larval<br />
stages as digestive track develops and matures for later consumption of live feeds such as rotifers<br />
and other zooplankton organisms, fact to be later validated as continued experiments for future<br />
research.<br />
INTRODUCTION<br />
Chame (Dormitator latifrons) (Fig. 1) also known as puyeque, popoyote, chalaco, Fat sleeper<br />
among other is a species of special interest for aquaculture. At present, medium-scale commercial<br />
aquaculture in Ecuador, as well as initial experiences of chame culture in Mexico, are conducted<br />
with wild caught juvenile fish. There is also interest in this fish in Nicaragua, where freshwater<br />
fishes such as tilapia are currently fetching higher prices than cultured shrimp. Therefore, the goals<br />
of this work are focused on the production of juveniles under laboratory conditions and minimize<br />
the dependency on wild fish supply. Available information indicates that in Ecuador, chame<br />
aquaculture has continuously decreased over the last eight years due to the shortage of juvenile fish<br />
since controlled propagation has not been achieved. Research in this area was largely abandoned<br />
over ten years ago, but most available references are available through a series of books, thesis and<br />
non-published reports from several institutions in Ecuador, with information on basic biology<br />
(Bonifaz et al 1985) and culture trials (Ecocostas, 2006) as well as reported production statistics of<br />
1500 MT per year (FAO, 2009). For Mexico, there is a steadily demand on the central and the<br />
southern Pacific Coast. Also, as surveyed by the authors, there are already fish farmers interested in<br />
acquiring laboratory produced juveniles for commercial aquaculture in Oaxaca <strong>State</strong>, as a few<br />
preliminary growth-out trials have been conducted (Castro-Rivera et al, 2005). In addition, the<br />
species is not considered for protection under Mexican laws, and controlled juvenile production will<br />
provide a considerable benefit for the diversification of fish culture in Mexico. The main goals of<br />
this project are the following: 1) attempt hormonally induced reproduction by outlining the viability<br />
of the utilization of newer spawning techniques; 2) fertilization and egg incubation at different<br />
salinities to evaluate hatching success; 3) establish the viability of the initiation of exogenous<br />
feeding throughout a series of trials using both live and dry food as potential starter diets. This<br />
reports details the advances on the control of induced reproduction both in males and females,<br />
relevant details on the reproductive and early stages biology of the species and the results of the of<br />
larval rearing in laboratory conditions.<br />
MATERIALS AND METHODS<br />
Objective 1: Induced spawning and spermiation using synthetic analogues of luteinizing<br />
hormone releasing hormone (LHRHa).<br />
Adult fish with a minimum size of 10 cm total length were collected within a 60 mile radius of<br />
Mazatlán Sinaloa, México and later transported and acclimated in FACIMAR-UAS facilities<br />
(23°12´57” N; 106°25´31” W). Fish were fed with a combination of 60% floating pellets (32%<br />
protein 8% lipids) and 40% sinking pellets (35% protein 10% lipid) (PURINA®). Fish of both<br />
genders were identified by the differences on the genital papilla and tagged using PIT-Tags (Passive<br />
Integrated Transponder tag, Biomark®) and potential breeders with visible signs of gonad<br />
maturation such as swollen abdomen, significant individual weight gain and changes in coloration<br />
on males and females, both in the papilla and the abdomen (Bonifaz et al, 1985; Estuardo
FINAL REPORTS: INVESTIGATIONS 2009–2011<br />
Campoverde, pers. comm.) were separated and monitored; however gonad biopsies were not<br />
possible due to the significantly reduced size of the pore at the papilla.<br />
A series of experiments were conducted over two years. For year 1 (2010) 16 females were divided<br />
into the following groups: control group (0.5 ml/kg 0.9% saline solution), Desgly 10 -Ala 6 LHRHa<br />
injected at 40 µg/kg (priming dosage) and 80 µg/kg (resolving dose), or injections of Ovaprim® at<br />
0.5 ml/kg or a single implant 75 µg (Ovaplant®)., for year two (2011) 20 females divided into the<br />
following groups: control group (0.5 ml/kg 0.9% saline solution), Desgly 10 -Ala 6 LHRHa injected at<br />
40 µg/kg (priming dosage) and 80 µg/kg (resolving dose), 2 injections of Ovaprim®, 0.5 ml/kg as<br />
priming dose and 1.0 ml/kg as resolving dose or a single implant 75 µg (Ovaplant®). In all cases,<br />
variables evaluated were spawning efficiency per group (%), oocyte size (um), and relative and total<br />
fecundity.<br />
For males the conducted trials were as follows: for year 1, 16 males were divided into a control<br />
group (0.5 ml/kg 0.9% saline solution), LHRHa injected at 40 µg/kg, Ovaprim® at 0.5 ml/kg or a<br />
single implant 75 µg (Ovaplant®); For year 2, 20 fish were used for an experiment was carried out<br />
using a control group (0.5 ml/kg 0.9% saline solution), either 40 or 80µg/kg Desgly 10 -Ala 6 LHRHa<br />
or Ovaprim® at 0.5 ml/kg at 5 fish per treatment. Studied variables for sperm quality were collected<br />
sperm volume, motility percent, and activation time and sperm concentration per treatment.<br />
Objective 2. Effect of water salinity on fertilization, egg incubation and hatching success.<br />
An protocol for sperm activation and fertilization as well as hatching success in terms of water<br />
salinity was conducted as follows: sperm samples were pre-diluted in ringer´s solution at several<br />
dilution ratios (1:1-1:40) (Arias-Rodriguez L. UJAT-Tabasco, per. comm.) as sperm viscosity was<br />
too high to allow effective activation with direct dilution in activation media (10 µm filtered, UV<br />
sterilized water). Once pre-dilution was completed, again 50-100 µl of Ringer´s diluted sperm<br />
samples were activated in 900 µl of activation media (0, 5, 15, 25, 35, 45, 55 and 65 ‰) to establish<br />
best activation conditions as water salinity value.<br />
During year 1, once spawns were achieved, water salinity incubation conditions were estimated by<br />
placing 1000-1500 fertilized eggs in 1 l containers with 10 µm filtered, UV sterilized water at 0, 5,<br />
15, 25, 35, 45, 55 and 65 ‰ with three replicas per salinity. Survival (%) per salinity and total<br />
length and morphological characteristics of larvae at hatching and thereafter were observed using<br />
digital image analysis with Motic Image Plus 2.0 software (Fig. 1).<br />
For year 2, as continued study for optimal larval incubation and hatching conditions, 200 fertilized<br />
eggs were placed by triplicate in water previously adjusted to 0, 2, 4, 6, 8, 10 and 12 ‰ for later<br />
evaluation of hatching rate (%), total length yolk size diameter and oil drop size at hatching, again<br />
using digital image analysis with Motic Image Plus 2.0 software (Fig. 1), this procedure was<br />
repeated for several trials.<br />
Objective 3: Effect of water salinity, food type and availability on larval survival and growth<br />
after yolk sack absorption.<br />
For year 1, several trials were conducted using the following feeds: 50-80,000 cell/ml of Chlorella<br />
and Scenedesmus as freshwater phytoplankton, 50µm filtrated water (5-10 ml/day) from a rotifer<br />
Brachionus rotundiformis rearing tank, micropowdered Spirulina
347<br />
FINAL REPORTS: INVESTIGATIONS 2009–2011<br />
conducted considering an increment of 1.5 ‰ salinity per day using a combination of 2 or 3 of the<br />
previously mentioned feeds. Here, larvae from experiments were measured for survival, length<br />
increments, gut content (Rocha et al. 2008), and modified Fulton´s condition index (Sarnowski and<br />
Jezierska 2007), as well as fixation of larvae from several treatments in 10% buffered formalin for<br />
24h and preserved in 75% ethanol afterwards. Several larvae were embedded in Historesin (Leica)<br />
and stained with Harris hematoxilin and eosin for optical analysis at the Aquaculture Center,<br />
UNESP Brazil.<br />
For year 2, a new series of dry feeds as well as enriched rotifers were used in several feeding trials<br />
as follows: a first experiment using Artificial plankton 50 um particle size (Argent®) at 2 mg/l,<br />
ArteMac 0 (Aquafauna Bio-Marine Inc.®) at 4.5 mg/l, Encapsulon 0 rotifer substitute (30 um) 10<br />
mg/l (Argent®) and Encapsulon 1 (50 um, Argent®) 20 mg/l; a second experiment using live<br />
rotifers as follows: control group (unenriched rotifers), enriched rotifers with Culture HUFA (Salt<br />
Creek Inc®), enriched rotifers with Protein HUFA (Salt Creek Inc®) and rotifers enriched with<br />
Algamac Protein Plus (Aquafauna Bio-Marine Inc.®) at a equal concentration of 5-8 rotifers per ml<br />
for all treatments, twice a day; both experiments were conducted at a rearing salinity of 0‰ in 1 l<br />
semi-clear plastic containers. Afterwards, three more experiments were conducted, with 2 trials<br />
using the same feeding treatments mentioned above (both live and dry feeds) but considering a<br />
gradual 1.5‰ salinity increment per replicate per day, starting with replicate 1 on the first day, both<br />
replicates 1 and 2 for the second day, etc. in 3 l clear plastic containers. At last, another experiment<br />
was conducted using a combination of 50,000 cels/ml of NANNO 3600 microalgae concentrate<br />
(Reed Mariculture Inc.) and 3 mg/l of Epicin (Epicore®) for all experimental units, using each one<br />
of the feeding treatments listed for the first experiment, with four replicates per feeding groups,<br />
each one at a different salinity of 2, 4, 6 and 8‰ in 1 l semi-clear plastic containers. For all cases,<br />
survival was estimated 6 days post hatching, and larvae from each feeding treatment and salinity<br />
were fixated either on 4% paraformaldehyde or Karnovski´s fixative for later histochemical<br />
analysis. Also, digital images of apparent digestive activity were obtained with a phase contrast<br />
optical microscope.<br />
Objective 4. Studies on the utilization of artificial diets for weaning of chame larvae<br />
Once larval feeding activity is observed, larvae will be fed with live rotifers Brachionus plicatilis<br />
and Artemia nauplii in a sequence as initial food and then 7 or 14 day old larvae/juveniles will be<br />
weaned to formulated diets as follows: (1) a commercial diet, (2) an experimental casein-gelatin<br />
based diet with maca meal as attractant, (3) an experimental diet based on freeze-dried preparation<br />
of fish muscle, (4) freshly hatched brine shrimp nauplii. Both experimental diets will be formulated<br />
based on our previous experience and will be isonitrogenous (protein requirement: 55% for most<br />
larval fish, Dabrowski 1986). At the end of the experiment, growth performance will be evaluated<br />
in terms of final individual body weight, survival (%), specific growth rate (SGR, %) and weight<br />
gain (%). Fish from each dietary treatment will also be sampled for proximate body analysis (water,<br />
protein, lipid, ash) if the size at the termination of the rearing period will permit (at least 0.5 g<br />
individual weight).<br />
RESULTS<br />
Objective 1.<br />
For year 1, spawning results showed 80-100% success within 24h-48h for the Ovaplant group, 25-<br />
50% for LHRHa but 0% for Ovaprim within 48-72h. Obtained data describes as oocyte size as<br />
300±50 µm and a relative fecundity of 80,000 to 100,000 cells per gram (Table 1). All LHRHa<br />
delivery treatments were effective to induce spermiation in volumes from 0.5 to 10 ml per male<br />
(LHRHa injected at 40 or 80 µg/kg, Ovaprim® at 0.5 ml/kg or a single implant 75 µg (Ovaplant®);<br />
however several males released sperm naturally up to 1 ml throughout the reproductive season
FINAL REPORTS: INVESTIGATIONS 2009–2011<br />
(Table 3). Obtained data indicates that sperm activation time is close to 4 minutes, and overall<br />
concentration is within the range of 1 to 2X10 9 cells per milliliter (Table 3). Sperm activation is<br />
highly improved after predilution on a 1:10-1:40 ratio in Ringer´s solution. No spermatocrit values<br />
were recorded as chame sperm viscosity probed to high in undiluted sperm.<br />
For year 2, using one year captive broodstock, reproductive parameters did not change significantly<br />
from those observed on year 1. Again females from the Ovaplant group did spawn within 24-48<br />
hours of implantation and females from the LHRHa treatment spawned 24-48 hours after injections,<br />
both at 80% efficiency (n=5 per treatment). Relative fecundity was close to 800,000 cells per<br />
female, with no natural spawns observed (Table 2). As sperm quality, there was an apparent<br />
reduction on released amounts per treatment, as well as reduction of 20% on activation values and<br />
50-60% total activation time as well as estimated sperm concentration values in 30-40% (Table 4)<br />
Objective 2.<br />
As optimal salinity values, both for fertilization and egg incubation, our results indicate that there is<br />
no sperm activation above 5‰ of salinity. Data was recorded for optimal incubation salinity, as<br />
initially no hatching was observed above 15‰ salinity, although fertilized eggs can be transferred<br />
directly to salinities between 0-12‰ with no negative impact on hatching rate, total length (µm)<br />
yolk sack diameter and lipid drop among salinity treatments (Fig. 3). Therefore all fertilization<br />
procedures were conducted in 1 µm filtered, UV sterilized fresh water. The values of hatching size,<br />
yolk sack and oil drop diameter were not affected by rearing salinity on values of 0, 2, 4, 6, 8, 10 or<br />
12 ‰ as observed in several trials (n=3). As example, for trial 1 values for total length at hatching<br />
were 1541.1±73.5 µm, yolk sack diameter 146.6±13.2 µm and oil drop 81.4±10.3 µm (Fig. 3). It is<br />
important to mention that larvae were photographed also at 3 and 5 days post hatching with<br />
interesting results as unfed larvae survival, given that most remaining larvae were found at salinities<br />
of 2, 4, 6 and 8 ‰.<br />
As morphological description, eggs are transparent and spherical with a 300 µm average diameter<br />
and have an adhesive layer (Fig. 4a). Hatching occurs at 14-17 hours at 26°C, initial larvae length is<br />
close to 1288.2±137.2 µm, yolk sack diameter is around 171.2±10.6 µm with a single oil drop, no<br />
eyes or mouth are visible and show a vertical floating position with no active movement (Fig. 4b).<br />
At 24 h (1 day posthatching DPH), yolk sack diameter reduces to 137.1±8.3 µm, eyes are<br />
perceptible, with no pigmentation and digestive tract is noticeable (Fig. 4c). Mouth opening occurs<br />
at 2 DPH, ayes are well pigmented and digestive tract structures become more discernable<br />
(intestine, vestigial anus); yolk sack diameters is significantly smaller 93.8±10.7 µm (Fig. 4d). At 3<br />
DPH, yolk sack is fully consumed and oral movements are perceptible and digestive tract has an<br />
evident circumvolution and pigmentation (Fig. 4e). Anus fully opens at 4 DPH, and some other<br />
internal structures are visible (i.e. liver) and body pigmentation increases considerably (Fig 4f).<br />
Objective 3<br />
Several feeding trials were conducted to attempt initiation of exogenous feeding. For year 1, larvae<br />
from all trials survived for only 5-7 days post fertilization at rearing temperature (26-29°C), with<br />
100% mortality afterwards. Observed data both on length increment or condition index, were not<br />
significant different among diets or rearing salinity, figures 5a and 5b exemplify observed values<br />
for these two variables for larvae reared in a salinity gradient. For intestinal content, a few larvae<br />
showed particles inside the digestive track, particularly when feed in a combination of Algamac<br />
plus yeast or spirulina (Fig 6a). As mentioned a few larvae were processed for histological analysis<br />
(Fig. 9 and 10) with a few noticeable structures such as remnants of yolk inside the peritoneal cavity<br />
(Fig. 9) and the presence of an apparent digestive gland (pancreas) 6 days after hatching, although<br />
further analysis will be conducted for histochemistry on newly obtained larvae as continued studies<br />
for a preliminary depiction for enzymatic activity on early stages of chame larvae.<br />
348
349<br />
FINAL REPORTS: INVESTIGATIONS 2009–2011<br />
For year two, the inclusion of fresh water rotifers as live feed (non and bioenriched) as well as a<br />
new series of artificial diets, either in fresh water, salinity gradient of fixed salinities (2, 4, 6 and 8<br />
‰) did not showed different results in larvae survival, although as described in Figure 7, there was<br />
still a significant number of surviving larvae in two of four treatments, Artificial plankton and<br />
Artemac in combination with 50,000 cells/ml NANNNO 3600 and 3 mg/l of Epicin probiotic. At<br />
this moment the same trial is been replicated to substantiate this particular finding. Phase contrast<br />
microscopy analysis of live larvae fed with these two treatments allowed to observed large<br />
quantities of particles inside the digestive tract (Fig. 6b).<br />
Objective 4<br />
As no larvae has been successfully until the point of live feed consumption or beyond 7 days post<br />
hatching, no results were obtained for this particular objective; although at present moment feeding<br />
trails are still in progress.<br />
DISCUSSION<br />
The present report describes significant findings on the advancement of Chame broodstock and<br />
gamete management as well as egg incubation conditions as proposed in objectives 1 and 2.<br />
However, even that larvae survival has not been achieved beyond 8 days post hatching; there are<br />
important findings that will possibly allow to success in further studies.<br />
Objective 1.<br />
Induced spawning techniques are a reliable tool for laboratory condition reproduction of many fish<br />
species of relevance for aquaculture. As observed for both years, synthetic analogs of gonadotropin<br />
releasing factors such as GnRHa and LHRHa either by injection or implantation, did allow gamete<br />
release for both genders as successfully proven in many other species such as bullseye puffer both<br />
for males (Rodriguez M. de O., 2001) and females (Duncan et al, 2003), salmonids (Zohar and<br />
Mylonas, 2001), barramundi Lates calcarifer (García, 1989), stripped seabass D. labrax (Fornies et<br />
al., 2001). Implants have an advantage as the continued and prolonged release of hormones is<br />
stipulated as 50% within 2-3 hours and the remaining hormone over 8-10 hours (Crim et al, 1988),<br />
being very advantageous on Chame induced reproduction. The product Ovaprim is a valid tool for<br />
induced reproduction in many fish species mostly catfish (Sahoo et al, 2007) and ornamental fish<br />
(Yanong et al, 2009); however for chame positive results were only observed for males as increased<br />
spermiation but no oocyte release in females; whereas dosages of 0.3-0.7 ml/kg had induce spawns<br />
in spotted murrel (Channa punctatus) and catfish (Heteropneustes fossilis) (Kather Haniffa and<br />
Sridhar, 2002).<br />
Purified gonadotropins such as hCG were not considered, as previous unplublished reports and<br />
personal communication form researchers from Ecuador mentioned dosages as high as 10,000 IU<br />
per fish, when in most cases required dosages are significantly lower (10 times) as reported for<br />
leopard grouper Mycteroperca rosasea (Gracia-Lopez et al, 2004) as well as potential<br />
immunoreactivity on treated fish, reducing or eliminating the effectiveness of the treatment (Patiño,<br />
1997). Despite this information, other fish from the Eleotridae family do respond to spawning<br />
induction both with Ovaprim and HcG (Chorulon®) treatments as evaluated in Gobiomorus<br />
dormitor were 1500-3000 IU of HcG induced gamete release (Harris et al, 2011). Nevertheless we<br />
consider spawning induction with LHRHa either by injection or implantation more effective for<br />
Chame.<br />
Reduced spermiation is a recurrent problem on males in captivity; nevertheless is not apparent in<br />
newly-capture Chame, although it increases when breeders, have been in captivity for over one year<br />
as observed in our experiment. The main difference was the reduction on several sperm quality
FINAL REPORTS: INVESTIGATIONS 2009–2011<br />
parameters such as released volume, motility, time of activity and concentration from year 1 to year<br />
2; and yet sustaining the relevance of the use of LHRHa as a valid tool to induce sperm release in<br />
Chame with good quality as described for many other fish species (Zohar and Mylonas, 2001)<br />
Objective 2.<br />
Chame biology is quite interesting as salinity appears to play a major role on reproduction. Our<br />
findings indicate a low salinity tolerance both for sperm activation and fertilization, although both<br />
are closely related, hatching can occur at higher salinity values with no negative effect on larvae<br />
characteristics. Initially this factor was not considered relevant as larvae have been found in many<br />
environments; both brackish (Navarro-Rodriguez et al, 2006) and sea water (Franco-Gordo et al,<br />
2002); thus reproductive biology of Chame occurs mostly in freshwater. It is not uncommon to find<br />
this type of reproductive performance in estuarine fishes, were fertilization occurs more efficiently<br />
at low salinities but hatching is not affected by the salinity gradient for egg incubation, as reported<br />
for Fundulus heteroclitus with better fertilization values around or below 15‰ and high hatching<br />
.percentage between 10-30‰ (Bush and Weis, 1983). Therefore the main mechanism for sperm<br />
activation in Chame is an osmotic change due to environmental conditions within 0-5‰,<br />
subsequently affecting fertilization.<br />
Incubation salinity can significantly reduce larval survival and increase deformities as observed in<br />
Anguilla japonica (Okamoto et al, 2009). On a first trial (year 1) we observed zero % hatching at<br />
salinity values above 15‰; therefore for year 2 we conducted a second trial at reduced salinities, no<br />
negative effect was observed on hatching rates with values close to 95% in most cases, some fish<br />
despite of being present mostly in marine environments need a lower salinity value for early<br />
development such as Takifugu obscures, where preferred incubation salinities are between 0-8 ‰<br />
(Yang and Cheng, 2006). Other fish, Australian bass Macquaria novemaculeata, have a similar<br />
behavior as Chame where adults are mostly present in freshwater; however, when eggs are<br />
incubated on salinities between 5-35‰ there in hatching on salinities below 25‰ (Van Der Wal,<br />
1985).<br />
There are a series of studies that mention the potential effects of rearing salinity on larvae size or<br />
yolk sack utilization. At selected salinities for year 2, Chame larvae did not show any differences on<br />
larval length, yolk sack and oil drop diameter, indicating no negative effect of such incubation<br />
salinities; on the other hand, the snapper Pagrus auratus (Steward Fielder et al, 2005) and<br />
yellowtail Caranx mate (Santerre 1973) exhibit reduced sizes and differences on yolk sack<br />
utilization in high salinities salinities (>35‰), although hatching was not affected by this factor.<br />
Todd (1975) described hatching lengths smaller than those observed in our study for Chame larvae<br />
as 0.8-0.9 mm, whereas Gaudé et al (2010) described hatching sizes of 1.13±0.01 mm for<br />
Dormitator maculatus; however both studies were conducted at temperatures of 23 or 13°C<br />
respectively, a 4-14°C difference with the present work. The last study also describes that yolk sack<br />
is not fully consumed until 9 dph at a rearing temperature of 13°C and 4.4‰ salinity. Chame larval<br />
length at hatching corresponds to values described for bigmouth sleeper G. dormitor at 1.0-1.5 mm<br />
but with significantly smaller yolk sack (Harris et al, 2011)<br />
Objective 3.<br />
Fish larvae first feeding after yolk sack depletion is essential for growth and survival. As observed<br />
in our study low survival rates are not uncommon at this particular stage (Dou et al, 2000), however<br />
zero survival observed in most conducted trials in this study by day 6-7 post hatching, can also be<br />
related to species resilience as reported for unfed sargus (Diplodus sargus) as larvae survived for up<br />
to 10 days (Darias et al, 2003), thus is quite possible that Chame larvae were not able to utilize<br />
offered feeds.<br />
350
351<br />
FINAL REPORTS: INVESTIGATIONS 2009–2011<br />
Observations of particle content in larvae digestive tracts, both for year 1 or 2 do not warranty<br />
digestion of such particles, probably due to poor enzymatic activity and a probable dependence of<br />
exogenous enzymes commonly present in live feeds (Cahu and Zambonino, 2001), however the<br />
lack of consumption of offered freshwater rotifers (year 2) and other zooplankton sources (year 1)<br />
do not provide enough evidence of the contribution of exogenous enzymes to ensure food<br />
utilization. Nevertheless, there is evidence of the feasibility of rearing larvae as small as Chame<br />
larvae, considering the evidence provided by Mata et al, (2004) where grunt Orthopristis ruber with<br />
an hatching size of 1.35±0.15 mm were successfully reared with a combination of Isochrysis<br />
(microalgae), Brachionus plicatilis and Apocyclops distant copepodids.<br />
For year 1, we observed a perceptible preference for micropowdered spirulina particle ingestion, but<br />
still with no apparent utilization, while other fish larvae can be reared with this microalgae almost<br />
as successfully as when rotifers are used in knifefish Chitala chitala (Sarkar et al, 2006). Also, both<br />
for year 1 and 2, the use of probiotics or yeast did have as purpose to estimulate digestive activity,<br />
growth and metabolism as food utilization (Vine, 2006; Getasuope, 2007), but with no relevant<br />
results for year 1. On the other hand, as promising results the combination of microalgae<br />
concentrate, probiotic and artificial feeds, with some significant survival up to 6 dph during the last<br />
conducted experiment provides some tentative course to continue other similar feeding trials for the<br />
remaining of 2011 Chame reproductive season. Addition of microalgae can potentially improve<br />
larvae survival by providing nutrients (Naas et al, 1996) or visual contrast, attractants and probiotics<br />
(Olsen et al, 2000).<br />
Conclusion<br />
More research is needed to achieve Chame larval rearing, as at this moment particle ingestion of<br />
several kinds of artificial feeds has been assured after macroscopical analysis, both on fixated and<br />
live larvae. Also more research is required into obtaining a suitable live feed prey or preys along<br />
with the simultaneous evaluation of a wider selection of artificial feeds.<br />
ACKNOWLEDGEMENTS<br />
We are indebted to Joselito Audevez and Omar Serna for technical assistance at FACIMAR<br />
Mazatlán México and Prof. Fernando Zara, of the Invertebrate Morphology laboratory at UNESP<br />
Jaboticabal Brazil for facilitating the equipment for larvae histology.<br />
REFERENCES<br />
Bonifaz, N; Campos, M; Castelo, R; 1985. El Chame, una nueva fuente de alimentación e ingresos.<br />
Fundación Ciencia. 173 pp.<br />
Bush, C.P. Weis, J.S. 1983. Effect of salinity on fertilization success in two populations of Fundulus<br />
heteroclitus. Biol. Bull. 164:406-417.<br />
Cahu, C., Zambonino, J. 2001. Substitution of live food by formulated diets in marine fish larvae.<br />
Aquaculture, 200: 161-180.<br />
Castro-Rivera, R., Aguilar-Benítez, G.,. Hernández- Girón, J. P. 2005. Conversión alimenticia en<br />
engordas puras y mixtas de Popoyote (Dormitator latifrons Richardson) en estanques de<br />
cemento. Revista AquaTIC 23:45-52.<br />
Crim LW, Sherwood NM, Wilson CE. 1988. Sustained hormone release. II. Effectiveness of LHRH<br />
analog (LHRHa) administration by either single time injection or cholesterol pellet implantation<br />
on plasma gonadotropin levels in a bioassay model fish, the juvenile rainbow trout. Aquaculture<br />
74: 87-95.
FINAL REPORTS: INVESTIGATIONS 2009–2011<br />
Darias, M., Pacual, E., Cárdenas, S., y Yúfera, M. 2003. Metabolismo energético de huevos y larvas<br />
sin alimentar del sargo (Diplodus sargus) en cultivo. IX Congreso Nacional de Acuacultura.<br />
Cadiz 2003.<br />
Dou, S.Z., Seikai, T. y Tsukamoto, K., 2000. Cannibalism in Japanese flounder juveniles,<br />
Paralichthys olivaceus, reared under controlled conditions. Aquaculture 182:149–159.<br />
Duncan, N.J, G. A. Rodriguez M de O, D. Alok, Y. Zohar. 2003. Effects of controlled delivery and<br />
acute injections of LHRHa on bullseye puffer fish (Sphoeroides annulatus) spawning.<br />
Aquaculture 218, 625-635.<br />
EcoCostas. 2006. El Cultivo de Chame (Dormitator latifrons) en el Estuario del Río Cojimíes.<br />
Proyecto para la Conservación y Desarrollo del Estuario de Cojimíes (Sustainable Coastal<br />
Communities and Ecosystem Project -SUCCESS). Pp. 24.<br />
FAO, Fishstat Plus. 2009. Aquaculture production 1950-2009. [18 de Abril 2011].<br />
URL:http://www.fao.org/fishery/statistics/software/fishstat<br />
Fornies MA, Mananos E, Carrillo M, Rocha A, Laureau S, Mylonas CC, Zohar Y, Zanuy S. 2001.<br />
Spawning induction of individual European sea bass females (Dicentrarchus labrax) using<br />
different GnRHa delivery systems. Aquaculture 202: 221-234.<br />
Franco-Gordo, C., Godinez-Dominguez, E., Suarez-Morales, E. 2002. Larval fish assemblages in<br />
water off the central Pacific coast of Mexico. Journal of Plankton Research 24:775-784.<br />
Gatasoupe, F.J. 2007. Live yeasts in the gut: Natural occurrence, dietary introduction, and their<br />
effects on fish health and development. Aquaculture, 267: 20-30.<br />
Gaudé, A., Brown, C., Green, C. 2010. Awakening the sleeper: bringing Dormitator maculatus into<br />
full market potential as a premier marine bait for Louisiana. Abstract Aquaculture 2010. San<br />
Diego Californa, USA.<br />
Gracia-Lopez, V., Rodriguez-Romero, J., Perez-Ramirez, J. 2004. Inducción del desove con HCG y<br />
desarrollo embrionario y de larvas de la cabrilla sardinera Mycteroperca rosasea (Streets,<br />
1877). Ciencias Marinas, 30:279-284.<br />
Harris, N., Wesley Neal, J., Perschbacher, P.W., Mace C.E., Muñoz-Hincapíe, M. 2011. Notes on<br />
hatchery spawning methods for bigmouth sleeper Gobiomorus dormitor. Aquaculture Research.<br />
42:1145-1152.<br />
Kather Haniffa, M.A., Sridhar, S. 2002. Induced spawning of spotted murrel (Channa punctatus)<br />
and catfish (Heteropneustes fossilis) using human chorionic gonadotropin and synthetic<br />
hormone (ovaprim). Veterinarski Arch 72:51-56.<br />
Mata, E., Rosas, J., Velasquez, A., Cabrera, T. 2004. Hormonal induction to spawning and larval<br />
descritption of the grunt Orthopristis ruber Cuvier (Pisces: Haemulidae) . Revista de Biología<br />
Marina y Oceanografía 39:21-29.<br />
Naas, K., Huse, I. y Iglesias, J. 1996. Illumination in first feeding tanks for marine fish larvae.<br />
Aquacultural Engineering, 15:291-300.<br />
Navarro-Rodríguez, M.C., González-Guevara, L. F., Flores-Vargas, R., González-Ruelas, M. E.<br />
Carrillo-González, F. M. 2006. Composición y variabilidad del ictioplancton de la laguna El<br />
Quelele, Nayarit, México Ichthyoplankton composition and variability of the laguna El Quelele,<br />
Nayarit, Mexico. Revista de Biología Marina y Oceanografía 41: 35 – 43.<br />
Okamoto T, Kurokawa T, Gen K, Murashita K, Nomura K, Kim SH, Matsubara H, Ohta H, Tanaka<br />
H (2009), Influence of salinity on morphological deformities in cultured larvae of Japanese eel,<br />
Anguilla japonica, at completion of yolk resorption. Aquaculture, 293: 113-118.<br />
Olsen, A.I., Olsen, Y., Attramadal, Y., Christie, K., Birkbeck, T.H., Skjermo, J. y Vadstein, O.<br />
2000. Effect of short term feeding of microalgae on the bacterial flora associated with juvenile<br />
Artemia franciscana. Aquaculture. 190: 11-25.<br />
Patino, R., 1997. Manipulations of the reproductive system of fishes by means of exogenous<br />
chemicals. The Progressive Fish-Culturist. 59:18-128.<br />
Rocha, R.J., Ribeiro L., Costa R., Dinis M.T. 2008. Does the presence of microalgae influence fish<br />
larvae prey capture? Aquaculture Research 39: 362-369<br />
352
353<br />
FINAL REPORTS: INVESTIGATIONS 2009–2011<br />
Rodriguez M de O, G.A. 2001. Evaluación de la calidad del esperma del botete Diana Sphoeroides<br />
annulatus (Jenyns, 1834) en condiciones de cautiverio y bajo inducción hormonal con LHRHa.<br />
Masters degree Thesis. CIAD, A.C. Mazatlán Sin.<br />
Sahoo, S.K., Giri, S.S., chandra, S., Sahu, A.K. 2007. Effect of Ovaprim doses and latency periods<br />
on induced spawning of Clarias batrachus: observation on larval deformity. Indian Journal of<br />
Experimental Biology, 45:920-922.<br />
Santerre M.T. 1976. Effects of temperature and salinity on the eggs and early larvae of Caranx mate<br />
(Cuv. & Valenc.) (pisces: carangidae) in Hawaii Journal of Experimental Marine Biology and<br />
Ecology, 21:51-68.<br />
Sarkar, U.K., Lakra, W.S., Deepak, P.K., Negi, R.S., Paul, S.K. y Srivastava, A. 2006. Performance<br />
of different types of diets on experimental larval rearing of endangered Chitala chitala<br />
(Hamilton) in recirculatory system. Aquaculture, 261: 141-150.<br />
Sarnowski, P., Jezierska, B. 2007. A new coefficient for evaluation of condition of fish larvae.<br />
Electronic Journal of Ichthyology. 2:69-76.<br />
Steward Fielder D., Bardsley William J., Geoff L. Allan, Patricia M. (2005). The effects of salinity<br />
and temperature on growth and survival of Australian snapper, Pagrus auratus larvae.<br />
Aquaculture, 250: 201-214.<br />
Todd, E.S. 1975. Vertical movement and development of the prolarvae of the eleotrid fish,<br />
Dormitator latifrons. Copeia 3: 564-568.<br />
Van Der Wal, T. 1985. Effects of temperature and salinity on the hatch rate and survival of<br />
australian bass (Macquaria novemaculeata) eggs and yolk-sac larvae. Aquaculture, 47: 239-<br />
244.<br />
Vine, N.G., Leukes, W.D. y Kaiser, H. 2006. Probiotics in marine larviculture. FEMS Microbiol<br />
Rev. 30: 404–27.<br />
Yang Z, Y. Chen. 2006. Salinity tolerance of embryos of obscure puffer Takifugu obscures.<br />
Aquaculture, 253: 393-397.<br />
Yanong, R.P.E, Martinez, C., Watson, C.A. 2009. Use of Ovarpim in Ornamental Fish<br />
Aquuaculture. <strong>University</strong> of Florida IFAS Extension. FA161, 8 pp.<br />
Zohar, Y. y C. Mylonas. 2001. Endocrine manipulations of spawning in culture fish: from<br />
hormones to genes. Aquaculture, 197: 99-136.
FINAL REPORTS: INVESTIGATIONS 2009–2011<br />
Figure 1. Chame Dormitator latifrons (Photo by Gustavo Rodriguez)<br />
Figure 2. New hatched larvae scanned with digital analysis tools<br />
(Motic Image Plus 2.0 software) (note: Scale bars not accurate)<br />
(Photo by Eva Medina)<br />
Table 1. Estimated values of spawning females for all experimental treatments within the experiment<br />
for year 1 (2010).<br />
Variable Control LHRHa Ovaprim Ovaplant<br />
Weight (g) 393.3±185.1 486.15±205.2 388.9±151.6 388.6±216.1<br />
#of fish per treatment 4 4 4 4<br />
% of spawning fish 25% 50% 0% 100%*<br />
Relative fecundity (cell g -1 ) 83000 ç 59000 ç n/a 50000±10000**<br />
Oocyte diameter (µm) 392.6±51.8 ç 327.7±18.5 ç n/a 353.8±106.6**<br />
*n=4 **Pooled from 4 females<br />
ç n=1 female<br />
354
355<br />
FINAL REPORTS: INVESTIGATIONS 2009–2011<br />
Table 2. Estimated values of spawning females for all experimental treatments within the experiment<br />
for year 2 (2011).<br />
Variable Control Ovaprim LHRHa Ovaplant<br />
Weight (g) 438.6±153.58 467±242.49 526.8±171.32 539.4±229.73<br />
# of fish per treatment 5 5 5 5<br />
% spawning fish 0% 0% 80% 80%<br />
Relative fecundity (cell g -1 ) n/a n/a 50598.3± 54310.3±<br />
5134.35 1639.4<br />
Total fecundity per fish n/a n/a 691841± 428541 ±<br />
637549 275455<br />
Oocyte diameter (µm) n/a n/a 273.33± 0.10 273.55±1.51<br />
Table 3. Estimated values of sperm quality for all experimental treatments for year 1 (2010)<br />
Variable Control<br />
LHRHa<br />
(40μg kg¯¹)<br />
Ovaprim Ovaplant<br />
Weight (g) 622.7±54.7 434.7±139.4 538.75±187.4 540.6±202.1<br />
# of spermiating fish 3 4 3 4<br />
Mean volume ml 0.5 2.3 4.3 8.2<br />
Motility (%) 93.3±11.5 83.3±11.5 80.0±26.4 93.3±5.77<br />
Activation time (min) 4:24±0:22 4:57±1:91 2:47±1:37 2:90±1:02<br />
Concentration(cell ml -1 )<br />
1.96E+09±<br />
1.29E+09<br />
2.29E+09±<br />
7.8E+08<br />
1.26E+09±<br />
2.37E+08<br />
2.31E+09±<br />
7.84E+08<br />
Table 4. Estimated values of sperm quality for all experimental treatments for year 2 (2011)<br />
Variable Control Ovaprim<br />
LHRHa<br />
(40μg kg¯¹)<br />
LHRHa<br />
(80μg kg¯¹)<br />
Weight (g) 560.2 ± 65.14 554.6 ± 122.65 550.8±205.06 737.4±204.4<br />
# Spermiating fish 5 5 5 5<br />
Released volume (ml) 0.25±0.2 0.28±0.3 0.77±0.6 4.24±7.4<br />
Motility % 60 ± 14.14 66 ± 30 76 ± 24 62 ± 0.27<br />
Activation time (min) 1:63± 0:41 02:16± 1:15 1:47 ± 0.41 0:83±0:45<br />
Concentration<br />
(cell ml¯¹)<br />
1.04E+09±<br />
6.93E+08<br />
1.11E+09±<br />
3.90E+08<br />
1.52E+09±<br />
8.25E+08<br />
1.65E+09±<br />
4.65E+08
FINAL REPORTS: INVESTIGATIONS 2009–2011<br />
LENGHT (um)<br />
Diameter (um)<br />
1800<br />
1600<br />
1400<br />
1200<br />
1000<br />
800<br />
600<br />
400<br />
200<br />
0<br />
0 2 4 6 8 10 12<br />
SALINITY (‰)<br />
Salinity (‰)<br />
TOTAL LENGHT<br />
200 Yolk sack<br />
180<br />
160<br />
140<br />
120<br />
100<br />
80<br />
60<br />
40<br />
20<br />
0<br />
0 2 4 6 8 10 12<br />
Size (um)<br />
120 Oil Drop<br />
100<br />
80<br />
60<br />
40<br />
20<br />
0<br />
0 2 4 6 8 10 12<br />
Salinity (‰)<br />
Figure 3. Observed values for hatching length (a), yolk sac (b) and oil drop (c) diameter in chame<br />
larvae incubated in salinities between 0-12 ‰, 12-16 hours post hatching.<br />
356
357<br />
FINAL REPORTS: INVESTIGATIONS 2009–2011<br />
Figure 4. Early morphological development of chame larvae at 26-28°C. (40-400x)
FINAL REPORTS: INVESTIGATIONS 2009–2011<br />
Lenght (µm)<br />
Condition Index<br />
2500<br />
2000<br />
1500<br />
1000<br />
500<br />
0.35<br />
0.30<br />
0.25<br />
0.20<br />
0.15<br />
0.10<br />
0.05<br />
0.00<br />
0<br />
0 2 4 6 8<br />
Days post hatching<br />
0 2 4 6 8<br />
Days post hatching<br />
Figure 5. Length increment (µm) and progression of condition index (CI) of larvae reared at 1.5 ‰<br />
increments from 1dph ( ) or from 2 dph ( ).<br />
358
359<br />
FINAL REPORTS: INVESTIGATIONS 2009–2011<br />
Figure 6. Observed digestive tract content (→) observed after staining Year 1 (a) or phase contrast<br />
microscopy Year 2 (400x).<br />
Survival (%)<br />
50<br />
40<br />
30<br />
20<br />
10<br />
0<br />
a)<br />
2 4 6 8<br />
Salinity (‰)<br />
Artificial plankton<br />
Artemac 0<br />
Encapsulon 0<br />
Figure 7. Chame larvae survival (%) observed during last feeding experiment at day 6 after<br />
initiation at each rearing salinity per treatment, n=200 larvae per container<br />
Figure 8. Biofloc produced for Chame larvae rearing and predation by present rotifers on bioflocs.<br />
b)
FINAL REPORTS: INVESTIGATIONS 2009–2011<br />
d<br />
a<br />
c<br />
Figure 9. Chame larvae samples embedded in historesin and stained with Harris hematoxilin and<br />
eosin, observed structures are yolk sack residues (a), esophagus (b), stomach (c), muscle fibers (d)<br />
(400x).<br />
360<br />
b
a<br />
c<br />
b<br />
361<br />
FINAL REPORTS: INVESTIGATIONS 2009–2011<br />
Figure 10. Chame larvae samples embedded in historesin and stained with Harris hematoxilin and<br />
eosin, observed structures are mouth (a), jaw (b) eye (c), pancreas (d), stomach (e), muscle fibers (f)<br />
(400x).<br />
d<br />
f<br />
e
FINAL REPORTS: INVESTIGATIONS 2009–2011<br />
Stock Assessment of “Chame” Dormitator latifrons in Nayarit and South<br />
of Sinaloa México<br />
Indigenous Species Development /Study/09IND04UH<br />
Guillermo Rodriguez Domínguez<br />
Universidad Autónoma de Sinaloa – Mazatlán<br />
Mazatlán, Sinaloa, Mexico<br />
Maria Haws<br />
<strong>University</strong> of Hawai’i at Hilo<br />
Hilo, Hawai’i, USA<br />
Students:<br />
Jesus Sanchez Palacios, Gloria Ana María Arroyo Bustos and Josefina Ruiz Moreno<br />
Universidad Autónoma de Sinaloa – Mazatlán<br />
Mazatlán, Sinaloa, Mexico<br />
INTRODUCTION<br />
“Chame” is a common euryhaline fish of Mexico, and much of the Pacific Coast of Latin America.<br />
It survives in a large range of temperatures and salinities in lentic and lotic environments. It is used<br />
for food in southern Mexico, but is considered a pest in northwest Mexico because it invades<br />
commercial shrimp ponds where it competes for feed. This fish has a vascularised swim bladder<br />
that can function as a primitive lung (facultative lung) and thus can survive a long time out of water.<br />
Because of its resiliency to extreme environmental conditions it will be important species if global<br />
warming is a reality. Its cultivation for human food may be an alternative when other species are<br />
impacted by global climate change.<br />
Relatively little is known about this species’ biology. A reproductive autumn season was reported<br />
(Navarro Rodríguez et al, 2004; Navarro Rodríguez et al, 2010; Rojas Herrera et al. 2009) but a<br />
reproductive winter season was also reported (Florencio y Serrano, 1981). Another study found two<br />
reproductive seasons a year (Navarro Rodríguez et al., 2006). Isometric growth (Rojas Herrera et al.<br />
2009) and growth of 24 g in two and half months of cultivation was reported (Castro Rivera et al.<br />
2005). A female of 155 mm length can produce five millions eggs (Haz Alvarado 2002). It spawns<br />
in estuaries where mass eggs adhere to the roots of the mangroves and then the 20 mm larvae<br />
migrate upstream (Haz Alvarado, 2002).<br />
The principle objective of this study is to collect information about this species’ basic biology and<br />
conduct a stock assessment in two Mexican <strong>State</strong>s where this species is fished and has potential as<br />
an aquaculture species. This information will support development of fisheries management<br />
recommendations and provide information to aquaculture development efforts.<br />
MATERIAL AND METHODS<br />
Survey catches of “chame” were conducted using cast nets with 1 inch mesh size in rivers, streams,<br />
coastal lagoons estuaries and marshes of southern Sinaloa and northern Nayarit Mexico (Figure 1).<br />
In each survey site 10 catch sets were realized and the number of fish caught recorded. Sex, total<br />
length, total weight, and gonad weight were also recorded. Scales and gonads were collected from<br />
five fishes from each 10 mm size class.<br />
362
363<br />
FINAL REPORTS: INVESTIGATIONS 2009–2011<br />
Figure 1. Study area and collection sites of “Chame” in southern Sinaloa and northern Nayarit.<br />
Cleaned scales were air-dried, mounted on microscopic slides and examined with a Bausch and<br />
Lomb overhead projector. Six of the best scales were selected for further analysis. For each fish<br />
scale, total and partial radius were measured using a projection scale at a constant distance and<br />
microscopic objective for two independent observers To determine if scales could be used for<br />
estimation of growth, the total radius of the scale was regressed to the total length of fish and<br />
statistical significance was determined using analysis of variance. Lengths and weights of fishes<br />
were grouped for the number of growth marks and fitted to a normal distribution, and the<br />
parameters μ and σ were estimated for each one. The periodicity of growth marks was evaluated by<br />
examining mean marginal increments of the scales. To validate the timing of mark formation,<br />
monthly mean Fulton’s condition factor ( ̅) and the gonadosomatic index were estimated.<br />
Data for size at age were fitted to four cases of Schnute’s (1981) model and one special case<br />
equivalent to the von Bertalanfy model. Each case was fitted to the size at age and weight at age<br />
data set by the maximum log-likelihood algorithm of normal distribution of errors, assuming both<br />
additive and multiplicative error structure. The best fit of error structure and of each case for the<br />
Schnute model was determined by the Akaike index (AIC) and the Akaike weights (Wi)<br />
(Montgomery et el 2010).<br />
The relationship between weight (Wt) and length (Lt) of fishes was estimated by a potential model.<br />
The model was developed using non-lineal methods maximumizing a Log-likelihood function by a<br />
iterative process with Newton algorithm. Models were bootstrapped 1000 times to estimate firstorder<br />
corrected 95% confidence intervals about each parameter (Haddon 2001).<br />
Maturation stage were determined macroscopically in the laboratory using freshly captured<br />
specimens,. Samples of gonads were also taken and placed in Davidson´s fluid for subsequent<br />
histological analysis. Macroscopic maturation stages were: Stage 1. immature and sex
FINAL REPORTS: INVESTIGATIONS 2009–2011<br />
undifferentiated; Stage 2. gonads developing; Stage 3. gonads maturating; Stage 4. mature; and<br />
Stage 5. spawing. Stages 3 to 5 were considerate to be mature fishes during reproduction season.<br />
Fishes collected in the reproduction season were sorted as immature and mature for each 5 mm of<br />
total length interval and adjusted to the logistic model to estimate size at first maturity.<br />
Fish caught at all survey sites and for all months were standardized as catch per 10 sets and pooled<br />
in 10 mm of total length interval. Then frequency in each age group (Na) was calculated by a<br />
multinomial approximation (Montgomery et al., 2010) where initial parameter estimates were that<br />
of normal distribution fit at each age group as determined by the growth marks in scales.<br />
Multinomial fit was obtained by fixing mean length at each age group by the change in standard<br />
deviation and frequency (Na). Then Na was used to construct a plot of catch at age curve, and the<br />
points in the descendent part of curve were selected for regression and estimation of total mortality<br />
rate, as ( ) ̅<br />
Mortality rate (M) was calculated with four empiric model as:<br />
Reference Model Parameters definition and units<br />
Rickhter and<br />
Efanov (1976)<br />
= First age maturity.<br />
Rickhter and<br />
Efanov (1976)<br />
Hewitt and<br />
Hoenig (2005)<br />
Cubillos (2003)<br />
after Alverson &<br />
Carney (1975)<br />
Log10M=-0.0066-<br />
0.27Log10L∞+0.6543Log10K<br />
+0.4634Log10T<br />
364<br />
L∞ = asymptotic length (in cm)<br />
K = growth coefficient (year -1 )<br />
T = annual mean temperature of habitat.<br />
(◦C)<br />
1.5 (3/amax) amax = Maximum age registered.<br />
( )<br />
RESULTS<br />
= 0.62 = critic size-asymptotic length<br />
ration.<br />
K = (growth coefficient (year -1 ) from<br />
vonBertalanfy model.<br />
Chame were caught in ten of the eighteen sites explored. D. latifrons was collected all year in<br />
freshwater ponds or seasonal freshwater lagoons, and in rivers, streams and estuaries during rainy<br />
season from August to November. The catch per set was highly variable depending on the local<br />
situation and seasonal conditions. In a seasonal freshwater called Mataderos, catch per set (19.63<br />
m 2 cast net area) was 5 to 10 fishes from March to May (Figure 2). The lagoon dried up in June, but<br />
it was filled in a flood in August, and after new chame recruits entered the lagoon, catches per set<br />
were 2.6 to 8.5 fishes. In a pond constructed for a source of water for cattle (named Zacatoza),<br />
which had been filled continuously with well water, catch per set was 0.05 to 1.8 fishes from March<br />
to August. In late August the surrounding fields were flooded and the reservoir turned dark brown<br />
and dead fish were observed on the surface. In October, new recruits of chame were observed, and<br />
catch per set was from 1.8 to 44.5 fish, from October to December. In a stream next to Potrerillos<br />
ranch, many chame were observing attempting to migrate upstream but a bridge over the stream<br />
presented this. Some fishes were seen attempting to jump over the wall but were returning with<br />
water flow. Catch per set was of 28.3 fishes. In early December, the flow of water was reduced and<br />
there only remained a small lagoon next to the bridge where catch per set was of 128 fishes.
Absolute frecuency<br />
450<br />
400<br />
350<br />
300<br />
250<br />
200<br />
150<br />
100<br />
50<br />
0<br />
Catch per set<br />
50<br />
45<br />
40<br />
35<br />
30<br />
25<br />
20<br />
15<br />
10<br />
5<br />
0<br />
55<br />
65<br />
75<br />
85<br />
95<br />
105<br />
115<br />
125<br />
135<br />
145<br />
155<br />
165<br />
175<br />
185<br />
195<br />
205<br />
215<br />
225<br />
235<br />
245<br />
255<br />
265<br />
275<br />
285<br />
295<br />
Total Length (mm)<br />
Survey sites<br />
Mataderos Mataderos 2<br />
Mar<br />
Frente Pesquero Palmillas<br />
Brevadero Acaponeta<br />
Zacatoza Potrerillos<br />
Apr<br />
May<br />
Jun<br />
365<br />
Catch<br />
FINAL REPORTS: INVESTIGATIONS 2009–2011<br />
Figure 2. Catch per set of chame (D. latifrons) with a cast net in survey sites in southern<br />
Sinaloa and northern Nayarit, México.<br />
The observed migration is thought to have been for reproduction because in October 75% of female<br />
fishes were mature (stage 4) and for November 87.5% had spawned. In September, chame were<br />
captured next to the dam diversion “Tamarindo” on the Baluarte River; 67% were mature. Some<br />
smaller fish were observed hiding beneath rocks at this site. Catch per set was not calculated<br />
because the rocks prevented the use of cast nets, but 86 chame fishes were captured in 30 minutes<br />
for two fishers.<br />
The size of chame captured varied from 56 to 300 mm of total length, but most (79%) were in the<br />
70 to 130 mm interval (Figure 3). A decrease of frequency with size was observed. The weight of<br />
the chame varied from 1.5 g to 419 g but most (76.8%) were 40 g (Figure 3).<br />
900<br />
800<br />
700<br />
600<br />
500<br />
400<br />
300<br />
200<br />
100<br />
0<br />
5<br />
25<br />
45<br />
65<br />
85<br />
105<br />
125<br />
145<br />
165<br />
185<br />
205<br />
225<br />
245<br />
265<br />
285<br />
305<br />
325<br />
345<br />
365<br />
385<br />
405<br />
weight (g)<br />
Figure 3. Size and weight structure of D. latifrons as sum of standardized catch to 10 set of all<br />
survey sites.<br />
The relationship between total length and scale size was statistically significant (p< 0.05) with a<br />
coefficient of determination of 0.92. This lends validity to the use of scales for age determination.<br />
Six growth marks were found on the scales (Figure 4) and the total length of fishes within each<br />
growth mark was adjusted to a normal distribution.<br />
Aug<br />
Sep<br />
Oct<br />
Nov<br />
X 180<br />
Dec
FINAL REPORTS: INVESTIGATIONS 2009–2011<br />
Total Length (mm)<br />
300<br />
250<br />
200<br />
150<br />
100<br />
50<br />
0<br />
0 1 2 3 4 5 6 7<br />
Growth marks<br />
Figure 4. Relation between total length and growth marks in scales of D. latifrons.<br />
The mean of the marginal increments described an annual cycle with the lowest means in December<br />
and February. (Figure 5). This find validates the hypothesis that growth marks are imprinted once a<br />
year from December to February.<br />
Marginal increments<br />
7<br />
6<br />
5<br />
4<br />
3<br />
2<br />
1<br />
0<br />
Mean Mean±SE Mean±0.95 Conf. Interval<br />
Feb Mar Apr May Jun Aug Sep Oct Nov Dec<br />
Figure 5. Temporal variation of mean marginal increments of scales of D. latifrons. Fishes<br />
of all groups of growth marks were included.<br />
Total length and weight for the age groups were as:<br />
age group Mean total length (CI 95%) weigth (CI 95%)<br />
0 91(88,94) 13(15,17)<br />
1 120(116,124) 29(33,38)<br />
2 155(151,159) 53(59,65)<br />
3 195(189,202) 123(136,150)<br />
4 227(217,236) 187(213,240)<br />
5 246(230,263) 228(285,341)<br />
6 254(237,272) 187(279,371)<br />
366
367<br />
FINAL REPORTS: INVESTIGATIONS 2009–2011<br />
The best fit of growth of size at age was case 1 with additive error structure as was determined for<br />
the lower AIK (Table 1).<br />
Table 1. Akaike index after fitting for Schnute model cases and error structure types to size-age<br />
data.<br />
ERROR TYPE CASE 1 CASE 2 CASE 3 CASE 4 CASE 5<br />
ADITIVE 34.50 55.39 61.37 66.32 59.17<br />
MULTIPLICATIVE 59.36 62.01 66.37 70.21 64.77<br />
Aikake weight for case 1 has additive error structure being almost 100% as is shown in Tables 2<br />
and 3.<br />
Table 2. Parameters of each case of the Schnute model with bootstrapped confident interval 95%<br />
for the best model as determined by Aikake weight.<br />
CASE y1 y2 a b AIK W i<br />
1 91.2 (90.48, 91.58) 254.38 (253.71, 254.79) 1.15 (1.08, 1.2) -4.08 (-4.46, -3.86) 34.50 99.99 *<br />
2 86.31 259.81 0.34 0.00 55.39 0.0<br />
3 87.01 264.17 0.00 1.68 61.37 0.0<br />
4 113.13 276.45 0.00 0.00 66.32 0.0<br />
5 85.83 261.58 0.14 1.00 59.17 0.0<br />
Table 3. Akaike index after fitting five cases of the Schnute model and two types of error structure<br />
to weght-age data.<br />
ERROR TYPE CASE 1 CASE 2 CASE 3 CASE 4 CASE 5<br />
ADITIVE 74.05 70.43 81.83 80.48 84.37<br />
MULTIPLICATIVE 74.10 78.90 82.46 85.70 84.26<br />
The best fit of growth to weight at age was case 2 with additive error structure as was determined<br />
for the lower AIC (Table 3) and Aikake weight was 85.16% (Table 4).<br />
The length-weight relation was: . Bootstrapped confident intervals at 95%<br />
were 1.18E-5 – 1.62E-5 for parameter a and 2.984 – 3.051 for parameter b. Confident interval at<br />
95% of b include 3 which indicates isometric growth of D. latifrons.<br />
Table 4. Parameters of each case of the Schnute model with bootstrapped confident interval 95%<br />
for the best model as determined by Aikake weight<br />
CASE y1 y2 a b AIK Wi 1 15.86 285.34 2.22 -3.15 74.05 13.92<br />
2 1.07 (1, 5.63) 294.45 (279.43, 314.05) 0.64 (0.4, 0.68) 0.00 70.43 85.16 *<br />
34 39.74 2.00 294.45 385.50 0.00 1.18 0.00 81.83 80.48 0.28 0.56<br />
5 1.97 371.64 -0.19 1.00 84.37 0.08
FINAL REPORTS: INVESTIGATIONS 2009–2011<br />
The condition factor of chame fishes showed an annual cycle according to gonadosomatic index and<br />
marginal increments in scales. The lowest values were in March with a maximumum in October,<br />
followed by a decreasing trend until December (Figure 6).<br />
Condiction Factor (K)<br />
2.0<br />
1.9<br />
1.8<br />
1.7<br />
1.6<br />
1.5<br />
1.4<br />
1.3<br />
1.2<br />
1.1<br />
Feb Mar Apr May Jun Jul Ago Sep Oct Nov Dec<br />
368<br />
±1.96*Std. Err.<br />
±1.00*Std. Err.<br />
Figure 6. Temporal variation of condition factor for Chame D. latifrons.<br />
Macroscopic analysis of the maturity stage of female Chame showed an annual maturation cycle.<br />
From March to June, females were inmature or developing. From August to November, most fish<br />
were mature. Stage 5 or the spawned stage were seen from November to February (Figure 7).<br />
Proportion<br />
1.2<br />
1<br />
0.8<br />
0.6<br />
0.4<br />
0.2<br />
0<br />
Figure 7. Proportional macroscopic maturing stages of D. latifrons over the annual cycle.<br />
Temporal variation of mean GI also revealed an annual maturity cycle (Figure 8). From February to<br />
July, GI was low, ranging between 0.5 and 2. Beginning in August, GI began to increase (from 4 to<br />
14) until reaching a maximumum in October, followed by a decline until December. Both the<br />
macroscopic maturity stages and GI suggest that the spawning season for chame is from October to<br />
February.<br />
Female chame with zero growth marks also showed gonadic maturation as revealed by the<br />
gonadosomatic index. This find revealed that D. latifrons reach first maturity before they reach one<br />
year of age, because the growth mark is impressed in December and these fishes would have been<br />
maturating since August. There was only one female with zero growth marks in December that was<br />
in spawned condition and one more was found in November. A weighted mean age (frequency<br />
times age) revealed that females with zero growth marks collected during this study were 0.845<br />
Mean<br />
Spawned Mature Maturing<br />
Developing Inmature<br />
Feb Mar Apr May Jun Aug Sep Oct Nov Dec
Gonadosomatic Index (GI)<br />
16<br />
14<br />
12<br />
10<br />
8<br />
6<br />
4<br />
2<br />
0<br />
±1.96*Std. Err.<br />
±1.00*Std. Err.<br />
Mean<br />
Feb Mar Apr May Jun Jul Ago Sep Oct Nov Dec<br />
369<br />
FINAL REPORTS: INVESTIGATIONS 2009–2011<br />
years old. Mean size of mature females with zero growth marks was 98 mm total length, and those<br />
that were immature were 86 mm.<br />
Eggs in gonads of D. latifrons are homogeneous in size when are seen in fresh under the<br />
microscope and histological analysis of gonads revealed eggs in the same development stage<br />
(Figure 9), which validates the hypothesis that D. latifrons is a complete spawner.<br />
Figure 8. Annual cycle for gonadosomatic index of D. latifrons.<br />
Figure 9. Histological view of mature gonads of D. latifrons female of 119 mm (top),<br />
female of 115 mm (middle) and female of 90 mm (bottom).<br />
Size at first maturity of D. latifrons was calculated at 88.1 mm total length. This size is between<br />
immature and maturing females with zero growth marks in scales. As the Schnute growth model<br />
uses relative age rather than absolute age to determined age at first maturity, we used a derivation of<br />
the best case 1 of the Schnute growth in size model with τ1 in 0.845 (age of females with zero<br />
growth mark in scales) and τ2 6.845. Age was calculated by substituting Yt for total length at first<br />
maturity using the equation below:
FINAL REPORTS: INVESTIGATIONS 2009–2011<br />
Age at first maturity was thus calculated to be 0.72 years.<br />
[ ( )( ( ) )<br />
]<br />
Female chame have a high fecundity. Mature females smaller than 200 mm of total length produced<br />
between 39,000 and 170,000 eggs, and females larger than 200 mm produced between 1 and 5<br />
million of eggs (Figure 10). A tendency to to increase the number of eggs per gram of female<br />
weight with size was observed, but was not statistically significant (P= 0.09). The mean<br />
reproductive potential of chame is 11,910 eggs per g of female weight with a confident interval at<br />
95% of 149,094 and 14,727 eggs.<br />
Eggs per female (thousands)<br />
6,000.00<br />
5,000.00<br />
4,000.00<br />
3,000.00<br />
2,000.00<br />
1,000.00<br />
0.00<br />
y = 0.004x 3.771<br />
R² = 0.866<br />
0 20 40 60 80 100 120 140 160 180 200 220 240 260<br />
Figure 10. Fecundity for size of female D. latifrons.<br />
The catch at age curve showed a decreasing section only, but extreme points no were used to<br />
analysis (Figure 11). Mortality rate was estimated at 1.4 year -1 .<br />
Figure 11. Catch at age curve.<br />
370<br />
Total Lenght (mm)
Estimations of natural mortality were derived using four empirical models:<br />
371<br />
FINAL REPORTS: INVESTIGATIONS 2009–2011<br />
Model Mortality rate<br />
Rickhter and Efanov (1976) M= 1.77<br />
Pauly (1980) M= 0.47<br />
Hewitt and Hoenig (2005) M = 0.75<br />
Cubillos (2003) after Alverson & Carney (1975) M = 0.27<br />
DISCUSSION<br />
In most of Mexico this species is not considered a target fisheries species, but is used as bait for<br />
fishing and is captured as bycatch in the artisanal shrimp fishery. In the freshwater survey sites,<br />
chame was observed to cohabit these areas with other non-predatory species such as tilapia and<br />
gobids. In estuaries and costal lagoons, it is subject to predation by catfishes and other species.<br />
Age at first maturity was calculated as 0.72 years but an absolute age of 0.845 for fishes of age 0<br />
group was assumed. If 1 year absolute age for 0 group is assumed, then age at first maturity is 0.88<br />
years and natural mortality rate from Rickhter and Efanov (1976) empiric model would be 1.4, the<br />
same as estimated with catch at age curve analysis.<br />
Mortality rates estimated with the empiric models of Pauly (1980) and Cubillos (2003) were lowest.<br />
But the problem is that those models use von Bertalanfy parameters which was not the best model<br />
describing growth in this study. The Hewitt and Hoenig (2005) model is the simplest and uses only<br />
maximumum observed age. In this study, maximumum observed age was 6, and natural mortality<br />
was 0.75 year -1 but an increment of 1 year of maximumum age could result in a 0.64 year -1 rate.<br />
Assuming total mortality of 1.4 year -1 (from catch at age curve analysis) and natural mortality rates<br />
of 1.4 and 0.75 (from corrected Rickhter and Efanov (1976) and Hewitt and Hoenig (2005)) an<br />
“exploitation rate” of 0 to 0.46 is obtained. This means that the “health” of the stock of Chame D.<br />
latifrons is good, considering the 0.5 exploitation rate as reference point for overexploitation.<br />
D. latifrons is a r-strategist species as revealed by its high fecundity, early age and low size at first<br />
maturity. It is associated with floods for dispersal to habitats such as streams, seasonal ponds,<br />
estuaries and coastal lagoons. Differences between total and natural mortality rates reveals added<br />
mortality from other sources than this life history reveals. Human constructions in the beds of<br />
rivers and streams that stop the migratory routes of the species, changes in duration of the dry<br />
season, fisheries and shrimp aquaculture were major factors identified that could added this<br />
mortality. Despite their high resistance to extreme environmental conditions, a long dry season can<br />
reduce the seasonal freshwater lagoons that remain after floods, resulting in total mortality for local<br />
stocks as was seen in Mataderos lagoon. Although no fishery is directed at D.latifrons, fish<br />
mortality most likely results from the shrimp fishery in coastal lagoons. An estuary called<br />
“Puyeque” (the common name of chame in the region) is thus named because a lot of D. latifrons<br />
are caught as bycatch when the shrimp fishery season begins. A lot of chame fishes are disposed of<br />
on the shores of the estuaries and coastal lagoons where they decompose without anyone using<br />
them as food. D. latifrons is common in the ponds and channels of shrimp farms were they<br />
compete with shrimp for food. Farmers capture and discard them. This added mortality is very<br />
important as revealed in the estimated “exploitation rate”. Even without a commercial fishery for<br />
chame in the region, the “exploitation rate” is the same order of magnitude for targeted fisheries
FINAL REPORTS: INVESTIGATIONS 2009–2011<br />
species in the region. A management plan is necessary for conservation of the species. Its high<br />
fecundity and rapid growth rate could be exploited for aquaculture purposes.<br />
REFERENCES<br />
Alverson D.L. & M.J. Carney. 1975. A graphic review of the growth and decay of population<br />
cohorts. Journal du Conseil 36: 133-143.<br />
Castro Rivera, R., G. Aguilar Benítez and J. de la Paz Hernández Girón. 2005. Conversión<br />
alimenticia en engordas puras y mixtas de popoyote (Dormitator latifrons richardson) en<br />
estanques de cemento aquatic, julio-diciembre, número 023 Universidad de Zaragoza,<br />
Zaragoza, España pp. 45-52.<br />
Cubillos, L.A. 2003. An approximative relationship to estimate the natural mortality rate in fish<br />
stocks. Naga WorldFish Center Quarterly 26: 17-19.<br />
Florencio, A. and M. Serreno. 1981: Algunos aspectos sobre la biologı´a del Chame, Dormitator<br />
latifrons. Rev. Cienc. Mar. Limnol. 1, 73 –81.<br />
Haddon, M. 2001. ‘Modelling and Quantitative Methods in Fisheries. Chapman & Hall/CRC Press:<br />
Washington, D.C.<br />
Haz Alvarado. 2002. Producción y exportacion del chame como nueva alternativa comercial del<br />
Ecuador. Proyecto de grado, Escuela Superior Politecnica del Litoral. Instituto de Ciencias<br />
Humanisticas y Economicas. 167 p.<br />
Hewitt, D. A. and J. M. Hoenig. 2005. Comparison of two approaches for estimating natural<br />
mortality based on longevity. U.S. National Marine Fisheries Service Fishery Bulletin 103:433–<br />
437.<br />
Montgomery, S. S., C. T. Walsh, M. Haddon, C. L. Kesby and D. D. Johnson. 2010. Using length<br />
data in the Schnute Model to describe growth in a metapenaeid from waters off Australia.<br />
Marine and Freshwater Research, 61, 1435–1445.<br />
Navarro-Rodríguez, M.C., R. Flores-Vargas, L. F. González-Guevara and M.E. González-Ruelas.<br />
2004. Distribution and abundance of Dormitator latifrons (Richardson) larvae (Pisces:<br />
Eleotridae) in the natural protected area “Estero El Salado” in Jalisco, Mexico. Biol. Mar.<br />
Oceanog. 39(1): 31-36.<br />
Navarro-Rodríguez, M.C., L.F. González-Guevara, R. Flores-Vargas, M.E. González-Ruelas &<br />
F.M. Carrillo-González. 2006. Composición y variabilidad del ictioplancton de la laguna El<br />
Quelele, Nayarit, México. Biol. Mar. Oceanog. 41(1): 35-43.<br />
Navarro-Rodríguez, M. C., R. Flores-Vargas, L.F. González-Guevara, J. Tellez Lopez and R.<br />
Amparan Salcido, 2010. Distribución y abundancia de las larvas de Dormitator latifrons<br />
(Pisces: Eleotridae) en el estero Boca Negra, Jalisco, México. Ciencia y Mar 2010 XIV (40) 3-<br />
9.<br />
Pauly, D. 1980. On the interrelationships between natural mortality, growth parameters and mean<br />
environmental temperature in 175 fish stocks. Journal du Conseil 39: 175-192<br />
Rickhter, V.A. and V.N. Efanov. 1976. On one of the approaches to estimation of natural mortality<br />
of fish populations. International Commission of the Northwest Atlantic Fisheries, Research<br />
Document 76/VI/8: 1-12.<br />
Rojas-Herrera, A., J. Violante-Gonzalez and D. S. Palacios-Salgado. 2009. Length–weight<br />
relationships and seasonality in reproduction of six commercially utilized fish species in the<br />
coastal lagoon of Tres Palos (Mexico). J. Appl. Ichthyol. 25 , 234–235.<br />
372
373<br />
FINAL REPORTS: INVESTIGATIONS 2009–2011<br />
Consolidation of Native Species Aquaculture in Southeastern Mexico:<br />
Continuation of a Selective Breeding Program for Native Cichlids and<br />
Snook Aquaculture<br />
Indigenous Species Development/Experiment/09IND05UA<br />
Wilfrido M. Contreras-Sánchez, María J. Contreras-García, Alejandro Mcdonal-Vera,<br />
Carlos A. Alvarez-Gonzalez, Ulises Hernández-Vidal, Rafael Martinez-García and<br />
Arlette A. Hernández-Franyutti<br />
Universidad Juárez Autónoma de Tabasco<br />
Villahermosa, Tabasco, México<br />
Kevin Fitzsimmons<br />
<strong>University</strong> of Arizona<br />
Tucson, Arizona, USA<br />
Undergraduate Biology Students:<br />
Maria Jesús Frías Izquierdo and Isabel Ascencio Díaz<br />
Universidad Juárez Autónoma de Tabasco<br />
Villahermosa, Tabasco, México<br />
INTRODUCTION<br />
One of the most important fisheries resources of Mexico is the snook group. Its economic<br />
importance is so big that this group of fish is considered among the most precious organisms for<br />
coastal and inland fishermen. This pressure over the resource has generated a high exploitation<br />
resulting in capture decreasing, especially for large organisms- mainly composed of adult females.<br />
Within most of the countries of the range of the snooks, the issue is the same. As a result,<br />
researchers from United <strong>State</strong>s, Central America and Brasil have demonstrated their concern to<br />
develop actions that ensure the continuity of the management of this resource (Tucker y Campbell,<br />
1988; Taylor et al., 1998; Álvarez-Lajonchere et al., 2002; Cerqueira y Tsuzuki, 2009). In the US,<br />
especially in Florida and Texas, sport fishing constitutes a very important economic industry and<br />
there have been isolated efforts for artificially reproducing these specie for restocking (Tucker y<br />
Campbell, 1988; McMichael et al., 1989; Taylor et al., 1998; Neidig et al., 1999; Skapura et al.,<br />
1999 and Main et al., 2009).<br />
The common snook Centropomus undecimalis and the fat snook Centropomus parallelus are two<br />
fish species distributed from the US to Brasil in the Atlantic Ocean. They are euryhaline and at<br />
juvenile stage are found in estuaries (Castro-Aguirre et al., 1999). These fish are difficult to<br />
reproduce in captivity (Álvarez-Lajonchere y Hernández-Molejón, 2001) thus sometimes it is<br />
necessary to collect them and adapt them to captivity (Álvarez-Lajonchere y Hernández-Molejón,<br />
2001). This adaptation in most of the cases result in holding the fish for long time, feeding them<br />
with fish which can result in high costs (Alves et al., 2006), so it is necessary to develop strategies<br />
that allow the inclusion of feed based on meals available in the market. Having artificial feed<br />
available for snook in captivity will allow us to give all nutrients the fish need at sufficient levels,<br />
resulting in an increase in growth rate (Roberts, 2002). In addition, the determination of snook gene<br />
expression let the generation of valuable information on initial ontogeny in order to understand the<br />
identity of the best feed to establish the snook culture.
FINAL REPORTS: INVESTIGATIONS 2009–2011<br />
The snook C. poeyi, on the other hand is one of the species of this genus with fewer studies.<br />
However, it is known that is endemic of the Gulf of Mexico from Tampico, Tamaulipas to Centla,<br />
Tabasco and have catadromous habits –adults are found in fresh waters, mature organisms in<br />
estuarine zones and in low river zones-. While juveniles are located in mixed-haline environments<br />
and at the adjacent neritic zone (Chávez, 1963).<br />
The development of aquacultural techniques for native species not only can reduce the pressure<br />
over wild populations, but can also provide a reliable supply for the development and<br />
implementation of working plans for restocking the overexploited stocks. At the same time, a<br />
sustainable fishery of native species could contribute to solve the rural emigration problem<br />
providing new and better employment and income opportunities. The present project arises from the<br />
necessity of continuing the development of research that let us achieve the correct methodologies in<br />
order to obtain snook fry from captive broodstock. The design of right feeding during early<br />
development will allow us to obtain fingerling survival for the incorporation of aquacultural<br />
activities through strategic evaluation.<br />
METHODS AND MATERIALS<br />
Establishment of Common snook (C. undecimalis) and fat snook (C. parallelus) broodstock<br />
groups from wild and hatchery<br />
Objective 1: To obtain broodstock from wild and hatchery-reared snook juveniles<br />
General Experimental Procedure. Among the proposed studies for the present investigation we<br />
proposed the creation of two lines of C. undecimalis and C. parallelus; one initiated from juveniles<br />
captured from the wild at the Laguna de Mecoacan and the Gonzalez River. The other line would be<br />
obtained from induced spawnings of broodstock keep in captivity since 2008.<br />
Experiment 1a: Origin of the wild organisms. The organisms were captured at the Laguna de<br />
Mecoacán, Paraíso, Tabasco, using a mosquito mesh net of 10 m length and 2 m height. Sampling<br />
was conducted close to the edge of the lagoon in places were mangrove roots allow the passage of<br />
the net and fishermen, 126 juveniles were captured and transferred to the Marine Aquaculture<br />
Station (Universidad Juárez Autónoma de Tabasco) for their adaptation to captivity. These fish<br />
mere placed in plastic tanks of 1 m 3 capacity containing filtered marine water and provided with<br />
constant aeration. After acclimation, the fish were transferred to the Tropical Aquaculture<br />
Laboratory at the Biological Division (UJAT) located in Villahermosa. Fish were acclimated to<br />
fresh water in a recirculating system composed of 1,300 L plastic tanks and equipped with sand<br />
filter and constant aeration.<br />
The feeding regime was: during the first 14 days, snooks were fed with live cichlids (Cichlasoma<br />
Urophthalmus and Oreochromis niloticus) ad libitum; the day 15 and 16 fish were fasted; day 17<br />
and 18 fish were fed ad libitum with chunks of fresh fish; during days 19 and 20, the fish were<br />
fasted and during days 21 and 22, fish were fed with pieces of fresh fish. For days 23 and 24, the<br />
fish were fasted again and from day 25 onwards the fish were fed with a semi-humid diet two or<br />
three times per day. The diet was designed based on fish meal, grounded fish fillet, shrimp meal,<br />
fish oil, soy lecithin, a mix of vitamins and minerals, vitamin C, unflavored gelatin, soy milk and<br />
sorghum flour, all these ingredients have been used in similar investigation by other authors (2009;<br />
Cerqueira and Tsuzuki, 2009).<br />
Samplings were performed monthly in order to determine growth in weight and length; fish were<br />
anesthetized with either Methanesulphonate of tricaine (MS 222) or clove oil.<br />
374
375<br />
FINAL REPORTS: INVESTIGATIONS 2009–2011<br />
Experiment 1b: Obtaining and maintaining C. undecimalis broodstock. Wild organisms<br />
adapted for three years to captivity were used. Nine females were selected from this stock with sizes<br />
ranging from 60 to 91 cm and a weight between 1.896 and 5.290 kg. Eighteen males with an<br />
average length of 83 cm and a weight ranging from 806 and 3,886 g. Organisms were maintained at<br />
the Marine Aquaculture Station from UJAT in Jalapita, Centla, Tabasco. The adaptation to captivity<br />
was performed in 25 m 3 geomembrane tanks. Fish were fed with wild sardines from the Clupeidae<br />
family collected with a seine net along the shore, and Breed-M de INVE® feed.<br />
Experimental design: Due to insufficient number of tanks a randomized block design was used<br />
(date of replication) with three treatments (0 µg/fish, 100 y 200 µg/fish de GnRH-a). The<br />
experiment was replicated three times.<br />
Spawning induction of C. undecimalis through GnRH-a implants. In this experiment the method<br />
used was from Álvarez-Lajonchere and Hernández-Molejón, 2001. Geomembrane tanks of 4 m<br />
diameter connected to a recirculating system were used. Thanks had an eggs collector adapted;<br />
consisting of a cylindrical tank of 100 L containing a 400 µm mesh bag. Seawater was used in all<br />
tanks with a daily water exchange of 50%. We measured; dissolved Oxygen, temperature (oxygen<br />
meter YSI55®) and salinity (refractometer SR6 Vital Sine Premium®). The average value of<br />
temperature, DO and salinity during the spawning trials were; 30.65 ± 0.45 ºC, 4.24 ± 0.53 mg/L<br />
and 27.5 ± 4.36 ppm, respectively.<br />
Oocyte samples were taken using female’s cannulation with a caliber 5 probe and 90 cm in length.<br />
Oocytes were measured with a stereoscope (Zeiss®) in order to determine the right diameter for<br />
induction (>300 µm). If females had the right oocyte diameter, a female and two males were placed<br />
randomly in each tank. Each fish was measured and weighed (with a conventional ichtiometer and a<br />
Torrey® balance of 2 g precision). An implant with 0 (control), 100 or 200 µg/fish of GnRH-a<br />
hormone (Argent Labs®) was placed in each female. All males from the treatments with hormone<br />
were implanted with 100 µg of GnRH-a/fish expecting maturation with just one dose. Only mature<br />
males with fluid sperm were used.<br />
Organisms were anesthetized using Methanesulphonate of tricaine (MS 222) and implants were<br />
placed in the intra-peritoneal cavity under the pectoral fin with a sterile implants syringe (AVID®).<br />
A gentamicine antibiotic cream was applied to avoid infections (Álvarez-Lajonchere and<br />
Hernández-Molejón, 2001). The experimental tanks were checked every four hours during three<br />
days in order to observe eggs presence. When spawning occurred, eggs were incubated. Eggs were<br />
collected by overflow using the egg collector bags, and then were placed in 40 L-plastic buckets<br />
with water of the same salinity, temperature and gentle aeration.<br />
Treatments effectiveness evaluation: Treatment effectiveness was evaluated using the occurrence<br />
or not of spawning activity. The quality of the spawning was assessed using the number of eggs<br />
obtained and the percentage of fertilization. The number of eggs was estimated by volume, taking<br />
three samples of 50 mL in different places of the tank. Multiple countings of each sample were<br />
performed using 1 mL sub-samples (Álvarez-Lajonchere and Hernández-Molejón, 2001). The<br />
percentage of fertilization was evaluated using presence or absence of embryo development<br />
analyzing 100 eggs of each experiment; observation was conduced using a stereoscopic microscope<br />
(Álvarez-Lajonchere and Hernández-Molejón, 2001).<br />
The present study took into account some parameters described by Álvarez-Lajonchere and<br />
Hernández-Molejón (2001) and Hernández-Vidal (2002), in order to determine egg quality<br />
considering the following: egg diameter, egg number, fertilization rate, percentage of hatching, and
FINAL REPORTS: INVESTIGATIONS 2009–2011<br />
larvae length. The egg diameter was determined using a sample of 100 eggs from each spawning.<br />
They were measured with a ocular micrometer calibrated in a stereoscopic microscope (Zeiss®;<br />
Hernández-Vidal, 2002). Pelagic eggs (considered viable) were incubated from each spawning<br />
(Álvarez-Lajonchere and Hernández-Molejón, 2001). After this, hatching percentage was evaluated<br />
following the same method for determination of fertilization rate. The number of larvae was<br />
obtained through direct counting (Hernández-Vidal, 2002). The hatched larvae were maintained in<br />
clean containers with the same conditions (Hernández-Vidal, 2002). Percentage of survival was also<br />
determined. Larvae length was registered at the point where yolk sac was absorbed.<br />
Statistic analysis: the presence or absence of spawning was recorded and egg diameter analyzed<br />
using a covariance analysis, blocking the possible effect of the pseudo-replication (replication date).<br />
Hormone concentration was used as the factor of interest. Female weight and oocyte initial diameter<br />
were used in the analysis as covariates. The variables fertilization rate and percentage of hatching<br />
were analyzed using a Chi-square. There was no data analysis for larvae number and size due to<br />
there was just data for one replicate of each treatment. All tests were performed using the software<br />
STATGRAPHICS V 5.1. The statistic differences were considered using a confidence level of p<<br />
0.05.<br />
Experiment 1c: For the spawning induction with C. parallelus the same method was used as<br />
described for experiment 1 using wild and captivity organisms in 2 m diameter tanks.<br />
RESULTS<br />
Objective 1a: Obtaining and maintaining of a C. undecimalis broodstock from the wild.<br />
According with observations, snooks can be adapted easily to captivity conditions; these organisms<br />
did not showed problems ingesting live preys, hold or pieces of fresh feed. With the semi-humid<br />
feed the adaptation was effective after fasting days.<br />
The statistics analysis indicates the existence of statistics differences (KW; p 0.05) for the number of eggs<br />
produced by female among the treatments 100 and 200 µg/fish (1.98 ± 1.27 and 2.46 ± 0.93 million<br />
of eggs, respectively).<br />
Results for the diameter of the fertilized eggs indicated that there is no effect of the factors or from<br />
the covariables used in this study (ANCOVA; p > 0.05). However, the highest average was obtained<br />
with the dose of 200 µg/fish with 746.50 ± 2.12 µm and the lowest average for dose of 100 µg/fish<br />
with 681.50 ± 23.50 µm. Te results of the statistics analysis for fertilization indicated that there are<br />
statistic differences among treatments (X2; p > 0.001), the implants with better results were the 200<br />
µg/fish with 76.84%. By other hand the fish induced with 100 µg/fish had a 60.47% fertilization.<br />
Was observed that hatching occurred four hours post fertilization. For this variable, the statistics<br />
376
377<br />
FINAL REPORTS: INVESTIGATIONS 2009–2011<br />
analysis indicated high statistics differences (X2; p > 0.001), having a percentage of 100 ± 0.00%<br />
hatching for 200 µg/fish treatment and 50 ± 60.10% for the treatment of 100 µg/fish.<br />
From all spawned females, only the larvae from one female from each hormonal treatment survived<br />
to the first feeding. 540,000 larvae were obtained for the treatment of 100 µg/fish and 3,119,999<br />
larvae for the dose of 200 µg/fish. The larvae from the high dose measured in average 1.56 ± 0.09<br />
mm and the larvae from the low dose 1.98 ± 0.05 mm.<br />
Experiment 1c: In the case of the stock that would be obtained from captivity broodstock with C.<br />
parallelus wild and captivity females were induced to spawn. The obtained eggs were not viable.<br />
METHODS AND MATERIALS<br />
Mexican snook (Centropomus poeyi) reproduction through GnRH-a implants<br />
Objective 2: to obtain spawning from Mexican snook in captivity<br />
General Experimental Procedure. 14 wild organisms (C. poeyi) were collected during an annual<br />
reproduction season (June - September). Initially were maintained at the Marine Aquaculture<br />
Station in quarantine tanks of 25 m 3 . Spermatic activation was carried out under microscopic<br />
examination in order to confirm that spawning occurs in marine waters using salinities of 0.15 and<br />
35 ppm. Also intraovarian cannulation were performed to obtain oocytes, its diameter was taken<br />
before transported to experimentation tanks. Spawning was induced using GnRH-a implants<br />
(Argent Lab). Females were implanted with vehicle (pellet without GnRH-a) 100 µg/fish, ó 200<br />
µg/fish. All males were implanted with 100µg/fish. The floating eggs were collected and<br />
transported to a density of 100 eggs/L. The 99.5% of the obtained larvae was released in the<br />
spawning sites. Marine water was used (31 ppm; salinity found in the sea at the experiment<br />
moment) in all tanks; water exchange was done at 80% daily. The DO, salinity and temperature<br />
were 5.3 mg/L, 31 ppm and 27 ºC, respectively. After implantation, spawning tanks were monitored<br />
every 2 hours in order to observe eggs/embryo presence.<br />
Statistics analysis: The diameter and number of eggs were analyzed through ANOVA. Eggs<br />
quality was evaluated through fertilization and hatching rate; these results will be compared among<br />
treatments using a Chi square test with contingency tables.<br />
RESULTS<br />
Objective 2: Obtain Mexican snook spawning in captivity. Cannulation of mature females and<br />
males were performed during June and July. However, sexual products were not obtained which<br />
was used as an indicator to wait for the next month (August), in which no oocytes were obtained in<br />
some cases. However, implants were placed to three females with dose of 100 y 200 µg/female. In<br />
the cases were oocytes were obtained these had an average measure of 332.5 µm. Spawning<br />
occurred around 29 hours post implantation in three of the implanted females, 4 million eggs were<br />
obtained with the females with the high dose. For the low dose the number of eggs was around 2<br />
million eggs, however, these eggs were not viable. The average eggs diameter was 541.29 µm for<br />
the high dose and 620.31 µm for the low dose. The fertilization percentage was among 18 and<br />
100% and hatching rate among 29 and 68%. Were obtained between 1 and 3 million of viable<br />
larvae. For larvae feeding was used the rotifer Brachionus plicatilis and microalgae<br />
Nannochloropsis oculata. Larvae measured an average of 1.5 mm length.
FINAL REPORTS: INVESTIGATIONS 2009–2011<br />
No statistical analysis was performed due to insufficient fish for the application of a experimental<br />
design.<br />
METHODS AND MATERIALS<br />
Identification of native plankton for snook feeding<br />
Objective 3: Identification of native plankton used as feed during snook early development<br />
General Experimental Procedure. Phytoplankton and zooplankton was collected from the<br />
common snook spawning zones close to the Gonzalez River. The snook spawning sites were<br />
marked and three sampling sites were selected: the first site on the fishermen capture area, the<br />
second between the capture sites and the coastal line and the third in front of the coastal line.<br />
Samplings were performed for 10 minutes with plankton nets of 20, 64 and 120 µm with a boat of<br />
25 ft length at low speed. The samples were fixed with formaline at 4% and were analyzed under<br />
stereoscopic microscope.<br />
RESULTS<br />
To date we have made five monthly samples, finding a great variety of organisms: copepods,<br />
cladocerans, chaetognaths, brachyuran, clams, polychaetes, appendicularians, nematodes,<br />
luciferase, among others. However, the most abundant was registered for copepods, follow by<br />
cladocerans, meanwhile the lowest abundance was registered for caridean, nauplii and eggs (Fig. 3-<br />
7).<br />
METHODS AND MATERIALS<br />
Objective 4: Determination of the digestive enzyme gene expression during different life<br />
stages of the common snook (Centropomus undecimalis).<br />
General Experimental Procedure. Larvae and juveniles of C. undecimalis and C. parallelus were<br />
collected in quantities that allow obtaining a minimum of 150 mg of stomach, intestine and<br />
pancreatic tissue. The sampling was carried out after 12 hours of fasting for larvae and 48 hours for<br />
the juveniles and adults. Organisms were euthanized through a cold-water shock. Tissue was<br />
collected and washes with distilled water, later were submerged in an Rnasa inhibitor (RNA,<br />
ambion, AM7020, Austin, TX, USA) and were storage in liquid nitrogen until processed.<br />
Sampling was performed before first feeding by triplicate from the fertilization (400 embryo, 0<br />
DAH) and from 1, 3, 5 and 12 DAH (400 organisms per day). The embryo an larvae samples were<br />
rinsed with distilled water and transferred to Eppendorf tubes containing 1.0-1.5 mL of RNALater<br />
and storage at -80 ºC for later process.<br />
RNA extraction. The total RNA from each of the samples from embryo, larvae and the portions of<br />
intestine, stomach and pancreas which were storage in RNALater at -80 °C, was isolated according<br />
to the method of Valenzuela et al. (2005). The concentration of RNA was estimated using the<br />
equation of the Lambert-Beer law after reading in the spectrophotomer (Jenway, Genova Ltd,<br />
Felsted, United Kingdom) the absorbance (230 nm) of each of the samples. For knowing the<br />
integrity of the nucleic acids an electrophoresis was performed in an agarose gel at 1% using an<br />
aliquot of 1 µl of mix sample with 1 µl of running buffer of each of the samples at 100 volts in a<br />
electrophoresis chamber Mini Sub Cell GT (Bio-Rad, Hercules, CA, USA) for 30 minutes, the<br />
resulting bands were visualized in a documentation system of Molecular Image gel Gel Doc XR+<br />
Imaging System (Bio-Rad, Hercules, CA, USA). Once we evaluated the integrity of the genetic<br />
378
379<br />
FINAL REPORTS: INVESTIGATIONS 2009–2011<br />
material of each of the samples the aliquots were made from each of the dissected organs according<br />
with the obtained concentration, resulting in a final concentration of 0.5– 1µg/µl of RNA.<br />
Reverse transcription of the Polymerase Chain Reaction (RT-PCR). One microgram of the total<br />
RNA of each of the samples of intestine, stomach and pancreas was reversibly transcribed<br />
according to the instructions from the kit SuperScript III One-Step RT-PCR System con Platinum<br />
Taq DNA Polymerase (Invitrogen, Carlsbad, CA, USA) using the specific primers for the ubiquitin<br />
(UB), pancreatic lipase (LIP) y trypsin (TRY) genes in a total volume of 25µl in a real time<br />
thermocycler iCycler IQ5 Multicolor real-time PCR detection system (Bio-Rad, Hercules, CA,<br />
USA). The nucleotide sequence and the alignment temperature for each enzyme used in this study<br />
are detailed in Table 1.<br />
The PCR conditions for the reverse transcription in one step of the enzymes were: 1 cycle of 30<br />
minutes at 55 °C; 1 cycle of 94°C; 30 cycles of 1 minute at 94°C, one minute to the specific<br />
temperature for each enzyme, two minutes at 72°C; ten minutes at 72°C. The amplify products were<br />
visualized in an agarose gel at 2%, using a stair of 100 pb with marker (Promega, Madison, WI,<br />
USA). The observed bands were cropped from the gel and purified using the Wizard SV gel and<br />
PCR clean-up system (Promega, Madison, WI, USA) kit. The purified bands were send to the<br />
Unidad de Síntesis y Secuenciación from the Instituto de Biotecnología de la UNAM for its<br />
sequenced.<br />
The different obtained sequences of digestive enzymes were analyzed using BLAST<br />
(www.ncbi.nlm.nih.gov/BLAST) for identification according with reported in the database.<br />
Real Time Polymerase Chain Reaction (qRT-PCR). The total RNA from the common snook<br />
larvae from days 0, 1, 3, 5 and 12 after fertilization, which was stored in RNALater, was isolated as<br />
mentioned above. The reverse transcription was performed according with the kit Improm-II<br />
Reverse Transcriptase (Promega). The experiments of qRT-PCR were carried out in order to<br />
observe the RNAm expression during the digestive system development. The specific primers for<br />
the ubiquitin (UB), pancreatic lipase (LIP) and trypsin (TRI) (trypsinogen) were designed based on<br />
the obtained sequence in this study (Table 2).<br />
β-actin amplification was carried out using specific primers choose from the comparison of<br />
different ARNm and represented a very conserved region of nucleotide in order to confirm the<br />
expression level of a domestic gen and provide a intern control (Table 2). For this, aliquots of 20µl<br />
were taken from the reaction mix, which was prepared with iQ SYBR Green Super Mix (Bio-Rad)<br />
and the specific primers (UB5’ and UB3’ of ubiquitin, LIP5’ and LIP3’ of pancreatic lipase, TRY5’<br />
and TRY3’ of trypsin, ACT5’ and ACT3’ of β-actin for qRT-PCR) for a final concentration of<br />
1µM. The qRT-PCR protocol consisted in one cycle at 95°C for 15 minute follow by 35 cycles of 1<br />
minute at 94°C, one minute at the specific temperature of each gen and 3 minutes at 72°C. The<br />
reactions were performed by duplicate and each level of expression was calculated according to the<br />
2- ΔΔCt (Livak y Thomas, 2001) method. The mixture of transcribed genes was made in a real time<br />
thermocycler StepOne Real-Time PCR System (Applied Biosystems, Foster City, CA, USA).<br />
RNA extraction: the total extraction of RNA was performed according with TRIZOL protocol.<br />
Later the RNA will be treated with Dnasa I for eliminate the genomic DNA. The reverse<br />
transcription will be performed using the commercial kit from Improm II.
FINAL REPORTS: INVESTIGATIONS 2009–2011<br />
RESULTS<br />
PCR amplifications. The amplification by PCR using the primers of Table 1 had as result products<br />
of 700, 350 and 200 pb for RTAMI (amylase) in intestine, which were named RTAMI1, RTAMI2<br />
Y RTAMI3 correspondingly, 1200 pb for TLPCA (lipase) in pancreas and 800 pb for TRINA<br />
(trypsine) in the intestine (Fig. 8). In the case of TAPSA (aminopeptidase) and PEPNOT<br />
(pepsinogen) nothing was observed in the agarose gel.<br />
Sequence analysis. From the five PCR products with their primers send to sequence only three of<br />
them were possible of obtain sequence products (Table 3). When doing the sequence analysis on<br />
BLAST, was observed that in the case of the sequencing products of RTAMI3, the sequence had a<br />
similitude of 90% with the partial pancreatic lipase of the Japanese snapper (Pagrus major). In the<br />
alienation of the TRINAR sequencing a maximum identity (95%) was found with the trypsinogen<br />
of the Blowfish (Takifugu rubripes). In table 4 we can observed with more detail the similitude<br />
found for RTAMI3, TLPCA y TRINAR en el BLAST.<br />
Genes relative quantification. For the determination of the expression levels of ARNm in the<br />
different days of collection of C. undecimalis, a relative quantification was performed of PCR-TR<br />
(Table 5). For the ubiquitin was observed the gen expression from day 0 with respect to the<br />
intestine, expressing 0.32 copies of RNAm, this is that the expression was less than in the intestine.<br />
The day 5 (0.76 copies RNAm) was expressed a little more than double than in day 0 although, in<br />
less quantity than in the intestine. For days 1, 3 and 12 was not possible to calculate the expression<br />
level due to values for Ct en el PCR-TR were not obtained. For trypsinogen was observed the gen<br />
expression from day 3 (0.33 copies RNAm) with respect to the intestine and increased for day 5 to<br />
0.47 copies RNAm. No values of Ct from days 0, 1 and 12 in trypsinogen gen were obtained. In the<br />
case of the pancreatic lipase we observed that in day 0 there were 8.05 copies greater than in the<br />
pancreas.<br />
METHODS AND MATERIALS<br />
Objective 4: Determination of the digestive enzyme gene expression during different life<br />
stages of the fat snook (Centropomus parallelus).<br />
Five adult fish (150 g mean weight) were captured in the coastal shore of Jalapita, Paraiso, Tabasco,<br />
Mexico. Fish were transported to the Laboratorio de Acuicultura Tropical de la DACBIOL-UJAT<br />
and maintained in one 2000-L circular plastic tank for 48 h without feeding. To obtained samples of<br />
intestine, fish were sacrificed after anesthetized with MS-222, and individual dissection of anterior<br />
intestine was obtained. The sampling of the fish was realized to the 7:30 A.M. The intestines were<br />
rinsed with distilled water, placed in vials and freeze introducing them immediately in liquid<br />
nitrogen. The samples collected, were dissected in cold on a Petri dish sterilized and placed on a<br />
cold plate. The fresh, individual and total weight was registered, and they were finally submerged<br />
into inhibiting buffer of RNAses (RNA Later, Ambion, AM7020, Austin, TX, USA) for they<br />
transport and processing in Biological Research center of the Northwest in La Paz, B.C.S.<br />
Extraction of RNA<br />
The total extraction of RNA took place from the homogenized of the intestines (125 mg of wet<br />
tissue), according to the protocol of the reagent of TRIZOL Invitrogen, (Life Technologies SKU#<br />
15596-018, California, USA). Later, the RNA was dealt with DNAse I (Deoxyribonuclease I,<br />
Amplification Clay, Invitrogen Cat. No. 18068-015 the USA, Tree-lined avenue, CA, USA) to<br />
eliminate the genomic DNA. For the retro-transcription use kit commercial Improm II (Promega,<br />
A3800, Wisconsin, USA).<br />
380
381<br />
FINAL REPORTS: INVESTIGATIONS 2009–2011<br />
Design of primers<br />
To performed the PCR, the primers used for this study were design for the European sea<br />
Dicentrachus labrax (Peres et al. 1998), registered in www.ncbi.nhl.nih.gov (Table 6). In addition<br />
electrophoresis was realized in agarose gels (1%) to determine the best temperature for<br />
amplification, and bands were stained with ethidium bromide. These bands were recovered using<br />
the protocol of kit GENE CLEAN SPIN KIT (BIO 101 INC., Californian, USA) and sent to<br />
Macrogen Inc. Korea for their sequencing.<br />
Amplification of cDNA<br />
The amplification of cDNA was realized in a thermocycler Icycler (BIO-RAD ICYCLER,<br />
California, USA) with system of temperature gradient, optimizing itself in terms of temperature of<br />
alignment and concentration of Mg 2+ .<br />
The reactions for a PCR were carried out in 50 µl, containing 50 pmol of forward and reverse<br />
primers of the trypsin gene, 1 µl of cDNA, 0,5 Or of Taq polymerase (Invitrogen), 100µM of dNTP<br />
and 1X of buffer solution (Invitrogen), under the following conditions: 30s to 95°C; 35 cycles of 1<br />
min. to 95°C, 1:30 s to 60°C, 2 min to 72°C; 7 min to 72°C; 4°C ∞.<br />
The purity of cDNA was quantified by means of biophotometer (Eppendorf, 22331), being the<br />
standard of reading of double chain (dsDNA) for cDNA higher to 1,6 and lower to 2.1 µg ml -1 . The<br />
amplification products were separated by electrophoresis in agarose to the 1,5% (A5054 Sigma,<br />
Missouri, USA) and later analyzed in a photodocumentator (transiluminator Gel-Pro, C-62, CA,<br />
USA). The recovery of the DNA was obtained cutting to the bands of interest with a sterile bistoury<br />
in the transiluminator and for the purification use the protocol of kit GENE CLEAN SPIN KIT<br />
(BIO-RAD 101, CA, USA).<br />
Finally, the amplified segments by PCR were cloned according to the protocol of kit TOPO TA<br />
CLONING (Invitrogen n° K4550-40, California, USA) using competent cells of E. coli Top 10F'<br />
and the plasmid pCR 2,1 like a vector. Once cloned, plasmids of the cells of E. coli were obtained<br />
using the procedure of kit RPM (BIO 101, California, USA) to be sequence and obtain their<br />
homologies with the banks of sequences.<br />
Polymerase chain reaction (PCR)<br />
The PCR of trypsin gene cDNA, was realized according to the protocol suggested by Applied<br />
Biosystems user’s guide using specific Taqman® probes for the genes and the method of standard<br />
curve with plasmids. This was carried out in a thermocycler (Applied Biosystem, Abi Prism® 7000<br />
Sequence Detection System, 4330087, California, USA). The PCR reactions were carried out in<br />
plates of 96 wells under the following conditions: 1 cycle to 50°C for 2 min; 1 cycle to 95°C for 10<br />
min; 40 cycles to 95°C for 15 sec and 60°C for 1 min.<br />
A set of sequential dilutions (0, 10, 100, 1000, 10 000, 100 000 and 1 000 000) of the plasmid<br />
containing inserted of the trypsin gen at 50 µg ml -1 and the 18S rRNA gene (Applied Biosystems),<br />
which was used like endogenous control.<br />
Simultaneously, amplification of the trypsin gene of each individual intestine samples were realized<br />
(M1D0-M16D30), which were prepared using cDNA, corresponding to every day of the sample,<br />
with an approximated concentration of 1000 µg ml -1 , TaqMan® Universal PCR Masters Mix<br />
(4331348 CA, USA) and a specific Taqman probes (4331348, Custom Taqman (R) Gene Assay<br />
Service TRYTG2007-TTD, CA, USA) for trypsin gene for C. parallelus. The corresponding<br />
calculations were realized on the basis of the protocol User Bulletin #2 of ABI PRISM 7700<br />
Sequence Detection System.
FINAL REPORTS: INVESTIGATIONS 2009–2011<br />
Analysis of similarity<br />
Combined to the study of the amplification of the trypsin, an analysis of similarity was realized<br />
comparing our sequence with other sequences of fish species. The sequences were obtained from<br />
the GenBank/EMBL/DDBJ using Educative Surroundings of “Biology Workbench” on line to<br />
perform the blast. The species selected for this analysis were: Pleurogrammus azonus (AB441709),<br />
Tribolodon hakonensis (AB445492), Salvelinus leucomaenis (AB447372), Sparus aurata<br />
(AF316852) Danio rerio (AJ297822), Dicentrarchus labrax (AJ006882), Paralabrax<br />
maculatofasciatus (AJ344566), Oreochromis niloticus (AY510093 and AY737394), Oreochromis<br />
aureus (AY510094), Chelon labrosus (AY628239), Symphysodon aequifasciatus (AY690664),<br />
Cebidichthys violaceus (AY973822), Anoplarchus purpurescens (AY986477), Xiphister mucosus<br />
(AY986478), Xiphister atropurpureus (AY986479), Spinibarbus sinensis (DQ839550),<br />
Myxocyprinus asiaticus (EF493027), Menidia estor (FJ859998), Salmo salar (X70071, X70073,<br />
X70074 and X70075) and Paranotothenia magellanica (X82223). The alignment of these<br />
sequences allowed calculates the percentage of similarity and the dendrogram.<br />
RESULTS<br />
Amplification of cDNA<br />
The amplification of cDNA from C. parallelus trypsin gen gave us a product of 525 pair of bases<br />
pair (pb) (Fig. 10). Additionally, in figure 11 we showed the gene sequence and the amino acid<br />
sequence (75 amino acids) for the partial trypsin gene of this species.<br />
Analysis of similarity<br />
An alignment of the nucleotides sequences of the trypsin gene in relation to a great variety of fish<br />
species was conducted. This analysis revealed that the trypsin gene enough is low conserved with<br />
species such as Sparus aurata (12.04%), Chelon labrosus and Myxocyprinus asiaticus (12.10% and<br />
20.08% respectively); on the other hand, the highest similarity percentage was determined with<br />
Myxocyprinus asiaticus (39.86%) and Dicentrarchus labrax (39.40%) (Table 7).<br />
On the basis of the pre-alignment of the sequences, a dendrogram was created, which demonstrates<br />
the close relation of the trypsin genes in several fish species, since it can be observed that they come<br />
from a common ancestor. With respect to the C. parallelus it can be observed that one is in the<br />
same group that S. aurata (Fig. 12).<br />
DISCUSSION<br />
The study of obtaining a broodstock of common snook suggests that the growth of juveniles from<br />
the coast of Tabasco, have a similar growth in captivity similar to reports from Sánchez-Zamora et<br />
al., (2003) they suggested in their study that this specie have a growth of 0.8 g in a year and our<br />
study indicates a growth of 0.7 g per month. For the case of growth in length studies like Aliume<br />
(2000) mention that common snook could have an increment of 0.04 cm. Our study suggest a gain<br />
in length pretty similar, with data of 1.03 cm/day.<br />
With respect to the reproduction induction of C. undecimalis and C. poeyi through implants, was<br />
possible to obtain spawns and larvae using GnRH-a, with 100 µg/fish with oocytes diameter of<br />
333.00 ± 54.08µm and salinities from 21 ppt in C. undecimalis. The spawning obtained in our study<br />
match the reproductive season reported for C. undecimalis by Taylor et al. (1998) in the coast of<br />
Florida and by Perera et al. (2008) in the coast of Tabasco. Was also possible to identify that in C.<br />
poeyi the spawning season is similar for C. undecimalis in captivity conditions. This indicate that<br />
common snook and Mexican snook populations maintained in captivity completed the oogenesis<br />
through a hormonal stimulus. Our results match with other studies of common snook, where they<br />
have obtained spawn with viable larvae in fish keep in captivity using implants. However, the<br />
382
383<br />
FINAL REPORTS: INVESTIGATIONS 2009–2011<br />
effective dose (50 µg/kg de GnRH-a) varies in the method to apply, which is according to fish<br />
weight (Soligo, 2007). In this study, the percentage of fertilization was 6% and survival 7.5%.<br />
Skapura et al. (1999) evaluated implants in C. undecimalis with dose of 10 µg/kg/day during five<br />
days, using a control group and a placebo group. Results indicated that the used of the mGnRH,<br />
sGnRH and cGnRH-II implant allow the success in ovulation and Neidig et al (1999) determined<br />
that the used of Human Chorionic Gonadotropin (GCH) in C. undecimalis with dose of 500 IU/kg<br />
of weight produced ovulation, good quality eggs and larvae survival. Our results are also similar to<br />
the obtained with fat snook (C. parallelus) using the same dose (100 y 200 µg/fish) of GnRH-a with<br />
the implants technique (Contreras-García, 2011). The percentage of fertilization with 100% in some<br />
experimental units and hatching of 10% in some cases, were also similar, in addition successful<br />
spawning occurred in C. poeyi with results of 100% fertilization.<br />
Cerqueira (2009) with fat snook used LHRHa implants and obtained four consecutive spawning<br />
with the same female. That study allowed the observation that the larvae survival until juvenile<br />
stage was only of 1%, increasing in later inductions to 30%.<br />
The above suggest that the use of GnRH-a gives a balance stimulus and probably a better<br />
integration in the reproductive event with other physiologic functions, affecting direct or indirectly<br />
hormone release necessary for the success in final oocytes maturation, the spermiation and the<br />
spawning (Zohar y Mylonas, 2001).<br />
In other fish of the Centropomidae family such as Lates calcarifer (barramundi), Almendras et al.<br />
(1988) obtained multiples spawning using implants of GnRH-a. A female spawned around 7 million<br />
eggs with a percentage of fertilization and hatching of 90% in both cases. The larvae survival in this<br />
study was 60.8%. Also was observed that only one male was able of fertilize the eggs of a four<br />
consecutive spawning from one female. In our study, the percentage of fertilization is also similar to<br />
the barramundi data, only for the number of larvae was different being our less. Also, Ibarra-Castro<br />
et al. (2009) obtained larvae in barramundi, from lower dose than our dose (50 µg/kg per female<br />
and 25 µg/kg per male) with fertilization percentage (90%) also similar to our study.<br />
In other fish, Basaran et al. (2009) increased the success in the reproduction of the drum fish<br />
through injections and implants obtaining spawning 70 to 72 hours post injection and 89 to 90 hours<br />
post implant. The oocytes diameter obtained with the first technique was 767.5±1.0 μm and<br />
753.5±1.3 μm under the second technique. For our study, the oocytes diameter was similar to the<br />
reported for this fish through implants.<br />
Mylonas et al. (2004) used GnRH-a through implants in Seriola dumerili (greater amberjack). In<br />
this study, spawnings were obtained around 36 hours post implant and 15 days later. The<br />
fertilization was around 100%. In the common snook the used of GnRH-a also is effective through<br />
implants for the success in reproduction obtaining spawning in similar times to the reported for<br />
greater amberjack. Marino et al. (2003) also used implants of D-Ala6, Pro9, NEt]-GnRH (GnRH-a)<br />
with dose of 30.5 to 68.3 μg/kg in Epinephelus marginatus (dusky grouper). The 85% percentage of<br />
the organisms responded to the induction and ovulated between 60 to 238 hours post implant (eggs<br />
were obtained with abdominal pressure), while the control group did not mature. The percentage of<br />
fertilization was between 48.2% and 52.2%.<br />
Results showed that GnRH-a through implants is an effective method for produce eggs of good<br />
quality in greater amberjack in captivity. In the present study, spawned the 66.7% of the females<br />
being the spawning times less than the reported for greater amberjack. As well as with the greater<br />
amberjack, we could not obtain spawning with the control group therefore the used of GnRH-a is<br />
ideal for obtain viable larvae of these fish.
FINAL REPORTS: INVESTIGATIONS 2009–2011<br />
In C. undecimalis and C. poeyi we obtained similar average in larvae size to those obtained by<br />
Peters et al. (1998) they identified that larvae hatched in Florida measured 1.4 to 1.5 mm. The<br />
obtained larvae only survived to the fourth day after the absorption of the yolk sac. To this respect,<br />
Witenrich et al. (2009) mention that snook larvae mortality can be explain to the lack of adequate<br />
prey in the early life stages. In these stages larvae have rudimentary skeletal elements and at the<br />
first feeding the larvae have a digestive system little developed, which can restrict its ability to<br />
consume preys.<br />
Witenrich et al. (2009) mentions that the mortality of snook larvae is attributed a la carencia de una<br />
presa adecuada en las primeras etapas de vida. En estas etapas las larvas presentan elementos<br />
esqueléticos rudimentarios y a la primera alimentación las larvas presentan un aparato digestivo<br />
poco desarrollado que puede restringir su capacidad para consumir las presas.<br />
Finally, we can mention that the success in the present study is due to mainly to the maintenance of<br />
the broodstock for several years under captivity with perfect feeding and handling strategies<br />
therefore the used of GnRH-a implants was efficient to allow the completion of the final oocytes<br />
maturation with a slowly release of the hormone, even when the oocytes diameter before the<br />
treatment application was less to the ideal diameter reported for snooks.<br />
By other hand, in the identification of the native plankton, we found that in the different sampling<br />
zones the most abundant organisms were copepods. This will be a probably indicator that snook<br />
larvae consume copepods in their first life stages. This abundance increases importantly for the<br />
month of May which match with the natural reproduction season of common snook, reported for<br />
several authors.<br />
This suggest that even when copepods have sizes from 0.5 to 3 mm snook larvae could be<br />
consuming any of the life stages of this crustacean, such as nauplii stages with sizes of 50 µm.<br />
Authors like Streble y Krauter (1987), consider these microcrustaceans together with rotifers the<br />
most important feed for many organisms for their early life stages. The follow most abundant class<br />
in the spawning sites was cladocerans in this study, which indicate that could be the second feed<br />
used by larvae in later life stages. Other authors such as Stottrup y Norsker (1997) indicate that the<br />
inclusion of copepods in the marine fish larvae culture sustain a normal development and a good<br />
larval growth.<br />
Payne y Rippingale (2000) mention that copepods constitute the natural feed of the marine species<br />
larvae and represent a high content of the essential fatty acids and antioxidants. All of the above<br />
reinforce the probability of snook larvae are feeding of these organisms either in their nauplius or<br />
copepodite stages.<br />
As the study of the gene expression, we could identify three of them which act during the initial<br />
ontogeny of the common snook; ubiquitin, trypsinogen and pancreatic lipase. This study give new<br />
information, due to this is the first work where digestive enzymes sequencing and PCR-TR for the<br />
specie C. undecimalis.<br />
Given that there is no knowledge of the common snook genome the β-actin was selected as the<br />
normalize gene for the experiments with PCR-TR considering the reported for other species (Darias<br />
et al., 2006; Murray et al., 2004; Oku et al., 2006). However, according with the observations in our<br />
study (Fig. 9) the β-actin was not constant thus exist changes in the expression in all the sampled<br />
days, suggesting that it is necessary to explore new possibilities of reference genes for future studies<br />
with C. undecimalis.<br />
According with other studies (Murray et al., 2004) the trypsinogen is detected since day 5. The<br />
levels of ARNm not only are influenced by the regulation of the gene expression, there are more<br />
384
385<br />
FINAL REPORTS: INVESTIGATIONS 2009–2011<br />
conditions such as: nutrition, size differences and the tissue components which could influence the<br />
ARNm levels from the gene working on (Hibbeler et al., 2008) thus it is important to keep<br />
investigating the effects of feeding or the age in the gene expression in this specie. The activity of<br />
the pancreatic lipase is not only regulated at the transcriptional level but also at the<br />
posttranscriptional level (Birk and Brannon, 2004).<br />
CONCLUSIONS<br />
The adaptations to captivity conditions in C. undecimalis is factible, using as feed semihumid<br />
balance diets<br />
The use of GnRH-a through implants in common snook C. undecimalis and Mexican snook C.<br />
poeyi allow the oocytes maturation induction and generate spawning in captivity.<br />
Besides, viable larvae were obtained from dose of 100 µg per female independently of its weight.<br />
The spawning could be obtained in salinities of 21 ppt for the common snook; a value under the<br />
reported in the literature for this specie and from 30 ppt for the Mexican snook.<br />
The use of life feeds such as copepods could be viable for the survival of the snook larvae.<br />
REFERENCES<br />
Aliaume, C., Zerbi, A., Joyeux, J. C. and Miller, J. M. 2002. Growth of juvenile Centropomus<br />
undecimalis in a tropical island. Environmental Biology of Fishes 59: 299–308.<br />
Almendras, J. M., Duenas, C., Nacario, J., Sherwood, N. M. and Crim, W. L. 1988. Sustained hormone<br />
release. III. Use of gonadotropin releasing hormone analogues to induce multiple spawnings in sea<br />
bass, Lates calcarifer. Aquaculture 74: 97-111.<br />
Álvarez-Lajonchere, L., Cerqueira, R. V., Reis M. 2002. Desarrollo embrionario y primeros estudios<br />
larvales del robalo chucumite, Centropomus parallelus Poey (Pisces, Centropomidae) con interés<br />
para su cultivo. Hidrobiológica, 132 (002): 89-99.<br />
Álvarez-Lajonchere L and Hernández-Molejón, O. G. 2001. Producción de juveniles de peces<br />
estuarinos para un centro en América Latina y el Caribe: Diseño, operación y tecnologías. The<br />
World Aquaculture Society, Baton Rouge, LA, 424 pp.<br />
Alves, T. T., Cerqueira, R. V. and Brown, J. A. 2006. Early weaning of fat snook (Centropomus<br />
parallelus Poey 1864) larvae. Aquaculture 253 (2006) 334– 342.<br />
Araújo, J. and Cerqueira, V. R. 2005. Influência da salinidade na incubação de ovos do robalo-peva<br />
(Centropomus parallelus Poey, 1860). Maringá, 72: (1), 85-89.<br />
Başaran, F., Muhtaroğlu, C. G., Özden, O. and Özkızılcık S. 2009. Spawning behaviour of shi drum<br />
(Umbrina cirrosa) after hormone administration. Journal of FisheriesSciences.com. 3(2): 124-133.<br />
Birk, R.Z., Brannon, P.M., 2004. Regulation of pancreatic lipase by dietary medium chain triglycerides<br />
in the weanling rat. Pediatr. Res. 55, 921-926.<br />
Caballero-Chávez, V. 2009. Talla de primera madurez y composición de las capturas del robalo blanco<br />
en sur de Campeche. In: Segundo Simposio Internacional sobre Biología y Cultivo de robalos.<br />
Villahermosa, Tabasco, México. Aquafish. Collaborative Research Support Program. p26.<br />
Castro-Aguirre. 1999.<br />
Cerqueira, R. V. 2009. Spawning and larviculture of the fat snook (Centropomus parallelus) and the<br />
common snook (Centropomus undecimalis) in Brazil. In: Segundo Simposio Internacional sobre<br />
Biología y Cultivo de robalos. Villahermosa, Tabasco, México. Aquafish. Collaborative Research<br />
Support Program. p26.
FINAL REPORTS: INVESTIGATIONS 2009–2011<br />
Cerqueira, V. R. and Canarín, M. 2008. Multiple spawning of the fast snook Centropomus parallelus<br />
using different dosage of LHRH. Cybium 2008: 32(2) suppl.: 330-331.<br />
Cerqueira, V. R., Mioso, R. and Canarin, M. 2005. Indução de desova com fertilização natural e<br />
artificial e incubação de ovos do robalo-peva (Centropomus parallelus). Atlântica, Rio Grande 27<br />
(1): 31-38.<br />
Cerqueira, V. R. and Tsuzuki, M. Y. 2009. A review of spawning induction, larviculture, and juvenile<br />
rearing of the fat snook, Centropomus parallelus. Fish Physiol Biochem 35:17–28.<br />
Chávez, H. R. 1963. Contribución al conocimiento de la Biología de los robalos, Chucumite y<br />
Constantino (Centropomus undecimalis) del Estado de Veracruz, México. Ciencia 22 (5): 141-161.<br />
Contreras-García, M. de J. 2011. Inducción de la reproducción en Centropomus undecimalis y<br />
Centropomus parallelus bajo condiciones de cautiverio empleando inyecciones e implantes de<br />
GnRH-a. Tesis de Maestría. Universidad Juárez Autónoma de Tabasco. 103p.<br />
Darias, M.J., Murria, H.M., Gallant, J.W., Astola, A., Douglas, S.E., Yufera, M., Martínez-Rodríguez,<br />
G., 2006.Characterization of a partial a-amylase clone from red porgy (Pagrus pagrus): Expression<br />
during larval development. Comp. Biochem. Physiol., Part B 143, 209-218.<br />
Ferraz, M. E., Cerqueira, R.V., Álvarez-Lajonchere, L. and Candido, S. 2002. Inducao da desova do<br />
robalo peva, Centropomus parallelus, a través de injecao e implante de LHRHa. Boletim do<br />
Instituto de Pesca, Sao Paulo 28 (2): 125-133.<br />
Garduño-Dionate, M., Lorán-Nuñez, R. M., Martínez-Isunza, F. R. and Márquez-García E. 2009.<br />
Fecundidad de robalo blanco, Centropomus undecimalis en la costa de Ciudad del Carmen,<br />
Campeche. In: Segundo Simposio Internacional sobre Biología y Cultivo de robalos. Villahermosa,<br />
Tabasco, México. Aquafish. Collaborative Research Support Program. p26.<br />
Godinho, H. M., Da Silva-Serralheiro, P. C., De Medeiros-Ferraz, E., Marcondes-Pimentel, C. M., Da<br />
Rocha-Oliveira, I. and De Paiva, P. 2000. Reprodução induzida em robalo Centropomus parallelus<br />
Poey, 1860. Brazilian Journal of Veterinary Research and Animal Science 37 (1): 37-42.<br />
Gómez-Díaz-Durán, L. M. 2002. Inducción a la maduración y desove del robalo blanco Centropomus<br />
undecimalis (Bloch, 1972) (Pisces: Centropomidae) mediante la aplicación coriónica humana y una<br />
análoga de la hormona liberadora de la hormona luteinizante. Tesis doctoral. Universidad Nacional<br />
Autónoma de México, Facultad de Ciencias, México, D. F. 70 p.<br />
Grier, H. 2000. Ovarian germinal epithelium and folliculogenesis in the common snook, Centropomus<br />
undecimalis (Teleostei: Centropomidae). Journal of Morphology 243: 265-281.<br />
Grier, H. J. and Taylor, R. G. 1998. Testicular maturation and regression in common snook. Journal of<br />
Fish Biology 53 (3): 521-442.<br />
Hernández-Vidal, U. 2002. Identificación del sexo y evaluación de la inducción hormonal en el<br />
pejelagarto (Atractosteus tropicus). Tesis de Maestría. Universidad Autónoma de Nuevo León,<br />
Facultad de Ciencias Biológicas, Monterrey, Nuevo León, México 83 p.<br />
Hibbeler, S., Scharsack, J.P., Becker S., 2008. Housekeeping genes for quantitatitative expression<br />
studies in the thre-spinned stickleback Gasterosteus aculeatus. BMC Mol Biol. 9:18.<br />
Holt, G. J. and Kline, R. 2009. Culturing Texas snook: What we have learned so far. In: Segundo<br />
Simposio Internacional sobre Biología y Cultivo de robalos. Villahermosa, Tabasco, México.<br />
Aquafish. Collaborative Research Support Program. p26.<br />
Ibarra-Castro L, Shipp, G. and Alvarez-Lajonchère L. 2009. Culture of the Asian snook (Lates<br />
calcarifer, Bloch) in Australia. In: Segundo Simposio Internacional sobre Biología y Cultivo de<br />
robalos. Villahermosa, Tabasco, México. Aquafish. Collaborative Research Support Program. p26.<br />
Main, K., Yanes-Roca, C. and Rhody, N. 2009. Status and challenges in larval rearing and fingerling<br />
aquaculture of common snook (Centropomus undecimalis) in Florida. In: Segundo Simposio<br />
Internacional sobre Biología y Cultivo de robalos. Villahermosa, Tabasco, México. Aquafish.<br />
Collaborative Research Support Program. p26.<br />
McMichael, R. H. Jr., Peters, K. M. and Parsons, G. R. 1989. Early life history of the snook<br />
Centropomus undecimalis, in Tampa Bay, Florida. Northern Gulf Science 10 (2): 113-125.<br />
386
387<br />
FINAL REPORTS: INVESTIGATIONS 2009–2011<br />
Marino, G., Panini, E., Longobardi, A., Mandich, A., Finoia, M. G. Zohar, Y. and Mylonas, C. C. 2003.<br />
Induction of ovulation in captive-reared dusky grouper, Epinephelus marginatus (Lowe, 1834), with<br />
a sustained-release GnRHa implant. Aquaculture 219: 841–858.<br />
Murray, H.M., Perez-Casanova, J.C., Gallant, J.W., Johnson, S.C., Douglas, S.E., 2004. Trypsinogen<br />
expression during the development of the exocrine pancreas in winter flounder (Pleuronectes<br />
americanus). Comp. Biochem. Physiol., A. 138, 53-59.<br />
Mylonas , C., C., Papandroulakisa, N., Smboukisb, A. Papadakia, M. and Divanacha, P. 2004. Induction<br />
of spawning of cultured greater amberjack (Seriola dumerili) using GnRHa implants. Aquaculture<br />
237: 141–154.<br />
Neidig, C. L., Skapura, D. P, Grier, .H. J. and Sprinkel, J. M. 1999. A preliminary study- A comparison<br />
of doses of Human Chorionic Gonadotropin(HGC) on ovulation, eggs quality and larval survival in<br />
common snook, Centropomus undecimalis (Bloch) In: Proceedings of the Sixth International<br />
Symposium on Reproductive Physiology of Fish; 1999 4-9 Jun; Bergen, Norway; p 429.<br />
Oku, H., Koizumi, N., Okumura, T., Kobayashi, T., Umino, T., 2006. Molecular characterization of<br />
lipoproteine lipase, hepatic lipase and pancreatic lipase genes: Effects of fasting and refeeding on<br />
their gene expression in red sea bream Pagrus major. Comp. Biochem. Physiol., B. 145, 168-178.<br />
Payne, M. F. and Rippingale, R. J. 2000. Evaluation of diets for cultura of the calanoid copepod<br />
Gladioferens imparipies. Aquac 187:85-96.<br />
Perera-García, M. A., Mendoza-Carranza M. and Páramo-Delgadillo, S. 2008. Dinámica reproductiva y<br />
poblacional del robalo, Centropomus undecimalis (Perciformes: Centropomidae), en Barra San<br />
Pedro, Centla, México. Universidad y Ciencia, Trópico Húmedo 24(1): 49-59.<br />
Perera-García M. A., Mendoza-Carranza, M., Contreras-Sánchez, W., Pérez-Sánchez, E. Huerta-Ortiz,<br />
M. y Páramo-Delgadillo, Salomón. 2009. Biología reproductiva y poblacional del robalo blanco,<br />
Centropomus undecimalis, en dos ambientes tropicales,Tabasco, México. In: Segundo Simposio<br />
Internacional sobre Biología y Cultivo de robalos. Villahermosa, Tabasco, México. Aquafish.<br />
Collaborative Research Support Program. p26.<br />
Peters, K. M, Mathenson, R. E. Jr. and Taylor, R. G. 1998. Reproduction and early life history of<br />
common snook, Centropomus undecimalis (Bloch), in Florida. Bulletin of Marine Science 62 (2):<br />
509-529.<br />
Reis, M. D. y Cerqueira, R. V. 2003. Indução de desova do robalo-peva Centropomus parallelus Poey<br />
1860, com diferentes doses de LHRHa. Maringá, V. 25 (1): 53-59.<br />
Roberts, R. 2002. Nutritional pathology, In: Fish Nutrition, p 453-504 (Edit.: Halven, E. J. y Hardy, W.<br />
R.824P.<br />
Sánchez-Zamora, A., García Galano, T., Gómez-Díaz-Duran., L. M. y Suárez Bautista, J. 1999. Cultivo<br />
de robalo Centropomus undecimalis: Aspectos reproductivos y crecimiento de juveniles. Memorias<br />
de la IV Reunión Nacional de Redes de Investigación en Acuacultura. V reproducción y genética.<br />
Octubre 1999 Cuernavaca, Morelos, México. 19-21.<br />
Sánchez-Zamora, A., Rosas, C., Durruty, C., Suárez, J. 2003. Reproducción en cautiverio de robalo:<br />
Una necesidad inaplazable en el sureste mexicano. Panorama Acuícola, Magazine 2003; 7:24-5.<br />
Sánchez-Zamora, A. 2009. Situación actual de la reproducción del robalo blanco en cautiverio, en la<br />
UMDI, Sisal, Yucatán. In: Segundo Simposio Internacional sobre Biología y Cultivo de robalos.<br />
Villahermosa, Tabasco, México. Aquafish. Collaborative Research Support Program. 26.<br />
Skapura, D. P., Grier, H. J., Neidig, C. L., Sherwood, N. M., Rivier, J. E. and Taylor, R. G. 1999.<br />
Induction of ovulation in common snook, Centropomus undecimalis, using gonadotropin-releasing<br />
hormones. In: Proceedings of the Sixth International Symposium on Reproductive Physiology of<br />
Fish; 1999 Jun 4-9; Bergen, Norway; p 430.<br />
Soligo, A. T. 2007. Primeiras experiencias com a reproducao, larvicultura e desmame do robalo-flecha,<br />
Centropomus undecimalis no Brazil. Universidad Federal de Santa Catarina. Programa de Pós-<br />
Graduacao em Aquicultura, Florianópolis, 40 p.<br />
Stottrup, J. G. and Norsker, N. H. 1997. Production and use of copepods in marine fish larviculture.<br />
Aquaculture 155:231-247.
FINAL REPORTS: INVESTIGATIONS 2009–2011<br />
Streble, H., Krauter, D. 1987. Atlas de los microorganismos de agua dulce, la vida en una gota de agua.<br />
Omega, Barcelona.<br />
Taylor, R. G., Grier, H. J. and Whittington, J. A. 1998. Spawning rhythms of common snook in Florida.<br />
Journal of Fish Biology 53: 502-520.<br />
Tonini, W. C. T., Braga L. G. T. and Vila Nova D. L. D. 2007. Dieta de juvenis do robalo Centropomus<br />
parallelus POEY, 1860. No Sul da Bahia, Brazil. B. Inst. Pesca, São Paulo, 33(1): 85 - 91.<br />
Tsuzuki, M. Y., Cardoso, F. R. and Cerqueira, V. R. 2008. Growth of juvenile fat snook Centropomus<br />
parallelus in cages at three stocking densities. B. Inst. Pesca, São Paulo, 34(2): 319 – 324.<br />
Tucker, W. J. and Campbell, W. S. 1988. Spawning season of common snook along the east central<br />
Florida coast. Florida Scientist, 51 (1): 2-6.<br />
Wittenrich, M. L. Rhody, R. N., Turingan, R. G. and Main, K. L. 2009. Coupling osteological<br />
development of the feeding apparatus with feeding performance in common snook, Centropomus<br />
undecimalis, larvae: Identifying morphological constraints to feeding. Aquaculture 294: 221–227.<br />
Zohar, Y. and Mylonas, C. 2001. Endocrine Manipulations of spawning in cultured fish: From<br />
hormones to genes. Aquaculture 197: 99-136.<br />
388
Weight ( g )<br />
140<br />
120<br />
100<br />
80<br />
60<br />
40<br />
20<br />
0<br />
Length ( cm )<br />
389<br />
FINAL REPORTS: INVESTIGATIONS 2009–2011<br />
1 2 3 4 5 6 7 8 9 10 1 1 12<br />
Months of sampling<br />
Figure 1. Average weight of common snook juveniles in captivity during a year.<br />
30<br />
25<br />
20<br />
15<br />
10<br />
5<br />
0<br />
1 2 3 4 5 6 7 8 9 10 1 1 12<br />
Months of sampling<br />
Figure 2. Average total length of common snook juveniles in captivity during a year.
FINAL REPORTS: INVESTIGATIONS 2009–2011<br />
Number of organisms<br />
3500<br />
3000<br />
2500<br />
500<br />
400<br />
300<br />
200<br />
100<br />
0<br />
Copepods<br />
Cladocerans<br />
Chaetognaths<br />
Clams<br />
Polychaetes<br />
Brachiurus<br />
Appendicularians<br />
Copepods<br />
Clams<br />
A B C<br />
Zone of sampling<br />
Figure 3. Abundance of groups of zooplankton in April in the coast of Centla, Tabasco.<br />
Number of organisms<br />
25000<br />
20000<br />
0<br />
Figure 4. Abundance of groups of zooplankton in May in the coast of Centla,Tabasco.<br />
390<br />
Polychaetes<br />
Copepods<br />
Clams<br />
Polychaetes<br />
Copepods<br />
Cladocerans<br />
Chaetognaths<br />
Brachiurus<br />
Appendicularians<br />
Nematodes<br />
Luciferidae<br />
Copepods<br />
Cladocerans<br />
Chaetognaths<br />
Polychaetes<br />
Brachiurus<br />
Appendicularians<br />
Luciferidae<br />
Nauplio<br />
Carideo<br />
Cirriped<br />
Copepods<br />
Cladocerans<br />
Chaetognaths<br />
Appendicularians<br />
Nematodes<br />
Luciferidae<br />
Eggs<br />
A B C<br />
Zone of sampling
Number of organisms<br />
1100<br />
1050<br />
1000<br />
400<br />
200<br />
0<br />
Copepods<br />
Cladocerans<br />
Chaetognaths<br />
Brachiurus<br />
Appendicularians<br />
Nematodes<br />
Luciferidae<br />
Nauplio<br />
Carídeo<br />
Fish eggs<br />
Copepods<br />
Cladocerans<br />
391<br />
FINAL REPORTS: INVESTIGATIONS 2009–2011<br />
Brachuiurus<br />
Appendicularians<br />
Nematodes<br />
Luciferidae<br />
Nauplio<br />
Figure 5. Abundance of groups of zooplankton in June in the coast of Centla, Tabasco.<br />
Number of organisms<br />
2500<br />
2000<br />
1000<br />
500<br />
0<br />
Copepods<br />
Cladocerans<br />
Figure 6. Abundance of groups of zooplankton in July in the coast of Centla, Tabasco.<br />
Copepods<br />
Nematodes<br />
A B C<br />
Zone of sampling<br />
Chaetognaths<br />
Copepods<br />
Cladocerans<br />
Copepods<br />
Cladocerans<br />
Chaetognaths<br />
Clams<br />
Nematodes<br />
Luciferidae<br />
A B C<br />
Zone of sampling
FINAL REPORTS: INVESTIGATIONS 2009–2011<br />
Number of organisms<br />
3000<br />
2500<br />
2000<br />
1500<br />
1000<br />
0<br />
Copepods<br />
Cladocerans<br />
Chaetognaths<br />
Clams<br />
Polychaetes<br />
Brachiurus<br />
Nematodes<br />
Luciferidae<br />
Eggs<br />
Copepods<br />
Cladocerans<br />
Clams<br />
Chaetognaths<br />
Apendicularias<br />
Polychaetes<br />
Brachiurus<br />
Appendicularians<br />
Luciféridae<br />
A B C<br />
Zone of sampling<br />
Figure 7. Abundance of groups of zooplankton in August in the coast of Centla, Tabasco.<br />
392<br />
Eggs<br />
Snails<br />
Copepods<br />
Cladocerans<br />
Chaetognaths<br />
Clams<br />
Brachiurus<br />
Nematodes<br />
Luciferidae<br />
Eggs
393<br />
FINAL REPORTS: INVESTIGATIONS 2009–2011<br />
Table 1. Sequence of primers and alignment temperature of RTAMI (amylase), TAPSA (aminopeptidase), TLPCA (lipase), PEPNOT<br />
(pepsynogen) and TRINA (trypsine) used in the reactions of Reverse Transcription-PCR<br />
Primer Nucleotides sequence (5’→3’) Alignment<br />
Temperature<br />
(°C)<br />
RT-PCR RTAMI<br />
RTAMI-F<br />
RTAMI-R<br />
RT-PCR TAPSA<br />
TAPSA-F<br />
TAPSA-R<br />
RT-PCR TLPCA<br />
TLPCA-F<br />
TLPCA-R<br />
RT-PCR PEPNOT<br />
PEPNOT-F<br />
PEPNOT-R<br />
RT-PCR TRINA<br />
TRINA-F<br />
TRINA-R<br />
TTCATATTGGCGTTAGTCCT<br />
TTACAATTTGGAGTCCAAGAC<br />
TACATCAGTAAAGCTGTCGG<br />
AAGGCTCTCATGACCAAGAC<br />
AGAAGAACCGCTACTACCAG<br />
GATCTCATTCTCCTCCACCT<br />
GAGTGCCTCCATAAGATTCC<br />
ACCAATGTACTTAGACTGGG<br />
TCTCTTGTATTCGTTCTGCT<br />
AGAGGATGATGGAAGAAAGG<br />
59.2<br />
60.7<br />
61<br />
59.3<br />
60
FINAL REPORTS: INVESTIGATIONS 2009–2011<br />
Table 2. Primers sequence and alignment temperature of RTUbi (Ubiquitine), RTLip (lipase) and RTTri (tripsynogen) which were used in the<br />
PCR-TR reactions of snook larvae<br />
Primer Nucleotides sequence (5’→3’) Alignment<br />
Temperature<br />
(°C)<br />
PCR-TRUbi<br />
TRUbi5’<br />
TRUbi3’<br />
PCR-TRLip<br />
TRLip5’<br />
TRLip3’<br />
PCR-TRTri<br />
TRTri5’<br />
TRTri3’<br />
PCR-TRAct<br />
TRAct5’<br />
TRAct3’<br />
GCAACACACCTGACCTGAGG<br />
CGTCCTGCTGATTGTATCCC<br />
TGATGCCTGCAATCACGTCC<br />
TTAGCCACTGGGCCATCAGG<br />
GCTCCACTGCTGACAGGAAC<br />
CAGAGTCACCCTGGCAAGAG<br />
CGCGACCTCACAGACTACCT<br />
GATTCCGCAGGACTCCATAC<br />
394<br />
55<br />
59<br />
55<br />
59/55 1<br />
1 Alignment Temperature in the PCR-RT for the actine changed according with the studied gen<br />
Table 3. Results from the sequence of the send enzymes to the Instituto de Biotecnología de la UNAM<br />
Enzyme # de bp<br />
Forward Reverse<br />
RTAMI1 --- ---<br />
RTAMI2 --- ---<br />
RTAMI3 186 192<br />
TLPCA 870 870<br />
TRINA --- 519
RTAMI3<br />
Table 4. Results from the sequence alignment of RTAMI3, TLPCA and TRINA-R in the BLAST<br />
Organism<br />
Salmo salar ARNm for the clon ssal-rgf-520-156 of the hydrolase ubiquitin carboxiterminal 2, cds pseudogene<br />
395<br />
FINAL REPORTS: INVESTIGATIONS 2009–2011<br />
e<br />
Value<br />
Matching<br />
percentage<br />
5e-27 85<br />
PREDICTO: Danio rerio ARNm similar for specific ubiquitin of peptidasa 2 1e-16 79<br />
Oryzias melastigma ARNm for ubiquitin specific of peptidase 2, cds partial 6e-13 88<br />
TLPCA<br />
Pagrus major ARNm for pancreatic lipase, cds partial 0.0 86<br />
Epinephelus coioides ARNm of colipase-dependt of pancreatic lipase, cds complete 0.0 85<br />
TSA: Hippoglossus hippoglossus all_halibut.1371.C1 mRNA sequence<br />
TRINA-R<br />
Takifugu rubripes ARNm for trypsinogen, cds partial 0.0 95<br />
Siniperca chuatsi ARNm for trypsinogen 1, cds complete 0.0 94<br />
Solea senegalensis ARNm for trypsinogen 1b, cds complete 0.0 94<br />
Pleurogrammus azonus ARNm for trypsine, cds complete 0.0 94<br />
Solea senegalensis ARNm for trypsinogen 1c, cds complete 0.0 94<br />
Sparus aurata ARNm for trypsinogen, cds complete 0.0 94<br />
Paralichthys olivaceus ARNm for trypsinogen 2, cds partial 0.0 94<br />
Sparus aurata ARNm precursor for trypsinogen II, cds complete 0.0 94<br />
Dissostichus mawsoni ARNm of the clon 25 for the trypsogen precursor, cds complete 0.0 93<br />
Solea senegalensis ARNm for the trypsinogen 1a, cds complete 0.0 93<br />
Tautogolabrus adspersus ARNm for retripsynogen, cds complete 0.0 93<br />
P.magellanica ARNm for trypsine 0.0 93<br />
Paralichthys olivaceus ARNm for trypsinogen 1, cds complete 0.0 92<br />
Epinephelus coioides ARNm for trypsinogen 1a, cds partial 0.0 91<br />
3e-<br />
158<br />
88
FINAL REPORTS: INVESTIGATIONS 2009–2011<br />
1500 pb<br />
1000<br />
pb 800 pb<br />
400 pb<br />
200 pb<br />
M TLPCA RTAMI 1 RTAMI 2 RTAMI 3<br />
TRINA<br />
Figure 8. Amplified products for the Lipase (TLPCA), Amilase 1 (RTAMI1), Amilase 2<br />
(RTAMI2), Amilase 3 (RTAMI3) and Trypsine (TRINA) of C. undecimalis. Marker (M).<br />
Table 5. Relative expressions of the ubiquitine, trypsinogen and pancreatic lipase in the<br />
days of results of Ct for common snook.<br />
Gene 2 - ΔΔCt Control<br />
Ubiquitin day 0 0.32 Intestine<br />
Ubiquitin day 5 0.76 Intestine<br />
Trypsinogen day 3 0.33 Intestine<br />
Trypsinogen day 5 0.47 Intestine<br />
Pancreatic lipase<br />
day 0<br />
8.05 Pancreas<br />
Figure 9. Agarose gel electrophoresis at 2% of the PCR-TR products of the actine gen of common<br />
snook (C. undecimalis). Larvae age (post fertilization) is indicated above each well. Intestine (I) and<br />
Marker (M).<br />
396
397<br />
FINAL REPORTS: INVESTIGATIONS 2009–2011<br />
Table 6. Sequence of degenerate primers of trypsin of Dicentrarchus labrax (Péres et al. 1998) and<br />
temperature of amplification.<br />
Primers Forward Reverse Temperature of<br />
amplification ºC<br />
Trypsin CAggTgTTCTgAAC CCC (Ag) gACACAACACCT 60<br />
Figure 10. Gel of Agarose in which is the band of<br />
trypsin with 525 bp of the intestine of C. parallelus<br />
adults. PM: Marker of molecular weight of 50pb.
FINAL REPORTS: INVESTIGATIONS 2009–2011<br />
Figure 11. Partial sequence of C. parallelus trypsin gene.<br />
398
399<br />
FINAL REPORTS: INVESTIGATIONS 2009–2011<br />
Table 7. Percentage of similarity in comparison with C. parallelus trypsin gene.<br />
Species<br />
Percentage of<br />
similarity<br />
Myxocyprinus asiaticus 39,86<br />
Dicentrarchus labrax 39,40<br />
Cebidichthys violaceus 39,21<br />
Paralabrax maculofasciatus 38,34<br />
Xiphister mucosus 35,85<br />
Anoplarchus purpurencens 35,59<br />
Menidia estor 34,68<br />
Symphysodon aequifasciatus 34,00<br />
Oreochromis niloticus 26,18<br />
Danio rerio 26,04<br />
Paranotothenia magellanica 24,67<br />
Salmo salar 24,62<br />
Salmo salar 24,17<br />
Salmo salar 23,52<br />
Tribolodon hakonensis 23,50<br />
Salvelinus leucomaenis 23,38<br />
Salmo salar 23,36<br />
Oreochromis aureus 23,31<br />
Oreochromis niloticus 23,18<br />
Pleurogrammus azonus 23,08<br />
Spinibarbus sinensis 21,81<br />
Myxocyprinus asiaticus 20,08<br />
Chelon labrosus 14,10<br />
Sparus aurata 12,04
FINAL REPORTS: INVESTIGATIONS 2009–2011<br />
Figure 12. Dendrogram of the alignment of the similarity analysis, where is the relation of the<br />
trypsin gene in different fish species.<br />
400
401<br />
FINAL REPORTS: INVESTIGATIONS 2009–2011<br />
Development and Diversification of Species for Aquaculture in Ghana<br />
Indigenous Species Development/Experiment/09IND06PU<br />
Emmanuel A. Frimpong<br />
Virginia Polytechnic Institute and <strong>State</strong> <strong>University</strong><br />
Blacksburg, Virginia, USA<br />
Nelson W. Agbo and Stephen Amisah<br />
Kwame Nkrumah <strong>University</strong> of Science and Technology<br />
Kumasi, Ghana<br />
Graduate Students:<br />
Gifty Anane-Taabeah<br />
Virginia Polytechnic Institute and <strong>State</strong> <strong>University</strong><br />
Ethel Tettey and Peter Akpaglo<br />
Kwame Nkrumah <strong>University</strong> of Science and Technology<br />
EXECUTIVE SUMMARY<br />
Sub-Saharan Africa has abundant land and water resources, but these have not been tapped to increase<br />
aquaculture production significantly in global terms. Recent analyses of Sub-Saharan Africa aquaculture<br />
have noted a relative lack of public sector research and development attention to alternative culture<br />
systems (e.g., cage culture) in Africa and recommended increased attention to alternative production<br />
systems while striving to increase intensity and production from the traditional earthen ponds. Likewise,<br />
the analyses identified progress made in Nigeria and Egypt in the production of species other than the<br />
tilapias as dictated by local demands for those alternative species, leading to their recommendations for<br />
expansion of production of high-demand indigenous species for niche markets. As a business model,<br />
diversification of species and systems provides a safety net and access to new markets for investors. This<br />
project involved complementary investigations of the opportunities and challenges to the adoption of cage<br />
culture as an alternative production system in Ghana, experimental studies of nutritional requirements and<br />
a market survey of indigenous, non-traditional aquaculture species with potential for development.<br />
Experiments on optimal dietary protein of Chrysichthys nigrodigitatus (substituted for C. maurus)<br />
revealed that best growth of fingerlings was achieved when the diet contained 42.9% crude protein. In a<br />
parallel study with juvenile Heterotis niloticus the optimal dietary crude protein level was estimated to be<br />
at least 32.1%. These results are within the range of available data for similar species and the studies<br />
constitute some of the first of their kind for these specific species. This report also provides a brief review<br />
of the natural food habits, habitat requirements, and distribution of the C. nigrodigitatus and H. niloticus.<br />
Because of its refusal to accept pelleted feed in initial laboratory trials, experimental study of<br />
Parachanna obscura dietary protein requirements was not feasible. A more in-depth study of the<br />
distribution and natural food and habitat requirement and acceptability as a potential aquaculture<br />
species in Ghana was completed. The survey of market potential and distribution trends of<br />
Parachanna obscura showed that the species has widespread occurrence and popularity as food in<br />
the four regions studied but with seasonal supply and not clearly sustainable harvest methods.<br />
Aquaculture will be a useful intervention for consistent supply and to protect reproductive<br />
populations in the wild.
FINAL REPORTS: INVESTIGATIONS 2009–2011<br />
These investigations have produced valuable insight not previously available to farmers and the private<br />
sector of Ghana, the Fisheries Commission of Ghana and other relevant government institutions. We<br />
expect these results to contribute to diversification and rapid acceleration of aquaculture development in<br />
Ghana and the sub-region. A comprehensive Strength Weaknesses Opportunities and Threats (SWOT)<br />
analysis of the aquaculture industry in Ghana is underway utilizing lessons learned from past, the current,<br />
and ongoing <strong>AquaFish</strong> <strong>CRSP</strong> projects. This analysis is being undertaken with input from the Fisheries<br />
Commission of Ghana.<br />
Ecology And Effects Of Dietary Protein Levels On Growth Performance Of<br />
Claroteid Catfish, Chrysichthys Nigrodigitatus, Fingerlings<br />
ABSTRACT<br />
Chrysichthys nigrodigitatus is a relatively new aquaculture species in Ghana and knowledge about its<br />
culture, especially dietary requirements, is limited. Knowledge of optimal dietary protein level of this<br />
species is important for the development of a suitable feed for sustainable culture. A 10-week experiment<br />
was conducted to determine the optimal protein requirement of C. nigrodigitatus (initial weight 16.30 ±<br />
0.07 g, mean ± SE) in twelve 60-L indoor flow through rectangular glass tanks provided with aerated<br />
underground water. Four isoenergetic diets were formulated to contain varying crude protein (CP) levels:<br />
32.1%, 34.6%, 42.8%, and 47.1% using fish meal/soybean meal as protein sources in a ratio of 2:1. Each<br />
diet was assigned to triplicate groups of 12 fish in a completely randomized design. Twelve uniform-sized<br />
fish were stocked in each tank. A digestibility trial was conducted with all the diets. Fish was fed to<br />
apparent satiation with experimental diets twice a day. Results after ten weeks of feeding showed an<br />
increase in weight gain (WG) and specific growth rate with increasing levels of dietary protein up to<br />
42.8% (P
403<br />
FINAL REPORTS: INVESTIGATIONS 2009–2011<br />
Ghana, making it naturally adaptable to captivity in pond systems in the country. A consultation with<br />
farmers revealed that C. nigrodigitatus are not only common in farmers’ ponds but also they grow faster<br />
and bigger than C. maurus.<br />
Although some farmers in Ghana keep C. nigrodigitatus in their ponds, they have little or no knowledge<br />
of the nutrient requirements and general management of the species. Few studies have been conducted on<br />
the nutrition and the recent one was by Adewolu and Benfey (2009). In determining the minimum<br />
nutrient requirements of a cultured species, protein is usually given first consideration because of its high<br />
cost and essential role for growth, tissue maintenance and reproduction. Therefore, investigating the<br />
protein requirement entails determining the minimum amount required to produce maximum growth and<br />
not to be used for energy needs. The objectives of the present study was to evaluate the effects of dietary<br />
protein levels in diets on growth performance, feed utilization, body composition and apparent<br />
digestibility coefficient (ADC) so as to determine the optimum dietary protein requirement for juvenile C.<br />
nigrodigitatus.<br />
Literature review of habitat, food habits, life-history and distribution<br />
C. nigrodigitatus is abundant and widely distributed. It is found in all the three river basins in Ghana<br />
namely; Volta (Black and White Volta Rivers, the Oti River and the Lower Volta, including Lake Volta),<br />
South Western (Bia, Tano, Ankobra and Pra Rivers) and Coastal Basins (Ochi-Amissah, Ochi-Nakwa,<br />
Ayensu, Densu and Tordzie/Aka Rivers) but C. maurus is restricted to the South Western basin (Dankwa<br />
et al., 1999). It is a bottom-dwelling freshwater fish widely distributed in the freshwater systems of<br />
Tropical Africa including Ghana (Nwadiaro and Okorie, 1985; Dankwa et al., 1999). C. nigrodigitatus is<br />
found in all the three river basins in Ghana namely; Volta, South Western and Coastal Basins (Dankwa et<br />
al., 1999), consisting of numerous rivers and streams and the Volta Lake and covering about 70% of the<br />
country. C. nigrodigitatus is largely omnivorous (with strong tendency towards predation), with large<br />
proportions of animal component and detritus in their diet and they are adequately adapted for such habits<br />
(Offem et al, 2008). Juvenile members of the species have been found to be plankton feeders feeding<br />
mainly on zooplankton including copepods (Ogwumba, 1988). C. nigrodigitatus is known to breed<br />
seasonally and usually spawn during the rainy and flooding season. The reproductive cycle of C.<br />
nigrodigitatus has been reported to be around September and November, with vitellogenesis duration of 4<br />
months (Nuñez et al, 1995). However, Offem et al (2008) indicated that C. nigrodigitatus has a long<br />
spawning period, extending from April to August. The completely different records on spawning season<br />
suggests that C. nigrodigitatus is a serial spawner with possibly two peaks in reproduction coinciding<br />
with the major rainy seasons in the humid tropics of West Africa. The species spawns in crevices<br />
(speleophil) like many catfishes, and we have seen in our experimental ponds and on some farms that<br />
under the right conditions the female enters hollow structures such as wood or bamboo to deposit its eggs.<br />
MATERIALS AND METHODS<br />
Experimental system and fish handling<br />
This study was conducted at the Faculty of Renewable Natural Resources, Kwame Nkrumah <strong>University</strong><br />
of Science and Technology, Kumasi, Ghana. Fish were reared in glass tanks (60 L) in a flow-through<br />
system, which was supplied with water at a flow rate of 0.5 L min -1 . Water quality parameters measured<br />
weekly during the experiment were as follows (mean ± SD): temperature, 26.76 ± 0.02 o C; pH, 7.22 -<br />
6.71; dissolved oxygen, 4.04 ± 0.08 mg L -1 ; salinity, 0.09 ± 0.00 and ammonia, 0.01 ± 0.01 mg L -1 . C.<br />
nigrodigitatus obtained from the Volta River near Akuse, Ghana were kept in hapas and fed commercial<br />
feed for three weeks before the experiment. One week before the start of the experiment, fish were<br />
transferred to the experimental tanks for acclimation. Fish of mean initial weight 16.30 ± 0.07 g were<br />
stocked randomly 12 fingerlings per tank in triplicates per treatment.
FINAL REPORTS: INVESTIGATIONS 2009–2011<br />
Diet formulation and preparation<br />
All ingredients used in this study were obtained from commercial sources in Ghana. Four isoenergetic<br />
diets were formulated to contain varying crude protein (CP) levels ranging from 30%, 35%, 40%, and<br />
45% using fish meal and soybean meal as protein sources in a ratio of 2:1 (Table 1). Fish were hand-fed<br />
twice a day (09:00, 16:00) to satiation. Feeding rates were adjusted every week and the growth<br />
experiment lasted ten weeks. At the end of the growth trial feces were collected for digestibility study by<br />
siphoning into centrifuge bottles and immediately centrifuged using Universal 16A, Centrifuge at 3,000<br />
rpm for 10 min and the supernatant discarded. Feces were then oven dried at 60 o C for 24h, ground into a<br />
fine powder and stored in a desiccator for chemical analysis.<br />
Table 1. Composition of diets fed to Chrysichthys nigrodigitatus with varying protein levels.<br />
Protein levels (g/100 g as-fed)<br />
Ingredients<br />
30 35 40 45<br />
Fish meal 23.7 29.8 35.0 40.7<br />
Soy bean Meal 18.8 22.2 27.5 32.2<br />
Rice Bran 30.5 23.0 15.0 8.0<br />
Wheat Bran 15.5 13.5 11.0 7.6<br />
Salt 1.0 1.0 1.0 1.0<br />
Palm oil 2.0 2.0 2.0 2.0<br />
Di Calcium Phosphate 2.0 2.0 2.0 2.0<br />
Cassava Flour (Binder) 2.0 2.0 2.0 2.0<br />
Vitamin & mineral Premix 4.0 4.0 4.0 4.0<br />
Chromic Oxide<br />
Proximate Composition (%)<br />
0.5 0.5 0.5 0.5<br />
Dry matter 95.2 95.5 96.7 96.7<br />
Crude protein 32.1 34.6 42.8 47.1<br />
Crude lipid 9.1 8.8 10.7 14.5<br />
Crude fibre 7.3 4.9 4.3<br />
Ash 15.9 15.9 15.9 18.2<br />
Gross energy, (kJ g -1 ) 17.3 17.8 18.9 19.6<br />
Biochemical, biological and statistical analyses<br />
Ingredients, diets, carcass and feces were analyzed in triplicates for proximate composition according to<br />
standard methods (AOAC, 1990) and chromic oxide of diets and feces analyzed using the method by<br />
Furukawa and Tsukahara (1966). Performance in growth and feed utilization were determined in terms of<br />
weight gain (WG), specific growth rate (SGR), feed intake (FI), feed conversion ratio (FCR), and protein<br />
efficiency ratio (PER) as follows: WG (%) = final body weight – initial body weight/ initial body weight<br />
x 100; SGR (% day -1 ) = 100 × [ln(final body weight) - ln(initial body weight)]/no. of days; FI (g) = Total<br />
feed intake per fish/no. of days; FCR = feed intake/live weight gain; PER = live weight gain/crude protein<br />
intake. The apparent digestibility coefficients (ADC) for the nutrients of the diets were calculated as<br />
follows: ADC (%)=100×[1-(%nutrient in feces/%nutrient in feed)×(%marker in feed/marker in feces)].<br />
Whole body composition was determined where whole body samples were analyzed for moisture, crude<br />
protein, crude lipid and ash and results expressed as percentage of live weight. All data were subjected to<br />
ANOVA using SPSS 16.0. Differences between the means were tested by Tukey’s test (α = 0.05). The<br />
optimum dietary protein requirement for juvenile C. nigrodigitatus based on percentage weight gain<br />
(WG) was estimated by third-order polynomial regression analysis (Y = a + bX + cX 2 + dX 3 ) (Neter et al.,<br />
1996).<br />
404
405<br />
FINAL REPORTS: INVESTIGATIONS 2009–2011<br />
The present study indicated that dietary protein level had an effect on growth performance, and the<br />
optimum protein level in diets for C nigrodigitatus juvenile, defined by the percentage WG, was 42.9%<br />
when fish meal and soybean meal were used as the main protein source and the dietary energy value was<br />
18.9 kJ/g. This value was similar to those used in omnivorous fish diet, for example, bagrid catfish,<br />
Mystus nemurus (44%; Ng et al. 2001); silver perch, Bidyanus bidyanus (42.2%; Yang et al. 2002); black<br />
sea bream, Sparus macrocephalus (41.4%; Zhang et al. 2010) but higher than those reported for other<br />
omnivorous species, such as, channel catfish Ictalurus punctatus (28-32%; Robinson et al. 2000) and<br />
Heterotis niloticus (30.6-31.1%; Monentcham, 2009). Adewolu and Benfey (2009) also studied protein<br />
requirements for juvenile C. nigrodigitatus and reported at least 35% dietary protein and stated that<br />
optimum protein requirement was not established for the species because no growth plateau was reached.<br />
RESULTS AND DISCUSSION<br />
Growth performance of C. nigrodigitatus fed the diets containing varying dietary protein levels for 10<br />
weeks is presented in Table 2. There was no significant difference in the initial body weight of C.<br />
nigrodigitatus; however, after the 10-wk feeding trial, the fish grew and weight gain (WG) ranged<br />
between 21.3 and 44.9%, and the fish fed 42.8% dietary protein showed the highest WG value (44.9%) (P<br />
FINAL REPORTS: INVESTIGATIONS 2009–2011<br />
Fig 1 The relationship between weight gain (%, y) and dietary protein levels (%, x) in juvenile C.<br />
nigrodigitatus.<br />
The present study indicated that dietary protein level had an effect on growth performance, and the<br />
optimum protein level in diets for C nigrodigitatus juvenile, defined by the percentage WG, was 42.9%<br />
when fish meal and soybean meal were used as the main protein source and the dietary energy value was<br />
18.9 kJ/g. This value was similar to those used in omnivorous fish diet, for example, bagrid catfish,<br />
Mystus nemurus (44%; Ng et al. 2001); silver perch, Bidyanus bidyanus (42.2%; Yang et al. 2002); black<br />
sea bream, Sparus macrocephalus (41.4%; Zhang et al. 2010) but higher than those reported for other<br />
omnivorous species, such as, channel catfish Ictalurus punctatus (28-32%; Robinson et al. 2000) and<br />
Heterotis niloticus (30.6-31.1%; Monentcham, 2009). Adewolu and Benfey (2009) also studied protein<br />
requirements for juvenile C. nigrodigitatus and reported at least 35% dietary protein and stated that<br />
optimum protein requirement was not established for the species because no growth plateau was reached.<br />
Protein requirements between fish species is complicated by differences in species, size and age of fish,<br />
diet formulation, stocking density, protein quality, hygiene and experimental conditions between studies<br />
(NRC 1993).<br />
Feed utilization by C. nigrodigitatus improved as dietary protein level increased. Feed intake (FI)<br />
increased slightly with the increase in dietary protein up to 42.8% (23.8 g) but reduced a bit at 47.1%<br />
(21.3 g) however, there was no significant differences between treatments. FCR data showed<br />
approximately the opposite pattern as FI with diet containing 42.8% protein being better utilized (3.3)<br />
than the others, although it was not significantly different from fish fed 47.1% protein diet. The<br />
observation that (FCR) decreased with increasing dietary protein levels has also been reported for many<br />
other species, irrespective of culture conditions, including Mozambique tilapia (Jauncey 1982), African<br />
catfish (Degani et al. 1989) and Bagrid catfish (Adewolu and Benfey, 2009). The high FCR values (3.3–<br />
6.5) observed in this study may be a result of the use of locally available cheap ingredients for practical<br />
diet formulation; high FCR values have been reported for a number of fish species fed on practical diets<br />
using locally available feed ingredients (Khan et al. 1993). This also probably led to low growth<br />
performance, although water supply problems were encountered during the experiment, which could have<br />
been one of the reasons. In a majority of similar studies, researchers employed various purified and semi<br />
purified diets with high quality protein sources such as casein, gelatin or synthetic amino acids that gave<br />
good growth and feed utilization leading to more precise values.<br />
406
407<br />
FINAL REPORTS: INVESTIGATIONS 2009–2011<br />
Feed utilization by C. nigrodigitatus improved as dietary protein level increased. Feed intake (FI)<br />
increased slightly with the increase in dietary protein up to 42.8% (23.8 g) but reduced a bit at 47.1%<br />
(21.3 g) however, there was no significant differences between treatments. FCR data showed<br />
approximately the opposite pattern as FI with diet containing 42.8% protein being better utilized (3.3)<br />
than the others, although it was not significantly different from fish fed 47.1% protein diet. The<br />
observation that (FCR) decreased with increasing dietary protein levels has also been reported for many<br />
other species, irrespective of culture conditions, including Mozambique tilapia (Jauncey 1982), African<br />
catfish (Degani et al. 1989) and Bagrid catfish (Adewolu and Benfey, 2009). The high FCR values (3.3–<br />
6.5) observed in this study may be a result of the use of locally available cheap ingredients for practical<br />
diet formulation; high FCR values have been reported for a number of fish species fed on practical diets<br />
using locally available feed ingredients (Khan et al. 1993). This also probably led to low growth<br />
performance, although water supply problems were encountered during the experiment, which could have<br />
been one of the reasons. In a majority of similar studies, researchers employed various purified and semi<br />
purified diets with high quality protein sources such as casein, gelatin or synthetic amino acids that gave<br />
good growth and feed utilization leading to more precise values.<br />
ADCs of protein, organic matter and lipid increased as protein content of the diets increased (Table 3) but<br />
the increase was not significant for ADCs of protein and organic matter. However, ADC of lipid showed<br />
a significant increase as dietary protein content increased with 47.1% protein diet recording the highest<br />
(91.33%).<br />
Table 3. Apparent digestibility coefficients (%) of main nutrients in diets for juvenile Chrysichthys<br />
nigrodigitatus fed varying levels of protein for 70 days.<br />
Crude protein levels in the diet (%)<br />
32.1 34.6 42.8 47.1<br />
Crude protein 70.59 ± 4.78 71.60 ± 4.67 72.57 ± 1.08 71.75 ± 1.46<br />
Crude lipid 83.41 ± 2.67 b 88.83 ± 0.30 ab 88.91 ± 1.96 ab 91.33 ± 0.96 a<br />
Dry matter 49.29 ± 2.83 53.05 ± 2.59 55.78 ± 2.43 56.36 ± 0.56<br />
Values are presented as means ± SE (n = 3) and values within the same row with different letters are significantly<br />
different (P< 0.05).<br />
Whole body composition of Chrysichthys nigrodigitatus is presented in Table 4. Percentage moisture, ash<br />
content, whole-body protein were not significantly affected by dietary protein level (P>0.05). The wholebody<br />
protein was positively correlated with dietary protein level. Whole-body lipid and ash also followed<br />
a similar trend up to 42.8% dietary protein and decline slightly at 47.1%. Percentage moisture was<br />
negatively correlated with dietary protein level. Increasing dietary protein level increased lipid content in<br />
body composition significantly (P
FINAL REPORTS: INVESTIGATIONS 2009–2011<br />
CONCLUSION<br />
The results of the present study indicate that the maximum growth of juvenile C. nigrodigitatus was<br />
achieved at about 42.8% dietary protein when fish and soybean meals were used as the major sources of<br />
protein. Using a polynomial regression analysis of WG, the dietary protein requirement for the juvenile of<br />
C. nigrodigitatus was estimated to be 42.9%.<br />
Ecology And Dietary Protein Requirement Of Juvenile African Bony-Tongue,<br />
Heterotis Niloticus<br />
ABSTRACT<br />
The study evaluated the effect of four isoenergetic diets with varying crude protein (CP) levels of 26.2%,<br />
32.1%, 34.6% and 42.8% on growth, feed utilization and whole body proximate composition of Heterotis<br />
niloticus juveniles. H. niloticus juveniles (initial weight 32.65±0.03g) were stocked in rearing hapas<br />
(2x1m 2 ) at 5 fish per hapa. Each diet was assigned to triplicate groups of fish in a completely randomized<br />
design and the experiment lasted for ten weeks. An increasing growth trend and better feed utilization<br />
was observed as dietary protein levels increased from 26.2% to 42.8%. Fish fed 42.8% protein diet had<br />
the best growth performance and nutrient utilization, with a mean weight gain of 202.30±19.6%, feed<br />
conversion ratio of 1.20±0.15 and protein efficiency ratio of 1.66±0.2, however this was not significantly<br />
different from values of fish fed 32.1% and 34.6% dietary protein. Significantly lower values were<br />
recorded for fish fed 26.2% dietary protein. Whole body nutrient composition was not affected by the<br />
diets. The results of this study suggest that H. niloticus juveniles would grow best when fed diets<br />
containing at least 32.1% protein.<br />
INTRODUCTION<br />
Among the most highly valued species in West African inland fisheries is the African bony tongue,<br />
Heterotis niloticus (Cuvier, 1829), a species widely distributed in tropical rivers, freshwater lakes of<br />
Western and Central Africa (Moreau 1982). The African bony tongue is exploited by fisheries in Southern<br />
Benin, the middle Niger River Delta and other regions of West Africa (Adite et al., 2005). The species is<br />
classified within the opportunistic omnivorous fish category and consume a variety of food resources,<br />
ranging from aquatic invertebrates to small seeds, including small benthic organisms, fishes, shrimps,<br />
plant remains and terrestrial insects. In captivity, remarkable growth performances have been reported,<br />
individual mean body mass reaching up to 3 to 4 kg in 12 months. However, its use for profitable fishfarming<br />
in Africa relies on the knowledge of ecological, behavioral and nutritional factors which<br />
condition its reproduction, the resolution of massive mortality during early rearing, the estimate of its<br />
nutritional needs at various ontogenetic stages and the identification of an efficient breeding. The prospect<br />
for Heterotis contribution to the rise of African aquaculture depends on the solutions which will be found<br />
to the mentioned crucial problems (Monentcham, 2009). In spite of the great evolutionary and fishery<br />
significance, the bony tongue fishes of the family Osteoglossidae generally have not received extensive<br />
study (Adite et al., 2005). Considering the bony tongue’s great ecological and economic importance in<br />
Ghana, more information is needed on natural feeding habits and nutritional requirements of the species<br />
in order to inform both fisheries management and development of aquaculture technology. This study,<br />
therefore was undertaking to evaluate the growth performance, feed utilization and whole body<br />
composition of H. niloticus fed on varying dietary protein levels.<br />
408
409<br />
FINAL REPORTS: INVESTIGATIONS 2009–2011<br />
Literature review of habitat, food habits, life-history and distribution<br />
H. niloticus is a pelagic freshwater fish usually found in waterbodies with aquatic vegetation (e.g.,<br />
Swamps) particularly during spawning seasons (Adite et al., 2005). The African bony tongue has been<br />
characterized as microphagous on phytoplankton (Lowe-McConnell, 1975; Holden and Reed, 1991) and<br />
feeding on variable amounts of plant material, including seeds, and benthic water column invertebrates.<br />
H. niloticus spawn in nests, which are circular clearings within dense stands of rooted and submerged or<br />
emergent aquatic macrophytes in shallow water (Padi, 2006; Adite et al., 2005). Spawning occurs during<br />
the rainy seasons in Ghana. H. niloticus occurs in large rivers of West Africa. In Ghana it occurs mainly<br />
in the Volta basin (Dankwa et al., 1999).<br />
MATERIALS AND METHODS<br />
Experimental system and diet preparation<br />
This study was carried out at the premises of the Data Stream Hatchery at Old Akrade in the Eastern<br />
Region of Ghana. Twelve hapas (2x1m 2 ) mounted in concrete tanks (5x20 m 2 ) were used for the feed<br />
trial. Before mounting the hapas, the concrete tank was cleaned with calcium carbonate to kill bacteria<br />
and other micro-organisms and left to dry for about a week and then filled with water from the Volta<br />
River. The concrete tank was fitted with an air blower for water aeration and ultra violet clarifier for<br />
water disinfection. All ingredients used for diet preparation in this study were obtained from commercial<br />
sources in Ghana. Four isoenergetic diets were formulated to contain varying crude protein (CP) levels of<br />
25%, 30%, 35%, and 40%, using fish meal and soybean meal as protein sources in a ratio of 2:1 (Table<br />
1).<br />
Table 2. Composition of diets fed to Heterotis niloticus with varying protein levels.<br />
Protein levels (g/100 g as-fed)<br />
Ingredients<br />
25 30 35 40<br />
Fish meal 18.0 23.7 29.8 35.0<br />
Soy bean Meal 13.9 18.8 22.2 27.5<br />
Rice Bran 38.0 30.5 23.0 15.0<br />
Wheat Bran 18.6 15.5 13.5 11.0<br />
Salt 1.0 1.0 1.0 1.0<br />
Palm oil 2.0 2.0 2.0 2.0<br />
Di Calcium Phosphate 2.0 2.0 2.0 2.0<br />
Cassava Flour (Binder) 2.0 2.0 2.0 2.0<br />
Vitamin & mineral Premix 4.0 4.0 4.0 4.0<br />
Chromic Oxide<br />
Proximate composition<br />
0.5 0.5 0.5 0.5<br />
Dry matter 97.0 95.2 95.5 96.7<br />
Crude protein 26.2 32.1 34.6 42.8<br />
Crude lipid 9.1 9.1 8.8 10.7<br />
Crude fibre 8.56 7.3 4.9 4.3<br />
Ash 13.6 15.9 15.9 15.9<br />
Gross energy, (kJ g -1 ) 16.9 17.4 17.9 18.4<br />
Experimental fish, acclimation, stocking and feeding<br />
A total of sixty Fingerlings of H. niloticus (initial weight of 32.7g) obtained from Zewu Farms, Akuse<br />
were used for the study. The fish were randomly stocked 5 fish per hapa in triplicates per treatment. The<br />
fish were allowed to acclimatize for two weeks prior to the start of the feeding trial. During this period,<br />
the fish were fed on (crumbles) imported feed with 45% crude protein (Raanan feed from Israel). The fish
FINAL REPORTS: INVESTIGATIONS 2009–2011<br />
were hand-fed to satiation twice daily at 0700h and 1600h. Feeding rates were adjusted every week and<br />
the growth experiment lasted ten weeks.<br />
Biochemical, biological and statistical analyses<br />
Ingredients, diets, carcass and feces were analyzed in triplicates for proximate composition according to<br />
standard methods (AOAC, 1990). Performance in growth and feed utilization were determined in terms<br />
of weight gain (WG), specific growth rate (SGR), feed intake (FI), feed conversion ratio (FCR) and<br />
protein efficiency ratio (PER) as follows: WG (%) = final body weight – initial body weight/ initial body<br />
weight x 100; SGR (% day -1 ) = 100 × [ln(final body weight) - ln(initial body weight)]/no. of days; FI (g)<br />
= Total feed intake per fish/no. of days; FCR = feed intake/live weight gain; PER = live weight gain/crude<br />
protein intake. Whole body composition was determined where whole body samples were analysed for<br />
moisture, crude protein, crude lipid and ash and results expressed as percentage of live weight. All data<br />
were subjected to ANOVA using SPSS 16.0. Differences between the means were tested by Tukey’s test<br />
(α = 0.05).<br />
RESULTS AND DISCUSSION<br />
In this study, varying inclusion levels of dietary protein had effect on the growth performance (FBW, WG<br />
and SGR) and feed utilization (FI, FCR and PER) of Heterotis niloticus (P< 0.05; Table 2). FBW, WG<br />
and SGR increased with increasing dietary protein levels with the maximum values in the 42.8% protein<br />
diet, although this was not significantly different from the 32.1% and 34.6% protein diets. FI and PER<br />
followed a similar trend but there was no significant differences between the diets. The reverse trend was<br />
true for FCR with the least value (1.2) recorded for fish fed 42.8% protein diet, but did not differ<br />
significantly from the 32.1% and 34.6% protein diets. The survival rate generally showed a decreasing<br />
trend with increasing dietary protein level but was not significantly different between the diets.<br />
Table 2. Growth and feed utilization of H. niloticus fed at varying inclusion levels of dietary protein for<br />
70 days.<br />
Crude protein levels in the diet (%)<br />
Parameter 26.2 32.1 34.6 42.8<br />
IBW 32.30±0.40 32.73±0.03 32.80±0.06 32.77±0.03<br />
FBW 65.56±4.57 a 76.12±9.07 ab 90.40±7.19 ab 99.07±6.50 b<br />
WG 102.80±12.42 a 132.60±27.77 ab 175.6±21.85 ab 202.30±19.56 b<br />
FCR 1.85±0.17 a 1.77±0.13 ab 1.69±0.07 ab 1.20±0.15 b<br />
SGR 0.90±0.08 a 1.06±0.15 ab 1.29±0.11 ab 1.41±0.08 b<br />
SUR 93.33±6.67 91.67±8.33 73.33±13.33 71.67±17.40<br />
PER 1.27±0.16 1.44±0.30 1.65±0.21 1.66±0.16<br />
FI 60.49±3.45 74.33±10.14 76.53±8.69 77.45±3.0630<br />
K 2.46±0.16 2.48±0.29 2.19±0.14 2.06±0.24<br />
IBW (g)=Initial body weight, FBW (g)=Final body weight, WG (%)=Weight gain, FCR=Feed conversion ratio,<br />
SGR (%day -1 )= Specific growth rate, SUR (%)= Survival, PER=Protein efficiency ratio, FI (g)=Feed intake, K=<br />
Condition factor. Values are presented as means ± SE (n = 3) and values within the same row with different letters<br />
are significantly different (P< 0.05)<br />
These results are in agreement with (Al-Hafedh et al., 1999) who found that better growth of Nile tilapia<br />
was obtained at high dietary protein levels 40-45 % rather than 25-35 % protein in the absence of live<br />
algae and (Tacon, 1987) who found that dietary protein level varied from 42% for fry and 35% for<br />
growing adult. It also compares with Monentcham, (2009) who concluded that maximum growth of<br />
410
411<br />
FINAL REPORTS: INVESTIGATIONS 2009–2011<br />
Heterotis fingerlings was achieved at about 34.5% protein, however using the broken line model the<br />
dietary protein requirement was estimated to be 31.0%.<br />
The decrease in FCR with increase in dietary protein in this study, suggests a corresponding increase in<br />
feed conversion efficiency of the fish in accordance with the fact that protein is the major dietary nutrient<br />
affecting performance of fish (Lovell, 1989) since it provides the essential and nonessential amino acids<br />
which are necessary for muscle formation and enzymatic function and in part provides energy for<br />
maintenance.<br />
The condition factor (K) was not affected by the varying levels of protein inclusion in the diets. The K<br />
values range from 2.06 to 2.46 (Table 2). These results are in close agreement with those of (Osman,<br />
1991) who reported that K values in general, for fish ranged between 2.20 and 2.33 and also agreed with<br />
those of (Ahmad et al., 2004).<br />
There were no significant differences (P
FINAL REPORTS: INVESTIGATIONS 2009–2011<br />
live feed like tilapia. Experimental study of Parachanna obscura dietary protein requirements was<br />
therefore not feasible. A more in-depth study of the distribution and natural food and habitat<br />
requirement and acceptability as a potential aquaculture species in Ghana completed in lieu of the<br />
experimental diet studies.<br />
Literature review of habitat, food habits, life-history and distribution<br />
Snakeheads are voracious predators (Fagbenro, 2002) and have been observed to exhibit ontogenetic<br />
changes in their diets. Juveniles of P. obscura prey on insects’ larvae, nematodes and fish fry whilst<br />
adults prey on larger fish (USEPA, 2002, Ajah et al., 2006). Juveniles have been reported as benthic<br />
feeders (Ajah et al., 2006). When starved, some snakeheads have a tendency to be cannibalistic on their<br />
young (USEPA 2002). Snakeheads are likely to be encountered in flood plains, both in the open water<br />
and the swamps (Oti, 2003; Brummet and Teugels, 2002). In rivers and streams, they have been reported<br />
to occur in vegetated areas (USEPA, 2002). All the species in the family Channidae are air-breathing,<br />
therefore, they can survive hypoxic conditions as early as late juvenile stages (USEPA, 2002; UGSS,<br />
2010a). Optimum pH ranges are reported to differ among species in the family (UGSS 2010a).<br />
Information on spawning activities in African snakehead is lacking. However, spawning has been<br />
observed in summer (June to August) in many of the species in the family Channidae (USEPA, 2002).<br />
Fecundity in P. obscura in a monoculture farm in Nigeria (Victor and Akpocha, 1992) was reported to be<br />
variable and highest in October and November with 35- 4,010 eggs. Some species are also capable of<br />
spawning up to five times in a year (USGS, 2010a). For mouth brooding species, fecundity is very low<br />
ranging from about 20 eggs at first maturity and increasing to about 200 as the fish grows (USGS, 2010a).<br />
Prior to spawning, adults build circular nests in water columns in vegetated areas where spawning occurs<br />
(Gascho Landis and Lapointe, 2010). However, presence of vegetation may not always be a prerequisite<br />
for spawning because some species in the genus Channa have been reported to spawn in the absence of<br />
vegetation (USGS, 2010a). Higher temperatures appear to speed up hatching rates of eggs among species;<br />
eggs were observed to hatch in 45-120 hours at 16°C-26°C and 28-31 hours at 28°C-33°C (USGS,<br />
2010a). Fry begin to feed on zooplankton when yolk sacs are depleted (USGS, 2010a). Snakeheads are<br />
very aggressive in protection of their young. Parental care in the family has been observed to differ from<br />
species to species but all species exhibit some parental care (USEPA, 2002).<br />
Description of the study areas<br />
The study was conducted in the Ashanti, Brong Ahafo, Eastern and Western Regions of Ghana. The<br />
selection of these regions was as a result of the apparent availability of snakehead (Parachanna obscura)<br />
from rivers in the regions. The specific towns surveyed include Barekese (Ashanti), Offinso (Offinso),<br />
Ekye-Amanfrom (Eastern), Sefwi- Wiawso (Western), Techiman (Brong Ahafo) and Yeji (Brong Ahafo).<br />
These towns both had rivers or reservoirs within which thrived active fishing. In addition, the towns had<br />
markets where a market survey could be conducted.<br />
METHODS<br />
Sample selection and survey data Collection<br />
The study was conducted with fishermen/women and fish traders in the four regions selected. Due to lack<br />
of a sampling frame for both fisher folk and fish traders, we resulted to total population sampling when<br />
the numbers were small (40 or below) and random sampling when the numbers were large (above 200).<br />
Fortunately, all fisher folk encountered were willing to be interviewed but some fish traders (about 10)<br />
were not available by their goods or unwilling to be interviewed. Apart from Yeji and Sefwi-wiaso where<br />
the fish traders were randomly surveyed, we employed total sampling in all the markets. A total of 177<br />
respondents were surveyed comprising 51 fisher folk (including one woman) and 126 fish traders<br />
(including one man).<br />
412
413<br />
FINAL REPORTS: INVESTIGATIONS 2009–2011<br />
The survey was conducted between July and August 2011. The fisher folk were interviewed at the river<br />
side, their homes or market centers. Most of the fish traders were interviewed at the market centers with a<br />
few in the Eastern Region interviewed at their homes. We administered all 177 questionnaires through<br />
personal interviews. To avoid confusion about the species being studied, we presented a photograph and a<br />
sample of the species to all respondents.<br />
Questionnaire design<br />
We employed both close-ended and open-questions in the survey and used multiple measures to assess<br />
changes in snakehead distribution in the four regions. These include frequency of encounter with<br />
snakehead, towns where snakehead are caught or purchased and the rivers from which they are caught. To<br />
assess relative abundance of snakehead, fisher folk were asked to indicate their current estimated catches.<br />
In addition, they had to indicate if they had observed any changes in catches and to provide information<br />
about the changes. The snakehead market potential was assessed through asking respondents to compare<br />
the price of snakehead to other commonly sold species. We also assessed market potential by asking<br />
respondents to indicate whether or not they are meeting the demand for snakehead.<br />
RESULTS AND DISCUSSION<br />
Distribution, abundance, and market potential of snakehead in Ghana<br />
Data analysis for the survey is ongoing but preliminary findings suggest that snakeheads thrive in the<br />
major watersheds in Ashanti, Brong Ahafo, Eastern, and Western Regions. The rivers mentioned by<br />
fishermen as their sources of snakehead include Afram, White Volta, Subin, Offin, and Tano. This was<br />
corroborated by the market women who also provided town names such as Yeji, Bupe, Afram plains,<br />
Kwahu and Kumasi as their sources of fish for trade. When asked how frequently they encountered<br />
snakehead, majority of the fisher folk and fish traders said “once in a while”. A few fishermen said they<br />
encountered them daily if they set traps for them.<br />
Species abundance appears to be driven by type of gear used and the seasonal patterns. However, seasonal<br />
patterns seem the common determinant of abundance for all four regions. The fisher folk best described<br />
the species as one that fluctuates in abundance yearly. This fluctuation occurs because of the two major<br />
seasons in Ghana. When the rivers overflow their banks between April to July, flood water which collects<br />
in pools in vegetated areas provide spawning habitats for snakehead. Subsequently, the fishermen target<br />
these areas and encircle them. Even with their traditional gill nets, large numbers of snakehead are caught.<br />
While they could only capture two to three snakehead in a typical week, they obtain as many as 1000<br />
between August and December when the water recedes. For the fishermen who target snakehead every<br />
day of the year, relying on the same gears used for the open water species is not an option. They used<br />
baited hooks, since the species is carnivorous, to ensure catches about three snakeheads daily.<br />
Comparing snakehead to commonly caught species such as tilapias and catfishes, the snakehead market is<br />
not well established. Snakeheads are typically processed before they are sold on the market. The most<br />
common processing method is smoking. However, on some occasions, they are salted. Only one trader<br />
indicated she sometimes sold them fresh. With the exception of Barekese (Ashanti Region) and Afram<br />
plains (Eastern Region) where we encountered samples from fishermen and on the open market, all other<br />
market had no snakehead. Most of the respondents who were familiar with the species suggested it was a<br />
high quality fish which they relished. To support that, they explained that since snakehead catches were<br />
low compared to Tilapia and Chrysichthys, they seldom sold snakehead. Evidently, snakeheads were<br />
rarely seen on the market. Snakeheads were largely not sold separately as other species. Due to the low<br />
catches, fisher folk and fish traders alike sold them mixed with other species such as Chrysichthys. Some<br />
traders indicated they discarded them hence it was difficult to determine its price. The fisher folk also<br />
added that their neighbors often bought snakeheads before they could be sent to the market. When
FINAL REPORTS: INVESTIGATIONS 2009–2011<br />
snakeheads were sold separately, it appears they sold just like Clarias with the same size or weight.<br />
However, this was not a general consensus. Depending on who bought the fish, the price was higher or<br />
lower compared to Tilapia or Clarias. With respect to demand for snakeheads, most of the respondents<br />
indicated they rarely had customers requesting for snakeheads. Nevertheless, many respondents suggested<br />
they would be able to sell more snakeheads if they obtained numbers above current levels.<br />
Training<br />
Besides several MS student theses supported at KNUST, this study provided two short-term trainings that<br />
were part of its original objectives. The first training, in Experimental Design and Analysis for<br />
Aquaculture Professionals, was conducted in July 2010 at the Providence Hostel in Kumasi, hosted by<br />
KNUST. The workshop, taught by Dr. Emmanuel Frimpong, was attended by 20 participants, including<br />
technicians and aquaculture scientists from KNUST, the Water Research Institute, and the Fisheries<br />
Commission and <strong>AquaFish</strong>-supported graduate students. The second training was a symposium on the<br />
culture of indigenous species, held at the Independence Hall of KNUST in July 2010. This symposium<br />
was attended by 151 participants and led by Drs, Nelson Agbo, Steve Amisah, Emmanuel Frimpong, and<br />
Ms. Gifty-Anane Taabeah.<br />
PRELIMINARY CONCLUSION AND RECOMMENDATION<br />
Snakeheads occur in major river basins in the Ashanti, Brong Ahafo, Eastern and Western regions of<br />
Ghana. Currently, their catches are low, resulting in fewer numbers reaching local markets. Even though<br />
the snakehead market is not developed like that of Tilapia or Clarias, the species has potential to penetrate<br />
local markets if the public is well educated about the species as an alternative food fish. In view of the<br />
current findings, a countrywide survey of the market potential of snakeheads will be a good study to<br />
pursue. This should provide a clearer picture of potential markets for the species. Commercial aquaculture<br />
appears a vital avenue for ensuring snakehead availability on the market and should be explored.<br />
ACKNOWLEDGEMENT<br />
Collaboration with the Fisheries Commission and Water Research Institute of Ghana ensured the integrity<br />
of data collected and the cooperation of participants. We thank all participants of the surveys for their<br />
cooperation. We are grateful to Yaw Ansah for his assistance with questionnaire administration. We are<br />
also grateful to Mark Yeboah-Agyepong, Faustina Asante and the technicians of the Department of<br />
Fisheries and Watershed Management, KNUST for their help with field and laboratory work.<br />
LITERATURE CITED<br />
Adewolu M. A., and T. J. Benfey. 2009. Growth, nutrient utilization and body composition of juvenile<br />
bagrid catfish, Chrysichthys nigrodigitatus (Actinopterygii: Siluriformes: Claroteidae), fed different<br />
dietary crude protein levels. Acta Icthyologica et Piscatoria. 39(2):95-101.<br />
Adite, A., K. O. Winemiller, and E. D. Fiogbe´. 2005. Ontogenetic, seasonal and spatial variation in the<br />
diet of Heterotis niloticus (Osteoglossiformes: Osteoglossidae) in the Soˆ River and Lake Hlan,<br />
Benin. West Africa Environmental Biology of Fishes. 73:367–378.<br />
Ajah, P. O., M. N. Georgewill, M. O. Ajah. 2006. The food and feeding habits of five freshwater and<br />
brackish-water fish species in Nigeria. African Journal of Aquatic Science. 31(2):313 – 318.<br />
Ahmad, M. H., M. Abdel-Tawwab, and Y. A. E. Khattab. 2004. Effect of dietary protein levels on growth<br />
performance and protein utilization in Nile tilapia (Oreochromis niloticus L.) with different initial<br />
body weights. Proceedings 6 th International Symposium on Tilapia in Aquaculture. 12-16 September<br />
2004, Manila, Philippines. Pages 249-263.<br />
Al Hafedh, Y. S. 1999. Effects of dietary protein on growth and body composition of Nile tilapia,<br />
Oreochromis niloticus (L). Aquaculture Research. 30:385–393.<br />
414
415<br />
FINAL REPORTS: INVESTIGATIONS 2009–2011<br />
Association of Official Analytical Chemists. 1990. Official methods of analytical of the<br />
Association of Official Analytical Chemists, 15 th edition. AOAC, Arlington, Virginia,USA.<br />
Brummet, R. E., and G. G. Teugels. 2002. Rainforest Rivers of Central Africa: biogeography and<br />
sustainable exploitation. Draft Paper. October, 22. 12pp.<br />
Dankwa, H. R., Abban, E. K. and Teugels, G. G. (1999). Freshwater fishes of Ghana: Identification,<br />
distribution, ecological and economic importance. Annales Science Zoologiques, Vol. 283.<br />
Degani, G., Y. Ben-Zvi, and D. Levanon. 1989. The effect of different protein levels and temperatures on<br />
the feed utilization, growth and body composition of Clarias gariepinus (Burchell 1822).<br />
Aquaculture. 76:293–301.<br />
El-Saidy, D. M. S. D., and M. M. A. Gaber. 2005. Effect of dietary protein levels and feeding rates on<br />
growth performance, production traits and body composition of Nile tilapia, Oreochromis niloticus<br />
(L.) cultured in concrete tanks. Aquaculture Research. 36:163-171.<br />
Fagbenro O. A. 2002. Predator control of overpopulation in cultured tilapias and the alternative uses for<br />
stunted tilapias in Nigeria. Available at: http://ag.arizona.edu/azaqua/ista/ista6/ista6web/pdf/634.pdf<br />
Furukawa, A., and H. Tsukahara. 1966. On the acid digestion method for the determination of chromic<br />
oxide as an index substance in the study of digestibility in fish feed. Bulletin of the Japanese Society<br />
of Scientific Fisheries. 32:502–508.<br />
Gascho Landis, A., and N. W. R. Lapointe. 2010. First record of a northern snakehead (Channa argus<br />
Cantor) nest in North America. Northeastern Naturalist 17(2):325-332.<br />
Holden, M. and Reed, W. (1991). West African freshwater fish. Longman Group Ltd., London<br />
Jauncey, K. 1982. The effects of varying dietary protein level on the growth, food conversion, protein<br />
utilization and body composition of juvenile tilapias (Sarotherodon mossambicus). Aquaculture.<br />
27:43-54.<br />
Khan M. S., K. J. Ang, M. A. Ambak, and C.R. Saad. 1993. Optimum dietary protein requirement of a<br />
Malaysian freshwater catfish, Mystus nemurus. Aquaculture. 112:227–235.<br />
Lovell, R. T. 1989. Nutrition and Feeding of Fish. Van Nostrand Reinhold (ed.). New York. 260p.<br />
McGoogan, B. B. and D. M. Gatlin III. 1999. Dietary manipulations affecting growth and nitrogenous<br />
waste production of red drum, Sciaenops ocellatus I. Effects of dietary protein and energy levels.<br />
Aquaculture. 178:333–348.<br />
Monentcham, S. 2009. Alimentation et nutrition des juvéniles de Heterotis niloticus (Arapaimidae,<br />
Teleostei). PhD thesis. Presses Universitaires de Namur, Namur.<br />
Moreau, J. 1982. Exposé synoptique des données biologiques sur Heterotis niloticus (Cuvier, 1829). FAO<br />
Synop. Pêches (131), p. 45.<br />
Neter, J., M. H. Kutner, C. J. Nachtsheim, and W. Wasserman. 1996. Applied linear statistical models,<br />
fourth edition. McGraw-Hill, New York, 1408pp.<br />
Ng, W. K., S. C. Soon, and R. Hashim. 2001. The dietary proteinrequirement of a bagrid catfish,<br />
Mystus nemurus (Cuvier & Valenciennes), determined using semi-purified diets of varying protein level.<br />
Aquaculture Nutrition. 7:45–51.<br />
NRC .1993. Nutrient Requirements of Fish. National Academy Press, Washington, DC.<br />
Nunez Rodriguez J., Ziriga Josilé Otémé and Saurin Heni, 1995: Comparative study of vitellogenesis of<br />
two African catfish species Chrysichthys nigrodigitatus (Claroteidae) and Heterobranchus 1ongifilis<br />
(Clariidae). Aquatic Living Resources 8: 201 -206<br />
Nwadiaro C. and P. Okorie, 1985: Feeding habits of the of the African Bagrid, Chrysichthys filamentosus<br />
in a Nigerian Lake, Japanese Journal of Ichthyology. 33: 376-383<br />
Offem B. O., Y. Akegbejo-Samsons and I.T Omoniyi, 2009: Trophic ecology of commercially important<br />
fishes in the Cross River, Nigeria. The Journal of Animal and Plant Sciences 19: 37-44.<br />
Offemin, B. O., Y. Akegbejo-Samsons, and I. T. Omoniyi. 2008. Diet, size and reproductive biology of<br />
the Silver catfish, Chrysichthys nigrodigitatus (Siluriformes: Bagridae) in the Cross River, Nigeria.<br />
International Journal of Tropical Biology. 56:1785-1799.<br />
Ogwumba A. A. A., 1988. Food and Feeding habits of Juveniles of some culturable fish species in<br />
Nigeria. Technical Paper 31, Nigeria Institute for Oceanography and Marine Research. 24 pp
FINAL REPORTS: INVESTIGATIONS 2009–2011<br />
Osman, M. N. 1991. Interaction between dietary protein and carbohydrate levels in Tilapia Diets. Zagazig<br />
Veterinary Journal. 19: 627.<br />
Oti, E. E. 2003. Studies on the ichtyofauna of Ehoma floodplain, Afikpo eastern Nigeria. ACP–EU<br />
Fisheries Research Report NO. 14. 9pp.<br />
Padi J. N. 2006. Artificial reproduction of the freshwater fish, Heterotis niloticus, in experimental<br />
ponds in Southern Ghana. Journal of the Ghana Science Association 8: 45-53<br />
Robinson, E. H., M. H. Li, and B. B. Manning. 2000. Evaluation of various concentrations of dietary<br />
protein and animal protein for pond-raised channel catfish, Ictalurus punctatus, fed to satiation or at a<br />
restricted rate. Journal of the World Aquaculture Society. 31:503-510.<br />
Tacon, A. G. J. 1987. The Nutrition and Feeding of Farmed Fish and Shrimp. A Training Manual.1: The<br />
Essential Nutrients. A report prepared for the FAO trust fund GCP/RLA/075/ITA. Project support to<br />
the regional aquaculture activities for Latin America and the Caribbean.126pp.<br />
United <strong>State</strong>s Environmental Protection Agency (USEPA). 2002. Injurious Wildlife Species; Snakeheads<br />
(family Channidae). Federal Register: Volume 67, Number 193.<br />
United <strong>State</strong>s Geological Survey (USGS). 2010a. Literature review and background information.<br />
Accessed on May 20, 2010 at<br />
http://fl.biology.usgs.gov/Snakehead_circ_1251/html/literature_and_background.html.<br />
Victor, R., and B. O. Akpocha. 1992. The biology of snakehead, Channa obscura (Gunther), in a<br />
Nigerian pond under monoculture. Aquaculture. 101(1-2):17-24.<br />
Yang, S. D., C. H. Liou, and F. G. Liu. 2002. Effects of dietary protein level on growth performance,<br />
carcass composition and ammonia excretion in juvenile silver perch (Bidyanus bidyanus).<br />
Aquaculture. 213:363–372.<br />
Zhang, J., F. Zhou, L. Wang, Q. Shao, and Z. Xu. 2010. Dietary Protein Requirement of Juvenile Black<br />
Sea Bream, Sparus macrocephalus. Journal of the World Aquaculture Society. 41:151-164.<br />
416
417<br />
FINAL REPORTS: INVESTIGATIONS 2009–2011<br />
Prospects and Potential of the African Lungfish (Protopterus spp): An<br />
Alternative Source of Fishing and Fish Farming Livelihoods in Uganda and<br />
Kenya<br />
Indigenous Species Development/Study/09IND07AU<br />
John Walakira and Gertrude Atukunda<br />
National Fisheries Resources Research Institute<br />
Jinja, Uganda<br />
Joseph J. Molnar<br />
Auburn <strong>University</strong><br />
Auburn, Alabama, USA<br />
ABSTRACT<br />
Culture of species resilient to drought and stressed water quality conditions may be a significant part of<br />
the future of African aquaculture. Air breathing fishes potentially have a role in low-management culture<br />
systems for small farms because dissolved oxygen does not threaten the fish crop. The African lungfish<br />
(Protopterus spp) is advantageous because it is: an indigenous fish with good quality flesh, an airbreather,<br />
and a biocontrol agent against schistosome vector snails. African lungfish wild stocks in Uganda<br />
are falling, while no clear, sustainable strategies have been formulated to replenish the diminishing<br />
natural populations. Little is known about indigenous practices of culture, harvest, and marketing of<br />
Protopterus spp from farm ponds and water bodies.<br />
Lungfish is highly valued as a food item in eastern of Uganda, and now is becoming more broadly<br />
accepted in the central region. Certain health or nutraceutical benefits are also attributed to the species.<br />
Most lungfish is consumed fresh but smoked products are also marketed. The fish is increasingly found<br />
alongside tilapia and Nile perch in some rural and urban markets. Nonetheless, there also seems to be<br />
some countervailing sociocultural beliefs that continue deter consumers from eating lungfish.<br />
This study assesses the status and potential of lungfish aquaculture in Uganda in seven districts in<br />
Kampala, Wakiso, Kumi, Busia, Soroti, Pallisa and Jinja. Semi-structured interviews were conducted<br />
with key stakeholders; fish farmers, fisher folk communities, Fisheries officers, scientists, fish traders,<br />
and consumers. Socio-economic conditions (prices, demand, and public perceptions) that shape the<br />
culture of African Lungfish also were assessed.<br />
INTRODUCTION<br />
Globally, rising food prices have shifted 44 million people into extreme poverty while Uganda has nine<br />
million people facing an acute food shortage (World Bank, 2010). Aquaculture provides alternative<br />
source to food security and livelihood improvement, in the Sub-Saharan region population (Brummett and<br />
Williams, 2000). Lake fisheries continue to decline, and aquaculture production (subsistence and<br />
commercial oriented) is less than 1% of total national production (FAO, 2010; Isyagi et al., 2009).<br />
Fish is an important source of protein, contributing 42% of animal protein intake for 2.6 billion people,<br />
and, developing countries consider it as a human health asset (Brunner et al., 2009). Increasing human<br />
demand for fish as natural wild fish populations are plummeting require urgent solutions (Brunner et al.,<br />
2009). High prices of Nile perch and tilapia have reported shifted some consumers toward African<br />
lungfish, especially in densely populated areas of Kampala. In rural areas, the capita consumption of fish<br />
in general is reported to be as low as 1.9 kg (Nnyepi, 2006). Uganda has the some of the highest
FINAL REPORTS: INVESTIGATIONS 2009–2011<br />
population growth rates in central Africa but continues to have high incidences of chronic childhood<br />
malnutrition especially in rural areas (Owor et al., 2000; Nnyepi, 2006; Nalwoga et al., 2010).<br />
Aquaculture offers an alternative source to food security and livelihood improvement, in the Sub-Saharan<br />
region population (Brummet and Williams, 2000). Aquaculture in Uganda is mainly characterized by<br />
culture of Tilapia (Oreochromis niloticus), Catfish (Clarias gariepinus) and carp (Cyprinus carpio) at<br />
subsistence and semi –commercial levels; contributing less than 1% of total national production in each<br />
country (FAO, 2010; Isyagi et al., 2009). Lungfish farming, therefore, will not only diversify farmed fish<br />
products in Uganda but will eventually reduce pressure on the declining stocks from the wild.<br />
Shifting rainfall and temperature regimes are bringing new challenges to the management of water bodies<br />
and fish ponds in sub-Saharan Africa. The culture of species resilient to drought and stressed water<br />
quality conditions may be a significant part of the future of African aquaculture. Air breathing fishes such<br />
as the Marbled African Lungfish (Protopterus aethiopicus) are able to obtain and utilize oxygen from air<br />
to meet all or part of their metabolic demands. These fish are classified obligate air breathers, as adults of<br />
the species asphyxiate when denied access to air. They are carnivorous, eating crustaceans, aquatic insect<br />
larvae, and mollusks.<br />
Air breathing fishes potentially have a role in low-management culture systems because dissolved oxygen<br />
is not a limiting factor. The African catfish (Clarias gariepinus) can tolerate low levels of dissolved<br />
oxygen but its flesh is often of less consumer interest. Concurrently, the Pangasius catfish's flesh is of<br />
high quality but is a species exotic to Uganda. Therefore, the African lungfish (Protopterus aethiopicus<br />
and Protopterus amphibious) is advantageous because it is an indigenous fish with good quality flesh, a<br />
biocontrol agent against schistosome vector snails (Daffalla et al., 1985), and has some existing level of<br />
indigenous culture (Greenwood, 1966). The food value of the lungfish is enhanced by its high muscle to<br />
bone ratio, and its bones and cartilage pose less danger of choking consumers. Statistical estimates of per<br />
capita consumption of lungfish grew after 2000, but more recently declined to 6kg/year compared to<br />
global level of 12kg and the Sub-Saharan Africa of 7kg (DFR, 2011; FAO, 2011).<br />
The African lungfish is native to the natural waters of Uganda (Birt et al., 2006; Greenwood, 1958, 1986)<br />
but rapidly declining, and, therefore endangered mainly due to its overexploitation, environmental<br />
degradation and the large-scale conversion of wetlands to agricultural land (Balirwa et al., 2003;<br />
Goudswaard et al., 2002). Catch trends of the African lungfish from Uganda waters suggest that quantities<br />
caught have stagnated for the past two decades with a peak during 1979 to 1985 period. Generally, there<br />
is a decline in the fishery from Uganda waters as quantities dropped from 411,800 metric tonnes in 2005<br />
to 366,600 metric tonnes in 2010 (UB0S, 2010) according to statistics from the Uganda Bureau of<br />
Statistics (UBOS). And, yet the country has the highest population growth rates (3.2%) in world (UBOS,<br />
2010; MFPED, 2010), that continues to exert pressure of its natural resources. Furthermore, insurgency in<br />
Northern Uganda caused migration to lungfish consuming regions of Uganda. A substantial number of<br />
affected people settled around lake regions of Kyoga, Bisina, Opeta and Victoria, most of whom who<br />
consume lungfish and regard it as a favorable food item. Thus, the lungfish seems to have broad<br />
consumer appeal in Uganda.<br />
Physiology<br />
Lungfish are members of the taxonomy class Sarcopterygii; they are lobe finned fishes (together with<br />
coelacanths). 1 The African lungfish is native to East African lakes, swamps, rivers and wetlands (Birt et<br />
al., 2006; Greenwood, 1958, 1986). Lungfish are locally important food fishes captured from natural<br />
habitats in lakes and reservoirs using a variety of gear including gillnets, long lines, and other methods. It<br />
1 Order: Ceratodontiformes, Australian, S. American and African species Family: Protopteridae; Genus: Protopterus;<br />
there are at least four African lungfish species, Species: Protopterus aethiopicus (with three subspecies),<br />
Protopterus amphibious, Protopterus annectens, and Protopterus dolloi (Haeckel 1851).<br />
418
419<br />
FINAL REPORTS: INVESTIGATIONS 2009–2011<br />
is an endangered fish in Uganda as its natural stocks are rapidly declining mainly due to overexploitation,<br />
environmental degradation and the large-scale conversion of wetlands to agricultural land (Balirwa et al.,<br />
2003; Goudswaard et al., 2002). In Kenya's Lake Baringo, however, they dominate catches with annual<br />
landings of up to 90 metric tons after being introduced in 1970s and the fishery emerged in 1984 (Mlewa<br />
et al., 2005; 2007; Mlewa & Green, 2004; Garner et al., 2006).<br />
In nature, aestivating lungfish remain buried in mud cocoons relying solely on air to survive drought<br />
periods (lasting several months). Lungfish are periodically exposed to water with low oxygen content or<br />
situations into which their aquatic environment dries up. Their adaptation for dealing with these<br />
conditions is an out pocketing of the gut, related to the swim bladder of other fishes, which serves as a<br />
lung. The African lungfishes are obligate air breathers, with reduced gills in the adults. 2<br />
African lungfish breed at the beginning of the rainy season. They construct nests or burrows in the mud to<br />
hold their eggs, which they then guard against predators. When hatched, the young resemble tadpoles,<br />
with external gills, and only later develop lungs and begin to breathe air (Goudswaard et al., 2002).<br />
Basic work on pond culture by Mlewa et al. (2009) finds indications of early breeding behavior, as the<br />
trial lungfish attained sexual maturity slightly earlier than those in wild populations since the lungfish that<br />
made burrows and were not accessible for harvest. Culture trial results showed that lungfish realized<br />
growth increments of 2.7 and 14.5 cm over time periods ranging from 70 to 238 days. The mean absolute<br />
growth rate was 0.049 (±0.008 SE) cm/ day, whereas specific growth rates ranged from 0.048 to 0.140%<br />
per day. This study demonstrated that marbled lungfish can be raised in earthen ponds and suggested that<br />
further research determine its potential in the aquaculture industry. Furthermore, efforts to develop culture<br />
techniques must also address handling and harvesting issues associated with a fish that has a "beak" like a<br />
snapping turtle and a tendency to burrow in the soil when a pond is drained (Mlewa et al. 2009).<br />
Traditional Practice<br />
Local practice is to excavate lungfish, burrow and all, and store it for later use when they want fresh fish<br />
to eat. As use of long lines and gillnets are increasing, Uganda lake and river lungfish populations are<br />
decreasing. In Uganda, some women do not eat lungfish under the belief that it is a "sister fish,"<br />
associated with men and manhood (Bruton, 1998).<br />
Little is known about indigenous practices of culture, harvest, and marketing of Protopterus spp from<br />
farm ponds and water bodies. Anecdotal evidence suggests farmers gather wild nestlings of lungfish and<br />
stock small water bodies but with no documentation of management practices or yields (Mwatete et al.,<br />
2005). Preliminary attempts in Kenya to grow wild Marble lungfish (Protopterus aethiopicus) 'fry' in<br />
earthen pond encountered difficulties because most fish went into burrows and disappeared.<br />
Culture trial results undertaken by Mlewa et al. (2009) with African lungfish showed growth increments<br />
of 2.7 and 14.5 cm were realized over time periods ranging from 70 to 238 days. The mean absolute<br />
growth rate was 0.049 (±0.008 SE) cm/ day, whereas specific growth rates ranged from 0.048 to 0.140%<br />
per day (Mlewa et al. 2009). This study demonstrated that marbled lungfish can be raised in earthen<br />
ponds and suggested that further research determine its potential in the aquaculture industry. Baer et al.<br />
(1992) succeeded in culturing wild-caught Protopterus amphibius juveniles grown in concrete tanks at a<br />
2 They have two anterior gill arches that retain gills, though they are too small to function as the sole respiratory<br />
apparatus. The lungfish heart has adaptations that partially separate the flow of blood into its pulmonary and<br />
systemic circuits. The atrium is partially divided, to that the left side receives oxygenated blood and the right side<br />
receives deoxygenated blood from the other tissues. These two blood streams remain mostly separate as they flow<br />
through the ventricle leading to the gill arches. As a result, oxygenated blood flows mainly to the anterior gill arches<br />
and the deoxygenated blood flows to the posterior arches (Goudswaard et al., 2002).
FINAL REPORTS: INVESTIGATIONS 2009–2011<br />
density of two fish per m 2 . They obtained good results with fish fed with soft balls containing raw minced<br />
beef heart and cooked tilapia.<br />
Efforts to develop culture techniques must also address handling and harvesting procedures associated<br />
with a fish that has a "beak" like a snapping turtle and a tendency to burrow in the soil when a pond is<br />
drained. Lungfish have sharp plate-like that are not well developed like other types of fish and uses them<br />
to feed generally on live fish and mollusks. Its teeth are sharp making dangerous to handle that incidence<br />
of some fishermen have lost a finger to lungfish attack. Fishermen use baits (mainly Clarias spp) and<br />
papyrus made baskets to trap it but use hoes or spears to hit it its head to avoid being hurt or bitten. Baer<br />
et al. (1992) explains how frequent handling of lungfish stresses the fish leading to aggressive actions,<br />
and gentle handling reduced the application tranquilizers. Interestingly, fish farmers have succeeded in<br />
seining out lungfish from their ponds but still have to use spears to kill or hoe to kill. Implying that<br />
lungfish can be harvested using available gears, nevertheless appropriate technologies will have to be<br />
developed to address aquaculture perspectives.<br />
Lungfish ferociously protect their eggs and nestlings which makes it difficult to collect fry or nestling for<br />
fish farming. Furthermore, lungfish fingerling rarely swims in schools as observed by many fishermen.<br />
Fingerlings are normally seen swimming under mats of water hyacinth (Eichhornia crassipes) and around<br />
papyrus vegetation which makes it difficult to collect large numbers, for example in thousands. However,<br />
Mlewa et al. (2009) revealed indications of early breeding behavior, as the trial lungfish attained sexual<br />
maturity slightly earlier than those in wild populations since the lungfish that made burrows and were not<br />
accessible for harvest. Therefore, it may be possible to develop breeding techniques for lungfish in<br />
captivity.<br />
Surveys undertaken by the National Fisheries Resources Research Institute (NaFIRRI) indicate the<br />
majority of caught using gill nets and hooks are in stage IV-V which is a mature fish (NaFIRRI, 2005,<br />
2006, 2007) which may indicate a fishery under pressure as the recruitment process is interfered with. The<br />
sharp decline is attributed to the increase in population and number of fishing boats. Immature fish is also<br />
caught and sold in the markets regardless of stringent regulatory policy in place. Interestingly, the<br />
existence of ‘immature’ females from the wild that have mature eggs is a major challenge to current<br />
fisheries regulations to protect immature lungfish.<br />
The literature on African lungfish mainly examines lungfish ecology, fishery, biology, and physiology,<br />
but few studies treat its use as a food fish in aquaculture (Baer et al., 1992). Therefore, this study applies<br />
what is known about lungfish to explore its aquaculture potentials in improving food security and<br />
livelihoods in sub-Saharan Africa. The study assesses indigenous practice and understandings about<br />
production parameters and approaches. The field work assesses potential paths for producer adoption and<br />
training to use lungfish as a culture species and a managed water body resource.<br />
METHODS AND MATERIALS<br />
The first part of this study involved collecting and collating existing information from government<br />
fisheries departments; the Department of Fisheries Resources under Ministry of Agriculture, Animal<br />
Industry and Fisheries, District Fisheries headquarters and the National Fisheries Resources Research<br />
Institute (Jinja and Kajjansi). Discussions were held with government officials on policy towards lungfish<br />
in the wild and in aquaculture, as well as market trends. This information was further supplemented with<br />
publications or reports from government agencies.<br />
Field Visits<br />
The second part involved gathering primary information obtained through conversations with fishers,<br />
marketers, and consumers about the potential for lungfish culture in Uganda. Informal discussions were<br />
420
421<br />
FINAL REPORTS: INVESTIGATIONS 2009–2011<br />
held in eight districts (Kampala, Wakiso, Mukono, Kumi, Busia, Soroti, Pallisa and Jinja). These were<br />
districts known to have some level of indigenous practice with lungfish. Local field extension workers<br />
provided translation where local languages were spoken (Figure 1). We spent more time with those<br />
capturing and marketing lungfish and less time with consumers. We met people at fish farms (34), fish<br />
landing sites (10), fish markets (10), restaurants (17) and visited government fisheries offices (11) (Table<br />
1).<br />
Fish farmers, residents of fisher communities, district extension officers, fish traders and scientists were<br />
contacted to assess indigenous knowledge and practices associated with the culture and use of lungfish on<br />
farms in ponds, in natural water bodies and reservoirs. Guiding questions for the discussions centered on<br />
reasons for involvement with lungfish, harvest and handling practices, and fish farming and when it<br />
started, problems encountered, and overall views on lungfish.<br />
Figure 1. Map of Uganda showing study locales.<br />
We attended fish markets to assess lungfish prices,<br />
demand, and public perceptions. We visited fish<br />
markets reputed to trade in African lungfish, located<br />
within city areas or in proximity to fish landing sites.<br />
Lungfish growers, fishers, restaurant owners,<br />
consumers, fish traders, wholesalers and retailers were<br />
key informants. We asked questions about types of<br />
fish supplied or sold, quantity, prices, seasonal<br />
variations, and gender participation.<br />
Study districts<br />
Eight districts were purposively selected for field<br />
work. We relied on information provided by fisheries<br />
officers and administrative records to select study<br />
areas. Each is located in areas or zones suitable for<br />
aquaculture production and each had reported markets<br />
for lungfish.<br />
Table 1. Number of contacts by type and district, Uganda lungfish study, 2011<br />
District<br />
Fish<br />
Farmers<br />
Landing sites<br />
Fish<br />
Traders<br />
Consumers Restaurants Government<br />
Institutes*<br />
Soroti 5 1 7 16 2 1<br />
Kumi 6 2 10 11 1 1<br />
Pallisa 2 1 2 5 0 1<br />
Busia 5 1 5 9 1 1<br />
Iganga 0 0 2 0 1 0<br />
Jinja 5 2 6 16 3 2<br />
Mukono 2 0 1 2 2 0<br />
Wakiso 8 2 9 11 3 3<br />
Kampala 1 1 23 24 4 2<br />
Total (n) 34 10 65 94 17 11<br />
*Institutes include District Fisheries Office, National Fisheries Resources Research Institute and Department of Fisheries<br />
Resources Headquarters
FINAL REPORTS: INVESTIGATIONS 2009–2011<br />
RESULTS<br />
Lungfish in East Africa<br />
Most lungfish is captured in Uganda’s natural waters; contributing over 90% of lungfish caught in the<br />
three Lake Victoria countries (Kenya, Uganda and Tanzania). In the period 1975 to 2009, a total of<br />
404,008 tons of lungfish have been caught of which 371,811 tones were caught in Uganda and 32,197<br />
tones captured in Kenya (Figure 2). No records show lungfish caught in Tanzania.<br />
Uganda recorded the highest quantity caught (15,000-22,000 tons) during 1976 to 1985, then decreased<br />
during 1985 to 1989, with steady production thereafter. The amount of Lungfish caught in Kenya has<br />
stagnated around 1000-3000 tons in the four decades. However, from 2005 onwards statistics generally<br />
show a decline in catches.<br />
Figure 2. Lungfish in the market.<br />
Figure 3. Capture trends of Lungfish caught in Kenyanya, Tanzania and Uganda. Sourced from FAO.<br />
422
423<br />
FINAL REPORTS: INVESTIGATIONS 2009–2011<br />
Fisheries of Uganda<br />
Overall, lungfish contributes about 4% of the total fish caught from natural water bodies in Uganda.<br />
Tilapia (37%) and Nile perch (42%) are the largest quantity harvested (Figure 3). Lungfish are mainly<br />
caught using gill nets, hooks, basket traps, or long-lines.<br />
Nile perch and tilapia catches steadily increased in the period 1969 to 2006, but started declining<br />
afterwards. Peak catches of lungfish were seen in the period 1977 to 1983. Thereafter, lungfish catches<br />
declined for about six years until 1989 when the quantity stagnated or leveled in thousand tones.<br />
Q uantity (t)<br />
250000<br />
200000<br />
150000<br />
100000<br />
50000<br />
0<br />
African Lungfish<br />
4%<br />
Silver Fish<br />
6%<br />
TigerFish<br />
4%<br />
Bagrus<br />
2% Clarias<br />
1%<br />
Tilapia<br />
37%<br />
Elephant Snout<br />
fish<br />
1% Others<br />
2%<br />
Nile Perch<br />
42%<br />
Figure 4. Main fish species caught in Uganda waters (1999).<br />
1969 1971 1973 1975 1977 1979 1981 1983 1985 1987 1989 1991 1993 1995 1997 1999 2001 2003 2005 2007 2009<br />
Period<br />
African Lungfish Nile perch Tilapia spp<br />
Figure 5. Trends of Fish (Nile perch, Tilapia and African Lungfish) caught in Ugandan Lakes. FAO.
FINAL REPORTS: INVESTIGATIONS 2009–2011<br />
Market Sources<br />
African lungfish is constantly being hunted even during the dry season when it is aestivating. Most<br />
lungfish is caught from the wild environments (lakes, swamps or seasonal rivers) and either sold in local<br />
markets or consumed directly at home. Breeding sites for African lungfish are disappearing as wetlands<br />
are converted to farm land to produce food. Variations in catches occur across districts visited as Kumi<br />
and Soroti have the largest quantity caught from Lakes Opeta, Bisina, Nyaguo and Kyoga. Other districts<br />
obtain lungfish from Lake Victoria.<br />
Figure 6. A) Fishers at Akidel landing site in Kumi district; B) Size variation of lungfish caught from Lake Opeta.<br />
Over 50% of lungfish (locally known as Ebileng) in Kumi district is mainly from Lakes Opeta and Bisina<br />
at Ometanga and Akidea landing sites, respectively. Records from Lakes Opeta, Bisina and Nyaguo,<br />
taken since 2005, show that lungfish contributes 59% of the total fish harvest, while tilapia (18%),<br />
Clarias spp (18%), and other types of fish (5%) are also caught (figure 4). High catches of lungfish occur<br />
during low tides and the onset of rainy seasons. Nonetheless, most fish are ‘immature’ or small sized.<br />
Fishermen report that some young female lungfish of sixe 300 grams taken from the wild have mature<br />
eggs. Also, according to district officials and residents of fisher communities, the size and numbers of<br />
lungfish caught is falling. In the early 1990s, catches were over 3,000 tons per year but recent government<br />
records show an annual total of 154 tons. Additionally, over 400 fishing boats are used on the lakes and<br />
utilized in turns (day and night), to increase fishing efforts.<br />
Two forms of lungfish are harvested, eigolo, the giant lungfish and ebilongotuba, a tailless form that is<br />
harvested while aestivating in the dry season. Records at landing sites in Busia, Jinja, Wakiso and<br />
Kampala districts show that lungfish landings are third after Nile perch and tilapia<br />
There are no clear guidelines to restrain the taking of small lungfish. Most captured lungfish reportedly<br />
weight less than a kilogram. In Soroti, lungfish is sourced from Lakes Kyoga and Opeta. However, the<br />
average size of lungfish harvested from Lake Kyoga is larger than those caught from Opeta and other<br />
small lakes in eastern Uganda.<br />
Evaluating lungfish as a culture species<br />
A total of 34 fish farmers were contacted in eight districts; Soroti, Kumi, Pallisa, Busia, Jinja, Mukono,<br />
Wakiso and Kampala. All culture systems visited were earthen ponds averaging 300 m 2 . Main fish<br />
424
425<br />
FINAL REPORTS: INVESTIGATIONS 2009–2011<br />
stocked include Nile tilapia (Oreochromis niloticus) and the African catfish (Clarias gariepinus), cultured<br />
in either polyculture or monoculture systems.<br />
Only one farmer in Nangabo (Wakiso district) had stocked ponds with lungfish since 2003. He stocked<br />
1,000 juveniles (length, 15-20 cm) together with Mirror Carp and tilapia in a 400 m 2 pond. He fed the fish<br />
with maize bran mixed with mukene (fish meal), once every day for eight months. No proper records<br />
were kept to determine the amount fed daily. Fish were kept in ponds for 1.5 years, but yielded 361 adult<br />
lungfish that ranged one to three kilograms. He sold the lungfish in Kampala fish markets for about US $<br />
2.5 – 4.0 per kg. Unfortunately, he abandoned fish farming in 2006 because he was too old to run the<br />
farm.<br />
No other fish farmers stocked African lungfish. However, some reported harvesting lungfish from their<br />
ponds in areas that are frequently prone floods, especially in Kumi and Soroti. These fish farmers attribute<br />
the loss of stocked fish in their ponds to the predation of lungfish from the wild, and, their burrowing<br />
habits that cause leaks. One Soroti district farmer claimed to have lost over 70% of the stocked catfish<br />
after discovering adult lungfish in his ponds. Furthermore, some farmers reported the presence of lungfish<br />
created turbid waters in their ponds. Nevertheless, lungfish found in fish ponds are either consumed at<br />
home or sold in nearby markets.<br />
Overall, about 56% of the fish farmers (N=34) were willing to grow lungfish, while 41% where not<br />
willing for various reasons. Three percent said they had abandoned fish farming altogether. Those who<br />
were willing; Kumi district (28%) had the highest interest then, Soroti (22%), Busia (22%), Wakiso<br />
(17%) and Jinja (11%).<br />
The main reasons farmers gave for engaging in lungfish farming were: the availability of markets and<br />
good prices (71%); the fish product quality—it does not smell and has a substantial fillet size (23%); and<br />
others mentioned the large size—lungfish may exceed one kilogram (6%). Surprisingly, one farmer in<br />
Busia had his ponds ready prepared for stocking lungfish fingerlings that he will was going to obtain from<br />
shores of Lake Victoria. He felt he could use his catfish-rearing experience to succeed in growing<br />
lungfish.<br />
Fish farmers who were not willing to undertake lungfish farming where mainly from the central districts;<br />
Jinja (28%) and Wakiso (27%). Others were from Pallisa (18%), Busia (9%), Soroti (9%) and Kampala<br />
(9%). The main reasons given were religious and tribal beliefs (36%), centrally concerning attributions of<br />
negative impacts on female consumers. Other reasons for not growing the fish related to predation (22%),<br />
lack of technical guidance on how to culture lungfish (14%), concerns about its burrowing habits (14%),<br />
doubts about its market value (7%), while others had no knowledge of the fish (7%).<br />
Several previous attempts to culture lungfish were reported. In Kumi, some fishermen living around Lake<br />
Bisina and Opeta stocked 15-30cm juveniles in excavated holes (40cm diameter; 1m deep). They fed<br />
these small batches daily with fish fry (mainly tilapia and catfish), grasshoppers, snails and food trash. No<br />
attempts to feed plant materials were reported. After a year, the lungfish reached about 70 cm in length,<br />
they were harvested using hooks. According to these fishermen, some lungfish were lost to cannibalism.<br />
Others escaped harvested because they burrowed into pond soils.<br />
In 2009, a fish trader in Bwaise (Kampala) attempted to raise a juvenile (>20cm) in a concrete tank (1x 1<br />
x 0.5 m 3 ). He fed it with food trash or leftovers from home, harvesting after seven month when the water<br />
turned green and smelly. He was disappointed with the 60 cm. average size of the harvested lungfish.<br />
Feeding African lungfish with fry of tilapia and Clarias spp shows that the fish can be polycultured with<br />
prolific Tilapia spp. This may be possible if the lungfish is the targeted as the primary cultured fish
FINAL REPORTS: INVESTIGATIONS 2009–2011<br />
because as a carnivore it decimates most of the tilapia population. Raising it in cylindrical dug-holes and<br />
concrete tanks provides us with an insight on which culture systems can be used to raise. Lungfish can<br />
burrow through pond dykes leading to leaks, and at times of loss of fish. Some advantage could accrue to<br />
raising the species in concrete tanks or ponds. One Bwaise trader reported trying to raise lungfish in a<br />
concrete tank, but had water quality problems that apparently stunted the fish. Therefore, in culturing<br />
lungfish water quality may need to be studied.<br />
Consumption of fish<br />
Per capita fish consumption in Uganda increased from 2000 to 2007, but gradually declined to 6 kg<br />
afterwards (DFR, 2011). Most respondents consider fish to be an expensive protein commodity; as result<br />
people tended to reduce the amount regularly consumed. Many attribute high fish prices to scarcity from<br />
the wild. Most lungfish is consumed fresh, but cured products (smoked and sun dried) also are available<br />
in markets.<br />
Diverse views of lungfish as a food item were obtained across the eight districts visited. Those who<br />
regularly consume lungfish came from eastern districts (55%)--Kumi, Soroti and Busia. Among the<br />
central districts, Kampala (21%) had the highest numbers of consumers of lungfish, in contrast to Wakiso<br />
(12%) and Jinja (12%). The main reasons consumers gave for preferring lungfish were: price was cheaper<br />
compared to other fish species (Nile perch and tilapia); the taste and fillet size is good and adequate to<br />
feed an average family; and for attributed medicinal (treatment and prevention) properties.<br />
18<br />
16<br />
14<br />
12<br />
10<br />
8<br />
6<br />
4<br />
2<br />
0<br />
Food supply quantity ( kg/capita/yr.)<br />
2000 2001 2002 2003 2004 2005 2006 2007<br />
Figure 2. Per capita fish consumption in Uganda from 2000 to 2007. Sourced from FAOSTAT<br />
Lungfish was most highly valued in Kumi and Soroti districts. In the villages, lungfish is often considered<br />
a delicacy or special dish that is normally prepared for in-laws. Lungfish seem acceptable to both women<br />
and men. Most seem to prefer fresh lungfish, but smoked and salted forms also are found in markets<br />
(figure 6). In Busia district, demand for lungfish (locally known as Emonye) is high but supply was<br />
reported to be low.<br />
In Pallisa, lungfish is known as Nakibalo or Mamba mainly caught from Lake Lamwa. It is not popular<br />
amongst the Bagwere communities. It is popular at the landing sites were the Iteso form the majority<br />
residents. Central region had the highest number of respondents (82%) who had never eaten lungfish, but<br />
far fewer in Wakiso (35%) and Kampala (23%). A few respondents in the eastern region Pallisa (9%) and<br />
Busia (9%) had not eaten lungfish; but none in Kumi and Soroti. Main reasons given for not eating<br />
426
Smoked piece of lungfish Fresh lungfish gutted<br />
427<br />
FINAL REPORTS: INVESTIGATIONS 2009–2011<br />
lungfish were: tribal or traditional beliefs that restricts them from eating lungfish (61%); no prior<br />
knowledge about the fish (25%); religious beliefs about ‘scale-less’ fish (11%); and others could not eat<br />
it because of its external appearance (3%).<br />
A few respondents came from Mbale district where lungfish is called Nambere. In that region lungfish are<br />
mainly obtained from Namatala and Mpologoma streams around Lake Nakuwa. In Mbale, lungfish is not<br />
popular among the Gisu community to the extent that cooking utensils were separated if used to prepare<br />
lungfish.<br />
In this study over 70% of the respondents were female. About 68% report having eaten lungfish. Again,<br />
the majority come from the eastern region districts of Kumi and Soroti. One striking difference observed<br />
is in Kampala district where over 60% of female respondents eat lungfish. Lungfish also is sought for its<br />
ascribed benefits for human health. It is used to treat women’s breasts for problems of lactation; the fish’s<br />
pancreas is reportedly used to treat alcoholism. The tail is used to enhance male’s sexual performance.<br />
Eating lungfish is believed by some to boost the immune system.<br />
Figure 8 (left). Lungfish products observed in local markets<br />
Figure 9 (right). Lungfish market in Bwaise, Kampala.<br />
Restaurants<br />
Only a limited number of restaurants in the study locales have lungfish on their menu. Only six (35%)<br />
restaurants visited prepared lungfish for their customers. Smoked and fried products where the main dish<br />
sold in restaurants. However, restaurants in Jinja and Busia reported that lungfish is normally prepared on<br />
prior request by customers. Some restaurants or Bars in Kabusu and Owino in Kampala have specialized<br />
in selling fried African Lungfish to its customers. Most customers like African lungfish meat because it is<br />
not fatty, does not smell like Nile perch and is satisfying.<br />
Lungfish markets<br />
Fish traders play an important role in mediating lungfish fishers, farmers, and consumers. Wholesale<br />
prices for fresh lungfish range between US $ 0.9 to 1.80 per kg while retail prices can go beyond US $ 2.5<br />
per kg depending on the location. Price for cured products (smoked) range from US $ 3 – 4 per piece.<br />
Prices of lungfish are relatively lower in rural areas than in populated towns or cities. Also, juveniles of<br />
about 15cm total length are treated as by-catch and marketed in clusters. Others are prepared and eaten<br />
fresh after being gutted.
FINAL REPORTS: INVESTIGATIONS 2009–2011<br />
In some Kampala suburbs, kiosks that used to sell Nile perch products commonly known as “fille” are<br />
now substituting it with African lungfish. Low income residents, particularly youth are regular customers.<br />
Majority kiosks selling fried lungfish are owned by women who procure the fish from major fish markets<br />
in Kawempe-Bwaise (Kampala) and Busega (Wakiso). Some women have taken loans to initiate their<br />
lungfish businesses. Fish traders play an important role in mediating lungfish fishers, farmers, and<br />
consumers.<br />
Information derived from this study on consumers’ perspective may not be conclusive but we see a<br />
change in life style in the consumption towards lungfish. Bruton (1998) reports that some women do not<br />
eat the lungfish because they consider it a "sister fish", with some undesirable consequences for the<br />
female consumer. In this study we observed not only active participation of women in lungfish trading but<br />
also consuming it. Some districts had low rates of lungfish eater among women and men especially in the<br />
central region where it is not customary consumed by some clans. Nevertheless, the field observations<br />
suggest increasing interest in lungfish consumption, locally and regionally.<br />
Harvesting and handling<br />
Farmers normally harvest the lungfish after completely draining the pond. Others have ever harvested<br />
lungfish using pond seine nets. To identify the presence of lungfish in the pond, farmers trace clear waters<br />
along the bank and extract it from the holes using hoes and spears. In Soroti and Kumi, farmers detect the<br />
presence of lungfish in burrows by tying a tuft of grass around their legs or stick, which the fish seizes<br />
with its plate like teeth. As it holds on to bait its extracted from the hole, slowly, hit on the head using a<br />
hoe or spear. Other farmers also use baits on hooks usually Clarias spp and earthworms caught from the<br />
wild. The Clarias spp bait is the most effective bait. It is easy and safer to harvest them during the dry<br />
season because they are relatively inactive. Lungfish harvested is handled around the neck avoiding the<br />
mouth parts.<br />
Figure 10 (left). Lungfish nest with fry along shore of Lake Opeta, Uganda.<br />
Figure 11 (right). Eggs extracted from a female lungfish.<br />
Hooks and basket traps (locally called Ekolo) are mainly used to catch the lungfish in seasonal wetlands.<br />
In the dry season (December, January and February) lungfish is dig-up from holes using hoes when the<br />
local communities cultivate or hunt around the wetlands. Women play a major role in lungfish fisheries;<br />
hunting, post harvesting processes and the marketing. In Pallisa, lungfish is locally known as Nakibalo or<br />
Mamba. The fish is mainly caught from Lake Lamwa using hooks number 5, gill nets of 4 to 4.5 inches<br />
and baits used include pieces of meat, rats, and frogs. In Busia lungfish is sourced from the shorelines of<br />
Lake Victoria and swampy areas using hooks (number 12), basket traps and spears.<br />
428
429<br />
FINAL REPORTS: INVESTIGATIONS 2009–2011<br />
Identifying simple fingerling production techniques<br />
No established procedures have been yet been developed to produce lungfish fingerlings. All fingerlings<br />
were acquired from the wild, mainly from mats of water hyacinth (Eichornia crasipes) and in the nests.<br />
Furthermore, obtaining a substantial number (more than 1000s) may be difficult as many lungfish<br />
fingerlings are reported to swim individually rather than in schools. However, fishermen can time<br />
breeding seasons of lungfish when the fry or fingerlings are available; during the onset of rains.<br />
It is difficult to distinguish males from males lungfish because they appearance is similar but some<br />
speculate orientation of genital opening beneath the pelvic fin may correlate with the sex of the fish. The<br />
female genital opens on the right while the male opens to the left. Some fishermen did not agree to this<br />
revelation because at times fish that is thought to be a male normally has eggs when gutted.<br />
The female produces very many eggs and lays them in stagnant water in a hole or a nest away from<br />
sunlight and guards them. The eggs are deposited on the base of the nest and the male fertilizes them<br />
later. It is not known how long it takes for the eggs to hatch in such conditions. It is very difficult to get<br />
fertilized eggs or fry from the nest because the lungfish ferociously guards the nest. However, one can<br />
extract eggs from a wild caught female.<br />
CONCLUSION<br />
The study assessed indigenous practice and understandings about lungfish as a potential culture species<br />
in Uganda and more broadly in Sub-Saharan Africa. Fish farmers already have inadvertently farmed<br />
lungfish that entered their ponds during flood periods. An experiment program in needed to establish<br />
production parameters as little is known about the growth cycle and nutritional needs of farm-reared<br />
lungfish. For example, optimal water temperatures, salinity tolerance, and other basic parameters of the<br />
species are not known. It is understood that they survive and grow alongside tilapia, for example, but<br />
optimal feed composition and lungfish grow-out strategies remain to be articulated.<br />
At present, growers are reliant on wild-caught lungfish fry for what limited culture is currently taking<br />
place. Research must clarify the reproductive cycle of the lungfish to enable farm-based spawning and<br />
seedstock production of uniform batches of genetically advantaged fish. A clear foundation for<br />
establishing an industry, the biology and manipulation of lungfish reproduction processes is not wellunderstood.<br />
Farmers have developed indigenous means for handling and managing lungfish in natural water bodies<br />
and farms ponds. These are a beginning to be discovered and codified. Promoting wider levels of<br />
production of lungfish will require articulation of model production strategies and management systems<br />
that account for the burrowing and mobility of lungfish. Clearly, cage culture would overcome some of<br />
the known difficulties, but this work has not yet been accomplished.<br />
Lungfish is a delicacy among groups in the Northern, Eastern and some parts of western Uganda.<br />
Thus the present and potential consumer demand for the species is fairly well-established. The field work<br />
assessed potential paths for producer adoption and training to use lungfish as a culture species and a<br />
managed water body resource.<br />
Lungfish may be raised on artificial diets as all fish farms that had the fish in their ponds applied<br />
commercial pellets to catfish or tilapia stocked. Efforts to domesticate African lungfish are foundational<br />
to the advance of a commercial industry providing a valuable food item to people in need of affordable<br />
protein.
FINAL REPORTS: INVESTIGATIONS 2009–2011<br />
This study shows how initiatives to culture the fish build on indigenous knowledge and practice to<br />
formulate a broader strategy of widespread production. Future studies will explore the relative advantages<br />
of different culture systems (tanks, ponds and cages), while addressing specialized procedures for growout<br />
and harvest.<br />
The socioeconomic viability of African lungfish as a new culture species is beginning to be established.<br />
This report identifies the central issues of reproduction, feeding, and management that must be addressed<br />
in order to build an industry with a value chain that delivers quality products to consumers and a<br />
sustainable return to small- and medium-scale producers in Uganda and across Sub-Saharan Africa.<br />
ACKNOWLEDGMENTS<br />
This work is being supported Aqua<strong>CRSP</strong> under the USAID. We thank Karen Veverika (Auburn<br />
<strong>University</strong>) who provided technical guidance. Special thanks to government fisheries technocrats and<br />
Maureen Kaitesi (Research assistant) for guiding the investigating team.<br />
LITERATURE CITED<br />
Baer, S., Haller R. D., Freyvogel T. A. (1992). Growth of the African lungfish, Protopterus amphibious<br />
Peter, in aquaculture. Aquaculture Research 23, 2, 265-267.<br />
Balirwa, J.S, Chapman C. A, Chapman L.J, Cowx I.G, Geheb K, Kaufman L, Lowe-McConnell R. H,<br />
Seehausen O, Wanink J.H, and Welocomme R.L and Witte F. (2003). Biodiversity and fishery<br />
sustainability in the Lake Victoria Basin: an unexpected marriage? BioScience, 53(8):703-716. 2003.<br />
Birt, T.P, Mlewa. C. M, Green M, Seifert. A. and Friesen V. L. (2006). Genetic variation in the marbled<br />
lungfish Protopterus aethiopicus in Lake Victoria and introduction to Lake Baringo, Kenya. J of Fish<br />
Biology 69, 189-199.<br />
Boyd, C. E., S. Soongsawang, E. W. Shell, and S. Fowler. (2010). Small impoundment complexes as a<br />
possible method to increase water supply in Alabama. Proceedings of the 2009 Georgia Water<br />
Resources Conference, <strong>University</strong> of Georgia, Athens, Georgia, USA.<br />
Brummett R.E and Williams M. J, (2000). The evolution of aquaculture in African rural and economic<br />
development. Ecological Economics 33 (2) 193-203.<br />
Brunner E. J, Jones P. J.S. Friel. S and Bartley M. (2009). Fish, human health and marine ecosystem<br />
health: policies in collision. International Journal of Epidemiology 38 (1):93–100.<br />
Bruton, Michael N. (1998). In Paxton, J.R. & Eschmeyer, W.N.. ed. Encyclopedia of Fishes. San Diego:<br />
Academic Press. pp. 70–72. ISBN 0-12-547665-5.<br />
Daffalla, A.A., Elias E.E., Amin M.A. (1985). The lungfish Protopterus annectans (Owen) as a biocontrol<br />
agent against schistosome vector snails. J Trop Med Hyg. Apr 88(2):131-4.<br />
Dunbrack, Green & Mlewa. (2006). Lungfish growth - Journal of Fish Biology 68, 443-447.<br />
FAO. (2010). The <strong>State</strong> of World Fisheries and Aquaculture. 2010. Rome Italy.<br />
Garner, S., T. P. Birt, C. M. Mlewa, J. M. Green, A. Seifert, V. L. Friesen. (2006). Genetic variation in<br />
the marbled lungfish Protopterus aethiopicus in Lake Victoria and introduction to Lake Baringo,<br />
Kenya. Journal of Fish Biology 69(b), 189-199. Retrieved September 22, 2011<br />
http://onlinelibrary.wiley.com/doi/10.1111/j.1095-8649.2006.01224.x/full<br />
Goudswaard, K.P.C., F. Witte, and L. J. Chapman. (2002). Decline of the African lungfish (Protopterus<br />
aethiopicus )in Lake Victoria (East Africa). Afr. J. Ecol., 40, 42-52.<br />
Goudswaard, Kees, Frans Witte, Lauren J. Chapman. (2002). Decline of the African lungfish<br />
(Protopterus aethiopicus) in Lake Victoria (East Africa) East African Wild Life Society, African<br />
Journal of Ecology, 40, 42-52.<br />
Greenwood, P. H. (1966). The Fishes of Uganda. The Uganda Society, Kampala.<br />
Greenwood, P.H. (1958). Reproduction in the East African lung-fish Protopterus aethiopicus Heckel.<br />
Proc. Zool. Soc. London 130, 547-567.<br />
430
431<br />
FINAL REPORTS: INVESTIGATIONS 2009–2011<br />
Greenwood, P.H. (1986). The natural history of African lungfishes. J. Morph. Suppl.1,16 3-179.<br />
http://www.ubos.org/onlinefiles/uploads/ubos/pdf%20documents/2010StatAbstract.pdf. Retrieved 1st<br />
September 2011.<br />
Isyagi N, Atukunda G, Aliguma L, Ssebisubi M, Walakira J, Kubiriza G, Mbulameri E (2009).<br />
Assessment of national aquaculture policies and programmes in Uganda. Aquaculture Compendium.<br />
87 pp.<br />
Mlewa and J. Green (2004). Biology of the Kamongo African Journal of Ecology 42, 338-345.<br />
Mlewa, C.M. & J. Green (2006). Introduction and Fishery - African Journal of Aquatic Science 31, 131-<br />
136.<br />
Mlewa, C.M. C.M., Green & Dunbrack (2007). Lungfish respiration in the wild. African Zoology 42,<br />
131-134<br />
Mlewa, C.M., Green and Simms (2005). Movement and space Use. Hydrobiologia 537, 229-238.<br />
Mlewa, C.M., J. Green & Dunbrack (in Press) Natural history (Book Chapter: Jorgensen & Joss (Eds).<br />
Mlewa, M. C., Ogola, D. W. and Ngugi, C.C. (2009). Aspects of the biology of marbled lungfish<br />
(Protopterus ethiopicus) raised in earthen ponds at the Chepkoilel fish farm, Kenya. Journal of East<br />
African Resources Management 16: 231-34.<br />
Moehl, J., M. Halwart, and R. Brummett. (2005). Report of the FAO-World Fish Center Workshop on<br />
Small-scale Aquaculture in Sub-Saharan Africa: Revisiting the Aquaculture Target Group Paradigm.<br />
Limbé, Cameroon, 23-26 March 2004. CIFA Occasional Paper. No. 25. Rome, FAO. 2005. 54p.<br />
Retrieved 14 January, 2009: http://www.fao.org/docrep/008/a0038e/a0038e04.htm#TopOfPage.<br />
Mwatete, M. C., Ogola, D. W., and Ngugi, C.C. (2005). Towards the recruitment of marbled lungfish<br />
(Protopterus ethiopicus) in aquaculture in the lake Victoria basin: some preliminary results of culture<br />
trials at the Chepkoilel fish farm, Kenya. 2nd National Scientific Conference, Lake Victoria<br />
Environmental Management Project. 17th to 19th October 2005. Tom Mboya College, Kisumu,<br />
Kenya.<br />
UBOS. (2001). The 2000/01 Ugandan Demographic and Health Survey. Kampala: UBOS<br />
UBOS. (2002). Uganda DHS EDU Data Survey 2001. Kampala: UBOS.<br />
Wikipedia. (2011). Protopterus. Retrieved May 14, 2011, http://en.wikipedia.org/wiki/Protopterus<br />
World Bank. (2010). Global Economic Prospects 2010: Crisis, Finance, and Growth. Washington, DC<br />
(www-wds.worldbank.org).
FINAL REPORTS: INVESTIGATIONS 2009–2011<br />
Effects of Environmental Conditions on Gills and Gas Bladder Development<br />
in Bimodal-Breathers, Gar (Lepisosteus sp.), Pirarucu (Arapaima gigas) and<br />
Bowfin (Amia calva)<br />
Indigenous Species Development/Activity/09IND08UH<br />
Konrad Dabrowski<br />
Ohio <strong>State</strong> <strong>University</strong><br />
Columbus, Ohio, USA<br />
Maria Celia Portella<br />
Sao Paulo <strong>State</strong> <strong>University</strong><br />
Jaboticabal, Brazil<br />
Leszek Satora<br />
Jagiellonian <strong>University</strong><br />
Krakow, Poland<br />
ABSTRACT<br />
The long-term goal of this research was to increase our understanding of phenotypic adaptations to<br />
changes in oxygen concentration, beyond sustaining growth. The growth response is implicitly related to<br />
the controlled aquaculture conditions, however the predictive value of oxygen saturation on growth can<br />
be extended to the interpretation of the results in the ponds and estuaries where variation in oxygen<br />
saturation are diurnal and seasonal. The design of the experimental matrix allowed us to distinguish<br />
between several components of the response such as basic morphological changes, behavioral<br />
adjustments, and in some cases, growth.<br />
We have performed one experiment with bowfin (Amia calva) and one with prirarucu (Arapaima gigas).<br />
We further analyzed gill structure of spotted garfish (Lepisosteus oculatus) that was studied earlier. The<br />
first artificial propagation of bowfin performed after hormonal induction confirmed timing of embryonic<br />
development, hatching, yolk absorption and first exogenous feeding as has been described in the<br />
literature. Fertilization was carried out and mass hatching occurred after 8 days at 16 o C. The larvae were<br />
fed live Artemia nauplii and then weaned to a formulated starter feed at a size of 25 mm. The fish were<br />
grown in glass aquaria at 18-22 o C. They were divided into groups of 40 individuals and conditions were<br />
set up at normoxic, 90% oxygen saturation, hypoxia (35%) and hyperoxia (170%). There were 4<br />
replicates for each treatment. The growth rate was monitored during 30 days and no significant<br />
differences were found. There were significant differences in frequency of air gulping between<br />
treatments, 25 + 2 per hour per fish in hypoxia, 58 + 8 in normoxia and 84 + 4 in hyperoxia. Fish were<br />
sampled for histological analysis of gills and gas bladder structure at the termination of the exposure<br />
studies.<br />
In the case of pirarucu, the experiment included four replicate treatments of juvenile pirarucu at acute<br />
hypoxic and hyperoxic conditions for 8 hours, followed by the return to normoxia for 10 h. During the<br />
exposure frequency or air gulping was observed at 1 h intervals. When the stress effect during the first<br />
hour after transfer to experimental conditions was not included, there was a significant difference in air<br />
gulping frequency between hypoxia (3 + 1 per 3 min) and hyperoxia (1 + 0.5). No mortality or other<br />
stress signs were observed. Fish were sacrificed after hypoxia/hyperoxia exposure and 10 h after recovery<br />
in normoxia for histological examination of gills and gas bladder.<br />
432
433<br />
FINAL REPORTS: INVESTIGATIONS 2009–2011<br />
OBJECTIVES<br />
Our primary experiments were designed to investigate the following:<br />
1) Determine morphological structure of gills and respiratory bladder in young-of-year garfish and<br />
pirarucu.<br />
2) Determine ontogenetic changes in the development of gills and respiratory bladder in bowfin<br />
larvae and juveniles in order to establish a model species for air-breathing fishes.<br />
INTRODUCTION<br />
Garfish<br />
Dissolved oxygen level affects fish performance and species able to use or are dependent on atmospheric<br />
air for respiration hold great advantage in frequently occurring conditions of hypoxia in aquatic<br />
environment over non-air breathing teleost fish (Diaz, 2001). If we accept the premise that hypoxia is<br />
more frequent in the tropics and that global climate warming will lead to aggravation of hypoxia in<br />
temperate climatic zone, air-breathing species of fish are particularly amenable to farming for human<br />
consumption.<br />
Fishes throughout their evolutionary history acquired air breathing as early as Late Silurian Period (438<br />
million years before present, MYBP), and as recently as Percomorpha in the Cretaceous Period (100<br />
MYBP) (Graham 1997). Air breathing was “invented” at different times, and the factors that selected for<br />
this specialization might have been different, therefore, the outcome how air breathing shaped respiratory<br />
adaptation in different systematic group of fishes, might be different in extant fishes. For instance,<br />
Lepisosteiformes (garfishes) acquired a dual air and water respiration morpho-physiological adaptation in<br />
Permian Period (260 MYBP), and Amiiformes (bowfin) in Triassic Period (248 MYBP), whereas some of<br />
the Osteoglossiformes (Arapaima) in Jurassic Period (213 MYBP). It is both scientifically puzzling and<br />
practically important to understand how present environmental conditions of hypoxia and hyperoxia will<br />
affect growth performance, morphological, and behavioral responses in these different species.<br />
Garfish experiment (Methods)<br />
Spotted gar broodstock was maintained at Nicholls <strong>State</strong> <strong>University</strong> aquatic laboratory and following intank<br />
spawning, embryos were kept attached to artificial substrate until hatch. Larvae were over-night<br />
shipped during the adhesive stage to The Ohio <strong>State</strong> <strong>University</strong>. Immediately after the fish arrived in the<br />
laboratory, they were placed into tanks at 20.0 °C with approximately 100% oxygen saturation. Fish were<br />
kept in these conditions for 5 days until they began freely swimming. When fish reached the freeswimming<br />
stage (12 days after hatching), the fish were allocated to 12 tanks consisting of 3 treatments<br />
(hypoxia, normoxia, and hyperoxia) and the experiment began (Fig. 1A).<br />
Fish were fed 3 times daily (9:00, 12:00, and 16:00). For the first 30 days of the experiment, fish were fed<br />
solely with Artemia naupili, and then switched to adult Artemia. On the 64 th day of the experiment the<br />
gar began to be fed with juvenile common carp and fathead minnows. Gars were given live prey fish<br />
twice daily.<br />
The experimental system used (a total volume of 532 L) was semi-recirculating with an exchange rate of<br />
1.5 L/minute. Incoming city water was treated within the laboratory by activated charcoal filters and any<br />
residual chlorine was removed through addition of sodium thiosulfate to the water. The system consisted<br />
of twelve 50 L glass aquaria and a reservoir for heating the water in order to maintain water temperatures<br />
at 22.2 ± 1.1 °C. Each tank received a flow rate of 0.3 L/minute. Water recirculating through the system<br />
ran through a filtration unit (Aquatic Life Support Filtration Unit, Aquanetics System Pak, San Diego,<br />
CA) consisting of biological filter and a filter to remove suspended solids. Photoperiod throughout the<br />
experiment was maintained at 13-h light: 11-h dark.
FINAL REPORTS: INVESTIGATIONS 2009–2011<br />
Oxygen was adjusted in each tank separately by using unique in-tank gas columns (Fig. 1). The column<br />
was a 25.4 cm piece of 5.1 cm diameter PVC piping. The bottom of the column was capped with 0.5 mm<br />
nylon screen, which had a standard air stone at the bottom to inject gas. The gases used to create the three<br />
treatments were nitrogen (hypoxia), air (normoxia), and oxygen (hyperoxia). Bio-barrels (Aquatic<br />
Ecosystems Apopka, FL) with a diameter of 1” were stacked on top of the air-stone to increase the gas<br />
transfer efficiency. At the top of the column, there were holes drilled in the side of the column at the<br />
surface of the water for the water that was being pushed upwards by the gas to be expelled. The water<br />
leaving the column has the intended level of dissolved oxygen concentration of 40%, 90%, and 180%<br />
saturation (Fig. 2).<br />
Sampling and growth measurements<br />
During the first two weeks of the experiment, two fish from each treatment were randomly sampled once<br />
a week for histological analysis. After the first 2 weeks, 3-4 fish per tank were sampled on days 21, 53,<br />
63, 71, 104, and 164. Growth data (Fig. 3) were obtained from the weights and length of formalin<br />
preserved specimens for histological analysis.<br />
Behavioral observation<br />
Gulping frequency was counted in each tank 2h after feeding. When feeding the fish, fish were fed in five<br />
minute intervals to ensure that time since the last meal being fed was equal for each tank. Gulping<br />
frequency was measured by counting the total number of times the fish in a tank would return to the<br />
surface to release gas and inhale atmospheric air.<br />
Histological measurements<br />
All the gill arches from one side of the fish were separated and each divided into 2-3 sections. In each<br />
section, the numbers of filaments were counted and their length measured. Afterwards, a pair of filaments<br />
from the middle of each section was separated and the average number of secondary lamellae per 1<br />
millimeter of the filament length determined. The methods for measuring lamellar surface area were<br />
essentially the same as those used by Satora and Jakubowski (1995) in a subsequent study. Gills were<br />
dehydrated in alcohol, transilluminated in xylene and fixed in Canadian balsam on a microscope slides.<br />
The area of 10 well-separated gill lamellae were measured by means of a light microscope with a CDD<br />
camera connected to a computer supplied with an analytical program: Image J Wayne Rasband National<br />
Inst. of Health, USA. The total surface area GRSA were estimated using methods established by Hughes<br />
(1995), and calculated as follows: GRSA = Lnbl where L is the total length of all gill filaments, n is the<br />
frequency of secondary lamellae on both sides of the filament, and bl is the average bilateral surface area<br />
of the secondary lamellae.<br />
The allometric relation between GRSA and body weight was expressed by the equation Y = aW b , or after<br />
logarithmic transformation by log Y = log a + b log W, where Y is the parameter analyzed, W is the body<br />
mass and log a and log b are parameters of the regression line. After logarithmic transformation data were<br />
analysed using linear regression method in STATISTICA 5.0 program (StatSoft Inc., Tulsa, OK, USA).<br />
We calculated the both parameters of the regression line, Pearson’s coefficient and its statistical<br />
significance.<br />
Histological analysis of pseudobranch and swim bladder (day 573)<br />
Following the first phase of the experiment with exposure to different levels of oxygen saturation (day 1-<br />
73), recovery in normoxia (day 73-173), fish were maintained in “common garden” single tank design<br />
where they could be identified by PIT-tag marking to their original treatment at the early larval/juvenile<br />
stage. Fish were fed live fathead minnows, koi carp, and yellow perch and were subjected to the seasonal<br />
ambient water temperature changes of 5 to 23 o C. For the present studies fish were sacrificed in November<br />
2011, 573 days after hatching. Fish were 20-26 cm in total length.<br />
434
435<br />
FINAL REPORTS: INVESTIGATIONS 2009–2011<br />
Three garfish juveniles were sampled for each treatment group, normoxia, hypoxia or hyperoxia, imposed<br />
during larval/juvenile stage. Fish were euthanized by immersion in the ice slurry to avoid possible effect<br />
of the anesthetic (MS 222). Gills were collected and immersed in either buffered paraformaldehyde<br />
solution (4%), Karnovsky fixative, or formalin solution (10%). Pseudobranch (Fig. 7) was dissected out<br />
and immersed in paraformaldehyde. Gas bladder was dissected out and cut longitudinally in two pieces,<br />
one half was immersed in Karnovsky fixative and the other half in paraformaldehyde. Pseudobranch and<br />
gas bladder samples were embedded in methyl methacrylate (brand name). Two gill arches were<br />
examined in each case.<br />
Longitudinal histological cross sections (3 mm) of pseudobranch were obtained and stained with toluidine<br />
blue (1% alcoholic solution) followed by fuchsin (1% aqueous basic solution) for morphological<br />
observations. Neutral mucins were identified by the periodic acid-Schiff method (PAS). Likewise,<br />
longitudinal and transversal histological cross sections (3 mm) of gas bladder were subjected to the same<br />
staining procedures for morphological and neutral mucins observations.<br />
RESULTS<br />
Sample data from garfish experiment indicate that the range of variation in oxygen saturation had not<br />
overlaped between treatments and remained very consistent throughout the study (Fig. 2). This is critical<br />
to the conclusion regarding the effect of oxygen saturation on growth of fish as some evidence exists that<br />
diurnal oxygen changes may result in compensatory growth rates (Carlson et al. 1980). It was evident that<br />
hypoxic condition did not impact growth performance of spotted garfish juveniles (Fig. 3).<br />
We addressed the question of morphological changes in respiratory organs due to environmental oxygen<br />
saturation and the only evidence was the increase in filament (total) length in both hypoxia and hyperoxia<br />
(Fig. 4). Although a similar trend remained in respect to total respiratory surface area in fish of 173 days<br />
old (following acclimation to normoxia), differences were not significant (Fig. 4E).<br />
The frequency of surfacing events that indicate air-breaths (air release and intake) as a function of oxygen<br />
saturation was very significant (Fig. 5). Hypoxia in the case of actively feeding fish resulted in high<br />
dependence on atmospheric oxygen. An interesting trend was observed following 3 weeks acclimation to<br />
normoxia that suggest the fish used to hyperoxia had a tendency to be more relying on gas bladder.<br />
Morphological changes in swim bladder during early ontogeny of garfish indicate an increase in<br />
complexity of respiratory surfaces (Fig. 6).<br />
Pseudobranch morphology<br />
Pseudobranch are located under the operculum located specifically in the dorsal part of the inside of each<br />
operculum (Kryzanovsky 1934; Fig. 7A). This is the first histological description of this organ in the<br />
literature. The pseudobranch presents a single gill arch containing numerous filaments (primary lamella)<br />
and secondary lamella. The lamella are well vascularized with a capillary network containing<br />
erythrocytes, particularly evident at the tip of lamella. The central cartilaginous tissue is present along the<br />
filament axis (Figure 7A, B and C). The epithelium of pseudobranch filaments is formed by variable (2-5<br />
layers) of pavement cells. However, it is not clear if it can be unequivocally associated with fish<br />
“historical” exposure to normoxia (Fig. 7C) or hypoxia (Fig. 7D). A thin epithelium covering the<br />
secondary lamellae is formed by a single layer of pavement cells, which are lying on a basement<br />
membrane supported by pillar cells. Pseudobranch has chloride cells (rounded nuclei and a prominent<br />
nucleolus) located along the base of the secondary lamellae, surrounded by pavement epithelial cells<br />
(Figure 1D). Mucous cells secreting neutral mucins were identified in pseudobranch. Granulations in the<br />
epithelium of pseudobranch filaments reacted intensely to Periodic acid-Schiff (Fig. 8 A-F). PAS method<br />
detected mucous cells on the surface of the primary and secondary lamella.
FINAL REPORTS: INVESTIGATIONS 2009–2011<br />
Gas bladder morphology<br />
The gas bladder is a large, bilobed structure and fills in the dorsal portion of fish body cavity (Zaccone et<br />
al., 2011). It opens to the alimentary tract through a longitudinal slit on the dorsal side of oesophagous<br />
(Jaroszewska and Dabrowski 2008). The wall of the gas bladder is formed of paired trabeculae (Fig. 9A)<br />
that subdivides the lateral sections of the organ into a sequence of compartments. This wall is formed of<br />
three layers shown in Fig. 9B. The external layer consists in a simple squamous epithelium, middle layer<br />
in a connective tissue, and internal layer in a simple respiratory epithelium which is formed of ciliated and<br />
goblet cells. PAS method detected mucous cells secreting neutral mucins strongly reactive to PAS in<br />
ciliated epithelium of gas bladder (Fig. 10A-D). Parts of the respiratory epithelium are intercalated by<br />
mucous cells (Fig. 10E and F). There were no significant differences observed in swim bladder structures<br />
among fish with different water oxygen saturation conditions in early life history.<br />
BOWFIN EXPERIMENT<br />
Broodstock bowfin were captured from Winous Point Marsh Conservancy, Sandusky, OH on April 26,<br />
2011. All fish were transported to The Ohio <strong>State</strong> <strong>University</strong> where they were treated with hormones.<br />
Fish were injected 3 times with Ovaprim at 0.6 ml/kg in 24 hour intervals. The ovulating females began<br />
releasing eggs to the tank after the 3 rd injection. Fish were then stripped of the remaining eggs and<br />
fertilized using the dry method. Males were not spermiating and therefore sperm was added by<br />
macerating the testes. Embryos were incubated in rectangular tanks at 14°C. The water source used was<br />
city water that was de-chlorinated by use of activated charcoal filters and additionally treated with sodium<br />
thiosulfate (4mg/L) to keep chlorine levels below 0.1 mg/L. Water in the tank was gently aerated.<br />
Embryos began hatching 5 days after fertilization. Eight days after hatching, fish weighing 0.09g were<br />
transferred to 12 aquariums at a density of 30 fish/tank.<br />
The experimental system used was semi-recirculating and consisted of twelve 30 L glass aquaria and a<br />
reservoir for heating the water in order to maintain water temperatures at 20.9 ± 0.1°C. The 12 tanks were<br />
divided into 3 treatments, hypoxia (3.60±0.33 mg O2 /L), normoxia (7.15±0.25 mg O2/L), and hyperoxia<br />
(16.19±0.96 mg O2/L) (Table 1). Dissolved oxygen and temperature were measured twice daily, at 9:00<br />
and 16:00. Fish were kept in these conditions until 52 days post hatch, when they were moved to a single<br />
tank for communal rearing.<br />
Water flow rate was maintained at 0.3 L minute. Water recirculating through the system ran through a<br />
filtration unit (Aquatic Life Support Filtration Unit, Aquanetics System Pak, San Diego, CA), consisting<br />
of biological filter and a filter to remove suspending solids. Photoperiod throughout the experiment was<br />
maintained at 13-h light: 11-h dark. Oxygen was adjusted in each tank separately by using unique in-tank<br />
gas columns described in the previous section on garfish.<br />
Fish were initially fed with Artemia salina nauplii before being weaned to Bio Oregeon’s BioVeta starter<br />
diet and then to BioVeta fry (42% protein, 16% fat). Fish were fed daily at 9:00 and 16:00. From day 44-<br />
52 days post hatch, fish weighing 14.5g ± 1.6 were fed ad libitum 4 times daily to quantify growth and<br />
feed utilization. Prior to being fed all solid fecal matter was removed from the tank by siphoning and<br />
during the last feeding the gas exchange columns were removed and cleaned.<br />
After 52 days post hatch, all fish were communally reared. Fish were transferred to a 400L flow through<br />
tank. All fish were implanted with 9mm PIT-tags using a 12 gauge needle for identification. After<br />
implanting PIT-tags, fish were treated in 50mg/L oxytetracycline for 1 hour to prevent infections.<br />
Sampling and growth measurements<br />
Tank biomass was measurements were taken intermittently. Weight was measured after days 20, 34, 44,<br />
52, 60, and 91 days post hatch. Biomass was measure by removing all fish from the tank and drying them<br />
436
437<br />
FINAL REPORTS: INVESTIGATIONS 2009–2011<br />
slightly with a paper towel before being placed in a bucket of water on a scale. The numbers of fish were<br />
counted before being placed back into the tank to calculate mean weights.<br />
Behavioral observation<br />
Air gulping frequency was counted in each tank 2 hours after feeding. When feeding the fish, fish were<br />
fed in five minute intervals to ensure that time since the last meal being fed was equal for each tank.<br />
Gulping frequency was measured by counting the total number of times the fish in a tank would return to<br />
the surface to release gas and inhale atmospheric air.<br />
PIRARUCU EXPERIMENT<br />
The transition from aquatic to air respiration is of great importance in the evolutionary history of fishes<br />
and occurred multiple times (Graham, 1994; 1997; Perry et al. 2006). If we concentrate on extant fish<br />
species that developed respiration bimodality, (air and water) (Graham 1984 identified over 370 species,<br />
occurring among 125 genera in 49 families) and did not lead to terrestriality, these event can be associated<br />
with changes in atmospheric oxygen tension (15 to 35% over the 500 MYBP). Pirarucu (Arapaima<br />
gigas), an Amazonian fish, exhibits two means of oxygen acquisition, aquatic and air in distinct stages of<br />
its ontogeny (Gonzalez et al. 2010). In young fish (10-100 g), gills structure is similar to those of others<br />
aquatic respiration-dependent fish (Brauner et al. 2004; Da Costa et al. 2006; Ramos 2008). However, an<br />
adult pirarucu (over 1,000 g) become obligate air-breathers (Steven and Holeton, 1978). In teleost fish,<br />
environmental hypoxia or hyperoxia involve the respiratory neuroreceptors response (Jonz and Nurse,<br />
2006), and behavioral and morphological regulations (Herbert and Wells, 2001). However, it is uncertain<br />
if respiratory epithelium (gills and gas bladder) in pirarucu will differ in response to hypoxia or hyperoxia<br />
conditions. Therefore, the objectives of this experiment were to determine the respiratory behavior of<br />
pirarucu juveniles maintained in normoxia, hypoxia or hyperoxia conditions, and to describe how oxygen<br />
stress caused by hypoxia or hyperoxia affects the gill structure.<br />
Experimental procedure<br />
Pirarucu juveniles were shipped from the Amazon (Roraima <strong>State</strong>) to the Aquaculture Center (Sao Paulo<br />
<strong>State</strong> <strong>University</strong>). Up to ten fish were kept in three 100 L-tanks with continuously flowing water and<br />
constant aeration (5.3±0.2 mg L –1 of dissolved oxygen) during two weeks of acclimation. Temperature<br />
was maintained at 29.4±0.4 °C using thermostats. The juveniles were fed ad libitum with extruded<br />
commercial diet for carnivorous fish twice a day (450 g Kg –1 crude protein).<br />
Twenty four juveniles (17.3±5.7 g wet weight and 15.0±1.7 cm total length) were distributed to eight 50<br />
L-tanks and two different environmental conditions were established: hypoxia and hyperoxia. Four<br />
replicates for each condition were used. Hypoxia and hyperoxia conditions were obtained by injecting<br />
either nitrogen or oxygen. One air pump was placed in each tank to ensure uniform gas distribution in the<br />
water. Dissolved oxygen concentration was monitored every hour for 18 hours, and its concentration was<br />
maintained at 1.3±0.1 mg L –1 (17% O2 saturation) in hypoxia tanks and at 17.9±0.6 mg L –1 (240% O2<br />
saturation) in hyperoxia tanks. Behavioral observations included the frequency of air-gulping. The<br />
number of air gulps at the surface was monitored during normoxia, before the onset of hypoxia/hyperoxia<br />
exposure. Four juveniles were randomly observed for three minutes over an hour at intervals of 15<br />
minutes. After hypoxia or hyperoxia exposure, one fish per tank was observed, filmed with a digital<br />
camera, and the number of times that fish took air at the water surface was recorded. Monitoring took<br />
place at the time when fish were transferred to hypoxia/hyperoxia tanks and after 1, 2, 4, 6, 8 and 18<br />
hours of exposure. Observations lasted 3 minutes in all periods. After 18 hours, gas injection was<br />
discontinued and normoxia conditions were restored with aeration.
FINAL REPORTS: INVESTIGATIONS 2009–2011<br />
Three juveniles were sampled for histological analyses before hypoxia or hyperoxia exposure. Then, one<br />
juvenile per tank was sampled at 8 and 18 hours of hypoxia or hyperoxia exposure. Fish were sampled<br />
again 6 hours after the restoration of normoxia. The juveniles were anesthetized with benzocaine solution<br />
(0.1 g L -1 Histological analyses<br />
) and euthanized by immersion in the ice slurry. Gills and gas bladder were dissected and fixed<br />
in 4% buffered paraformaldehyde solution. Samples were embedded in Historesin® (Leica, Germany).<br />
Longitudinal histological cross section (3 µm) of gills were cut and stained with 1% alcoholic toluidine<br />
blue followed by 1% aqueous basic fuchsin for morphological and morphometric observations. Neutral<br />
mucins were identified by the periodic acid-Schiff method (PAS). Acid mucins were identified by Alcian<br />
blue pH 2.5 staining technique. Lamella total height (LTH), lamella potential functional height (LPFH),<br />
filament epithelium thickness (TEF), lamella epithelium thickness (TEL), interlamellar distance (ID) and<br />
lamella width in basal portion (LW) were measured in 20 lamellae per fish in discontinuous views, using<br />
an image analysis system (Leica IM50, Germany). Morphometric analysis of gills was based on previous<br />
study with pirarucu (Ramos 2008).<br />
Statistical Analysis<br />
The variables were analyzed by two multivariate statistical methods: hierarchical cluster analysis and<br />
non-hierarchical and principal components. Analyses were performed using the software Statistica 7.0. To<br />
reduce errors due to scales and units of the selected variables, the data were standardized with 0 mean and<br />
variance 1. The hierarchical cluster analysis was performed by calculating the Euclidean distance by the<br />
method of Ward connection, for all sets of variables (Ward 1963). After identifying the groups formed,<br />
analysis was performed by the non-hierarchical or K-means procedures. The principal component<br />
analysis allowed for identification of the separation and the interrelationship between the original<br />
variables.<br />
RESULTS<br />
Air breathing behavior<br />
In normoxia condition, all fish observed rose once to the water surface for air breathing during the three<br />
minutes of monitoring. As soon as the juveniles were transferred to hypoxia and hyperoxia tanks, their air<br />
ventilation decreased (Fig. 14). Later, fish maintained in hyperoxia condition showed air ventilation<br />
frequency similar to normoxia. In general, hypoxia increased air gulping frequency in juvenile piraruku.<br />
Gills morphology<br />
In normoxic condition, before the onset of hypoxia and hyperoxia test, juvenile pirarucu showed gill<br />
filaments well vascularized and the numerous secondary lamellae, which constitute the active<br />
respiratory/excretory membrane. Gill filaments have afferent and efferent arterioles, and a central<br />
capillary network filled with erythrocytes (Fig. 15A). A central cartilaginous tissue supports the gill<br />
filaments. The epithelium of gill filaments is formed mainly by pavement cells, although this epithelium<br />
is also rich in chloride cells. Chloride cells (ionocytes) are located along the base of the secondary<br />
lamellae, surrounded by pavement epithelial cells (Fig. 16B). Large PAS negative areas were observed in<br />
histological sections of the gills (Fig. 16A). A few cells that produce neutral mucins were identified at the<br />
distal ends of the lamella.<br />
During hypoxia exposure, an increase of chloride cells size was observed in the secondary lamellae of<br />
piraruku juveniles’ gills (Fig. 17A and B). In addition, pavement cells, more turgid and irregular in shape,<br />
were observed covering the secondary lamellae in fish maintained in hypoxia condition. Granulations in<br />
the epithelium of gill filaments reacted intensely to Periodic acid-Schiff. A layer of mucous, PAS<br />
positive, cells were detected covering lamellae surface (Fig. 17B). Some mucous cells also constituted<br />
filament epithelium, mainly at the distal end (Fig. 17C). When normoxia was restored, a decrease of<br />
chloride cells numbers and recovery in size and shape of pavement cells was observed (Fig. 17C). Large<br />
438
439<br />
FINAL REPORTS: INVESTIGATIONS 2009–2011<br />
lamellar areas of PAS negative cells were seen in longitudinal sections of gills (Fig. 17D). Few mucous<br />
cells reactive to PAS staining were located in filament epithelium.<br />
Discreet morphological changes were observed in the secondary lamellae of fish gills during exposure to<br />
hyperoxia and after the reestablishment of normoxia (Fig.18A-C). The gills of fish maintained in these<br />
conditions showed lamellae rich in chloride cells, characterized by large cells with rounded nuclei and<br />
prominent nucleolus. A thin epithelium covering the secondary lamellae is formed by a single layer of<br />
pavement cells which are lying on a basement membrane supported by pillar cells. PAS method detected<br />
mucus on the surface of secondary lamella and few mucous cells were located at filaments and lamellae<br />
epithelium, primarily in distal portion of the gill filaments (Fig. 18C).<br />
Gills morphometry<br />
The morphometric results of gill elements are shown in Table 1. These data have shown that piraruku<br />
exposed to hypoxia during 8 or 18 hours displayed a decrease of total height (LTH) and lamella potential<br />
functional height (LPFH), while epithelium lamella thickness (TEL) and lamella width at the basal<br />
portion (LW) have increased. Six hours after normoxia restoration, these gill elements recovered and<br />
showed characteristic of normoxic condition. Morphometry of gill elements were unchanged in<br />
hyperoxia.<br />
Table 1. Table 1. Morphometric analyses of piraruku gills at normoxia, and following 8 or 18 hours<br />
exposure to hypoxia or hyperoxia conditions. Values represent the means of 20 measurements per fish.<br />
Measurements<br />
(µm)<br />
Normoxia<br />
Hypoxia Hyperoxia<br />
8 18 Recovery 8 18 Recovery<br />
LTH 87.3 52.4 60.1 83.2 75.7 73.2 90.8<br />
LPFH 60.84 36.4 44.3 64.1 58.8 55.2 72.0<br />
TEF 27.0 6.4 17.78 21.2 16.5 18.7 21.1<br />
TEL 4.4 13.8 7.1 4.3 4.6 4.6 4.9<br />
ID 29.3 36.0 29.8 31.7 34.4 31.2 38.2<br />
LW 32.1 31.8 34.2 28.2 28.7 31.8 28.1<br />
Lamella total height (LTH), lamella potential function height (LPFH), epithelium filament thickness<br />
(TEF), epithelium lamella thickness (TEL), interlamellar distance (ID) and lamella width in basal portion<br />
(LW).<br />
The hierarchical cluster analysis classified the data as homogeneous groups. This is represented by a<br />
cluster analysis obtained for standardized data matrices. Thus, it was possible to observe the formation of<br />
two groups: group 1 (hypoxia and hypoxia at 8 and 18h) and group 2 (normoxia, hypoxia-normoxia,<br />
hyperoxia 8h, hyperoxia 18h and hyperoxia-normoxia).<br />
Cluster analysis showed a significant separation between experimental treatments where in group 1, fish<br />
from treatments of 8 and 18h hypoxia were grouped. Group 2 was the remaining treatments: normoxia,<br />
hypoxia-normoxia, hyperoxia 8h, hyperoxia 18h and hyperoxia-normoxia, as well as which hypoxianormoxia,<br />
and recovery from the hypoxia to normoxia condition of low dissolved oxygen in water for the<br />
normal condition (Fig. 19).<br />
According hierarchical cluster analysis method K-means, group 1 had lower values and higher LTH and<br />
LPFH TEL and LW. Group 2 presented inverse values, relative to group 1 for variables LTH, LPFH, TEL<br />
and LW (Fig. 20). The principal component analysis produced three significant eigenvalues greater than<br />
one and was considered in the analysis: the largest eigenvalue are 3.77 (component greater retention of
FINAL REPORTS: INVESTIGATIONS 2009–2011<br />
original variability), 2.59 and 1.00. The three main components together explained more than 90% of the<br />
total variance of the data.<br />
The graphical representation and correlation of variables in principal component variables that<br />
characterize the more discriminating in the formation of groups 1 and 2 (Fig. 21). In principal component<br />
1 (PC1) the variables LTH and LPFH are located on the left, showing a negative correlation with respect<br />
to TEL and LW variables, which are located on the right and show a positive correlation between them<br />
and inverse variables LTH and LPFH. We may assume that the variables TEL and LW are the most<br />
discriminate characters of group 1 (CP1 highest correlation with the above 0.7 which in turn is the most<br />
retains information of the original variables, 47.06%). The other major components showed 32.43% and<br />
12.53% for CP2 and CP3, respectively. At CP2 the variable TEF had a positive value, however negative<br />
correlation to the variables of weight and length. CP3 in the determining variable was the ID.<br />
DISCUSSION<br />
Spotted gar and bowfin are facultative air-breathers (Farmer and Jackson 1998; Jaroszewska and<br />
Dabrowski 2009). For this reason, it is possible to use either of these species in order to address questions<br />
concerning different oxygen conditions (hypoxia, hyperoxia) in the environment, examining adaptation of<br />
the gas bladder and gills to effectively exchange gas, and determine the most energetically efficient means<br />
of respiratory activity along with associated cost/benefit of each mode of breathing.<br />
In normally aerated water, at 20 0 C, gar accounted for 42% of their oxygen metabolism from their gas<br />
bladder. Aerial ventilation increased 1150% and was accompanied by an elevation of pulmonary<br />
perfusion in hypoxia. It has been shown that gar actually excrete oxygen from their gills in hypoxic water.<br />
When severe levels of hypoxia were tested gills were determined to be ineffective as oxygen uptake<br />
organs (Burleson et al., 1998). In the experiment with exhaustive swimming activity in hypoxic condition<br />
it was determined that the gas bladder takes over the primary role as the air-breathing organ in supporting<br />
active metabolism and recovery. Having a gas bladder that can fully support the metabolic scope<br />
(Jaroszewska et al. 2010), gar can maintain activity under hypoxic condition that would incapacitate<br />
virtually every other temperate climate fish that relies solely on aquatic respiration (Burleson at al., 1998).<br />
In Amia exposed to temperatures below 10 o C air breathing becomes negligible, whereas at 32.4 o C, 20-30<br />
breaths per hour were recorded (Horn and Riggs, 1973). At 20 o C, gills contribute to approximately 65%<br />
of the total oxygen uptake, but at 30 o C, bowfin becomes an obligate air breather with diminished gill<br />
ventilation and aerial breathing satisfies over 70% of oxygen demand (Johansen et al., 1970). Furthermore,<br />
aquatic hypoxia significantly increases air breathing frequency from 4.7 to 9.7 breaths per hour at 20-<br />
22oC (Hendrick and Jones, 1993). These values are much lower than air-breathing frequency obtained in<br />
the current studies in normoxic and hypoxic conditions (Fig. 13). However, the reason for 5-10 fold<br />
higher air-breathing frequency in juvenile bowfin in the current studies could have been longer<br />
acclimation time to higher water temperatures, fish size as well as postprandial effect. We also added an<br />
important aspect to bowfin physiology that is there was no increase in dependence on air-breathing at<br />
chronic hypoxia conditions (10 weeks).<br />
Pirarucu as adults is an obligate air-breathing teleost (Stevens and Holeton, 1978). Adult pirarucus of 2-3<br />
kg ventilate their gills 16-24 times per minute and replaces air in their lung every 1-2 min (Stevens and<br />
Holeton, 1978). It was evident in the present experiment that juveniles rely much more on gill respiration<br />
than air-breathing (see Table 1). In adult fish about 75% of their oxygen consumption comes from air and<br />
63% of carbon dioxide is excreted via gills. Brauner et al. (2004) and Gonzalez et al. (2010) analyzed gill<br />
structure in pirarucu in the size range of 10-1,000 g and concluded that the secondary lamellae respiratory<br />
surface disappear between 67 and 110 g body weight. However, in none of the studies was the respiratory<br />
gas bladder examined during the transition from water to air breathing. Furthermore, the effect of<br />
440
441<br />
FINAL REPORTS: INVESTIGATIONS 2009–2011<br />
environmental conditions (oxygen saturation) on the morphological changes and related growth rate<br />
(scope for metabolism and activity) was not analyzed in pirarucu ontogeny. Impact of this ontogenetic<br />
change from “aquatic” to “terrestrial” respiration mode is critical to aquaculture production capacity and<br />
fish growth rate.<br />
Therefore, we conclude that bowfin when maintained at water temperatures of 26-30 o C would be an ideal<br />
surrogate species for pirarucu in order to study responses of respiratory tissues to changes in<br />
environmental conditions. To develop a model species for generalization of physiological responses is<br />
certainly a challenging task. However, some aspects of fish response to variable oxygen levels such as<br />
respiratory organs morphology and particularly respiratory neuroepithelial cells responses are similar in<br />
teleosts and mammals (see reviews by Jonz and Nurse 2006; Jaroszewska and Dabrowski 2010). No<br />
studies were performed to our knowledge on the ontogenetic changes in gill and gas bladder morphology<br />
in this species despite extensive research done by evolutionary morphologists and embryologists in the<br />
1900s (Ballard, 1984).<br />
CONCLUSIONS<br />
Two temperate fish species, gar and bowfin, showed that gas bladder respiration, manifested by increased<br />
rate of air breathing, provides sufficient amount of oxygen resulting in uncompromised growth in hypoxic<br />
conditions. Morphological changes in the gills, pseudobranch, and swim bladder during early life history<br />
demonstrated enormous plasticity of the species and capacity to acclimation to variable conditions.<br />
Importantly, air-breathers are important for aquaculture (Mexico) or have a potential to be cultured for<br />
caviar (bowfin).<br />
We observed substantial changes in pirarucu juveniles gill morphology due to short term imposed<br />
hypoxia. These changes included presence of multiple layers of interlamellar epithelium and expeditious<br />
return to a single layer of pavement, mucus and chloride cells following recovery in normoxia.<br />
All species represent great opportunity for aquaculture because of their unique resistance to variable<br />
oxygen conditions, fast growth, and high consumer demand. Our observations and findings are also<br />
important in the larger context of climate change along with increasing draught frequency and severity in<br />
the tropics (Amazon) and temperate zone. The warming trends will impact fish diversity and although it<br />
may prove advantageous to culture of these species, the effects on air-breathing fish populations are hard<br />
to predict.<br />
REFERENCES<br />
Burleson, M.L., Shipman, B.N., Smatresk, N.J., 1998: Ventilation and acid-base recovery following<br />
exhausting activity in an air-breathing fish. J. Exp. Biol. 201: 1359-1368.<br />
Brauner, C.J., Matey, V., Wilson, J.M., Bernier, N.J. Val, A.L. 2004: Transition in organ function during<br />
the evolution of air-breathing: insights from Arapaima gigas, an obligate air-breathing teleost from<br />
the Amazon. J.exp.Biol., 207: 1433-1438.<br />
Farmer, C.G., Jackson D.C., 1998. Air-breathing during activity in the fishes Amia calva and Lepisosteus<br />
oculatus. J. Exp. Biol., 201, 943-948.<br />
Gonzalez, R.J., Brauner, C.J., Wang, Y.X., Richards, J.G., Patrick, M.L., Xi, W., Matey, V., Val, A.L.,<br />
2010: Impact of ontogenetic changes in branchial morphology on gill function in Arapaima gigas.<br />
Physiol.Biochem.Zool., 83: 322-332.<br />
Graham, J.B., 1997: Air-Breathing Fishes, Evolution, Diversity and Adaptation, Academic Press, San<br />
Diego, California; pp. 299<br />
Hendrick, M.S., Jones, D.R., 1993: The effects of altered aquatic and aerial respiratory gas concentrations<br />
on air-breathing patterns in a primitive fish (Amia calva). J. exp.Biol., 181: 81-94.
FINAL REPORTS: INVESTIGATIONS 2009–2011<br />
Horn, M.H., Riggs, C.D., 1973: Effect of temperature and light on the rate of air breathing of the bowfin,<br />
Amia calva. Copeia 1973: 653-657.<br />
Jaroszewska, M., Dabrowski, K., 2008: Morphological analysis of the functional design of the connection<br />
between alimentary tract and the gas bladder in air-breathing lepisosteid fish. Ann. Anat. –<br />
Anatomisher Anzeiger, 190: 383-390.<br />
Jaroszewska M. and Dabrowski, K., 2009: Early ontogeny of Semionotiformes and Amiiformes<br />
(Neopterygii: Actinopterygii). In: Development of Non-Teleost Fish, Y.W. Kunz, C.A. Luer, B.G.<br />
Kapoor [Eds.], Science Publishers Inc. pp. 231-275.<br />
Jaroszewska, M., Dabrowski, K., Rodríguez, G., 2010. Development of testis and digestive tract in<br />
longnose gar (Lepisosteus osseus) at the onset of exogenous feeding of larvae and in juveniles.<br />
Aquaculture Research 41: 1486-1497.<br />
Jaroszewska, M., Dabrowski, K. 2010b. Does a fish with lungs exists? Morphological and physiological<br />
adaptations to aquatic hypoxia and hyperoxia. Kosmos 59: 479-496.<br />
Johansen, K., Hanson, D., Lenfant, C. 1970: Respiration in a prmitive air breater, Amia calva. Respiration<br />
Physiol. 9: 162-174.<br />
Jonz, M.G., Nurse, C.A. 2006. Ontogenesis of oxygen chemoreception in aquatic vertebrates.<br />
Resp.Physiol.Neurobiol. 154: 139-152.<br />
Kryzanovsky S. 1934. Die Pseudobranchie. Zoologischer Anz. 58:171- 238.<br />
Perry, S.F., Wilson, R.J.A., Straus, C., Harris, M.B., Remmers, J.E., 2001. Which came first, the lung or<br />
the breath? Comp. Biochem. Physiol. A 129, 37-47.<br />
Potter, G.E., 1927. Respiratory function of the swim bladder in Lepidosteus. J. Exp. Zool. 49, 45-67.<br />
Rahn, H., Rahn, K.B., Howell, B.J., Gans, C., Tenney, S.M., 1971. Air breathing of the garfish<br />
(Lepisosteus osseus). Resp. Physiol. 11, 285-307.<br />
Satora, L., Jakubowski, M. 1995. Morphometry of the gill respiratory area in the perch, Perca fluviatilis.<br />
Acta Biologica Cracoviensia, Zoologica 37: 11-16.<br />
Satora, L., 1998: Histological and ultrastructural study of the stomach of the air-breathing Ancistrus<br />
multispinnis (Siluriformes, Teleostei). 1998: Canadian J. Zoology 76: 83-86.<br />
Satora, L., Wegner, N.C. 2011. Reexamination of the Byczkowska-Smyk gill surface area data for<br />
European teleosts, with new measurements on the pikeperch, Sander lucioperca. Rev. Fish Biol.<br />
Fisheries 22: 1-9.<br />
Stevens, E.D. and Holeton, G.F., 1978: The partitioning of oxygen uptake from air and from waterby the<br />
large obligate air-breathing teleost pirarucu (Arapaima gigas). Can.J.Zool. 56: 974-976.<br />
Ward, J.H. 1963. Hierarchical grouping to optimize an objective function. Journal of the American<br />
Statistical Association, 58: 236-244<br />
Zaccone, D., Sengar, M., Lauriano, E.R., Pergolizzi, S., Macri, F., Salpietro, L., Favaloro, A., Satora, L.,<br />
Dabrowski, K., Zaccone, G., 2011. Morphology and innervations of the teleost physostome swim<br />
bladders and their functional evolution in non-teleostean lineages. Acta. Histochem. 113: 578-584.<br />
Acknowledments<br />
Studies on garfish and bowfin were in part supported by the grant from Polish Ministry of Science and<br />
Higher Education, No. N-N303-321437 (Warsaw, Poland).<br />
442
FINAL REPORTS: INVESTIGATIONS 2009–2011<br />
FIGURES<br />
Fig. 1 Picture of the experimental system used during gar and bowfin<br />
experiments. Each of the 12 aquariums were equipped with gas-exchange columns<br />
to manipulate oxygen level.<br />
443
FINAL REPORTS: INVESTIGATIONS 2009–2011<br />
Fig. 2 The daily averages of dissolved oxygen ± standard deviation over the 73 days<br />
of oxygen manipulation during the gar experiments. Temperature daily averages ±<br />
standard deviations are reported with triangles.<br />
Fig. 3 The growth of the gar throughout both hypoxia and normoxia phases of the<br />
experiment. Upper lines represent growth represented in length ± standard deviation,<br />
and bottom lines is weight.<br />
444
FINAL REPORTS: INVESTIGATIONS 2009–2011<br />
Fig. 4 Mean ± Standard Deviation (n=4). Significance tested using One-way ANOVA Tukey-<br />
Kramer method. Graphs A and B are from fish sampled on day 73 of the experiment and<br />
graphs C-E are from day 173. F) Schematic drawing to delineate the procedure for measuring<br />
gill structure elements.<br />
445<br />
F
FINAL REPORTS: INVESTIGATIONS 2009–2011<br />
Fig. 5 Mean number of aerial breaths ± standard deviation. Aerial breaths were counted 2 hours after fish<br />
were fed. Significance was tested with a One-way ANOVA using a Tukey-Kramer method.<br />
446
FINAL REPORTS: INVESTIGATIONS 2009–2011<br />
A B<br />
C<br />
D<br />
Fig 6. A) Posterior part of swim bladder in garfish 22.3 mm (normoxia, day 7). Note numerous<br />
capillaries, particularly on the surface of the ventral part and lack of compartmentalization. B) Fish<br />
(23.7 mm, hyperoxia, day 8) with initiation of compartment folds. Striated muscle fibers are present<br />
in fold edges. C) Fish (38.8 mm, hypoxia, day 20) with the first compartmental trabecula (sensu<br />
Potter, 1927) at the tip of posterior part of swim bladder. D) Fish (73 mm, normoxia, day 68) with<br />
extensive compartmentalization (swim bladder collapsed during processing). E) Fish (190 mm,<br />
normoxia, day 373) with surface of swim bladder folding containing numerous alveolar cells.<br />
447<br />
E
FINAL REPORTS: INVESTIGATIONS 2009–2011<br />
Fig. 7 A) Kryzanovsky S. 1934. Die Pseudobranchie. Zoologischer Anz. 58:171- 238.<br />
Longitudinal sections through pseudobranch of spotted gar. Staining method: toluidine blue and<br />
basic fuchsin. (B, C, & D) Pseudobranch of fish exposed to normoxia - individual of 20.4 cm;<br />
Primary lamellae (filaments) of pseudobranch arch (arrows). Secondary lamellae (white<br />
arrows). Erythrocytes within the main blood vessel (asterisks). The lamella displays a central<br />
capillary network and erythrocytes (double dagger) within capillary lumen. The pseudobranch<br />
filaments are supported by cartilaginous tissue (white arrow heads). (E) Pseudobranch of fish<br />
exposed to hypoxia - individual of 21.3 cm; Chloride cells (arrowheads) are usually located<br />
along the bases of the secondary lamellae and show rounded nuclei and a prominent nucleolus.<br />
Pillar cells (white asterisks). The secondary lamella epithelium is constituted by pavement cells<br />
(dagger).<br />
448
FINAL REPORTS: INVESTIGATIONS 2009–2011<br />
Fig. 8 Histological sections of the pseudobranch of spotted gar (L. oculatus) stained with<br />
periodic acid-Schiff (PAS). (A and B) Pseudobranch of fish exposed to normoxia -<br />
individual of 23 cm. (C and D) Pseudobranch of fish exposed to normoxia – individual of<br />
20.4 cm. Note mucous cells strongly reactive to PAS in filament epithelium (arrows);<br />
Granulations PAS+ (asterisks); Mucous covering gill surface (arrowheads).<br />
449
FINAL REPORTS: INVESTIGATIONS 2009–2011<br />
Fig. 9 Histological sections of the pseudobranch of spotted gar (L. oculatus) stained with<br />
periodic acid-Schiff (PAS). (A, B and C) Pseudobranch of fish exposed to hypoxia -<br />
individual of 21.5 cm. (D, E and F) Pseudobranch of fish exposed to hypoxia - individual of<br />
21.3 cm. Note mucous cells strongly reactive to PAS in filament epithelium (arrows);<br />
Granulations PAS+ (asterisks); Mucous covering gill surface (arrowheads)<br />
450
FINAL REPORTS: INVESTIGATIONS 2009–2011<br />
Fig 10. Transversal section through gas bladder of spotted gar juveniles (20-26 cm) Staining<br />
method: toluidine blue and basic fuchsin. (A) Trabecular structure. (B) External layer of<br />
simple squamous epithelium (SE), middle layer of connective tissue (CT) and internal layer<br />
of simple respiratory epithelium (RE).<br />
451
FINAL REPORTS: INVESTIGATIONS 2009–2011<br />
Fig 11. Histological sections of gas bladder of L. oculatus.stained with periodic acid-Schiff<br />
(PAS). (A and B) Gas bladder of fish exposed to normoxia - individuals of 26 cm and 23 cm,<br />
respectively. (C and D) Gas bladder of fish exposed to hyperoxia during early life stages-<br />
individuals of 23.2 cm and 20 cm, respectively. Gas bladder of fish exposed to hypoxia -<br />
individual of 21.5 cm and 21.3 cm, respectively. Note mucous cells strongly reactive to PAS in<br />
ciliated epithelium (arrows); Mucous cells intercalated the epithelium (arrowheads).<br />
452
FINAL REPORTS: INVESTIGATIONS 2009–2011<br />
Fig. 12 Comparison of the growth of two morphs of bowfin over100 days. All fish were reared in<br />
normoxia throughout the experiment. Growth is expressed as mean weight ± standard deviation.<br />
Fig 13. Mean gulp per fish (n=4) ± standard deviation of bowfin during experiment. Gulping<br />
was counted 2 hours after feeding for 5 minutes in each tank.<br />
453
FINAL REPORTS: INVESTIGATIONS 2009–2011<br />
Fig. 14 Number of times that fish return to the surface to for aerial breathing. Data points represent<br />
the means (n=4). One fish for each tank was observed for three minutes and number of aerial<br />
breathings counted.<br />
454
FINAL REPORTS: INVESTIGATIONS 2009–2011<br />
Fig. 15 Transverse sections through gill filaments (or primary lamellae) of Arapaima gigas juveniles<br />
before the onset of hypoxia or hyperoxia exposure. Staining method: toluidine blue and basic fuchsin.<br />
(A) The arrowheads point to secondary lamellae. Erythrocytes are present in the afferent arterial<br />
vessels (asterisks) and in the capillaries (double dagger). (B) Stratified epithelium covers the primary<br />
lamella. This epithelium is continuous and rich in chloride cells (black arrow) which show round<br />
nuclei and a prominent nucleolus. The secondary lamella epithelium is constituted by pavement cells<br />
(dagger). This lamella displays a central capillary network and erythrocytes (double dagger) within<br />
capillary lumen. White arrow indicates the cartilaginous skeleton, which supports the primary lamella.<br />
455
FINAL REPORTS: INVESTIGATIONS 2009–2011<br />
Fig. 16 Histological sections of the lamellar region of Arapaima gigas juvenile gills stained with periodic<br />
acid-Schiff (PAS). Fish maintained in normoxia, before the onset of hypoxia or hyperoxia exposure (A).<br />
Fish exposed to hypoxia conditions for 8 hours (B), 18 hours (C) and restoration of normoxia for 6 hours<br />
(D). Fish exposed to hyperoxia conditions for 8 hours (E) and restoration of normoxia for 6 hours (F).<br />
Large areas absent in granulations and few mucous cells PAS+ were observed in gill filaments of fish<br />
maintained in normoxia condition, including after hypoxia and hyperoxia exposure. Granulations PAS+<br />
located at filament epithelium and a layer of mucous covering gill surface were noted in fish submitted to<br />
hypoxia condition. Mucous cells were identified, mainly at distal ends of the filaments (dotted arrow).<br />
Note mucous cells strongly reactive to PAS in filament epithelium (arrows). Granulations PAS+<br />
(asterisks). Mucous covering gill surface (arrowheads).<br />
456
FINAL REPORTS: INVESTIGATIONS 2009–2011<br />
Fig. 17 Histological sections of the lamellar region of Arapaima gigas juvenile gills stained<br />
with toluidine blue and basic fuchsin. Fish exposed to hypoxia conditions for 8 hours (A), 18<br />
hours (B) and restoration of normoxia for 6 hours (C). See increased size of chloride cells and<br />
pavement cells more turgid during hypoxia; after restoration of normoxia, note reduction of<br />
them. Blood vessel (asterisks). Central capillary network (double daggers). Pillar cells<br />
(arrowheads). Pavement cells, which constitute the respiratory epithelium (daggers). Chloride<br />
cells, with rounded nuclei showing a prominent nucleolus (black arrows). Cartilaginous tissue,<br />
which supports the primary lamella (white arrows). Epithelium covering the distal ends of<br />
primary lamella (dotted arrow).<br />
457
FINAL REPORTS: INVESTIGATIONS 2009–2011<br />
Fig. 18 Histological sections of the lamellar region of Arapaima gigas juvenile gills stained with<br />
toluidine blue and basic fuchsin. Fish exposed to hyperoxia conditions for 8 hours (A), 18 hours (B)<br />
and restoration of normoxia for 6 hours (C). Discreet morphological change was observed in the<br />
secondary lamellae of fish gills during exposure to hyperoxia and after the reestablishment of<br />
normoxia. Note lamellar epithelium rich in chloride cells (black arrows). Blood vessel (asterisks).<br />
Central capillary network (double daggers). Pillar cells (arrowheads). Epithelium pavement cells<br />
(daggers). Cartilaginous tissue supporting the primary lamella (white arrows). Epithelium covering the<br />
distal ends of primary lamella (dotted arrow). 458
FINAL REPORTS: INVESTIGATIONS 2009–2011<br />
Fig. 19 Dendrogram showing the group structure for the seven variables.<br />
Fig. 20 Grouping by the non-hierarchical or k-means, showing the variables in both<br />
groups.<br />
459
FINAL REPORTS: INVESTIGATIONS 2009–2011<br />
Fig. 21 Distribution of three major components found. Eigenvalues of the principal<br />
components: PC1 (47.06%), CP2 (32.43%) and CP3 (12.53%).<br />
460
461<br />
FINAL REPORTS: INVESTIGATIONS 2009–2011<br />
Nile Tilapia Broodstock Selection, Seed Quality and Density-Dependent<br />
Growth in the Philippines<br />
Quality Seedstock Development/Experiment/09QSD01NC<br />
Emmanuel Vera Cruz and Remedios B. Bolivar<br />
Central Luzon <strong>State</strong> <strong>University</strong><br />
Science City of Muñoz, Nueva Ecija, Philippines<br />
Russell J. Borski<br />
North Carolina <strong>State</strong> <strong>University</strong><br />
Raleigh, North Carolina, USA<br />
ABSTRACT<br />
To support the growing tilapia industry, there is a need to provide year-round, high-quality seed that can<br />
be widely distributed at reasonable costs to tilapia farmers. This can be achieved through better<br />
broodstock quality, increased hatchery development and enhanced technologies for consistently highquality<br />
seed and fingerling production. Through a series of four studies we assessed if physiological<br />
and/or behavioral responses to stress can be used in the selection of broodstock with reproductive<br />
advantage in Nile tilapia, examined the effect of broodstock social condition on seed production and<br />
fingerling growout performance of tilapia, and evaluated the effects of stocking density on fingerling<br />
growth, gene expression of insulin-like growth factor-1 (IGF-1), and stress responsiveness in nursery<br />
hapas. In the first study, we investigated whether the outcomes of competition for social dominance<br />
among Nile tilapia individuals can be predicted by evaluating the duration of appetite inhibition (DAI) or<br />
the feeding response score (FRS) after transfer to isolation. Seventeen fish (70.93%) of the 24 that<br />
became dominant have shorter DAI compared to that of their conspecifics (Binomial test, P = 0.03). This<br />
indicated that social dominance can be predicted using the DAI of the fish during isolation. Reduced<br />
growth rate of both dominant and subordinate fish, a well-described physiological end result of social<br />
stress, was observed one day after the social interaction. The significantly greater weight loss (P < 0.01)<br />
in subordinate fish (2.88 ± 0.21 g) compared to dominant fish (2.11 ± 0.19 g) a day after the<br />
establishment of social hierarchy was mainly attributed to behavioral differences such as appetite rather<br />
than to differences in physical activities. The second phase of this study was similar to the first except we<br />
evaluated FRS over a 10-day isolation period as a predictor of social status. Tilapia with higher FRS<br />
during the isolation had a higher probability to win the fight for social dominance, indicating dominance<br />
can be predicted using the FRS of the fish during isolation, provided that FRS values are not too close to<br />
each other. The dominant fish had substantially improved growth that was accompanied by higher<br />
expression of hepatic IGF-1 mRNA, a proxy of growth rate (P < 0.05). Based on this research, feeding<br />
responses of broodstock in isolation are good predictors of social status, such that individuals with low<br />
stress responsiveness (higher FRS or lower DAI) are likely to be dominant individuals that can can be<br />
selected for as broodstock. In a second study, we assessed the effect of broodfish behavioral stress<br />
response on seed production of tilapia through evaluation of their FRS during isolation. Social groups of<br />
broodstock representing low stress response (LSR) breeders predicted to be dominant individuals based<br />
on elevated FSR during initial period of isolation, or high stress response (HSR) breeders predicted to be<br />
subordinate individuals based on low FRS, and their combination were bred in hapas installed in<br />
ponds. The greatest number of eggs, largest egg size, highest sperm motility and sperm density, and most<br />
number of fingerlings produced were collected in treatments that had both LSR male and female breeders<br />
in the group. Higher rates of hatching and survival were also reflected in treatments that had either a LSR<br />
male or female in the group. The poorest values of seed quality and quantity were found in breeding<br />
groups that contain HSR males and females. These results indicate that stress responsiveness of
FINAL REPORTS: INVESTIGATIONS 2009–2011<br />
broodstock is a good predictor of fecundity and can be used to select fish with higher seed production.<br />
Use of feeding responses during an initial period of isolation can be used by hatchery operators and<br />
farmers to select broodstock individuals that produce higher quality and quantity of tilapia seed.<br />
In a third, study we evaluated if fingerlings derived from LSR might have improved growth performance<br />
relative to fingerlings produced from HSR broodstock during a 3-month pond growout. Sex-reversed<br />
fingerlings derived from LSR breeders, had a higher average body weight, a better feed conversion ratio,<br />
and an overall higher yield per hectare than fingerlings derived from HSR breeders. There were no<br />
differences in survival among the two groups. The results suggests that fingerlings derived from LSR<br />
broodstock pose an advantage over those produced from HSR broodstock in overall production<br />
performance. This would likely be further amplified were fish growout extended to 4 or 5 months.<br />
An additional study investigated the effect of stocking density on the growth, hepatic IGF-I, and stress<br />
responsiveness of fingerling tilapia reared in nursery hapas for 30 days. The overall effect of density as a<br />
stressor showed that low density, sex-reversed fish (250 fish/m 3 ) responded well in terms of growth,<br />
specific growth rate, survival, hematological profile (elevated red blood and white blood cell counts) and<br />
IGF-1 mRNA gene expressions compared to fish reared at higher densities (500 and 1000 fish/m 3 ). No<br />
clear pattern of difference in blood glucose levels was observed with stocking density. The research<br />
demonstrates that density-dependent stress impairs growth through inhibition of IGF-1 production. It is<br />
clear that IGF-1 mRNA is a strong growth rate indicator in the field and may also serve as an indirect<br />
measure of stress in tilapia. This along with certain hematological parameters may allow for assessment<br />
of environmental variables that limit stress and best promote growth in tilapia aquaculture. These data<br />
suggest that densities of 250 fish/m 3 are best for growth of fingerlings in nursery hapas.<br />
INTRODUCTION<br />
The quantity of Nile tilapia culture has risen significantly in the Philippines, by almost 4% annually, with<br />
a 33% increase between 1997 and 2002 (BFAR 2006 www.bfar.da.gov.ph). To support the growing<br />
tilapia industry, there is a need to provide year-round, high-quality seed that can be widely distributed at<br />
reasonable costs to tilapia farmers. This can be achieved through better broodstock quality, increased<br />
hatchery development and enhanced technologies for consistently high-quality seed production. Here, we<br />
aim to assess seed production efficiency in O. niloticus as a corollary of broodstock response to social<br />
stress. In the aquaculture and breeding environment, fish species such as the tilapia may develop various<br />
problems associated with physical, chemical and social stressors (Binurameeh et al. 2005; Chandroo et al.<br />
2004), including impaired reproductive performance. Exposure to stressful conditions can reduce egg<br />
size and sperm count, cause ovarian resorption of eggs, delay ovulation, increase developmental<br />
abnormalities and reduce size and survival of offspring (Maeda and Tsukumura 2006). The effect of<br />
stress on fish is not only determined by the aversive character of the stressor but by the fish’s cognitive<br />
appraisal of the stressor (Koolhaas et al. 1999). In order to optimize reproductive performance of<br />
valuable broodstock and improve seed production, stress must be limited and fish selected for based on<br />
their ability to better cope with stress. Breeding is largely driven by social behavior and an understanding<br />
or ability to predict dominance, or select breeders with reduced stress responsiveness, can improve<br />
hatchery and breeding programs.<br />
The physiological and behavioral responses to stress may be used to select broodstock with reproductive<br />
advantage. The variable color pattern in fish may signal a behavioral strategy, enhance camouflage,<br />
improve communication, and confer reproductive advantage (Korzan et al. 2008). In O. niloticus, eye<br />
color is associated with social status (Volpato et al. 2003; Vera Cruz and Brown 2007). In our previous<br />
studies, eye color was found to be a predictor and consequence of social rank (Vera Cruz et al. 2009).<br />
However, no study to date has examined if eye color pattern is related to behavioral stress responses in O.<br />
niloticus; for instance, that associated with appetite inhibition or feeding response during isolation.<br />
462
463<br />
FINAL REPORTS: INVESTIGATIONS 2009–2011<br />
Moreover, to our knowledge, no study has been done in tilapia to examine if reproductive performance<br />
and seed quality is affected by broodstock social rank and/or condition.<br />
To seek higher incomes, farmers in the Philippines are increasingly rearing fish at higher stocking<br />
densities in cages, concrete tanks and ponds, including more intensive fingerling production in nursery<br />
hapas. Filipino farmers are interested in knowing the stocking densities that yield the best growth rate<br />
and minimize mortalities under more intensive culture conditions. Some have noticed significant<br />
mortalities in cages, likely due to overcrowding. It is possible that the farmers are stressing, and<br />
therefore, reducing the growth potential of fish at higher densities. At lower densities behavioral or social<br />
hierarchies may dominate and limit growth potential. Therefore, an additional aim of this investigation<br />
will test the effects of stocking density on the growth, survival, and hepatic gene expression of IGF-I, a<br />
proxy for growth in O. niloticus and other fishes (Picha et al. 2008a), and on stress responsiveness in<br />
tilapia. Stress could be measured by a number of factors including survival, growth and elements of the<br />
growth axis (i.e. IGF-1), hematological variables (red and white blood cells), glucose, cortisol that is a<br />
key hormone mediating stress, and tissue indices (hepatosomatic and cholecystic index) (Bonga et al.<br />
1997).<br />
Physical and social stressors can evoke non-specific physiological responses in fish (Barton 2002). These<br />
responses are considered adaptive to enable the fish to cope with the stressful condition and maintain its<br />
homeostatic state. If the stressor is severe or long-lasting and the fish is not capable of regaining<br />
homeostasis, then the responses themselves may become maladaptive and threaten the fish’s health and<br />
well being (Barton 2002). Physiological responses to stress can be grouped as primary, which include<br />
endocrine changes such as measurable levels of IGF-I (Vera Cruz and Brown 2007) and circulating<br />
catecholamines and cortisol (Barcellos et al. 1999) and secondary, which includes changes in features<br />
related to metabolism, immune function, and energy depletion reflective in lower liver weights<br />
((Binuramesh et al. 2005; Picha et al. 2006; Picha et al. 2008b). Stressful condition was found to<br />
significantly increase circulating cortisol levels (Bolasina et al. 2006), hepatic phosphoenolpyruvate<br />
carboxykinase activity (Dibattista et al. 2006), and bile retention (Earley et al. 2004), but it significantly<br />
decreases hepatic IGF-I levels (Vera Cruz and Brown 2007). A well-characterized physiological<br />
consequence of social stress and excessively high densities is a reduced growth rate (Sloman et al. 2000).<br />
Excessively high stocking density is a stressful condition and decreases fish growth (Björnsson 1994),<br />
increases plasma cortisol levels in flounder (Bolasina et al. 2006) and decreases survival in salmonids<br />
(Sodebergg and Meade 1987). Social stress and the formation of feeding hierarchies, are also density<br />
dependent (Vera Cruz et al. 2006). Differential alterations in growth rate between dominants and<br />
subordinates are attributed more to behavioral changes (i.e. feeding) as transduced by physiological<br />
regulators (i.e. IGF-I level) but may also be due to changes in metabolism (i.e. hepatic<br />
phosphoenolpyruvate carboxykinase activity and bile retention) (Earley et al. 2004; Dibattista et al. 2006;<br />
Vera Cruz and Brown 2007). The growth-promoting actions of growth hormone (GH) are mediated<br />
through induction of IGF-1 (Degger et al. 2000; Picha et al. 2008a). Subordinate or stressed fish is<br />
characterized by larger somatostatin-containing neurons in the hypothalamus, which leads to reduced<br />
production of pituitary GH (Hofmann and Fernald 2000). Due to this, subordination depresses hepatic<br />
IGF-I levels while dominance stimulates its production, likely through greater secretion of pituitary<br />
growth hormone (Vera Cruz and Brown 2007). Here, we aim to assess densities that yield good growth<br />
and survival while simultaneously evaluating the use of IGF-I and various other factors as markers of<br />
growth and stress. An assessment of hepatic IGF-I mRNA in these studies will further validate its usage<br />
as a field indicator of growth status in tilapia (Vera Cruz et al., 2006; see Picha et al. 2008a) as well as its<br />
putative use as an indirect marker of stress. Additionally, blood glucose, red and white blood cell counts,<br />
and tissue indices (hepatosomatic and cholecystic) that can be readily measured will be evaluated as<br />
potential indicators of stress that could prove useful tools to evaluate poor environmental conditions.<br />
Building biotechnology capacity in the Philippines and development of potential bioindicators can<br />
expedite the evaluation of environmental parameters that best promote growth (or limit stress) in tilapia.
FINAL REPORTS: INVESTIGATIONS 2009–2011<br />
OBJECTIVES<br />
1. Determine if physiological and/or behavioral responses to stress can be used in the selection of<br />
broodstock with reproductive advantage in Nile tilapia (Oreochromis niloticus).<br />
2. Examine the effect of broodstock social condition on seed production and fingerling growout<br />
performance of tilapia.<br />
3. Investigate the effect of stocking density on the growth, gene expression of hepatic insulin-like growth<br />
factor-I (IGF-I), and stress responsiveness of tilapia.<br />
MATERIALS AND METHODS<br />
Study 1 - The influence of duration of behavioral stress response on social dominance in tilapia<br />
This study aims to investigate whether the outcomes of competition for social dominance among O.<br />
niloticus individuals can be predicted using the feeding response score and/or duration of appetite<br />
inhibition as a stress coping style. In addition, it also investigates if eye color pattern (ECP) is related to<br />
the duration of behavioral stress response such as appetite inhibition. The concept is to enable the<br />
selection of those broodstock that show dominance and hence might convey reproductive advantages.<br />
Physical and behavioral markers such as eye color pattern (ECP) and appetite, respectively, are features<br />
that could be easily assessed by hatchery operators in selecting the best mating pairs for seed production.<br />
Phase 1 - Isolation and monitoring of the duration of appetite inhibition (DAI)<br />
This phase of the study was done to assess if the outcomes of competition for social dominance might be<br />
predicted by DAI as a stress coping style.<br />
Experimental fish<br />
One hundred size #20 genetically male Nile tilapia (Oreochromis niloticus), with average weight of 0.60<br />
g, were obtained from the Phil-Fishgen, Central Luzon <strong>State</strong> <strong>University</strong>, Science City of Muñoz,<br />
Philippines. They were maintained in a rectangular tank (2m x 1m x 1m) receiving continuous flow of<br />
water. The fish were fed three times a day at 3% of the body weight. Prior to isolation weight of each<br />
fish was determined.<br />
Isolation and monitoring of the DAI<br />
Fifty fish (mean weight of 26.02 ±0.98 g) were isolated at random in glass aquarium (30cm x 15cm x<br />
30cm) for 10 days. Each isolation unit was aerated to ensure sufficient dissolved oxygen available for the<br />
fish. Three sides of the aquarium were covered to prevent the fish seeing other fish isolated in the nearby<br />
aquaria. Upon introduction of each fish in the isolation unit, it was immediately hand fed with three<br />
pieces of floating feeds placed in a feeding ring. The duration from the time of feed introduction to the<br />
time of feed consumption was regarded as the DAI. The DAI and the weight of the fish served as the<br />
bases for pairing the fish for social interaction; fish with shorter DAI against those with longer DAI; with<br />
both fish having similar weight. Fish were then fed daily at 1% of the body weight except two days prior<br />
to interaction. Water exchange was done every other day to maintain good water quality.<br />
Social Interaction<br />
After establishing the competing fish for social interaction, each fish in a pair was individually marked by<br />
a small cut on the upper or lower part of the tail fin for the purpose of identifying the fish with shorter and<br />
longer DAI. The fish in a pair with longer DAI was cut on the lower portion of the caudal fin and vice<br />
versa. After marking the fish, the pair was introduced into a new environment (30cm x 15cm x 30cm<br />
aquarium) at the same time to prevent the effect of place familiarity. The period from time of<br />
introduction to the time of first agonistic attack was recorded. The number of attacks in a ten minute-time<br />
from the first agonistic attack was separately recorded from the total number of attacks during the entire<br />
464
465<br />
FINAL REPORTS: INVESTIGATIONS 2009–2011<br />
interaction. Change in eye color pattern (ECP) of the competing fish was monitored at the start, during<br />
and after the competitive social interaction. Eye color was quantified as darken area of both iris and<br />
sclera (Volpato et al., 2003). The circular area of the eye was divided into eight equal parts using four<br />
imaginary lines (Figure 1). Eye color pattern value ranged from zero (no darkening) to eight (total<br />
darkening) . At the end of the interaction, social rank (dominant or subordinate) was identified by the<br />
characteristics displayed by each fish such as proactive and reactive, pursuing and retreating, erected and<br />
not erected dorsal fin and as well as changes in skin color and ECP. Canon power shot A650IS image<br />
stabilizer AIAF digital camera with resolution of 12.1 megapixels was used to document the social<br />
interaction which in turn was used in checking the observations made during the interaction.<br />
Growth Rate Observation<br />
Paired fish after the interaction were transferred to the dominant fish’s aquarium to support its dominancy<br />
status. They were maintained for a week and fed once a day at 3% of their total body weight. Exchange<br />
of water was done every other day to maintain good water quality. The weight of fish was recorded a day<br />
after the fight.<br />
Statistical Analyses<br />
Frequency difference was analyzed using Binomial test. Mean DAIs of the two groups, and mean<br />
decrease in weight a day after the social encounter between dominant and subordinate fish were compared<br />
using paired sample T-test. Linear relationship of DAI and aggression was assessed using linear<br />
regression and Pearson correlation coefficient. Statistical analyses were carried out by using the SPSS<br />
software version 16.0.<br />
Phase 2 - Feeding latency as an indicator of stress coping style<br />
The second phase followed similar protocol as the first phase except we evaluated whether the outcomes<br />
of competition for social dominance among O. niloticus individuals can be predicted using the feeding<br />
latency score as a stress coping style. The feeding latency scores allow a quantitative evaluation of the<br />
feeding response exhibited throughout the whole isolation period.<br />
Experimental Fish<br />
The Freshwater Aquaculture Center (FAC) Selected Tilapia (FaST) strain of Nile tilapia fingerlings were<br />
obtained from the FaST project, FAC, CLSU, Science City of Muñoz, Nueva Ecija. Three hundred<br />
mixed sex tilapia of same age and similar sizes were reared in a rectangular tank (2 x 1 x 1 m) and fed<br />
two times a day at 3% body weight. Upon reaching 10 grams, male fish were separated from the females.<br />
Feeding Latency During Isolation<br />
After rearing in the rectangular tank, the fish were individually weighed and then isolated for 10 days in<br />
30 x 30 x 15 cm aquarium. The fish were fed once a day at 1% of the body weight except during the last<br />
2 days of the isolation period. The time from introduction to a new environment to the first acceptance of<br />
food was monitored for each of the fish. Feeding behavior during the entire isolation period was<br />
quantified by assigning corresponding point scores for a particular feeding behavior as shown below:<br />
Point<br />
Behavior<br />
0 Fish does not react or eat the food<br />
1 Fish eats only pellets directly put in front of it, and does not move to eat the food<br />
2 Fish moves to eat the food, but comes back to its original place in the aquarium between each feeding<br />
3 Fish eats all food present in the aquarium
FINAL REPORTS: INVESTIGATIONS 2009–2011<br />
After the isolation period, the daily scores were summed up to get the feeding response or latency score<br />
(FRS). Water exchange (50%) was done every other day to maintain good water quality. Water<br />
temperature was monitored daily at 7 AM and 2 PM.<br />
Eye color was monitored daily during the isolation period. Eye darkening has been studied in other fish<br />
using gradual color patterns transformed into scores. Eye color was quantified as darkened area of both<br />
the iris and sclera as described above. Eye color pattern value ranged from zero (no darkening) to eight<br />
(total darkening).<br />
Social Interaction<br />
Fish with the same sex and similar weight but with different FRS were then subjected to social<br />
interaction. A day before initiation of the social interaction each fish in a pair was individually marked by<br />
a small cut in the upper or lower part of the tail fin. The location of the cut was dependent on the feeding<br />
latency score. The fish in a pair with higher feeding latency score was cut on the upper portion of the fin<br />
while in the other fish, the cut was on the lower portion of the fin. To prevent the effect of home location<br />
familiarity, the fish in a pair was introduced into a new environment (30 x 30 x 15 cm aquarium) at the<br />
same time and separated by a center divider. Body weights of dominant and subordinate individuals were<br />
recorded before and after the first encounter. Every morning, the division of the aquarium was removed<br />
for ten minutes and the social interaction of the fish was observed. After daily interaction, both fish were<br />
then fed to satiation once a day and after 14 days of pairing, the social status (behavior, eyes and body<br />
color) of each fish was measured.<br />
Growth Rate Observation and IGF-1 mRNA Analyses<br />
The weight of each fish was recorded weekly over the 14-day social interaction period to establish<br />
changes in growth among the dominant and subordinate fish. At the end of the study, ten pairs of fish<br />
were sampled for liver for extraction and determination of IGF-1 mRNA levels.<br />
Total RNA from the liver was purified using Trizol ® (Invitrogen , Carlsbad, California, USA) using the<br />
protocol suggested by the manufacturer. The purity of the isolated samples was assessed by using the<br />
A260 : A280 ratio which ranged from 1.6-2.0, with most reading ranging from 1.9-2.0. The amount of<br />
RNA in ng per µl sample served as the basis for the addition of 1 µg total RNA template in the reactions.<br />
First strand cDNA was generated in 20 µl RT reactions with 1 µg total RNA template, Omniscript ®<br />
reverse transcriptase, 10X RT buffer, 5 µM dNTP, 10 µM oligo-dT primer (Promega ® , Madison,<br />
Wisconsin, USA), and RNase inhibitor (RNasin ® , Promega ® ). Samples were reverse transcribed by<br />
incubation at 37 °C for 60 min. The IGF-I mRNA was quantified using the TaqMan real time quantitative<br />
reverse transcriptase – polymerase chain reaction (qRT-PCR) assay described in Vera Cruz et al. (2006)<br />
which was performed on Lightcycler ® 480 II (Roche Ltd., Basel, Switzerland). Values for IGF-1 mRNA<br />
were normalized to total RNA.<br />
Statistical Analyses<br />
Frequency difference was analyzed using Binomial test. Linear relationships of feeding latency<br />
percentage, aggression, ECPs and durations of social interaction were assessed using Pearson correlation<br />
coefficient. Durations of appetite inhibition and interaction was analyzed using Chi square test.<br />
Statistical analyses was carried out using the Statistical Analysis Software (SAS).<br />
Study 2 – Effect of Broodfish Social Condition on Seed Production of Nile Tilapia<br />
This experiment was undertaken to assess the effect of broodfish behavioral stress response (BSR) on<br />
seed production of O. niloticus through evaluation of their feeding response score during isolation.<br />
466
467<br />
FINAL REPORTS: INVESTIGATIONS 2009–2011<br />
Determination of Social Groupings<br />
Two potential social groupings in relation to broodfish behavioral stress response (BSR) of tilapia<br />
breeders during isolation were used in this study: the low stress response (LSR) and the high stress<br />
response (HSR) groups. The LSR breeders were those that manifested shorter period of adjustment in<br />
response to stress experienced after transfer to a new environment as indicated by a higher feeding<br />
response score (FRS). While the HSR breeders on the other hand, were those that exhibited longer period<br />
of coping with stress or those that had lower FRS. Their BSR were quantified through feeding response<br />
evaluation during the isolation period<br />
Male and female FAC selected Nile tilapia (FaST) breeders of the same ages with body weights ranging<br />
from 75 – 100 grams were used in the study. The stocks were acquired from the FAC, CLSU, Science<br />
City of Muñoz, Nueva Ecija. The breeders were stocked for 10 days in rectangular tanks (2.30 x 1.30 x 1<br />
m) prior to isolation. A total of 30 male and 90 female FaST breeders were used to represent all the social<br />
groups in all the treatments.<br />
Glass aquaria measuring 30 x 60 x 30 cm were used as isolation chambers for seven days for the<br />
randomly selected male and female FaST. Each unit was provided with aeration system to sufficiently<br />
provide the dissolved oxygen requirement of the fish. Three sides of each aquarium were covered by a<br />
white plastic to avoid seeing other fish in the adjacent isolation chambers. Prior to isolation, weight of<br />
individual fish was recorded. Along with the BSR through feeding observations, the weights obtained<br />
were used as basis in the distribution of the breeders in their respective treatment assignments. This<br />
parameter was also considered in the group allocations to prevent weight from being a factor in the<br />
reproductive performances of the breeders and ensure that the results obtained were only affected<br />
primarily by their BSR.<br />
Once fish were assigned to their respective isolation chambers/aquaria, they were hand fed once a day<br />
with a commercial diet at a rate of 1% body weight. Feeding rings were used when feeds were<br />
administered to be able to clearly observe the possible feeding response that the fish might manifest. The<br />
time the fish resumed feeding after the transfer to the new environment and the particular feeding<br />
response executed until the 7 th day of the isolation period were closely monitored and recorded. After the<br />
isolation period, points were summed up to get the total feeding response score (FRS). Breeders that<br />
accumulated feeding points ranging from 9 to 17 were assigned to the low stress response (LSR) group,<br />
while breeders with points ranging from 0 to 4 belonged to the high stress response (HSR) group. Since<br />
weight was also considered, the fish which demonstrated good feeding response but had higher size<br />
variations were rejected.<br />
Feeding behavioral response manifested during the entire isolation period was quantified through<br />
corresponding points assigned for a particular feeding response as indicated previously. The scoring is as<br />
follows:<br />
0 points - fish does not react or eat the food within a 2 minute time frame;<br />
1 point - fish eats only pellets directly put in front of it, and does not move to eat the food other feeds;<br />
2 points - fish moves to eat the food, but comes back to its original place in the aquarium between each<br />
feeding; and<br />
3 points - fish eats all food present in the aquarium regardless of the position of feed pellets within the<br />
aquarium<br />
Seed Production Evaluation<br />
The feeding response score (FRS) obtained and breeders’ weights were the bases for the social groupings.<br />
The selected breeders were distributed in the two social groupings; LSR and HSR groups, where each<br />
group was composed of 15 male and 45 female breeders. The sex ratio was one male: three females. The
FINAL REPORTS: INVESTIGATIONS 2009–2011<br />
breeding was done in hapas (1 x 2 x 1 m) installed in ponds with a stocking density of 4 pcs/m 2 , which is<br />
typically used for breeding tilapia.<br />
The description of the assignment of fish in their respective 5 treatment grouping is as follows:<br />
LSRHSR♂♀ = 1 HSR male, 1 LSR male, 3 HSR females, and 3 LSR females,<br />
LSR♂♀ = 2 LSR males and 6 LSR females,<br />
HSR♂♀ = 2 HSR males and 6 HSR females,<br />
LSR♂HSR♀ = 2 LSR males and 6 HSR females, and<br />
HSR♂LSR♀ = 2 HSR males and 6 LSR females<br />
Each treatment was replicated three times.<br />
After the 14 days breeding period, female breeders were inspected for the presence of eggs and fry. Eggs<br />
were collected from the mouth of the female breeders by pressing the mouth of the fish and gently<br />
opening their operculum through the collector’s thumb and index finger. In case of existence of swim-up<br />
fry, collection was done using scoop nets. The swim-up fry collected were temporarily placed in a plastic<br />
basin with water and immediately counted.<br />
The parameters observed and recorded include spawning success, total seed produced, hatching rate and<br />
survival rate. The egg quality in terms of size through its diameter was also evaluated. As for the male<br />
breeders, sperm analyses through motility scoring and sperm density were also observed.<br />
Egg Quality: From each replicate, 25 eggs were randomly selected to represent the whole population.<br />
Since the eggs were oval in shape, the diameter of each egg was carefully measured at their longest<br />
portion using a vernier caliper.<br />
Sperm Quality: The procedure done by Danting (1992) for scoring sperm motility was followed. Sperm<br />
motility in all samples was scored on a subjective rating scale system of 0 to 10. A rating of 10 denotes<br />
that 100% of the spermatozoa under observation are motile, moving actively, while zero (0) rating<br />
indicates that no sperms are moving after activation. Prior to scoring 20 µl of sample was diluted in 100<br />
µl water for activation. Following activation, sperm motility scoring was determined under the<br />
microscope. Only sperm swimming in a forward motion were included in estimation of motility.<br />
Sperm density was estimated using a Neubauer slide counter (Haemacytometer, 0.1 mm., 1/400 mm 2 ,<br />
Weber Scientific, England). Before the milt was used for any purpose, sperm head counts were done to<br />
estimate the whole sperm sample densities. Milt was subsequently diluted and a 10 ul was dropped on the<br />
Neubauer Slide (Haemacytometer) for counting. The slide was left for approximately 10 minutes to allow<br />
the sperms to settle into one plane.<br />
Spawning Success: The average number of eggs produced was evaluated on the 2 nd production cycle,<br />
since the first cycle already contained swim-up fry. Average egg production per female was calculated as<br />
the number of eggs collected / number of female breeders that spawned. Spawning success was<br />
determined by percentage spawning rate [(number of female breeders/total number of stocked female<br />
breeders) x 100]<br />
Hatching Rate: During the incubation period, a rate of water flow was maintained to allow a continuous<br />
movement of the eggs which also prevents their damage, clumping and settlement. Round bottom<br />
incubation jars were used, since previous studies have proven that these containers can give good results<br />
provided that water flow rates and water quality are carefully regulated (Subasinghe and Sommerville,<br />
1992). Percent hatching rate was calculated as number of hatched eggs/total number of eggs x 100.<br />
468
469<br />
FINAL REPORTS: INVESTIGATIONS 2009–2011<br />
Fry Survival Rate and Size: When the yolk sac had been absorbed, the fry were transferred in the nursing<br />
hapas installed beside the breeding and conditioning hapas. Stocking was done in the morning. The fry<br />
were reared for three weeks or until size # 24 was obtained. Daily feeding (twice a day) of commercially<br />
available fry mash at five per cent of their body weights was done to optimize their growth. After the<br />
rearing period of three weeks, the post-fry were collected and their survivorship determined (number of<br />
post fry survived/total number of fry x 100).<br />
The harvested post-fry for both production cycles were subjected to length and weight measurements.<br />
For the determination of their lengths, 20 samples were randomly selected for each replicate in each<br />
treatment, in each batch. Each post-fry was measured using a vernier caliper. Weight was determined<br />
through dividing the acquired collective weight of sampled post fry by the number of individual fry.<br />
Statistical Analysis<br />
The treatments were determined in terms of the ratio of male to female, either singly or in combination,<br />
based on their identified potential social status. The treatments were allocated in each hapa following the<br />
Randomized Complete Block Design (RCBD) with three replications per treatment. Two-way analysis of<br />
variance for RCBD was done and Least Significant Difference was used to identify the effect of<br />
behavioral stress response of the fish among the social groupings. Appropriate analysis like analysis for<br />
unequal replications and data transformation were calculated using the General Linear Model via the SAS<br />
V9.0 software.<br />
Study 3 – Effect of Broodstock Social Condition on the Growout Performance of Nile Tilapia<br />
Fingerlings<br />
There were two phases in this study, the first phase was the determination of the social condition of the<br />
broodfish by isolation for 5 days in aquarium and observing feeding response. The feeding response was<br />
done once a day for the entire 5 days of isolation and quantified through the corresponding points<br />
assigned for a particular feeding response, as previously described above. The breeders that obtained<br />
total points ranging from 9 to 15 were assigned to the low stress response (LSR) group while those that<br />
had 0 to 8 were considered the high stress response (HSR) group. After determining the broodfish with<br />
LSR and HSR, males and female breeders of the same social condition were conditioned separately in<br />
conditioning hapas prior to the breeding period. After the breeding period, fry were collected after 15<br />
days and were stocked for sex-reversal treatment in hapas for 21 days. Sex-reversed fingerlings were<br />
used for the second phase of the study – the grow-out period.<br />
The second phase of the study was composed of two treatments that were replicated three times.<br />
Treatments were as follows: I – sex-reversed fingerlings produced from LSR broodfish, and II - sexreversed<br />
fingerlings produced from HSR broodfish. Size 22 (ave. wt. ranged from 0.192 to 0.208 g) of<br />
sex-reversed Nile tilapia fingerlings were used in the study. Fingerlings were stocked in six 200 m 2<br />
earthen ponds at 2 fish· m -2 . The fingerlings were fed twice a day with commercial feeds at 20% of the<br />
body weight from 0-2 weeks, 10% of the body weight from 2-4 weeks, 7% of the body weight from 4-6<br />
weeks, 6% from 6-8 weeks, 5% from 8-10 weeks, 4 % from 10-12 weeks.<br />
Regular fertilization was made using inorganic fertilizers such as ammonium and 5.6 kg P·ha -1 week -1 to<br />
enhance the growth of natural foods in pond water. Fertilization of ponds was dependent on the<br />
productivity of the pond water. Secchi disc visibility readings were maintained at 40 cm and below.<br />
Eighty individuals were sampled biweekly to obtain average weight and length using cast net method as a<br />
sampling device to check the growth of stocks. At the end of the culture period, 80 fish or 10% of the<br />
total fish stock were sampled for individual weight and length.
FINAL REPORTS: INVESTIGATIONS 2009–2011<br />
Water quality parameters such as dissolved oxygen, water temperature, pH, total ammonia-nitrogen;<br />
alkalinity and phosphorus levels were monitored weekly starting at 9 AM in the morning.<br />
After 90 days of culture period, all data were gathered and analyzed by T-Test in randomized complete<br />
block design with three replications.<br />
Study 4: Effect of Stocking Density on the Growth Responsiveness, and IGF-1 Expression in Nile<br />
Tilapia<br />
Along with rapid expansion and intensification, there is a growing concern on the welfare and health of<br />
farmed fish. Vahdatpour et al. (2009) and Mostl and Palme (2002) pointed that stocking densities in<br />
commercial aquaculture have been highlighted as a subject of increasing importance as far as fish health<br />
is concerned. Any alteration in the physical and psychological state of a living organism as it interacts<br />
and responds to environmental variations (Chandroo et al., 2004) like rearing at higher stocking densities<br />
induce stress. With aquaculture’s expansion, more accurate information on stress control is highly<br />
necessary in order to assure health of fish. Scientific investigations have shown interest on early<br />
detection of stress in fishes that has led to increased study of potential biochemical, subcellular, cellular,<br />
histological and behavioral markers or biomarkers of stress.<br />
This experiment assesses the effects of stocking density on O. niloticus growth and survival, hepatic IGF-<br />
I gene expression and stress responsivenss associated with stocking densities. We initially intended on<br />
measuring cortisol as a marker of stress in this study, but the plate reader intended for its measurment at<br />
CLSU was in disrepair and required substantial modification to measure plasma cortisol by an ELISA<br />
validated by our group (Cayman, Ann Arbor MI. USA). An alternative approach would be to measure<br />
cortisol by a radioimmunoassay (Dean et al. 2003). However, this technique requires isotopes not<br />
permitted for use at CLSU. Also, because of substantial time required for shipment and delicate nature of<br />
the samples they could not be reliably sent to NCSU for measurement. Nevertheless, we modified our<br />
objective to measure not only survival, growth and hepatic IGF-1 gene expression, but various other<br />
possible stress sensitive parameters including hematological, glucose, hepatosomatic and cholecystic<br />
indices. As good management provides the key to the avoidance of essentially all health problems<br />
whether stress related or not measurement of these variables will both establish reference ranges for Nile<br />
tilapia and those potentially linked to stress that could be used to assess overall health status of fish.<br />
Rearing and Conditioning of Fingerlings in Net Enclosures<br />
Seven (7) conditioning enclosures “hapas” with measurements of 2 x 5 x 1 m (10 m 3 ) were installed in a<br />
1000 m 2 pond at the FAC-CLSU. Stocking density for each conditioning hapa was 150 pieces/m 2 or<br />
1,500 pieces/hapa. The first two nets were stocked with mixed sex tilapia and the remaining five nets<br />
were stocked with sex-reversed fish. Fry mash was given twice daily, with a feeding rate of 20% of the<br />
fish biomass on the first week, and adjusted to 11% on the second week. On the third week, the feeding<br />
rate was lowered to 10% of the fish biomass and on the last week of rearing, the feeding rate was lowered<br />
to 6.5%. A support set of fingerlings were also reared and conditioned in 200 m 2 pond at the Genetic<br />
Improvement of Farmed Tilapias-FeedMix Fortified (GIFTFF) facility at CLSU. The stock included<br />
20,000 pieces of size 20 fingerlings with an average weight of 0.6 grams. Fingerlings were fed 15%<br />
biomass on the first week, 13 % on the second week, 10% on its third week and 9% on the last week.<br />
Growth rate was monitored weekly.<br />
After acclimatization, 8,000 experimental fishes were distributed randomly in four treatment groups and<br />
each treatment was replicated four times. Fish were fed 2% of the biomass. All treatments were set in 16<br />
experimental units following a Completely Randomized Design (CRD). The treatments used were as<br />
follows:<br />
470
T1 - 250 fish/m 3 , control, low density, mixed-sex<br />
T2 - 250 fish/m 3 , low density, sex-reversed males<br />
T3 - 500 fish/m 3 , medium density, sex-reversed males<br />
T4 - 1000 fish/m 3 , high density, sex-reversed males<br />
471<br />
FINAL REPORTS: INVESTIGATIONS 2009–2011<br />
Fish weights were obtained from fish at the beginning and end of the experiment. SGR was also<br />
determined over the course of the experiment by obtaining fish weights at 10 (March 19), 24 (April 2),<br />
and 30 days (April 8 – end of experiment)<br />
Water Quality Monitoring: The temperature ( ᵒ C) and dissolved oxygen (mg/li) were monitored in the<br />
morning and in the afternoon during the 30-day nursery period. Water transparency was determined<br />
using a Secchi disk. The average Secchi disk readings were used in the calculation of Trophic <strong>State</strong> Index<br />
(TSI = 60-(14.41*[Ln (average Secchi disk readings)]).<br />
Hepatic IGF-1 mRNA: Fingerlings from net enclosures and ponds were drawn for the initial, basal<br />
measurement of hepatic IGF-1 mRNA. These samples represented the following: three females and three<br />
males from mixed-sex fingerlings reared in hapa, three males from sex-reversed fingerlings reared in<br />
hapa, and three males sex-reversed fingerlings reared in ponds.<br />
For the experiment, a total of 48 juvenile fish samples were collected for IGF-1 determinations from each<br />
replicate at 7, 15 and 30 days (Mar 16, Mar 24 and Apr 8) from initiation of the experiment. The weight<br />
of each fish sample was taken and recorded. An incision started off at the anal region up to the abdominal<br />
part to expose the liver of the fish. Hepatic tissue samples were collected and immediately placed in 0.5<br />
ml microcentrifuge tubes and frozen in liquid nitrogen.<br />
Total RNA was isolated from the hepatic tissue using Trizol (Invitrogen TM , Carlsbad, California, USA).<br />
Glycogen in the samples were removed using a high salt solution. Two reaction cycles were done on<br />
RNA samples to remove possible genomic DNA contamination using DNA-free TM (Ambion, Austin,<br />
Texas, USA). The RNA concentration was quantified by spectrophotometry at 260 nm and its purity was<br />
checked by obtaining the 260/280 ratio which ranged from 1.90 to 2.05 (NanoDrop spectrophotometer,<br />
MSI U 100 Series, Wilmington, DE, USA).<br />
Sample RNA was reverse transcribed to produce cDNA. This cDNA was subsequently measured by<br />
TaqMan® real time quantitative reverse transcriptase-polymerase chain reaction (qRT-PCR) as<br />
previously described (Vera Cruz et al. 2006). A serial dilution of cDNA was run to generate a standard<br />
curve (the log of initial target copy number was plotted against the threshold cycle) of IGF-1. The<br />
amount of IGF-1 mRNA in each sample was calculated by substituting the generated threshold cycle<br />
values to the equation derived from the standard curve (Bustin 2002). IGF-1 mRNA (ng cDNA) was<br />
normalized to sample total RNA (ul total RNA).<br />
Hepatosomatic and Cholecystic Indices: Samples of the fish’s liver and gall bladder were weighed and<br />
recorded from each replicate after the 30-day nursery period. The hepatic tissue and gall bladder were<br />
collected after dissection then weighed and measured using an electronic scale (SANFORD 1261552,<br />
0.01g; 2000 capacity). The hepatosomatic (liver weight/body weight x 100) and cholecystic (gall bladder<br />
weight/liver weight x 100) indices were measured<br />
Hematological and Blood Glucose Profiles: Blood samples from each replicate were drawn by cardiac<br />
puncture using 1cc tuberculin heparinized syringe. Blood sample from each replicate was pooled in<br />
heparinized 1.5 ml tubes and placed temporarily in crushed ice. Whole blood glucose was determined<br />
using a glucose meter (Glucostar-Glucometer). Total red blood and white blood cells (WBC) were
FINAL REPORTS: INVESTIGATIONS 2009–2011<br />
counted using- Hemacytometer ((Neubauer,USA). The Turk solution for WBC counting was prepared<br />
using 0.05 g gentian violet, 1 ml glacial acetic acid and 100 ml distilled water. The Gower solution for<br />
RBC counting was prepared by mixing 9.38 g sodium sulfite anhydrous, 25 ml glacial acetic acid and 150<br />
ml distilled water.<br />
Rearing of Fingerlings in Tanks<br />
Parallel investigations were initiated in semi-intensive tanks at the NCSU Pamilco Aquaculture Field<br />
Station (Aurora, NC). Sex-reversed Nile tilapia for this study were stocked in 1500 L tanks at a density<br />
5, 10 and 30 kg m -3 . Following a 3-week growth period, the experiment was terminated by hurricane<br />
Irene in August 2011. PAFL was highly damaged and lost its dormitory and emergency backup generator<br />
from massive flooding. The fish from the experiment did not survive.<br />
Statistical Analyses<br />
Data on hepatic IGF-1 mRNA, growth, hepatosomal, cholecysctic, glucose and hematological indices<br />
from each replicate of each treatment are expressed as mean ± standard deviation. All data were analyzed<br />
statistically by General Linear Models procedure (SAS 1999). Tukey’s Multiple Range (5% probability<br />
level) was used to test the differences between treatment means. A paired comparison using Proc Means<br />
of the Statistical Analysis System (SAS) was also done on variable weight, survival and IGF-1 to test<br />
whether there is a significant difference prior to and post stress evaluation of fish reared in different<br />
densities.<br />
RESULTS AND DISCUSSION<br />
Study 1 - The influence of duration of behavioral stress response on social dominance in tilapia<br />
Phase 1 - Isolation and monitoring of the duration of appetite inhibition (DAI)<br />
DAI after transfer to isolation units:<br />
The mean DAI for all isolated fish was 83.55 ± 14.29 (mean ± SEM) minutes. The shortest DAI was<br />
0.31 minute and the longest was 570.76 minutes. After the matching pairs for later pairing had been<br />
established, short DAI group had a mean DAI of 33.55 ± 10.15 minutes, which was significantly shorter<br />
(P < 0.01) than that of the long DAI group (133.54 ± 22.86 minutes; Figure 2).<br />
Social interaction:<br />
During the introduction of competing individuals in the aquarium, both fish displayed pale body<br />
coloration with dark stripes. The mean duration before observance of first attack was 10.86 ± 2.13<br />
minutes. The fastest individual to adapt to the social condition and that attacked the opponent took less<br />
than 6.0 seconds, while the longest duration before observance of first attack was 33.66 minutes.<br />
However, at the beginning of the social encounter it was not always the fish with shorter DAI that<br />
initiated the fight. Thirteen (52%) of the 25 fish with shorter DAI (compared to their respective<br />
opponents) initiated the fight, while fish with a longer DAI initiated 11 social interactions. One pair did<br />
not show any interaction.<br />
During the social encounter, the dorsal fins of both fish were raised and both swam towards each other<br />
indicating their preparedness to fight. Then they began aggressive interaction which involved chasing,<br />
rapid circling and biting directed against the mouth, fins and other body parts of the opponent. During<br />
this period of intensive interaction, both fish exhibited pale body stripe coloration. However, during the<br />
later part of the interaction, challenged fish mostly rebuffed attacks and eventually one of the fish chased<br />
and bit the flanks of the other fish that was fleeing. At this point, aggressive behaviour became<br />
unidirectional, and an aggressive dominant individual and a retreating subordinate fish was clearly<br />
identified. It was also observed that body- and eye-darkening of the fish increases with subordination and<br />
declines with dominance.<br />
472
473<br />
FINAL REPORTS: INVESTIGATIONS 2009–2011<br />
Overall, formation of a stable dominant-subordinate relationship was observed in 24 out of the 25 tested<br />
pairs for social dominance. Seventeen dominant fish (70.83%) of the 24 had shorter DAI during isolation<br />
compared to their opponents. This frequency difference on DAI of the dominant individuals was<br />
significant (Binomial test, P = 0.03; Figure 3). However, as previously mentioned, social encounter was<br />
not always initiated by the earlier eaters (i.e. shorter DAI), but eleven (64.70%) of the 17 dominant earlier<br />
eaters initiated the fight and the remaining six individuals did not start up attacking the opponent yet won<br />
the fight. On the other hand, five later eaters that became dominant began the fight, while the remaining<br />
two did not.<br />
The recorded mean number of attacks of the 24 pairs before winning the fight was 73.33 ± 14.31. The<br />
most aggressive pair had 201 attacks in a 10-minute fight and had 277 attacks in the whole course of<br />
interaction. By contrast, the least aggressive pair made no more than one attack before the establishment<br />
of dominance. The DAI difference and level of aggression (number of attacks) between the competing<br />
pairs showed an insignificant weak positive correlation (r = 0.28, P = 0.193).<br />
Dominance/Subordination and Growth<br />
Reduced growth rate is a well-described physiological end result of social stress. The mean weight of<br />
subordinate fish before the interaction was 26.17 ± 1.40 g and this was reduced to 23.29 ± 1.36 g one day<br />
after the fight. While in the dominant fish, average weight was decreased from 26.81 ± 1.45 g to 24.70 ±<br />
1.36 g (Figure 4). The mean decrease in weight was significantly higher for subordinate fish (2.88 ± 0.21<br />
g) compared with dominant fish (2.11 ± 0.19 g) (P < 0.01).<br />
Mortality of Subordinates<br />
Death can be the most overwhelming effect of stress. After the interaction of each pair, winner and loser<br />
individuals were easily identified by their displayed behaviors. One day after the fight, one subordinate<br />
fish immediately died followed by four on the second day, nine on the third day, which was the day with<br />
the highest number of mortality. Another three died on the fourth day, five on the fifth day and one on the<br />
sixth day. The last surviving subordinate individual died on the seventh day after the interaction. It took<br />
one week from the day after the social interaction for all subordinate fish to die.<br />
Phase 2 - Feeding latency as an indicator of stress coping style<br />
Feeding Response Score and Social Interaction<br />
We found that tilapia with higher FRS during the isolation had a greater possibility to win the fight for<br />
social dominance. Formation of stable dominant-subordinate relationship was observed in 59 of the 60<br />
pairs tested. Thirty six fish of the 59 after the first interaction and 34 of the 56 after 14 days that became<br />
dominant had higher FRS compared to that of their conspecifics (Binomial test, P < 0.05). This indicates<br />
that social dominance can be predicted using the FRS of the fish during isolation so long as FRS values<br />
are not very close among the pairings.<br />
Dominance/Subordination in Relation to Growth Rate and Hepatic IGF-1 mRNA Expression<br />
Table 1 shows a summary of time before first acceptance of food and feeding latency or response score<br />
during the isolation, and weight of competing individuals before the interaction and 1, 7 and 14 days after<br />
the first interaction. Before the social interaction there was no significant difference on the body weight<br />
between the competing individuals (see Table 1). During and after the interaction, most of the dominant<br />
individuals have higher body weight than that of the opponent.<br />
On growth of the fish, dominant fish had a mean SGR of 1.61% which was significantly higher (P =<br />
0.013) than that of the subordinate fish (0.93%). The correlation of IGF-I mRNA and the specific growth<br />
rate (SGR) of the fish from day 7 to 14 of the social interaction period is shown in Figure 5. Generally,<br />
fish with faster growth rate had a higher IGF-I mRNA gene expression. The mean relative abundance of
FINAL REPORTS: INVESTIGATIONS 2009–2011<br />
hepatic IGF-I mRNA of dominant fish was elevated 73% when compared with the subordinate fish (P =<br />
0.005) after 14 days. There was a significant overall positive correlation (r = 0.65) between SGR and<br />
relative abundance of IGF-I mRNA (P = 0.002).<br />
Behavioral stress response can be used to predict outcome of contest for social dominance. Results of the<br />
present study indicate that tilapia with shorter DAI after its transfer to isolation in a new environment has<br />
a greater chance to become dominant when paired with another individual. The results that fish with low<br />
behavioral stress response became dominant in majority of the social pairing are similar to those<br />
established for the anole and rainbow trout (Korzan et al. 2006; Øverli et al. 2004; Pottinger and Carrick<br />
2001). The time variation of resumption of food intake (ranging from seconds to hours) of fish after<br />
being transferred to new environment most likely reflects some aspects of the physiological stress<br />
responses to confinement, which could also affect the outcome of the social interaction (Øverli et al.,<br />
2004). According to Bernier (2006), stress induced inhibition of food intake in fish may, in part, be<br />
mediated by corticotrophin-releasing factor system which plays a key role in controlling the<br />
neuroendocrine, autonomic, immune, and behavioural responses to stressors. On the other hand, the fish’s<br />
resumption of feeding after having coped with a stressful condition may reflect a down regulation of the<br />
physiological stress response (Øverli et al. 1998).<br />
The results that not all fish with shorter DAI won the fight calls for a need to refine the method of<br />
assessing the behavioral stress response in this species of fish. In a review, Øverli et al. (2007) described<br />
how feeding behavior can be used as an indicator of stress coping style. Feeding behaviour can be<br />
assessed using point system based on the feeding behavior of the fish when fed daily for one week during<br />
isolation. In phase II of this study, we evaluated the FRS over a 10-day isolation period and found that<br />
social dominance can be predicted from animals that exhibit a higher FRS so long as FRS values among<br />
pairings clearly differ and are not too close to each other.<br />
Social encounter is potentially costly and risky to the fighting opponents. The cost of fighting includes<br />
energy, time and physical injuries. The individuals engaged in social fight are integrating the costs and<br />
benefits associated with the contest and adjust their behavior accordingly (Hsu et al. 2006). At a certain<br />
point when an individual in a pair reaches its own dangerous threshold, an established dominantsubordinate<br />
relationship will be observed after one of the fish retreats or surrenders. In the current study,<br />
the observed changes in behavior and body and eye color of the competing fish served as social signals to<br />
the opponents to limit aggressive interaction. When social hierarchy had been established, subordinates<br />
showed increased body stripes and eye-darkening patterns relative to dominant fish which showed<br />
decreases in these variables. These observations conform with previous work (Volpato et al. 2003; Bero<br />
2008; Vera Cruz and Brown 2007).<br />
Social aggression is stressful for both dominant and subordinate fish (Summers and Winberg 2006). In<br />
social interaction, defeat in many animal species is a powerful stressor that can lead to drastic alterations<br />
in physiology and behavior. Behavioral effects of defeat include appetite inhibition (Gómez-Laplaza and<br />
Morgan 2003; Øverli et al. 1998; Winberg et al. 1993), reduced aggression (Höglund et al. 2001;<br />
Blanchard et al. 1995), and increased submissive and defensive behaviors towards conspecifics<br />
(Blanchard et al. 1993; Siegfried et al. 1984). The observed weight reduction in the current study after<br />
the interaction in both the dominant and subordinate fish supports our previous findings (Vera Cruz and<br />
Brown 2007). The reduced weight of subordinate fish a day after the social interaction may be more a<br />
result of appetite inhibition rather than a reflection of mobilization of stored energy for physical activity<br />
associated with social stress encountered. The subordinate fish were observed not consuming food after<br />
the social interaction and dominant fish even guarded or monopolized the food against the opponent. On<br />
the other hand, the increased physical activity of dominant fish during and after the aggressive<br />
encounters, a behaviour indicating that they have won the contest, may have contributed to the lower<br />
mean weight of the fish after the interaction. However, during the establishment of social hierarchy, the<br />
two social groups experienced similar level of physical activity. Thus, body weight differences between<br />
474
475<br />
FINAL REPORTS: INVESTIGATIONS 2009–2011<br />
the two social groups during the establishment of social hierarchy were mainly attributed to physiological<br />
and behavioral differences such as appetite rather than to differences in physical activities (Fox et al.<br />
1997; Øverli et al. 1999). Inhibited food intake in subordinate fish may be due to social stress-induced<br />
increase in the serotonergic activity in the brain (Winberg et al. 1992) and/or neuropeptide Y mRNA<br />
expression in the preoptic area (Doyon et al. 2003).<br />
The mortality of subordinates in Phase I of the studies is most likely a result of exhaustion caused by<br />
social stress. This was also observed by Petrauskiené (1996) in rainbow trout reared at low densities (2 or<br />
3 individuals) where most of the subordinate fish may have reached the exhausted state during the third<br />
day. Subordinate fish confined with a dominant fish experience social stress and showed increased<br />
standard metabolic rate or a metabolic disadvantage (Sloman et al. 2000) that may lead to impaired<br />
growth. Our previous work shows that lower social status depresses hepatic insulin-like growth factor-I<br />
(IGF-I) levels while dominant status stimulates IGF-I production (Vera Cruz and Brown 2007). In Phase<br />
II of the present study we found that dominant fish predicted by an elevated FRS, exhibited increased<br />
growth and that this is associated with enhanced hepatic IGF-1 mRNA levels. With social stress seen<br />
with subordinates, hepatic IGF-I declines leading to reduced growth rate.<br />
Overall, the results of these studies suggest that DAI or FRS are good predictors of social status in Nile<br />
tilapia with shorter DAI and higher FRS values during isolation leading to a significantly greater<br />
proportion of individuals that show dominance during social interaction. The dominant individuals have<br />
improved survival, enhanced hepatic IGF-1 gene expression and increased growth rate. The opposite<br />
occurs in subordinate tilapia whose social status and reduced capacity to cope with stress can be predicted<br />
from lower feeding response scores and a longer duration of appetite inhibition during a previous period<br />
of isolation.<br />
Study 2 – Effect of Broodfish Social Condition on Seed Production of Nile Tilapia<br />
Egg Quality: The measured average size of the eggs collected from each treatment is presented in Table<br />
2. Eggs from LSR♂♀ (2.86 mm) were significantly bigger than those of the other treatments.<br />
Comparison of mean egg sizes in LSRHSR♂♀ and HSR♂LSR♀ revealed no significant difference but<br />
their egg sizes were significantly higher than those in HSR♂♀ and LSR♂HSR♀, which were comparable<br />
with each other.<br />
The average size of eggs in this study ranged from 2.16 to 2.86 which is in agreement with the findings of<br />
Payne and Collimson (1983) who showed that eggs of O. niloticus usually range in size from 1.94 to 2.95<br />
mm. Although mean egg sizes in all the treatments fell under the said range, the social grouping where<br />
both the breeders manifested LSR had a significantly higher egg size than the others. Rainbow trout (O.<br />
mykiss) subjected to a milder stress regime during early vitellogenesis produced smaller eggs that varied<br />
in size, while there was no effect on mean egg size in fish stressed during late vitellogenesis (Contreras-<br />
Sanchez et al. 1998). It is possible therefore that stress encountered by the HSR female breeders during<br />
vitellogenesis led to the production of smaller eggs in the LSR♂HSR♀ and HSR♂♀ treatments. Also<br />
during the whole isolation period, the majority of HSR breeders did not show any aggression towards the<br />
introduced feed and did not even eat the feeds within the two-minute time frame given. These behaviors<br />
by the HSR breeders might have also been manifested during the breeding period whereby a deficiency in<br />
nutrients may have contributed to the smaller egg sizes for these social groups.<br />
Sperm Quality: The accumulated FRS of the male breeders with their corresponding motility scores are<br />
presented in Table 3. Sixty-five males were subjected to isolation for seven days, however, only 20 of<br />
them produced sperm during the collection. Twelve males were chosen to represent the respective FRS.<br />
Eighteen was the highest FRS a male breeder was able to accumulate during the whole isolation period,<br />
while, zero was the lowest gathered FRS.
FINAL REPORTS: INVESTIGATIONS 2009–2011<br />
The highest motility score obtained was 10 and the lowest was 3. The samples with accumulated FRS<br />
from 6 to 10 all attained a sperm motility score of 10. However, although they all had100% motile<br />
sperms, a difference in terms of active movement was also observed under the microscope. The male<br />
breeder with a 10 FRS had 100% motility, but only 75% of them were actively swimming and the<br />
remaining 25% showed a more moderate pace of motility. While the sperm collected in the male breeders<br />
with an FRS of 6-8 consisted of 100% motile sperms, only 50% of them were active and the other half<br />
showed slow motility. The breeders with an 11 to 18 FRS had 100% motility that consisted of very active<br />
and fast swimming spermatazoa. Low sperm motility could actually reduce fertility even despite an<br />
increase in sperm quantity (Kurokura and Oo 2008). Breeders with FRS of 0-5 showed relatively low<br />
motility scores, whereby 50% of their moving sperms were actively swimming and the other half showed<br />
moderate to slow movement. The breeder that produced the lowest motility score of 3 (FRS of 0),<br />
showed only 30% motility that was of moderate pace.<br />
Table 4 presents the sperm density for the accumulated FRS by each male breeder. The accumulated<br />
feeding score from zero to six were considered to belong to the HSR group while those that accumulated<br />
10 points and above were under the LSR group. Breeders that gathered 15 and 18 FRS obtained the<br />
highest sperm densities of 1.063 x 10 10 and 9.400 x 10 9 , respectively. On the other hand, zero and one<br />
FRS had the lowest densities of 2.025 x 10 9 and 3.100 x 10 9 , respectively. Male breeders that were able<br />
to accumulate 18 and 15 points had the significantly higher sperm densities than those of the other<br />
breeders. While, the breeder with FRS of zero had significantly lower sperm density compared to those<br />
of the other breeders with higher FRS. The trend shows that the FRS was directly proportional to the<br />
sperm density; the higher the accumulated FRS of a male breeder, the more sperm it produces. In the<br />
present study, LSR breeders show dominance over the fish that belong to the HSR group and show higher<br />
sperm density and motility. Hence, dominance may increase the sexual maturation rate in Nile tilapia<br />
males (Goncalves-de-Freitas 1999). In the African cichlid, Astatotilapia burtoni, social status determines<br />
reproductive capacity of males via increased activity of the of the brain-pituitary-gonad (BPG) axis,<br />
which leads to increased production of sex steroid hormones (Parikh et al. 2006; Burmeister et al. 2007).<br />
In the hypothalamus, gonadotropin releasing hormone (GnRH) stimulates the secretion of gonadotropins<br />
which stimulate male reproductive functions and secretion of testosterone hormone required for<br />
spermatogenesis and sperm transport (Bearden and Fauquay 1980). In bulls, previous studies revealed<br />
that GnRH treatment increases sperm concentration and levels of live spermatozoa (El-Azab et al. 1996;<br />
Gabor et al. 1998). Considering dominance increases the activity of the BPG axis in cichlids, which leads<br />
to enhanced production of gonadotropins, it is quite plausible that breeders with increased FRS and that<br />
manifest low stress response behaviours (show dominance) are the ones that show increased sperm<br />
density and motility.<br />
Spawning Success: Table 5 presents the average spawning success per treatment during the 2 nd production<br />
cycle while Table 6 presents the average number of eggs a female was able to produce in one spawning.<br />
Spawning success in LSRHSR♂♀, LSR♂♀, LSR♂HSR♀ and HSR♂LSR♀ were comparable and<br />
significantly higher than that in the HSR♂♀ group. The average number of eggs produced per female in<br />
the LSR♂♀ group was significantly higher than those in LSRHSR♂♀, LSR♂HSR♀ and HSR♂♀ but<br />
comparable with that in HSR♂LSR♀. The HSR♂LSR♀ group revealed no significant difference with<br />
that of LSRHSR♂♀, but was significantly higher compared to the LSR♂HSR♀ and HSR♂♀ groups.<br />
The LSRHSR♂♀ and LSR♂HSR♀ on the other hand were comparable. Average number of eggs<br />
produced in HSR♂♀ was significantly lower than those of the other treatments.<br />
All treatments with both or either male or female LSR breeders (i.e. LSRHSR♂♀, LSR♂♀, LSR♂HSR♀<br />
and HSR♂LSR♀) had comparable spawning rates that were significantly higher (P < 0.05) than those in<br />
the HSR♂♀, which was composed of HSR male and female breeders. However, the advantage of<br />
treatments that consisted of LSR female breeders (LSR♂♀, 951.67 ± 151.28 and HSR♂LSR♀, 797.00 ±<br />
476
477<br />
FINAL REPORTS: INVESTIGATIONS 2009–2011<br />
129.26) was that they produced more eggs per female per spawning than those in the groups with HSR<br />
female breeders (P < 0.05). Interestingly they also had increased egg size (Table 2).<br />
Eggs and Fry Production: The total number of eggs and swim-up fry for the 1 st and 2 nd production cycles<br />
is presented in Table 7. The swim-up fry collected in the 1 st production was added to the number of the<br />
eggs collected; it was assumed to have a 100% hatching rate.<br />
Breeders from LSRHSR♂♀ produced the highest mean number of eggs for both cycles having 3260.33<br />
and 1883.67 eggs, respectively. It was followed by those in LSR♂♀ with 2484.33 eggs in the 1 st cycle<br />
and 1582.33 eggs in the 2 nd cycle. The breeders in LSR♂HSR♀ obtained a higher mean egg collection of<br />
1557.33 eggs in the 2 nd cycle than in its 1 st production cycle which was just 867.33 eggs. This same trend<br />
was also shown in HSR♂LSR♀. On the other hand, breeders in HSR♂♀ generated 2142.00 eggs in the<br />
1 st production, however, this figure was only a representation of just one replicate. No eggs were<br />
collected in the other two replicates. And for the 2 nd production, no eggs had been collected in all the<br />
replicates, thus, obtaining a zero (0) value. Only 1 replicate in HSR♂♀ was able to produce eggs during<br />
the 1 st cycle and none in the 2 nd . Three breeders had died in the HSR♂♀ group a day before the<br />
scheduled collection of the 2 nd cycle; two from replicate one (one male and one female) and one female<br />
from replicate three.<br />
On the number of eggs collected no significant differences were observed in LSRHSR♂♀, LSR♂♀, and<br />
HSR♂♀. The mean number of eggs collected in LSR♂HSR♀ and HSR♂LSR♀ were also comparable to<br />
each other, but were significantly lower than those of the first three treatments. For the 2 nd production<br />
cycle, since no eggs were collected in HSR♂♀, analysis was done based on the log (x+1) transformation.<br />
Comparison among treatment means showed that those in LSRHSR♂♀, LSR♂♀, LSR♂HSR♀ and<br />
HSR♂LSR♀, were all comparable among each other but significantly higher than that in HSR♂♀.<br />
Total seed produced in LSRHSR♂♀ (5144.00) was comparable to that in LSR♂♀ (4016.66), but was<br />
significantly higher than those of the other treatments (Table 8). Total seed production in the LSR♂♀<br />
group was significantly higher than that of HSR♂♀, but comparable to those of the LSR♂HSR♀ and<br />
HSR♂LSR♀. HSR♂♀, LSR♂HSR♀, and HSR♂LSR♀ had comparable total seed production over the<br />
two cycles.<br />
Hatching Rate: The eggs in LSR♂♀ reflected the highest hatching rates of 92.44% and 84.13% for 1 st and<br />
2 nd production, respectively (Table 9). It was followed by LSR♂HSR♀ with 87.68% for the 1 st production<br />
and 83.60% for the 2 nd production. The LSRHSR♂♀ although having the highest number of eggs<br />
collected dropped to 3 rd , as it only showed 78.26% and 83.56% hatching rates. This finding suggests that<br />
most of the eggs collected in LSRHSR♂♀ died before they hatched. Significance on the comparison<br />
among treatment means was seen only in HSR♂♀ in 1 st and 2 nd productions. While LSRHSR♂♀,<br />
LSR♂♀, LSR♂HSR♀ and HSR♂LSR♀ were comparable with no significant differences.<br />
Survival Rate: The highest mean survival rate was attained by post-fry in LSR♂♀ with 81.83% in the 1 st<br />
cycle and 78.14% in the 2 nd cycle (Table 10). While, the lowest rate was obtained by post-fry in HSR♂♀<br />
with 47.53% in the 1 st cycle. The post-fry in LSRHSR♂♀, LSR♂HSR♀ and HSR♂LSR♀ on the other<br />
hand, obtained average mean survival rates of 68.64%, 66.46%, and 58.44%, respectively, in both cycles.<br />
The HSR♂♀ was significantly lower than the other treatments. While LSR♂♀, LSR♂HSR,<br />
LSRHSR♂♀ and HSR♂LSR♀ had comparable survival rates and revealed no significant differences. In<br />
the 2 nd cycle, the survival rate of post fry in LSR♂♀, LSRHSR♂♀ and LSR♂HSR♀ were comparable to<br />
each other and significantly higher than that of HSR♂♀. However, that of HSR♂LSR♀ was comparable<br />
to that of LSR♂HSR♀, but was significantly higher than that of HSR♂♀. Campbell et al. (1994) found<br />
that a relatively prolonged and severe stress in rainbow trout negatively affects progeny survival. The<br />
reduced progeny viability might be attributed to limited energetic reserves allocated to the eggs as well as
FINAL REPORTS: INVESTIGATIONS 2009–2011<br />
mechanical damage caused by the stressor (Schreck 2000). In this study, treatments with LSR males as in<br />
LSRHSR♂♀, LSR♂♀ and LSR♂HSR♀ showed better survival percentages than in the treatments with<br />
HSR males (HSR♂♀ and HSR♂LSR♀). Highest survival rate was attained in treatment with both LSR<br />
male and female breeders. The quality of breeders may have contributed to the quality of gametes<br />
produced and resulted in better quality fry which led to higher rates of survival. The lowest survival rate<br />
of post-fry was attained in the treatment with both HSR male and female breeders.<br />
Fry Length and Weight: After three weeks of rearing period, the swim-up fry were collected from the<br />
nursing hapas. The final length and weight of the post-fry in each treatment after three weeks are<br />
presented in Tables 11 and 12. Post-fry in LSR♂♀ group had the highest measured mean length of 20.91<br />
and 20.34 mm for both production cycles, respectively. This was followed by those in HSR♂LSR♀<br />
which had 19.38 mm in the 1 st cycle and 19.24 mm in the 2 nd . Post-fry in LSRHSR♂♀ and LSR♂HSR♀<br />
on the other hand, obtained 18.98 mm and 18.32 mm in the 1 st production, while 18.37 mm and 18.29 mm<br />
in the 2 nd production, respectively. The lowest value was obtained in HSR♂♀ which was 13.88 mm in<br />
the 1 st production. The LSR♂♀ had significantly higher mean length than other treatments. The<br />
LSRHSR♂♀, LSR♂HSR♀ and HSR♂LSR♀ had comparable post fry lengths but were significantly<br />
higher than that in HSR♂♀. As for the 2 nd cycle, mean length in the LSR♂♀ group was significantly<br />
higher than those of the other social groups. The length of HSR♂LSR♀ fry was also significantly higher<br />
than those of the remaining three treatments. Whereas, the mean length in LSRHSR♂♀ and LSR♂HSR♀<br />
were comparable to each other but were significantly higher than that in HSR♂♀. Similar differences in<br />
mean weight of fry was also observed among the groups.<br />
Overall, the highest length and weight was seen in the post-fry produced by both LSR breeders (LSR♂♀).<br />
The quality of the progeny produced is likely a reflection of broodstock quality. The LSR breeders during<br />
the isolation period showed high feeding response scores, and take a shorter period adjusting to stress as<br />
exhibited by immediate aggressiveness towards the feed provided. Along with this result, it was observed<br />
that good numbers can also be acquired as long as both the breeders were not under the HSR group. In<br />
this study, HSR♂LSR♀ with low stress response females and high stress response males produced bigger<br />
post-fry after three weeks than in LSRHSR♂♀ with equal combination of low and high stress response<br />
male and female breeders and LSR♂HSR♀ with low stress response males and high stress response<br />
females. This trend was probably influenced by the quality of female breeders having the low stress<br />
response as determined through feeding response observations.<br />
Study 3 – Effect of Broodstock Social Condition on the Growout Performance of Nile Tilapia<br />
Fingerlings<br />
The effect of the social condition on the grow-out performance of Nile tilapia fingerlings were evaluated<br />
by monitoring growth and performance of the fish stocks in earthen ponds produced from broodfish that<br />
show a low stress response (high feeding response scores during isolation) and high stress response (low<br />
feeding response scores during isolation). Figure 6 shows the growth pattern of both treatments in terms<br />
of the average body weight of the fish stock during the culture period.<br />
The figure shows a comparable growth between treatments during the first month of the culture period but<br />
treatment means started to differ on the second month until the end of the experiment. Fish stock from<br />
Treatment I which was from the broodstock with low stress response obtained a higher final mean weight<br />
of 111.27 g as compared to those produced from the high response group with a final mean weight of<br />
90.31 g. However, analysis of variance showed no significant d ifference among treatments at 5% level of<br />
significance (Table 13).<br />
During the growout period, fish produced from the broodstock with low stress response generally<br />
obtained better results as compared to the fish produced from high stress response. In terms of feed<br />
478
479<br />
FINAL REPORTS: INVESTIGATIONS 2009–2011<br />
conversion ratio (FCR), Treatment I had a lower FCR of 1.4 as compared to Treatment II with 1.7 at the<br />
end of the culture period. The low stress response group also had the higher extrapolated gross yield<br />
(1596.7 kg/ha versus 1221.7 kg/ha. On the other hand, survival of both treatments was almost identical.<br />
Despite the trends toward improved performance in fish derived from low stress response broodfish, the<br />
difference was not statistically significant, at least, within the 3-month culture period.<br />
Monitoring of water quality parameters was carried out throughout the duration of the study and results<br />
are presented in Table 14. The data gathered for dissolved oxygen in both treatments were in the ideal<br />
range for tilapia culture, although minimum reading of 1.8 was recorded, still, tilapia are known to<br />
tolerate low level of dissolved oxygen level but can affect growth if exposure occurs over a long period<br />
(Boyd 1990). The minimum and maximum readings for all other water parameters, including<br />
temperature, pH, ammonia-nitrogen, alkalinity, and phosphorus were desirable and similar between<br />
treatment groups. This is further underscored by the limited mortality seen in the experiment (> 70%<br />
survival).<br />
Study 4: Effect of Stocking Density on the Growth Responsiveness, and IGF-1 Expression on Nile<br />
Tilapia<br />
Water Quality: The temperature readings obtained in this experiment were within the optimal range of 20<br />
to 35 °C. The morning dissolved oxygen concentrations ranged from 2.36 to 4.14 mg/l while the<br />
afternoon readings of dissolved oxygen ranged from 2.04 to 7.89 mg/l. The Carlson’s technique of log<br />
transformation and calculation of the average Secchi disk readings gave a TSI of 63.95, which indicates<br />
the pond used in this study had sufficient nutrients to support fairly high natural productivity.<br />
Growth Parameters and Survival: Survival rates ranging from 61 to 70% did not differ among sexreversed<br />
tilapia reared at the different densities. Most of the observed mortalities occurred over the first<br />
10 days following stocking.<br />
At the initiation of the study average body weight and variation in weight was highest for the low density<br />
mixed sex group (control) relative to all other groups that consisted of sex reversed fish at similar or<br />
higher stocking densities. At harvest, the average final weight declined with increased stocking density.<br />
The low density (250 fish/m 3 ), mixed-sex (T1, 9.0 g) and sex-reversed (T2, 6.01g) had similar final body<br />
weights with significantly lower values for sex-reversed fish stocked at 500 (T3, 4.93 g) and 1000 (T4,<br />
4.66 g) fish/m 3 (P < 0.05; Table 15). The SGR of fish at different sampling periods in response to<br />
stocking density-related stress are shown in Table 16. The low density, sex-reversed fish (T2) had highest<br />
SGR over the course of the experiment. Graded declines in SGR was seen as stocking density increased.<br />
This difference was statistically significant during the second sampling interval (day 10-24). The overall<br />
SGR was 8 - 10 times greater in low density sex-reversed fish relative to the medium and high density<br />
group. Interestingly, the mixed-sex low density control (T1) had a lower SGR than the low density sexreversed<br />
male fish, suggesting energy may have been diverted to both gonadal development, particularly<br />
for females, as well as to growth in the mixed-sex population. The SGR observed in this study with lower<br />
density conforms with that shown previously (SGR of 1.7) in monosex fish reared in hapas (Little et al.<br />
2003). The findings of Chakraborty and Banerjee (2010) on SGR of fish in ponds was higher at 5.01%,<br />
in cages at 4.68%, and in cisterns at 4.8% with additional dietary protein sources.<br />
Data generated in this study demonstrated that fish stocked at the lowest density had better growth<br />
performance in terms of average weight and SGR over a 30-day nursery period. This was followed by<br />
sex-reversed fish stocked at the medium density with lowest performance occurring in fish stocked at the<br />
highest density. The results suggest that at higher densities the carrying capacity of fish may be limited<br />
due to space, which in turn, elicits a stress response accompanied by lower growth rate.
FINAL REPORTS: INVESTIGATIONS 2009–2011<br />
Hepatic IGF-1 Gene Expression: Baseline hepatic IGF-1 concentrations were recorded from the<br />
experimental fish reared in normal conditions. The IGF-1 mRNA concentrations of Nile tilapia were as<br />
follows: female in hapa (30.52 ng/µl), male in hapa (M-H, 31.5 ng/µl), sex-reversed in hapa (SR-H, 30.67<br />
ng/µl) and sex-reversed in pond (SR-P, 29.31ng/µl). These IGF-1 mRNA concentrations served as prestress<br />
reference values for the succeeding IGF-1 evaluations in fish from the density study.<br />
The levels of hepatic IGF-1 mRNA in Nile tilapia following 7 days (March 16 sampling) of rearing at<br />
different stocking densities are shown in Table 17. Hepatic IGF-1 mRNA levels was highest in low<br />
density, sex-reversed fish (T2, 31.59 ± 6.94 ng/µl) followed by the control, low density mixed-sex (T1,<br />
27.03 ± 5.24 ng/µl). These levels were similar to those pre-stress baseline values measured in fish in<br />
hapas and ponds (P > 0.05). Significantly lower IGF-1 mRNA concentrations were found in medium and<br />
high stocking densities with 14.44 ng/ µl ± 10.90 and 17.79 ng/µl ± 7.64, respectively (P < 0.05). Due to<br />
technical difficulties and/or RNA degradation we were unable to detect any IGF-1 mRNA taken from<br />
liver on the 15 day midpoint and 30-day endpoint sampling. A post-hoc analysis in low density, sexreversed<br />
fish (T2) on pre-stress and post-stress comparison showed that there was no significant increase<br />
in the level of IGF-1 mRNA (P>0.05).<br />
Insulin-like growth factor -1 (IGF-1) is the primary mediator of the growth promoting actions of growth<br />
hormone (GH) and its levels correlate well with growth in tilapia and other fishes and vertebrates (Picha<br />
et al. 2008a). It is an indirect measure of the average amount of growth hormone (GH) being produced by<br />
the body, thus, IGF-1 mirrors GH excesses and deficiencies, making it a useful indicator of average GH<br />
levels (American Association for Clinical Chemistry 2011). The lower hepatic IGF-1 gene expression in<br />
fish reared at the medium and high densities along with their reduced growth rates clearly indicates that<br />
density-dependent stress is likely suppressing growth through inhibition of IGF-1 and perhaps GH cell<br />
activity. Brockmark et al. (2007) showed that salmonid smolts maintained at low density had higher<br />
levels of IGF-1 than those reared at high density, which is consistent with the results shown here. They<br />
further pointed out that fish kept at low density were more silvery in color and had a lower mortality rate<br />
than fish reared at high density.<br />
Hepatosomatic and Cholecystic Indices: The liver of fish from the control, low density mixed-sex (T1)<br />
had the highest weight of 0.20 g, followed by low density, sex-reversed (T2, 0.11 g; P < 0.05; Table 18).<br />
The liver weight of fish from the medium density, sex-reversed (T3) and high density, sex-reversed (T4)<br />
was significantly lower at 0.08 and 0.07 g, respectively compared with low density fish. The length of<br />
liver in the control, low density, mixed-sex (T1) was longer at 3.24 mm compared to sex-reversed fish<br />
reared at the different densities (P < 0.05), a likely reflection of the larger body size of this fish both at the<br />
beginning and end of the experiment. There were no differences in liver length among sex-reversed fish<br />
held at the different densities. The HSI or ratio of liver weight to body weight, is a general indicator of<br />
energy reserves, namely glycogen and fat. Fish tend to have a lower HSI in a poor environment where<br />
limited nutrients might be available or where excessive energy is utilized. In gilthead seabream high<br />
stocking density reduces hepatosomatic index (from 2.26 down to 2.04)(Montero et al. 1999). The HSI<br />
values ranged from 0.961 to 1.10 in this study and there were no significant differences in the across<br />
density classes (P > 0.05), suggesting energy (or food) was not a limiting factor or that metabolic rate was<br />
not sufficiently elevated in fish held at higher densities, despite their lower growth rate.<br />
The size and fullness of the gall bladder is indicative of feeding status in fish. A large, distended bladder<br />
indicates a fish that has not eaten for some time while an empty, flabby bladder suggests a recent meal<br />
(Bowen 2001). An elevated cholecystic index (gall bladder:liver weight ratio) may be suggestive of bile<br />
retention, a decrease flow of bile and therefore susceptibility to cholelithiasis. Although gall bladder<br />
weight was slightly elevated in the mixed-sex, low density fish, no differences were observed in weight,<br />
length or cholecystic index among the sex-reversed fish held at different densities (Table 18). The<br />
480
481<br />
FINAL REPORTS: INVESTIGATIONS 2009–2011<br />
highest cholecystic index of 41.3% was recorded in high density, sex-reversed (T4) fish, but this was not<br />
significantly different from the other groups.<br />
Blood Glucose: Blood glucose levels generally rise with stress in most vertebrates to provide the<br />
necessary energy for metabolism, muscle activity and other functions needed for short term and long term<br />
adaptation to stress or the fight-or-flight response. In tilapia social stress leads to elevations in glucose<br />
relative to pre-stress levels (Porchas et al. 2009). Likewise, in sturgeon glucose levels rise following a<br />
stressor similar to that observed for bass with temperature and confinement stress (Solati and Falahatkar<br />
2007; Porchas et al. 2009). However some studies in fish reported a weak elevation of glucose (Davis<br />
and McEntire 2006), while others found no change (Jentoft et al. 2005) and even a decrease in glucose<br />
levels (Wood et al. 2005). In the present study, sex-reversed tilapia stocked at the medium density had<br />
signifcantly higher levels of blood glucose (94.50 mg/dl) relative to the low density (62.75 mg/dl) and<br />
high density (49.75 mg/dl), sex-reversed groups (P < 0.05; Table 19). The use glucose as a putative<br />
marker of density-dependent stress in tilapia may be inconclusive because tilapias tend to tolerate low<br />
glucose levels and maintain their blood glucose within a relatively narrow range. This may be attributed<br />
to tilapia being omnivorous tropical species as compared to carnivorous cold water species.<br />
Alternatively, we may have missed potential changes in glucose that may have occurred in response to the<br />
initial effects of stocking density.<br />
Hematological Profiles: Total red blood cell (RBC) and white blood cell (WBC) profiles in response to<br />
different rearing densities are shown in Table 20. Fish in the control, low density, mixed-sex group had<br />
the highest RBC count of 3.7 x 10 9 cells/ml of blood (P < 0.05). The RBC count in sex reversed fish<br />
declined in parallel with elevations in density, such that the low density group had an RBC count of 2.85<br />
x 10 9 cells, the medium density 2.45 x 10 9 cells, and the high density 2.0 x 10 9 cells per ml of blood (P <<br />
0.01). A virtually identical pattern was observed with WBC counts. Clearly, RBC and WBC counts<br />
decline with increasing density. A decrease of RBC count most likely suggests that higher density fish<br />
lack sufficient oxygen or our anemic despite adequate amounts in rearing water. This may contribute to<br />
lower growth rate associated with the stressor of higher densities. The variation in total WBC clearly<br />
indicates it is a good measure of density dependent stress responses. The lower WBC count with higher<br />
density may reflect release of epinephrine during stress which causes contraction of spleen and could<br />
hasten WBC destruction. Destruction of WBC may weaken of the immune system (Witeska 2005). Thus<br />
the high density, sex-reversed fish group which apparently were subjected to the most stressful condition<br />
in the course of the experiment, and had the lowest WBC count, may have a weakened immune system,<br />
which could enhance vulnerability to infection. It appears since the survival rates were similar among<br />
groups that this downstream effect was not fully apparent within the 30-day culture period. Had the<br />
culture period been extended perhaps mortality rates would have risen in fish at the higher densities<br />
CONCLUSION<br />
Through a series of studies we assessed if physiological and/or behavioral responses to stress can be used<br />
in the selection of broodstock with reproductive advantage in Nile tilapia, examined the effect of<br />
broodstock social condition on seed production and fingerling growout performance of tilapia, and<br />
evaluated the effects of stocking density on fingerling growth in nursery hapas, gene expression of IGF-1,<br />
and stress responsiveness of tilapia.<br />
In the first study, we investigated whether the outcomes the outcomes of competition for social<br />
dominance among Nile tilapia individuals can be predicted by evaluating the duration of appetite<br />
inhibition or the feeding response score (FRS) after transfer to isolation. In addition, it also investigates if<br />
eye color pattern (ECP) is related to the duration of behavioral stress response such as appetite inhibition.<br />
Clear establishment of dominance hierarchy was observed in 24 of the 25 pairs. From the 24 dominants,<br />
17 (70.83%) of them have shorter DAI during isolation compared to that of their conspecifics. This
FINAL REPORTS: INVESTIGATIONS 2009–2011<br />
indicates that tilapia with shorter DAI during the isolation had a greater possibility to win the fight for<br />
social dominance and therefore, dominance can be predicted using the DAI of the fish during isolation.<br />
Reduced growth rate of both dominant and subordinate fish, a well-described physiological end result of<br />
social stress, were observed one day after the social interaction. The greater weight losses in subordinate<br />
fish compared to dominant fish during and after the establishment of social hierarchy were mainly<br />
attributed to behavioral differences such as appetite rather than to differences in physical activities.<br />
Similarly, we found that animals with a higher FRS could be used as a predictor of social dominance.<br />
Again, the dominant fish had higher specific growth rates, which were accompanied by elevated<br />
expression of IGF-1, a central hormone mediating growth in tilapia and other vertebrates. Based on this<br />
research, feeding responses of broodstock in isolation are good predictors of social status, such that<br />
dominant individuals can be chosen in establishing breeding pairs.<br />
In study 2, we assessed the effect of broodfish behavioral stress response on seed production of tilapia<br />
through evaluation of their feeding response score during isolation.<br />
Results of the study demonstrate that behavioral stress response of Nile tilapia through evaluation of their<br />
feeding response can influence the number and quality of the seeds they produce. The most number of<br />
eggs, largest egg size, highest sperm motility and sperm density, and most number of fingerlings<br />
produced were collected in treatments that had both low stress response male and female breeders in the<br />
group. Higher rates of hatching and survival were also reflected in treatments that had either a low stress<br />
response male or female in the group. These results indicate that stress responsiveness of broodstock is a<br />
good predictor of fecundity and can be used to select fish with higher seed production. Broodstock<br />
individuals with low stress responsiveness, selected based on their increased feeding responses during an<br />
initial isolation period, can improve overall seed production in hatchery operations.<br />
A third study the effect of social condition of broodfish on grow-out performance of Nile tilapia<br />
fingerlings was evaluated. We found that a 3-month growout of sex-reversed fingerlings derived from low<br />
stress response breeders, had a higher average body weight, a better feed conversion ratio, and an overall<br />
higher yield per hectare than fingerlings derived from high stress response breeders. Although the<br />
differences between the two groups were not statistically significant after 3 months of growout the data<br />
suggests that fingerlings derived from low stress response broodstock pose an advantage over those<br />
derived from high stress response broodstock in overall production performance. This would likely be<br />
further amplified were fish growout extended to 4 or 5 months.<br />
An additional study investigated the effect of fingerling stocking density on the growth, gene expression<br />
of hepatic insulin-like growth factor-I (IGF-I), and stress responsiveness of tilapia reared in nursery<br />
hapas. The overall effect of density as a stressor showed that low density, sex-reversed group responded<br />
well in terms of growth, specific growth rate, survival, hematological profile (elevated red blood and<br />
white blood cell counts) and IGF-1 mRNA gene expressions compared to fish reared and confined at<br />
higher densities. These data suggest that densities of 250 fish/m 3 are best for growth of fingerlings in<br />
nursery hapas, and demonstrate that density-dependent stressors impair growth through inhibition of IGF-<br />
1 production. It is clear that IGF-1 mRNA is a strong growth rate indicator in the field and may also<br />
serve as an indirect measure of stress in tilapia. This along with certain hematological parameters may<br />
allow for assessment of environmental variables that limit stress and best promote growth in tilapia<br />
aquaculture.<br />
LITERATURE CITED<br />
Barcellos, L.J.G., Nicolaiewsky, S., de Souza, S.M.G. and Lulhier, F. 1999. Plasmatic levels of cortisol in<br />
the response to acute stress in Nile tilapia, Oreochromis niloticus (L.), previously exposed to chronic<br />
stress. Aquac. Res. 30: 437-444.<br />
482
483<br />
FINAL REPORTS: INVESTIGATIONS 2009–2011<br />
Barton, B.A. 2002. Stress in fishes: a diversity of responses with particular reference to changes in<br />
circulating corticosteroid. Integ. Comp. Biol. 42: 517-525.<br />
Bearden, H.J. and Fauquay, J.W. 1980. Applied Animal Reproduction. New Jersey, USA: Prentice Hall.<br />
Bernier, N.J. 2006. The corticotropin-releasing factor system as a mediator of the appetite-suppressing<br />
effects of stress in fish. General and Comparative Endocrinology, 146: 45-55<br />
Bero, R.M.L. 2008. Eye color as a predictor of social dominance in Nile tilapia (Oreochromis niloticus<br />
L.). Undergraduate Thesis. Central Luzon <strong>State</strong> <strong>University</strong>. 53 pp.<br />
BFAR. 2006. The Bureau of Fisheries and Aquatic Resources: Overview. Paper presented at the<br />
WorldFish Center and Philippine Partners meeting. Quezon City, Philippines.28 February 2006.<br />
Binuramesh, C., Prabakaran, M., Steinhagen, D. and Michael, R.D. 2005. Effect of chronic confinement<br />
stress on the immune responses in different sex ratio groups of Oreochromis mossambicus (Peters).<br />
Gen. Comp. Endocrinol.. 250, 47-59.<br />
Björnsson, B.T. 1994. Effects of stocking density on growth rate of halibut (Hippoglossus hippoglossus<br />
L.) reared in large circular tanks for three years. Aquaculture 123: 259-270.<br />
Blanchard, D.C., Sakai, R.R., McEwen, B., Weiss, S.M. and Blanchard, R.J. 1993. Subordination stress:<br />
behavioural, brain and neuroendocrine correlates. Behavioral Brain Research, 58: 113-121.<br />
Blanchard, D.C., Spencer, R.L., Weiss, S.M., Blanchard, R.J., McEwen B. and Sakai, R.R. 1995. Visible<br />
burrow system as a model of chronic social stress: behavioral and neuroendocrine correlates.<br />
Psychoneuroendocrinology, 20: 117- 134<br />
Bolasina, S., Tagawa, M., Yamashita, Y. and Tanaka, M. 2006. Effect of stocking density on growth,<br />
digestive enzyme activity and cortisol level in larvae and juveniles of Japanese flounder, Paralichthys<br />
olivaeus. Aquaculture 259: 432-443.<br />
Bonga S.E.W. 1997. The stress response in fish. Physiol. Rev. 77 (3):591-625<br />
Bowen, R. 2001. Secretion of bile and the role of bile acids in digestion. Retrieved on June 27, 2011 from<br />
http://www.vivo.colostate.edu/hbooks/pathphys/digestion/liver/bile.html.<br />
Boyd, C.E. 1990. Water Quality in Ponds for Aquaculture. Alabama Agriculture Experiment Station,<br />
Auburn <strong>University</strong>, Alabama, USA.<br />
Brockmark, S.L., Bohlin, N.T., Bjornsson, B.T. and Johnson, J.L. 2007. Effect of rearing density and<br />
structural complexity on the pre and post release performance of Atlantic salmon. Transaction of the<br />
American Fisheries Society 136:1453-1462.<br />
Burmeister, S.S., Kailasanath, V. and Fernald, R.D. 2007. Social dominance regulates androgen and<br />
estrogen receptor gene expression. Hormones and Behavior 51: 164 – 170.<br />
Campbell, P.M., Pottinger, T.G. and Sumpter, J.P. 1994. Preliminary evidence that chronic confinement<br />
stress reduces the quality of gametes produced by brown and rainbow trout. Aquaculture 120: 151–<br />
169.<br />
Chakraborty, S.B. and Banerjee S. 2010. Effect of stocking density on monosex Nile tilapia growth<br />
during pond culture in India. World Academy of Science, Engineering and Technology 68:1511-1515.<br />
Chandroo, K.P., Duncan, I.J.H. and Moccia, R.D. 2004. Can fish suffer?: perspectives or sentience, pain,<br />
fear and stress. Appl. Anim. Behav. Sci. 86: 225-250<br />
Contreras-Sanchez, W.M., Schreck, C.B., Fitzpatrick, M.S. and Pereira, C.B. 1998. Effects of stress on<br />
the reproductive performance of rainbow trout (Oncorhynchus mykiss). Biology and Reproduction 58:<br />
439 – 447.<br />
DiBattista, J.D., Levesque, H.M., Moon, T.W. and Gilmour, K.M. 2006. Growth depression in socially<br />
subordinate rainbow trout Oncorhynchus mykiss: more than a fasting effect. Physiol. Biochem. Zool.<br />
79: 675-687.<br />
Danting, M.J.C. 1992. Optimization of UV radiation treatment and cryopreservation of O. niloticus<br />
spermatozoa for induced gynogenesis. Unpublished Masteral thesis. Institute of Aquaculture,<br />
<strong>University</strong> of Stirling, Stirling Scotland. p. 74.<br />
Davis, K.B. and McEntire, M.E. 2006. Effect of photoperiod on feeding, intraperitoneal fat, and IGF-I in<br />
sunshine bass. Annual Meeting World Aquaculture Society 37:431-436.
FINAL REPORTS: INVESTIGATIONS 2009–2011<br />
Dean, D.B., Whitlow, Z. and Borski R.J. 2003. Glucocorticoid receptor upregulation during seawater<br />
adaptation in a euryhaline teleost, the tilapia (Oreochromis mossambicus). Gen. Comp. Endocrinol.<br />
132:112-118.<br />
Degger, B., Upton, Z., Soole, K., Collet, C. and Richarson, N. 2000. Comparison of recombinant<br />
barramundi and human insulin-like growth factor (IGF)-I in juvenile Barramundi (Lates calcarifer): In<br />
vivo metabolic effects, association with circulating IGF-binding proteins, and tissue localization. Gen.<br />
Comp. Endocrinol. 117: 395-403.<br />
Doyon, C., Gilmour, K.M., Trudeau, V.L. and Moon, T.W. 2003. Corticotropin-releasing factor and<br />
neuropeptide Y mRNA levels are elevated in the preoptic area of socially subordinate rainbow trout.<br />
General and Comparative Endocrinology, 133: 260-271.<br />
Earley, R.L., Blumer, L.S. and Grober, M.S. 2004. The gall of subordination: changes in gall bladder<br />
function associated with social stress. Proc. R. Soc. Lond. 271: 7-13.<br />
El-Azab, A.I., Adel-Ghafar, A.E., Nasr, M.T. and Issa, E.S. 1996. Effect of exogenous PGF2alpha and/or<br />
GnRH on libido and semen production of aged Friesian bulls. Journal of Veterninary Medicine 44 :<br />
529-533.<br />
Fox, H.E., White, S.A., Kao, M.H.F., and Fernald, R.D. 1997. Stress and dominance in a social fish.<br />
Journal of Neuroscience, 17: 6463-6469.<br />
Gabor, G., Sasser, R.G., Kastelic, J.P., Coulter, G.H. Everson, D.O., Falkay, G., Meezes, M., Bozo, S.,<br />
Cook, R.B., Volgyi, J.C., Barany, I. and Szaasz, F. 1998. Endocrine and thermal responses to GnRH<br />
treatment and prediction of sperm output and viability in Holstein-Friesian breeding bulls.<br />
Theriogenology 50: 177 – 183.<br />
Gómez-Laplaza, L.M. and Morgan, E. 2003. Theinfluence of social rank in angelfish, Pterophyllum<br />
scalare, on locomotor and feeding activities in a novel environment. Laboratory Animals, 37: 108-120.<br />
Goncalves-de-Freitas, E. 1999. Investimento reprodutivo e crescimento em machos de tilapia-do-Nilo.<br />
Tese de doutorado. Instituto de Biociencias, Universidade Estadual Paulista, Botucatu, SP.<br />
Höglund, E., Kolm, N. and Winberg, S. 2001. Stress-induced changes in brain serotonergic activity,<br />
plasma cortisol and aggressive behavior in Arctic charr (Salvelinus alpinus) is counteracted by L-<br />
DOPA. Physiological Behavior, 74: 381-389.<br />
Holfman, H.A. and Fernald, R.D. 2000. Social status controls somatostatin neuron size and growth. J<br />
Neurosci. 20: 4740-4744.<br />
Jentoft, S., Topp, N., Seeliger, M., Malison, J.A., Barry, T.B., Held, J.A., Roberts S. and Goetz, F. 2005.<br />
Lack of growth enhancement by exogenous growth hormone treatment in yellow perch (Perca<br />
flavescens) in four separate experiments. Aquaculture, 250: 471–479.<br />
Maeda, K. and Tsukamura, H. 2006. The impact of stress on reproduction: are glucocoticoids inhibitory<br />
or protective to gonadotropin secretion. Endocrinology 147: 1085-1086.<br />
Montero, D., Izquierdo, M.S., Tort, L., Robaina L. and Vergara, J.M. 1999. High stocking density<br />
produces crowding stress altering some physiological and biochemical parameters in gilthead<br />
seabream, Sparus aurata, juveniles. Fish Physiology and Biochemistry 20:50-60.<br />
Mostl, E. and Palme, R. 2002. Hormones as indicators of stress. Domestic Animal Endocrinology,<br />
23:67-74.<br />
Koolhaas, J.M., Korte, S.M., De Boer, S.F., Van Der Vegt, B.J., Van Reenen, C.G., Hopster, H., De Jong,<br />
I.C., Ruis, M.A.W. and Blokhuis, H.J. 1999. Coping styles in animals: current status in behavior and<br />
stress-physiology. Neurosci. Biobehav. Rev. 23: 925-935.<br />
Korzan, W.J., Ø. Øverli, and Summers, C.H. 2006. Future social rank: Forecasting status in the green<br />
anole (Anolis carolinensis). Acta Ethology, 9: 48-57.<br />
Korzan, W.J., Robison, R.R., Zhao, S. and Fernand, R.D. 2008. Color change as potential behavioral<br />
strategy. Horm. Behav. 54: 463-470.<br />
Kurokura, H. and Oo, K.M. 2008. Evaluation of fertilizing capacity of cryopreserved rainbow trout<br />
sperm. Fisheries Science 74: 621 – 626.<br />
Little, D.C. and Bhujel, R.C. 2003. Advanced nursing of mixed-sex and mono-sex tilapia (Oreochromis<br />
niloticus) fry, and its impact on subsequent growth in fertilized ponds. Aquaculture 221:265–2.<br />
484
485<br />
FINAL REPORTS: INVESTIGATIONS 2009–2011<br />
Øverli, Ø., Winberg, S., Damsgard, B. and Jobling, M. 1998. Food intake and spontaneous swimming<br />
activity in Arctic charr (Salvelinus alpinus): role of brain serotonergic activity and social interactions.<br />
Canadian Journal of Zoology, 76: 1366-1370.<br />
Øverli, Ø., Harris, C.A. and Winberg, S. 1999. Short-term effects of fights for social dominance and the<br />
establishment of dominant-subordinate relationship on brain monomines and cortisol in rainbow trout.<br />
Brain Behavior and Evolution, 54: 263-275.<br />
Øverli, Ø., Korzan, W.L., Höglund, E., Winberg, S., Bollig, H., Watt, M., Forster, G.L., Barton, B.A.,<br />
Øverli, E., Renner, K.J. and Summers, C.H. 2004. Stress coping style predicts aggression and social<br />
dominance in rainbow trout. Hormones and Behavior, 45: 235- 243.<br />
Øverli, Ø., Sorensen, C., Pulman, K.G.T., Pottinger, T.G., Korzan, W., Summers C.H. and Nilsson, G.E.<br />
2007. Evolutionary background for stress-coping styles: relationships between physiological,<br />
behavioural, and cognitive traits in non-mammalian vertebrates.neuroscience and Biobehavioral<br />
Reviews, 31: 396-412.<br />
Payne, A.I. and Collimson, R.I. 1983. A comparison of the biological characteristics of Sarotherodon<br />
niloticus (L.) with those of S. aureus (Steindachner) and other tilapia of the delta and lower Nile.<br />
Aquaculture 30: 335 – 351.<br />
Petrauskiené, L. 1996. Effects of social stress in rainbow trout at different stocking densities. (wwwheb:pac.dfo-mpo.gc.ca/congress/1996/Applied/Petrauskiene1.pdf.)<br />
Picha, M.E., Silverstein, J.T. and Borski, R.J. 2006. Discordant regulation of hepatic IGF-I mRNA and<br />
circulating IGF-I during compensatory growth in a teleost, the hybrid striped bass (Morone chrysops X M.<br />
saxatilis). Gen. Comp. Endocrinol. 147:196-205.<br />
Picha, M.E., Turano, M.J. Beckman, B.R. and Borski, R.J. 2008a. Hormonal biomarkers of growth and<br />
applications to aquaculture: A mini-review of growth hormone, insulin-like growth factor-I and IGF<br />
binding proteins as growth indicators in fish. NAJA 70: 196–211.<br />
Picha, M.E., Turano, M.J., Tipsmark, C.K. and Borski, R.J. 2008b. Regulation of endocrine and paracrine<br />
sources of insulin-like growth factors and growth hormone receptor during compensatory growth in a<br />
teleost fish. J. Endocrinol. 199:81-94.<br />
Porchas, M.M., Cordova, L.R.M. and Enriquez, R.R. 2009. Cortisol and glucose: reliable indicators of<br />
fish stress? Pan-American Journal of Aquatic Sciences, 4(2): 158-178.<br />
Pottinger, T.G. and Carrick, T.R. 2001. Stress responsiveness affects dominant-subordinate relationships<br />
in rainbow trout. Hormones and Behavior, 40: 419-427.<br />
Parikh, V.N., Clement, T.S. and Fernald, R.D. 2006. Androgen level and male social status in African<br />
cichlid, Astatotilapia burtoni. Behavioral Brain Research 166: 291 – 295.<br />
Schreck, C.B. 2000. Accumulation and long-term effects of stress. In: Moberg, G.P., Mench, J.A. (Eds.),<br />
The Biology of Animal Stress: Assessment and Implications for Welfare. CAB International,<br />
Wallingford.<br />
Siegfried, B., Frischknecht, H.R. and Waser, P.G. 1984. Defeat, learned submissiveness, and analgesia in<br />
mice: effects of genotype. Behaviour of Neural Biology, 421: 91-97.<br />
Sloman, K.A. Gilmour, K.M., Taylor, A.C. and Metcalfe, N.B. 2000. Physiological effects of dominance<br />
hierarchies within groups of brown trout, Salmo trutta, held under simulated natural conditions. Fish<br />
Physiol. Biochem., 22:11-20<br />
Sodeberg, R.W. and Meade, J.W. 1987. Effects of rearing density on growth survival and fin condition of<br />
Atlantic salmon. Prog. Fish-Cult. 49: 280-283.<br />
Solati, N.H and Falahatkar, B. 2007. Stress responses in sub-yearling great sturgeon to the air exposure,<br />
Caspian Journal of Environmental Sciences 5:99-103.<br />
Subasinghe, R.P. and Sommerville, C. 1992. Effects of temperature on the hatchability, development and<br />
growth of eggs and yolksac fry of Oreochromis mossambicus (Peters) under artificial incubation.<br />
Aquaculture and Fisheries Management 23: 31 – 39.<br />
Vahdatpour, T., Nazer Adl, K., Nezhad, Y.E., Sis, N.M., Riyazi S.R. and Vahdatpour S. 2009. Effects<br />
corticosterone intake as stress-alternative hormone on broiler chickens: Performance and blood<br />
parameters. Asian Journal of Animal & Veterinary Advances, 4(1):16-21. Academic Journals Inc.
FINAL REPORTS: INVESTIGATIONS 2009–2011<br />
Vera Cruz, E.M., Bero, R.M.L., Bolivar, R.B. and Borski, R.J., 2009. Eye color predicts social dominance<br />
in Nile Tilapia Oreochromis niloticus. Paper presented at the WAS AQUA 2009, Seattle, Washington,<br />
USA. February 14-18, 2009.<br />
Vera Cruz, E.M. and Brown, C.L. 2007. The influence of social status on the rate of growth, eye color<br />
pattern and insulin-like growth factor-I gene expression in Nile tilapia, Oreochromis niloticus. Horm.<br />
and Behav. 51: 611-619.<br />
Vera Cruz, E.M., Brown, C.L., Luckenbach, J.A., Picha, M.E., Bolivar, R.B. and Borski, R.J. 2006.<br />
Insulin-like growth factor-I cDNA cloning, gene expression and potential use as a growth rate<br />
indicator in Nile tilapia, Oreochromis niloticus. Aquaculture 251: 585-595.<br />
Volpato, G.L., Luchiari, A.C., Duarte, C.R.A., Barreto, R.E. and Ramanzini, G.C. 2003. Eye color as an<br />
indicator of social rank in the fish Nile tilapia. Braz. J. Med. Biol. Res. 36: 1659-1663.<br />
Winberg, S., Nilsson, G.E. and Olsén, K.H. 1992. Changes in brain serotonergic activity during hierarchic<br />
behavior in artic charr (Salvelinus alpinus L.) are socially induced. Journal of Comparative<br />
Physiology, 170, 93-99.<br />
Winberg, S., Carter, C.G., McCarthy, I.D., He, Z.-Y., Nilsson G.E. and Houlihan, D.F. 1993. Feeding<br />
rank and brain serotonergic activity in rainbow trout Oncorhynchus mykiss. Journal of Experimental<br />
Biology, 179: 197-211.<br />
Wood, A.W., Duan, C. and Bern, H.A. 2005. Insulin-like growth factor signaling in fish. International<br />
Review of Cytology, 243:215-85.<br />
486
Figure 1. Eye color pattern of Nile tilapia.<br />
487<br />
FINAL REPORTS: INVESTIGATIONS 2009–2011<br />
Figure 2. Average duration of appetite inhibition (minute) of the two competing groups. S-DAI, short<br />
DAI group; L-DAI, long DAI group. Average DAI were significantly different at P < 0.01. Mean ± SEM
FINAL REPORTS: INVESTIGATIONS 2009–2011<br />
Figure 3. Number of dominant fish in the two competing groups. S-DAI: short DAI group; L-<br />
DAI: long DAI group. Frequency difference was significantly different at P < 0.05.<br />
488
489<br />
FINAL REPORTS: INVESTIGATIONS 2009–2011<br />
Figure 4. Mean weight (± SEM) of dominant and subordinate fish before and<br />
after the social interaction. BI.Dom: dominant - before the interaction; AI.Dom:<br />
dominant – after the interaction; BI.Sub: Subordinate – before the interaction;<br />
AI.Sub: Subordinate - after the interaction.
FINAL REPORTS: INVESTIGATIONS 2009–2011<br />
Table 1. Summary of time before first acceptance of food and feeding latency score (i.e. feeding<br />
response score) during the isolation period, and weight of competing individuals before the interaction<br />
and 1, 7 and 14 days after the first interaction.<br />
Fish Code<br />
No.<br />
Initial<br />
Weight (g)<br />
Time before<br />
first food<br />
acceptance<br />
(hr)<br />
Latency<br />
score<br />
490<br />
Weight one day<br />
after first<br />
interaction (g)<br />
Weight seven<br />
days after first<br />
interaction (g)<br />
Weight 14<br />
days after first<br />
interaction (g)<br />
14 vs 1 24.4 23.9 2.39 3.51 21 22 25.1 23.4 30.5 25.5 35.1 28.0<br />
3 vs 15 23.1 23.1 0.73 1.74 25 23 25.5 22.9 29.4 25.5 31.3 27.3<br />
5 vs 18 25.1 25.0 2.47 3.44 23 23 25.3 24.2 26.2 27.4 30.7 28.3<br />
9 vs 7 19.9 20.1 1.70 5.00 23 13 21.8 22.1 28.1 25.1 29.6 27.2<br />
32 vs 8 22.6 21.5 0.16 3.73 21 19 23.1 20.5 25.9 23.1 28.5 24.9<br />
11 vs 6 28.4 29.6 1.47 6.80 22 22 28.8 30.5 31.9 31.6 33.9 33.5<br />
13 vs 4 24,.8 24.6 2.60 3.19 20 24 25.4 25.0 29.3 30.4 32.2 33.0<br />
16 vs 2 28.0 27.6 0.34 8.19 22 22 28.3 26.5 38.3 30.0 40.2 30.7<br />
45 vs 17 22.0 23.4 0.13 2.37 23 23 22.0 23.1 24.6 28.0 27.5 31.2<br />
10 vs 12 26.2 26.4 2.02 2.98 27 20 27.2 26.8 32.5 31.5 33.9<br />
59 vs 46 23.3 23.2 0.04 0.18 23 24 23.2 23.6 26.7 24.8 30.8 28.8<br />
33 vs 25 21.9 21.3 0.22 3.96 22 13 21.7 21.5 23.6 24.7 25.9 26.8<br />
38 vs 23 20.0 20.4 0.18 1.40 21 19 19.4 20.5 22.6 24.4 25.9 27.0<br />
40 vs 47 21.8 21.6 0.11 1.20 22 22 21.3 21.2 22.3 23.0 24.9 25.2<br />
29 vs 48 25.8 26.3 0.17 0.65 25 25 26.4 25.8 29.2 30.5 31.9 33.1<br />
37 vs 34 22.8 23.1 0.16 0.24 19 20 24.4 22.8 27.2 23.9 32.8 25.6<br />
26 vs 35 25.5 25.4 0.07 3.71 23 14 25.8 25.1 27.4 27.2 29.5 30.8<br />
24 vs 27 24.7 24.7 0.09 0.20 22 20 26.7 23.6 27.9 31.1<br />
28 vs 36 24.0 24.1 0.02 0.24 27 17 23.3 23.0 26.5 27.6 28.5 33.0<br />
49 vs 22 31.6 30.5 0.22 0.30 21 21 32.3 32.3 34.7 34.7 36.8 35.4<br />
53 vs 21 28.1 28.2 0.13 3.10 14 23 27.1 28.7 30.0 31.6 31.8 35.1<br />
43 vs 31 25.2 25.4 0.22 1.14 20 19 25.1 25.7 27.4 28.8 29.9 30.2<br />
50 vs 30 25.5 25.5 0.02 0.41 19 20 25.1 26.0 27.0 28.6 29.4 30.8<br />
44 vs 19 28.3 29.3 0.19 0.74 18 19 29.9 28.4 35.0 32.1 40.2 34.3<br />
58 vs 39 26.5 20.9 0.06 0.30 24 20 26.4 21.0 28.8 23.6 31.6 27.0<br />
57 vs 54 24.9 24.8 0.03 0.85 25 17 24.1 23.8 26.3 28.6<br />
51 vs 41 22.2 22.4 0.09 3.12 25 23 21.5 22.5 23.2 23.5 26.4 26.5<br />
42 vs 56 27.7 27.2 0.10 0.30 22 18 27.0 26.4 28.3 27.0 30.3 29.5<br />
52 vs 55 24.3 24.6 0.18 0.30 28 13 23.7 23.7 25.1 25.1 25.5 28.7
491<br />
FINAL REPORTS: INVESTIGATIONS 2009–2011<br />
Figure 5. Correlation between IGF-I mRNA level (ng/µl) and specific growth rate of<br />
the dominant and subordinate fish, n = 20, r = 0.60, P < 0.01
FINAL REPORTS: INVESTIGATIONS 2009–2011<br />
Table 2. Average size of the eggs collected in each treatment. LSR, low stress response group; LHR,<br />
high stress response group<br />
TREATMENT<br />
(SOCIAL GROUP)<br />
AVERAGE SIZE OF THE EGGS (mm)<br />
REPLICATION<br />
1 2 3<br />
492<br />
MEAN± SD<br />
LSRHSR♂♀ 2.44 2.42 2.52 2.46 b ± 0.0529<br />
LSR♂♀ 2.91 2.79 2.87 2.86 a ± 0.0611<br />
HSR♂♀ 2.16 2.16 c<br />
LSR♂HSR♀ 2.31 2.29 2.23 2.21 c ± 0.0862<br />
HSR♂LSR♀ 2.62 2.54 2.50 2.55 b ± 0.0611<br />
1 Analysis based on unequal number of replications<br />
2 Means with similar superscript letters are not significantly different at 5 % level of significance by LSD<br />
Table 3. Sperm motility scoring for the respective accumulated feeding<br />
response score by the male breeders.<br />
FEEDING RESPONSE SCORE MOTILITY SCORE<br />
0 3<br />
1 5<br />
2 4<br />
5 5<br />
6 10<br />
8 10<br />
10 10<br />
11 10<br />
12 10<br />
14 10<br />
15 10<br />
18 10<br />
1, 2
Table 4. Sperm density (sperm per ml) of the breeders under the<br />
accumulated feeding response score<br />
493<br />
FINAL REPORTS: INVESTIGATIONS 2009–2011<br />
FEEDING RESPONSE SCORE SPERM DENSITY (SPERM PER ML)<br />
0 2.025 x 10 9(i)<br />
1 3.100 x 10 9(h)<br />
2 3.125 x 10 9(h)<br />
5 3.750 x 10 9(g)<br />
6 4.200 x 10 9(feg)<br />
8 4.075 x 10 9(fg)<br />
10 4.375 x 10 9(fe)<br />
11 4.725 x 10 9(de)<br />
12 5.100 x 10 9(cd)<br />
14 5.425 x 10 9(c)<br />
15 9.400 x 10 9(b)<br />
18 1.063 x 10 10(a)<br />
Means with similar superscript letters are not significantly different at 5 % level of<br />
significance CV = 49.62%
FINAL REPORTS: INVESTIGATIONS 2009–2011<br />
Table 5. Spawning success during the 2 nd production cycle.<br />
TREATMENT<br />
(SOCIAL GROUP)<br />
SPAWNING SUCCESS DURING THE<br />
2 ND PRODUCTION CYCLE<br />
REPLICATION<br />
1 2 3<br />
494<br />
1, 2<br />
MEAN ± SD<br />
LSRHSR♂♀ 33.33 50.00 66.67 50.00 a ± 16.67<br />
LSR♂♀ 33.33 16.67 33.33 27.78 a ± 9.62<br />
HSR♂♀ 0 0 0 0.00 b ± 0.00<br />
LSR♂HSR♀ 66.67 33.33 50.00 50.00 a ± 16.67<br />
HSR♂LSR♀ 33.33 33.33 16.67 27.78 a ± 9.62<br />
1 Based on arcsine square root percentage transformation<br />
2 Means with similar superscript letters are not significantly different at 5% level of significance<br />
Table 6. Average eggs produced per female at one spawning.<br />
TREATMENT<br />
(SOCIAL GROUP)<br />
AVERAGE EGGS PRODUCED<br />
PER FEMALE<br />
REPLICATION<br />
1 2 3<br />
1, 2<br />
MEAN ± SD<br />
LSRHSR♂♀ 711 597 608 638.67 bc ± 62.88<br />
LSR♂♀ 813 1113 929 951.67 a ± 151.28<br />
HSR♂♀ 0 0 0 0.00 d<br />
LSR♂HSR♀ 632 417.5 436 495.17 c ±118.86<br />
HSR♂LSR♀ 730 946 715 797.00 ab ± 129.26<br />
1 Analysis based on log (x+1) transformation<br />
2 Means with similar superscript letters are not significantly different at 5% level of significance
Table 7. Total number of eggs produced in the 1 st and 2 nd production cycles.<br />
TREATMENT<br />
(SOCIAL<br />
GROUP)<br />
495<br />
FINAL REPORTS: INVESTIGATIONS 2009–2011<br />
NUMBER OF EGGS PRODUCED DURING THE 1 ST AND 2 ND CYCLES<br />
1 ST PRODUCTION 1<br />
MEAN 3<br />
2 ND PRODUCTION 2<br />
R1 R2 R3<br />
(± SD)<br />
R1 R2 R3<br />
LSRHSR♂♀ 2551 2421 4809 3260.33 a<br />
(± 1342.76)<br />
LSR♂♀ 3290 2016 2147 2484.33 a<br />
(± 700.80)<br />
HSR♂♀ 2142 2142.00 a<br />
MEAN 3<br />
(± SD)<br />
1423 1793 2435 1883.67 a<br />
(± 512.06)<br />
1626 1113 1858 1532.33 a<br />
(± 381.23)<br />
0 0 0 0.00 b<br />
LSR♂HSR♀ 609 704 1289 867.33 b<br />
(± 368.25)<br />
2528 835 1309 1557.33 a<br />
(± 873.39)<br />
HSR♂LSR♀ 1073 506 873 817.33 b<br />
(± 287.57)<br />
1459 1892 715 1355.33 a<br />
(± 595.31)<br />
1<br />
Analysis based on unequal number of replications<br />
2<br />
Analysis based on log (x+1) transformation<br />
3<br />
Means with similar superscript letters are not significantly different at 5 % level of significance<br />
Table 8. Total egg production in the two production cycles.<br />
TREATMENT<br />
(SOCIAL GROUP)<br />
TOTAL EGG PRODUCTION<br />
1 ST PRODUCTION 2 ND PRODUCTION<br />
MEAN ± SD MEAN ± SD<br />
LSRHSR♂♀ 3260.33 a ± 1342.76 1883.67 a ± 512.06 5144.00 a<br />
LSR♂♀ 2484.33 a ± 700.80 1532.33 a ± 381.23 4016.66 ab<br />
HSR♂♀ 2142.00 a 0.00 b 2142.00 c<br />
LSR♂HSR♀ 867.33 b ± 368.25 1557.33 a ± 873.39 2424.66 bc<br />
HSR♂LSR♀ 817.33 b ± 287.57 1355.33 a ± 595.31 2172.66 bc<br />
Means with similar superscript letters are not significantly different at 5% level of significance<br />
TOTAL EGG PRODUCED
FINAL REPORTS: INVESTIGATIONS 2009–2011<br />
Table 9. Hatching rate of the collected eggs over two production cycles.<br />
TREATMENT<br />
(SOCIAL<br />
GROUP)<br />
HATCHING RATE IN TWO CYCLES (%)<br />
1 ST PRODUCTION 1<br />
2<br />
MEAN ± SD<br />
ND PRODUCTION 2<br />
R1 R2 R3 R1 R2 R3<br />
496<br />
MEAN ± SD 3<br />
LSRHSR♂♀ 83.73 82.94 68.12 78.26 a<br />
± 8.79 87.7 86.11 76.88 83.56 a<br />
± 5.84<br />
LSR♂♀ 93.50 93.70 90.13 92.44 a<br />
± 2.01<br />
HSR♂♀ 0.00 76.00 0.00 76.00 a<br />
LSR♂HSR♀ 80.62 88.78 93.64 87.68 a<br />
± 6.58<br />
84.56 81.49 86.33 84.13 a<br />
± 2.45<br />
0 0.00 0.00 0.00 b<br />
± 0.00<br />
85.88 90.18 77.23 84.43 a<br />
± 6.60<br />
HSR♂LSR♀ 87.51 86.76 69.53 81.27 a<br />
± 10.17 78.48 79.33 84.34 80.72 a<br />
± 3.17<br />
1 Analysis based on unequal number of replications<br />
2 Analysis based on arcsine square root percentage transformation<br />
3 Means with similar superscript letters are not significantly different at 5 % level of significance<br />
Table 10. Survival rate of the post-fry after three weeks.<br />
TREATMENT<br />
(SOCIAL<br />
GROUP)<br />
SURVIVAL RATE (%) IN TWO CYCLES<br />
1 ST PRODUCTION 1<br />
MEAN 3/<br />
2 ND PRODUCTION 2<br />
(± SD)<br />
R1 R2 R3 R1 R2 R3<br />
MEAN 3<br />
(± SD)<br />
LSRHSR♂♀ 71.15 75.34 49.32<br />
65.27 a<br />
(± 13.97)<br />
72.17 81.82 61.93<br />
72.00 a<br />
(± 9.95)<br />
LSR♂♀ 75.93 87.50 82.07 81.83 a<br />
(± 5.79)<br />
72.88 75.56 80.52 78.14 a<br />
(± 3.88)<br />
HSR♂♀ 47.53 47.53 b<br />
0 0 0 00.00 c<br />
(± 0.00)<br />
LSR♂HSR♀ 55.5 68.47 69.98 64.65 a<br />
(± 7.96)<br />
64.44 78.8 63.41 68.26 ab<br />
(± 8.60)<br />
HSR♂LSR♀ 68.59 55.53 52.58 58.90 b<br />
(± 8.52)<br />
58.67 59.73 55.52 57.97 b<br />
(± 2.19)<br />
1<br />
Analysis based on unequal number of replications<br />
2<br />
Analysis based on arcsine square root percentage transformation<br />
3<br />
Means with similar superscript letters are not significantly different at 5 % level of significance
Table 11. Length of the post-fry after three weeks rearing period<br />
LENGTH OF THE POST-FRY AFTER 3 WEEKS (mm)<br />
TREATMENT<br />
(SOCIAL GROUP)<br />
497<br />
FINAL REPORTS: INVESTIGATIONS 2009–2011<br />
1 st PRODUCTION 1<br />
MEAN ± SD 3<br />
2 nd PRODUCTION 2<br />
R1 R2 R3 R1 R2 R3<br />
LSRHSR♂♀ 18.57 19.01 19.37<br />
LSR♂♀ 21.18 20.88 20.66<br />
18.98 b<br />
(± 0.40)<br />
20.91 a<br />
(± 0.26)<br />
18.61 18.17 18.33<br />
20.67 19.79 20.56<br />
HSR♂♀ 0.00 13.88 0.00 13.88 c 0.00 0.00 0.00<br />
18.32 b<br />
LSR♂HSR♀ 18.01 18.81 18.14<br />
(± 0.43)<br />
18.56 18.10 18.22<br />
HSR♂LSR♀ 19.68 19.31 19.14<br />
19.38 b<br />
(± 0.28)<br />
19.49 19.24 19.00<br />
1<br />
Analysis based on unequal number of replications<br />
2<br />
Analysis based on arcsine square root percentage transformation<br />
3<br />
Means with similar superscript letters are not significantly different at 5 % level of significance<br />
Table 12. Weight of the post fry after three weeks rearing period.<br />
WEIGHT OF THE POST FRY AFTER 3 WEEKS (g)<br />
TREATMENT<br />
(SOCIAL GROUP)<br />
1 st PRODUCTION 1<br />
MEAN ± SD 3<br />
2 nd PRODUCTION 2<br />
R1 R2 R3 R1 R2 R3<br />
MEAN ± SD 3<br />
18.37 c<br />
(± 0.22)<br />
20.34 a<br />
(± 0.48)<br />
0.00 d<br />
(± 0.00)<br />
18.29 c<br />
(± 0.24)<br />
19.24 b<br />
(± 0.25)<br />
MEAN ± SD 3<br />
LSRHSR♂♀ 0.26 0.26 0.27 0.26 b ± 0.0058 0.24 0.23 0.25 0.24 c ± 0.0100<br />
LSR♂♀ 0.33 0.30 0.30 0.31 a ± 0.0173 0.32 0.29 0.30 0.30 a ± 0.0153<br />
HSR♂♀ 0.00 0.11 0.00 0.11 d 0.00 0.00 0.00 0.00 d ± 0.0000<br />
LSR♂HSR♀ 0.23 0.24 0.24 0.24 c ± 0.0058 0.24 0.23 0.23 0.23 c ± 0.0058<br />
HSR♂LSR♀ 0.29 0.28 0.28 0.28 b ± 0.0058 0.28 0.27 0.27 0.27 b ± 0.0058<br />
1 Analysis based on unequal number of replications<br />
2 Analysis based on log (x+1) transformation<br />
3 Means with similar superscript letters are not significantly different at 5 % level of significance
FINAL REPORTS: INVESTIGATIONS 2009–2011<br />
Average Weight (g)<br />
Culture Days<br />
Figure 6. Average weight of Nile tilapia during 90 days of culture in ponds. Treatment I –<br />
fingerlings derived from low stress response broodfish; Treatment II - fingerlings derived from<br />
high stress response broodfish.<br />
498<br />
Treatment I<br />
Treatment II
499<br />
FINAL REPORTS: INVESTIGATIONS 2009–2011<br />
Table 13. Growth performance of Nile tilapia produced from broodstock with low and high<br />
stress responses.<br />
Parameters<br />
Treatments<br />
Initial weight (g) 0.199 + 0.10<br />
Sex-reversed fingerlings<br />
produced from Low Stress<br />
Response Broodfish (Mean<br />
+ SEM)<br />
Sex-reversed fingerlings<br />
produced from High<br />
Stress Response<br />
Broodfish (Mean + SEM)<br />
0.212 + 0.20<br />
Final average weight (g) 111.27 + 19.20 90.31 + 24.10<br />
Initial length (cm) 2.93 + 1.20 2.90 + 2.00<br />
Final average length (cm) 17.16 + 0.77 17.44 + 2.60<br />
Gain in weight (g) 111.07 + 19.10 90.10 + 23.90<br />
Daily gain in weight (g) 1.23 + 0.20 1.00 + 0.30<br />
Gain in length (cm) 14.2 + 0.80 14.5 + 0.70<br />
Daily gain in length (cm) 0.158 + 0.01 0.162 + 0.01<br />
Feed Conversion Ratio 1.4 + 0.08 1.7 + 0.23<br />
Specific Growth Rate (%) 5.51 + 0.33 5.66 + 0.55<br />
Yield per hectare (kg ha -1 ) 1596.7 + 219.0 1221.7 + 407.0<br />
Feed consumed per hectare (kg ha -1 ) 2205.3 + 326.30 1890.2 + 371.50<br />
Survival (%) 73.0 + 3.90 72.3 + 5.20
FINAL REPORTS: INVESTIGATIONS 2009–2011<br />
Table 14. Average minimum and maximum readings for water quality parameters during the culture<br />
period.<br />
Parameters<br />
Sex-reversed fingerlings<br />
produced from Low Stress<br />
Response Broodfish<br />
500<br />
Sex-reversed fingerlings<br />
produced from High Stress<br />
Response Broodfish<br />
Min Max Min Max<br />
Dissolved Oxygen (mg-L -1 ) 2.4 4.2 1.8 4.1<br />
Water Temperature ( o C) 28.2 30.1 28.1 30.0<br />
Hydrogen-Ion (pH) 7.3 9.0 7.3 9.1<br />
Total Ammonia Nitrogen (mg L -1 ) 0.051 0.162 0.054 0.190<br />
Secchi Disc Visibility (cm) 20 60 21.7 56.7<br />
Alkalinity (mg L -1 ) 107.7 159.0 101.0 151.3<br />
Phosphorus (mg L -1 ) 0.092 0.237 0.083 0.247<br />
Table 15. Body weight and survival of Nile tilapia reared at different stocking densities in<br />
hapas.<br />
Treatment Stocking<br />
Density<br />
(pcs)<br />
Initial Weight<br />
(g)<br />
Final Weight Survival<br />
(g) (%)<br />
1 250 7.30 a ± 1.69 8.13 x ± 2.05 87.6 a ±9.59<br />
2 250 4.15 b ± 0.16 6.75 xy ± 0.33 61.10 b ±15.49<br />
3 500 4.87 b ±0.77 4.94 z ± 0.25 70.05 b ±4.37<br />
4 1000 4.87 b ±0.77 4.66 z ± 0.18 67.00 b ±4.61<br />
Values represent mean ± standard deviation. 1 (control) - Low density, mixed-sex; 2 - Low density, sex-reversed; 3 -<br />
Medium density, sex-reversed; and 4 - High density, sex-reversed. Data with the same letter superscripts are not<br />
significantly different.
501<br />
FINAL REPORTS: INVESTIGATIONS 2009–2011<br />
Table 16. Specific growth rates (%) of Nile tilapia reared at different stocking densities during<br />
the course of the study<br />
Treatment Day 0-10<br />
Day 10-24 Day 24-30<br />
Day 0-30<br />
1 -0.039 ± 1.14 1.047 ab ± 0.91 -0.631 ± 7.98 0.349 ± 1.37<br />
2 1.449 ± 3.03 2.344 a ± 0.91 0.299 ± 1.75 1.637 ± 1.52<br />
3 0.158 ± 0.92 0.503 b ± 0.72 -0.135 ± 1.52 0.260 ± 0.27<br />
4 -0.473 ± 1.55 -0.084 b ± 0.33 0.382 ± 0.53 -0.120 ± 0.53<br />
Values represent percentage mean ± standard deviation on the specific growth rates of Nile tilapia reared at different<br />
stocking densities. 1 (control) - Low density, mixed-sex; 2 - Low density, sex-reversed; 3 - Medium density, sexreversed;<br />
and 4 - High density, sex-reversed. Data with the same letter superscripts are not significantly different.<br />
Table 17. Mean IGF-1 mRNA concentration (ng/µl) of Nile tilapia after 7 days of rearing at<br />
different stocking densities.<br />
Treatment Density Group IGF-1 mRNA (ng/µl)<br />
1 27.03<br />
I<br />
GF-1 mRNA levels (ng cDNA/µl total RNA) values are shown as mean ± standard deviation. Treatment groups: 1<br />
(control) – low density, mixed-sex; 2 - low density, sex-reversed; 3 - medium density, sex-reversed; and 4 - high<br />
density, sex-reversed. Data with the same letter superscripts are not significantly different.<br />
ab ±5.24<br />
2 31.59 a ±6.94<br />
3 14.44 b ±10.90<br />
4 17.79 b ±7.64<br />
Table 18. The hepatosomatic and cholecystic indices of Nile tilapia reared in different stocking densities.<br />
Treatment<br />
Density<br />
Liver Size and<br />
Hepatosomatic Index<br />
Weight<br />
(g)<br />
Length<br />
(mm)<br />
HSI<br />
(%)<br />
Gall Bladder Size and<br />
Cholecystic Index<br />
Weight<br />
(g)<br />
Length<br />
(mm)<br />
1 0.20 a ±0.02 3.55 a ±0.49 1.09 a ±0.31 0.05 a ±0.01 0.96 a ±0.43 26.4 a ±17.39<br />
2 0.11 b ±0.02 2.17 b ±0.45 1.11 a ±0.20<br />
CI<br />
(%)<br />
0.04 ab ±0.01 0.90 a ±0.23 31.5 a ±23.22<br />
3 0.08 c ±0.01 1.70 b ±0.28 0.96 a ±0.22 0.02 b ±0.004 0.67 a ±0.08 33.37 a ±21.23<br />
4 0.07 c ±0.01 2.07 b ±0.45 0.99 a ±0.07 0.03 b ±0.004 0.68 a ±0.05 41.3 a ±17.42<br />
Hepatosomal and cholecystic parameters shown as mean ± standard deviation. 1 (control) - low density, mixed-sex; 2 -<br />
low density, sex-reversed; 3 - medium density, sex-reversed; and 4 - high density, sex-reversed. Data with the same<br />
letter superscripts are not significantly different.
FINAL REPORTS: INVESTIGATIONS 2009–2011<br />
Table 19. Mean blood glucose levels of Nile tilapia reared at different stocking densities<br />
Treatment Density Blood Glucose (mg/dl)<br />
1 81.67 ab ± 11.05<br />
2 60.67 bc ± 16.01<br />
3 94.50 a ± 19.01<br />
4 45.75 c ± 15.09<br />
Blood glucose values are expressed as mean ± standard deviation. 1 (control) - low density, mixed-sex; 2 - low density,<br />
sex- reversed; 3 - medium density, sex-reversed; and 4 - high density, sex-reversed. Data with the same letter<br />
superscripts are not significantly different.<br />
Table 20. Total red blood cell and white blood cell counts (x 10 9 cells per ml of<br />
blood) of Nile tilapia reared at different stocking densities.<br />
Treatment Density RBC WBC<br />
1 3.7 a 1.576 a<br />
2 2.85<br />
Treatment groups: 1 (control) - low density mixed-sexed; 2 - low density sex-reversed; 3 - medium density, sexreversed;<br />
and 4 - high density sex-reversed. Values with the same letter superscripts are not significantly different.<br />
b 1.573 a<br />
3 2.45 b 1.125 b<br />
4 2.0 c 0.496 c<br />
502
503<br />
FINAL REPORTS: INVESTIGATIONS 2009–2011<br />
Sustainable Integrated Tilapia Aquaculture: Aquaponics and Evaluation of<br />
Fingerling Quality in Tabasco, Mexico<br />
Quality Seedstock Development/Experiment/09QSD02UA<br />
Wilfrido Contreras-Sanchez, Mario Fernández-Perez, Carlos A. Alvarez-González,<br />
Arlette Hernández Franyutti, Ulises Hernández-Vidal, and Alejandro Mcdonal-Vera<br />
Universidad Juárez Autónoma de Tabasco<br />
Villahermosa, México<br />
Kevin Fitzsimmons<br />
<strong>University</strong> of Arizona<br />
Tucson, Arizona, USA<br />
ABSTRACT<br />
Integrated aquaculture and agriculture can provide a more sustainable production system in virtually any<br />
instance where plants are to be irrigated. In situations where resources are limited, provision of fresh fish<br />
and nutrient rich effluent to irrigate and fertilize vegetables can be even more important. Likewise, high<br />
quality fingerlings are required for farmers to be successful in their cultivation efforts. Having an<br />
unbiased evaluator of fingerling quality is something that is best done by a university of other entity with<br />
the resources and no particular interest in any one source or strain. In this two part investigation we<br />
collaborated with two indigenous communities to install and begin operation of integrated tilapia and<br />
vegetable plots, initially with Nile tilapia and habanero peppers. A third system was constructed on the<br />
campus of the Universidad Juarez Autonomo de Tabasco in Villahermosa, Mexico for training of students<br />
and to share with members of the indigenous communities when they were brought to the campus for<br />
workshops.<br />
The first indigenous demonstration site at Caridad Guerrero was destroyed in a flood and had to be<br />
rebuilt. But after that, the projects have proven successful. The fish have grown quickly from fry to over<br />
60 g and the peppers have begun to yield edible produce. The peppers had a limited value in the local<br />
community. However by assisting the community to pickle the peppers and sell in jars greatly increased<br />
the value and allowed the product to be sold to larger communities. A simple enterprise budget was<br />
prepared and demonstrated that the integrated system as built should have a pay-back period of 2.05<br />
years.<br />
The evaluation of fry is still underway. However, of the seven strains, four were found with parasitic<br />
loads that would reduce growth. All seven were found to contain one or more opportunistic bacterial<br />
infections that would likely decrease growth if the fish were stressed.<br />
INTRODUCTION<br />
Conservation and multiple use of water has become an important practice, even in parts of the world<br />
with large natural water resources. However, adopting water conservation principals sometimes<br />
requires a strong cultural education component. In this regard, multiple institutions must cooperate<br />
with the common goal of sharing information, ideas, and local cultural practices in which to develop<br />
water re-use practices. The sharing of cultural knowledge and development of best management<br />
practices is necessary to establish community support as well as monitoring protocols needed for
FINAL REPORTS: INVESTIGATIONS 2009–2011<br />
long-term success. Water conservation efforts are readily adopted, especially in developing and at<br />
risk regions of the world, because of the demonstrated economic and environmental benefits. One<br />
area in which a greater level of cooperation and social-economic development can be achieved through<br />
water re-use efforts is in integrated aquaculture.<br />
Integrated aquaculture/agriculture systems are increasingly being promoted as an environmentally<br />
sustainable method for producing aquatic and terrestrial crops. The main goal of integrated aqua-agro<br />
systems is to improve nutrient cycling and energy flow in the system to obtain maximum benefits in the<br />
production of food and fiber (Chan, 1993). In integrated systems, wastes from one system component are<br />
recycled as inputs to another system component. Through waste recycling, the use of pond sediment<br />
organic matter as a crop fertilizer, and of pond water for irrigation, establishes linkages between<br />
aquaculture ponds and crops.<br />
The treatment and discharge of aquaculture effluent and resulting negative impacts on the environment<br />
remains a critical issue that is threatening the sustainable growth of the aquaculture industry. Even the<br />
discharge of effluent that has been treated to levels acceptable under limitation guidelines (ELGs) (EPA,<br />
2002) through the use of dilutions, may pose long-term environmental risks. The resulting negative<br />
impacts will continue to intensify in the future if sustainable practices are not developed in commercial<br />
scale. A new model (Integrated Aquaculture/Agriculture System model or IAAS) has been developed in<br />
order to face the above issues reusing organic matter and nitrogen dynamics through aquaculture and<br />
integrated conventional agriculture. Integrated aquaculture/agriculture systems can be used to treat<br />
aquaculture effluents, increase farm productivity through efficient resource utilization, spread financial<br />
risk through diversification and reduce system nutrient losses (Singh et al., 1996; Williams, 1997).<br />
The effluents from aquaculture have been shown to contain the necessary ratios and amounts of nutrients<br />
for many crop plants (Rakocy et al. 1993). Thus, significant economic and environmental benefits can<br />
be achieved by linking aquaculture and crop irrigation, as the environmental pollution from aquaculture<br />
is converted to a valuable source of fertilizers. This translates to a value-added process by which the<br />
nutrient laden effluents are converted to profitable plant biomass. A specific case has been identified for<br />
the proposed project with which to demonstrate the concepts of implementing water re-use concepts in<br />
indigenous local communities through the cooperation of multiple institutions and rural farmers. The<br />
Universidad Juarez Autonoma de Tabasco (UJAT) has already developed a partnership in aquaculture<br />
with several indigenous communities during the Condor-Eagle Project jointly supported by the<br />
Aquaculture <strong>CRSP</strong> and Heifer International. The proposed project will augment past efforts towards<br />
community based aquaculture, with the development and implementation of integrated agriculture-<br />
aquaculture practices. This project will provide a unique outlook on how water re-use in aquacultureagriculture<br />
systems facilitate social-economic development. Determining the degree to which the<br />
system improves household income is an especially important aspect of adoption.<br />
Fingerling quality has become a significant concern among tilapia farmers in Southeastern<br />
Mexico during recent years. The problem goes to the basics, since several fingerling vendors are<br />
introducing fish at a lower price; however, there is no evidence that farmers are buying good quality fish,<br />
nor is there evidence of the effectiveness of the masculinization treatment used. Members of the<br />
Association of Tilapia Producers of Tabasco have expressed their concern to the personnel of the<br />
Tropical Aquaculture Laboratory (UJAT) regarding bad quality fingerlings. This low-quality product is<br />
mainly perceived as low growth and low survival. There are also concerns that the “purity” of the line<br />
sold is not trustworthy. Some fingerling retailers assure they are selling “GIFT”, “YY males”,<br />
“Chitralada”, or Rocky Mountain” strains besides the local lines produced either by the <strong>State</strong> government<br />
(“Tabasco” line -supported through two consecutive A-<strong>CRSP</strong> projects-) or some private hatcheries<br />
(“Stirling”).<br />
504
505<br />
FINAL REPORTS: INVESTIGATIONS 2009–2011<br />
In Latin America, broodstock and seed supply have been identified as one of the major constraints to<br />
production increases. In the 2001 expert panel meeting organized by the PD/A <strong>CRSP</strong>, inadequate<br />
availability and quality of fry (and broodstock) were listed as a researchable priority. Part of the problem<br />
was solved by supporting a line selection program that allowed the formation of the “Tabasco line” that<br />
supports the fry production in the <strong>State</strong> Hatchery “Mariano Matamoros”. This is still an ongoing project<br />
supported mainly by the Tabasco Government and UJAT. However, the production of this hatchery is<br />
primarily used for restocking lagoons or ponds were the farmers do not require single sex populations (the<br />
government does not produce masculinized fingerlings). Some private farms have acquired the “Tabasco<br />
line” and they sell the masculinized fish. In the region, tilapia culture has become the principal<br />
aquacultural activity. Unfortunately, the introduction of different lineages of unknown origin and the lack<br />
of growth performance information has created disappointment and uncertainty. It is important to define a<br />
strategy to produce reliable information despite the origin of the fish. It is possible that the strains are<br />
originals, but the environmental conditions under which they were created may not favor performance<br />
under climatic conditions for Central America.<br />
To help farmers in Southeastern Mexico solve these speculations, we propose to conduct an objective,<br />
unbiased experiment to contrast growth performance, time to reach market size (300 gr), survival, total<br />
biomass and cost of production. With this information in hand, farmers will have information to base their<br />
decisions and purchase the fingerlings based either in cost of production or growth performance.<br />
OBJECTIVES<br />
1. To build three demonstration aquaculture – agriculture units in indigenous communities.<br />
2. To evaluate the success of local farmers adopting multi-use concepts to grow fish and plant crops.<br />
3. To provide an enterprise model documenting the cost – benefits of the integrated system.<br />
4. To compare at least five different tilapia strains used in Southeastern Mexico.<br />
5. To provide a protocol for tilapia strain evaluation based on growth and economic variables.<br />
6. To provide objective information for farmers to help decide which strains produce best results.<br />
METHODS AND MATERIALS<br />
Building three demonstration aquaculture – agriculture units in indigenous communities<br />
We built two integrated systems at indigenous communities. There was a third indigenous site selected but<br />
this site was impacted with severe flooding, causing several damages at the community level and at the<br />
project level, these flooding events were caused by the modification the riverbeds, we had the most severe<br />
raining season in 30 years, these condition remained all year around. Besides the adverse condition at the<br />
selected site the access routes had severe damages, which hampered the access to the site. Due to all these<br />
causes, we decided to built the third system at UJAT, where is a high zone free of flooding and it is only 30<br />
km away from the selected site, building the third system at UJAT increased the impact range through<br />
demonstration and training, UJAT site has been used as a training site for farmers and educational site for<br />
students.<br />
Demonstration and Evaluation of an Integrated Aquaculture – Agriculture System for Indigenous<br />
Farmers in Tabasco, Mexico<br />
To build three demonstration aquaculture – agriculture units in indigenous communities<br />
Two workshops were held at UJAT facilities the first workshop was given by Dr. Kevin Fitzsimmons, Dr.<br />
Dennis McIntosh and Dr. Rafael Martinez-Garcia on Integrated aquaculture agriculture systems. The<br />
second workshop was given by Tracy Holstein on the use of biofloc systems.
FINAL REPORTS: INVESTIGATIONS 2009–2011<br />
Three integrated aquaculture agriculture systems in two indigenous communities and one educational and<br />
demonstration site were built. An integrated aquaculture agriculture system was developed in an<br />
indigenous Chol community at Caridad Guerrero, Tacotalpa county in Tabasco. The effluents of 1500<br />
Tilapia, which were fed 2 twice per day at a rate of 5% biomass of Tilapia feed, contained in a 12 m 3<br />
geomembrane tank were used to irrigate habanero peppers twice per day. The peppers were grown from<br />
seedlings in three agricultural beds (10 x 15m), constructed with a 3% slope to capture effluents for<br />
analysis. Sampling of Tilapia and habanero were made each month, total length and weight were taken for<br />
the Tilapia and length (height) for habanero pepper. Total product harvest was accomplished by weighing<br />
the total production (fruit) of each plant.<br />
Assembling geomembrane tank for fish Preparing aquaponics growing bed<br />
The second site was developed at a Chontal indigenous community in Oxiacaque, Nacajuca county.<br />
Except for the agricultural unit measures (5 x 10m) most of the procedure was conducted as described for<br />
Caridad Guerrero.<br />
The third site an educational and demonstrative system was built at UJAT, following the procedure as<br />
was conducted in Caridad Guerrero.<br />
Tilapia and habanero seedlings were transferred to the sites at different times. Data for biomass crop<br />
production was analyzed in order to obtain mean values for each case. Analysis of water quality was<br />
performed monthly, only for the Caridad Guerrero system measuring nitrites, nitrates and ammonia in<br />
order to calculate total Nitrogen.<br />
Evaluation of the success of local farmers adopting multi-use concepts to grow fish and plant crops.<br />
The people performed a partial harvest of habanero peppers at the Caridad Guerrero site. Due to the delay<br />
suffered by flooding events the aquaculture system was reorganized and Tilapia are not ready to harvest<br />
yet.<br />
Alejandro MacDonal prepared a financial analysis assuming a 1500 kg tilapia and 100 kg habanero<br />
production (average production of a cycle) having variables such as initial investment, sales, expenses and<br />
costs, profits, earnings and finally profitability and investment recovery period. He also conducted a<br />
survey of the families involved to determine how the system would integrate to the entire household<br />
budget (time and financial).<br />
506
UJAT demonstration integrated system Pickled habeneros<br />
507<br />
FINAL REPORTS: INVESTIGATIONS 2009–2011<br />
We trained the group of Caridad Guerrero about producing a value added product with the habanero<br />
production. Specifically, we helped with a pickling process that preserves and increases the value of the<br />
habaneros from 40 pesos per kg to 200 pesos per kg. The peppers are put into bottles with oil, vinegar,<br />
local herbs and spices.<br />
To provide an enterprise model documenting the benefits of the integrated system<br />
A social economic evaluation of the community was performed at Caridad Guerrero, based on qualitative<br />
statistics with surveys and interviews. Final results are being tabulated and will then be translated to<br />
English.<br />
Evaluation of Different Tilapia Strains used in Southeastern Mexico and Incorporation of a Pure<br />
GIFT Line as Reference to Determine Quality of Tilapia Fingerlings.<br />
EXPERIMENT 1. Comparison of seven Tilapia lines used in South east Mexico<br />
Five thousand fingerlings were purchased anonymously. Seven strains of Nile Tilapia (Oreochromis<br />
niloticus) were obtained including: “GIFT”, “YY super males”, “Chitralada”, “Rocky Mountain”,<br />
“Stirling”, “ Pucté” and Tabasco line, from different hatcheries and/or retailers. Tilapia sizes were from<br />
0.3 to 1.3 g. Initial weight and total length among the lines was used as co-variables in order to avoid<br />
statistical bias. Monthly samples were made in order to evaluate growth in weight and length. 1000<br />
Tilapias were placed randomly in mosquito-mesh hapas for a month, at the end of this period all fish were<br />
counted in order to evaluate survival and the tilapias were transferred to ½” mesh hapas. Tilapias were fed<br />
three times per day with a ratio of 5% total biomass. Feed ratio was adjusted each month. Water exchange<br />
was done at 10% ratio weekly. 2000 Tilapias were used to evaluate possible infections for most common<br />
bacterial pathogens and parasites (Streptococcus, Trichodina, Columnaris, or Aeromonas), ich disease<br />
(Ichthyophthirius multifilis), and parasites. Five fish were sampled for bacterial infection sampling skin,<br />
liver, spleen and kidney. Also five fish were analyzed for parasites diseases analyzing superficial tissue<br />
from body and gills. Samples were taken and analyzed by the personnel of the Aquatic Sanitation<br />
Laboratory (UJAT).<br />
Statistical analysis<br />
The experimental design contemplated for this experiment was a random block design. Three factors were<br />
considered to be blocked (length, weight and date of initiation). The response variables (Length and<br />
Weight) were tested to determine if the assumptions for parametric analysis were met; if so, contrasts will<br />
be performed using ANOVA, otherwise data will be transformed to meet the requirements. Total biomass
FINAL REPORTS: INVESTIGATIONS 2009–2011<br />
will be compared using an ANOVA test and Survival results will be compared among treatments by Chi<br />
square test using contingency tables.<br />
EXPERIMENT 2. Evaluation of three Tilapia lines at commercial farming level<br />
The three best Tilapia lines evaluated in the first experiment were tested at the farm El Pucte del<br />
Usumacinta S.A. de C.V., located in the Emiliano Zapata municipality, Tabasco. The fry size was<br />
dependent on the size of the system to be used, an estimate of 20,000 fish per line were placed in earthen<br />
ponds of 50 x 20 m with two replicates per line with a density of 10,000 fish per pond. The fish were kept<br />
in these ponds for six months for growth. Monthly samples were collected of each replicate for six<br />
months. Total length and weight were taken of a subsample of 100 fish of each replicate. Fish were fed<br />
three times per day at a ratio of 5% total biomass. The amount of feed was adjusted monthly. Water<br />
exchange was performed at 10% once a week.<br />
Statistical analysis<br />
The primary variables (weight and length) were tested in order to determine if data match parametric<br />
analysis assumptions. In case of matching an ANOVA was performed, in contrary the Kruskall-Wallis<br />
test will be performed. The total biomass will be compared using an ANOVA and survival results will be<br />
analyzed through Chi-square using contingency tables.<br />
RESULTS<br />
Demonstration and Evaluation of an Integrated Aquaculture – Agriculture System for<br />
Indigenous Farmers in Tabasco, Mexico<br />
A total of 80 participants participated in the Integrated<br />
aquaculture agriculture and bioflocs workshops. The<br />
participants included; professors, students, local farmers, and<br />
extension government agents.<br />
In Caridad Guerrero habanero harvest started with early<br />
producing plants, the rest are flowering and all still growing,<br />
Tilapia reached a medium of 45 g. Nitrogen analysis showed<br />
high retention from soil matrix and plants. Oxiacaque system is<br />
showing excellent progress, habanero plants reached 18 cm and<br />
Tilapia 34 g. At UJAT Tilapia achieved 20g and habanero<br />
plants 16 cm. Nitrogen analyses were carried out at Caridad<br />
Guerrero and Oxiacaque, where high amounts of nitrogen<br />
(around 70%) was retained by soil matrix and uptake by plants.<br />
Due to problems with soil compaction, some of the slope was<br />
lost and capture of effluents was not precise at the<br />
demonstrative site.<br />
It turned out that the coconut husk material was especially useful for trapping the effluent and slowly<br />
releasing the liquid and nutrients to the sand/silt/husk mix. The peppers, and other vegetables, quickly<br />
grew and the root mass helped to bind the materials and further enhance the effluent capture and nutrient<br />
availability. The mix eventually formed a type of soil much faster than were seen in the other vegetable<br />
plots that had been scoured in the flood. Nitrogen analysis showed high retention from the soil matrix<br />
and plants.<br />
508
509<br />
FINAL REPORTS: INVESTIGATIONS 2009–2011<br />
Two surveys and one interview were carried out to 80% (100 families) of the population in Caridad<br />
Guerrero in order to achieve data for the social economic analysis and describe the impact of the project<br />
at the community.<br />
Evaluation of the success of local farmers adopting multi-use concepts to grow fish and plant crops.<br />
The value added product developed in the Caridad Guerrero project (Fig. 8) together with the<br />
commercialization of the raw habanero and the Tilapia production are the final products of the system.<br />
The results of the financial analysis showed that the investment recovery period will be in the second year<br />
of production, there is a profitability of 0.48 and a average earnings of $23, 308.33 (Fig. 9)<br />
Evaluation of Different Tilapia Strains used in Southeastern Mexico and Incorporation of a Pure<br />
GIFT Line as Reference to Determine Quality of Tilapia Fingerlings.<br />
All seven lines were bought that are available in the region: “GIFT”, “super males YY”, “Chitralada”,<br />
“Rocky Mountain”, “Stirling”, “Pucté” and “Tabasco line”. Tilapias (1000 per hapa) were placed in<br />
mosquito mesh for a month. At the beginning Tilapia were sampled in order to determine differences in<br />
length and weight among the lines. At the end of the first month a sampling was conducted in order to<br />
evaluate growth. Fish were counted and placed in a ½” mesh hapas.<br />
In the present study the statistical analysis indicates the existence of statistic differences among the<br />
different Tilapia Lines at the beginning of the trial (ANOVA; p
FINAL REPORTS: INVESTIGATIONS 2009–2011<br />
The multifactorial analysis indicated that there is no statistical difference among Tilapia lines (ANCOVA;<br />
p
DISCUSSION<br />
511<br />
FINAL REPORTS: INVESTIGATIONS 2009–2011<br />
The results in the present study indicated that the growth of the seven Tilapia lines evaluated and which<br />
initiated with differences in weight and size was not significative, by contrary Orozco 1998 and Castro et<br />
al., 2004 found statistical differences using Tilapia frys of weight under 0.5 g when comparing three<br />
different lines of Tilapia.<br />
In which respect to the growth in weight of the seven Tilapia lines there was no significative differences<br />
at the thirty first days of the experiment between the different lines, the Tabasco line had the best growth<br />
in weight and size. For the second month of sampling (60 days) the obtained results were very similar for<br />
growth, the Tabasco line had the best growth in weight and size, Castro et al., 2004 found statistical<br />
differences during the first and second month of experiment in growth of the three Tilapia lines evaluated<br />
being for this case Oreochromis mossambicus the best in growth in weight and size.<br />
Orozco 1998 described that smaller sizes could be associated with mortalities caused by predators and<br />
parasites, this could explain the mortalities we had in our study where Tilapia mortalities were associated<br />
to parasites and bacterial infection during the first month of the experiment.<br />
We plan to publish these results in a peer reviewed science article once the trial is completed in the<br />
Oxiacaque village and supported with additional data collection of soil quality and nutrient levels. We<br />
were asked to present our findings at an aquaponics conference in Cancun, Mexico. Fitzsimmons made<br />
one presentation on September 22, 2011 and two graduate students from Universidad Juarez Autonoma<br />
de Tabasco made a separate presentation on September 23, 2011. The presentations specifically mention<br />
the support of USAID and the <strong>AquaFish</strong> Collaborative Research Support Program.<br />
Mercado Mundial en la Producción de Tilapia (World Market Tendencies of Tilapia Production). – Dr.<br />
Kevin Fitzsimmons, USA<br />
and<br />
DESARROLLO DE PRACTICAS DE ACUACULTURA SUSTENTABLE EN TABASCO, MÉXICO USANDO<br />
TECNOLOGÍA DE SISTEMAS INTEGRADOS AGRÍCOLAS – ACUÍCOLAS (Developing Sustainable Practices<br />
for Aquaculture in Tabasco Mexico, Using Integrated Agriculture-Aquaculture Integrated Systems<br />
Technology). – María Fernanda Cifuentes Arroyo and Maria Contreras.<br />
In January 2012, Fitzsimmons returned to Tabasco to attend Rafael Martinez’s wedding and was<br />
interviewed by local newspaper regarding the project. See appendix.<br />
http://www.diarioavancetabasco.com/Default.aspx?ClaveIdioma=1&Noticia=6&Clave=1&Fecha=10/01/<br />
2012
FINAL REPORTS: INVESTIGATIONS 2009–2011<br />
Aquaponics bed with habanero peppers Tilapia at first sampling date<br />
LITERATURE CITED<br />
Chan, G.L. 1993. Aquaculture, ecological engineering: lessons from China. Ambio 22:491-494.<br />
Rakocy, J., Hargreaves, J. and Bailey, D. 1993. Nutrient accumulation in a recirculating aquaculture<br />
system integrated with hydroponic vegetable production. pp. 148-158 In: Techniques for Modern<br />
Aquaculture (J.K. Wang, Ed.) St. Joseph, MI:ASAE Pub. 02-93.<br />
Singh, S., Marsh, L.S., Vaughan, D.H., Libey, G.S., 1996. A computer simulation model to optimize<br />
greenhouse size for an integrated (fish production, hydroponics) system. Transactions of the ASAE<br />
39, 2241–2248.<br />
U.S. Environmental Protection Agency (USEPA). 2002. Development Document for Proposed Effluent<br />
Limitations Guidelines and Standards for the Concentrated Aquatic Animal Production Industry Point<br />
Source Category. U.S. Environmental Protection Agency, Washington, DC.<br />
Williams, M.J., 1997. Aquaculture and sustainable food security in the developing world. In: Bardach,<br />
J.E. (Ed.), Sustainable Aquaculture. Wiley, New York, pp. 15–51.<br />
512
Length (cm)<br />
Figure 1. Total growth length of Tilapia from Caridad Guerrero system<br />
Weight (g)<br />
16<br />
14<br />
12<br />
10<br />
8<br />
6<br />
4<br />
2<br />
0<br />
70<br />
60<br />
50<br />
40<br />
30<br />
20<br />
10<br />
0<br />
1 2 3 4 5<br />
Months of sampling<br />
1 2 3 4 5<br />
Months of sampling<br />
Figure 2. Total growth weight of Tilapia from Caridad Guerrero system<br />
513<br />
FINAL REPORTS: INVESTIGATIONS 2009–2011
FINAL REPORTS: INVESTIGATIONS 2009–2011<br />
Height (cm)<br />
35<br />
30<br />
25<br />
20<br />
15<br />
10<br />
5<br />
0<br />
1 2 3 4 5<br />
Months of sampling<br />
Figure 3. Growth in height of Habanero plants for the five months of sampling at Caridad<br />
Guerrero system<br />
NITRATES<br />
mg/L<br />
NITRITES<br />
mg/L<br />
Tilapia<br />
tank 0.0 0.16 0.45<br />
PLOT 1 4.0 0.13 0.74<br />
PLOT 2 3.5 0.10 0.74<br />
PLOT 3 4.0 0.13 0.46<br />
514<br />
PLOT 1<br />
PLOT 2<br />
PLOT 3<br />
AMMONIA<br />
mg/L<br />
Figure 4. Water quality parameters from different source at Caridad Guerrero system for August
Length (cm)<br />
Figure 5. Total growth length of Tilapia from Oxiacaque system<br />
Weight (g)<br />
16<br />
14<br />
12<br />
10<br />
8<br />
6<br />
4<br />
2<br />
0<br />
70<br />
60<br />
50<br />
40<br />
30<br />
20<br />
10<br />
0<br />
1 2 3 4<br />
Months of sampling<br />
1 2 3 4<br />
Months of sampling<br />
Figure 6. Total growth weight of Tilapia from Oxiacaque system<br />
515<br />
FINAL REPORTS: INVESTIGATIONS 2009–2011
FINAL REPORTS: INVESTIGATIONS 2009–2011<br />
Height (cm)<br />
30<br />
25<br />
20<br />
15<br />
10<br />
5<br />
0<br />
1 2 3<br />
Months of sampling<br />
Figure 7. Growth in height of Habanero plants for the three months of sampling at Oxiacaque system<br />
Figure 8. Pickled Habanero developed by farmers of Caridad Guerrero group<br />
516
517<br />
FINAL REPORTS: INVESTIGATIONS 2009–2011<br />
Concept 0 1 2 3 4 5<br />
Initial<br />
investment<br />
Sales<br />
Expenses<br />
and costs<br />
Profits<br />
Earnings<br />
$47,925<br />
$38,220<br />
$47,925<br />
$-9,705<br />
$-9,705<br />
$38,220<br />
$25,525<br />
$12,695<br />
$2,990<br />
Average<br />
earnings<br />
$64,470<br />
$30,250<br />
$34,220<br />
$37,210<br />
$64,470<br />
$30,250<br />
$34,220<br />
$71,430<br />
$23,308<br />
Profitability 0.48<br />
Investment<br />
Recovery<br />
Period (years)<br />
$64,470<br />
$30,250<br />
$34,220<br />
$105,650<br />
$64,470<br />
$30,250<br />
$34,220<br />
Figure 9. Financial Analysis of the aquaponia production for the Caridad Guerrero system<br />
2.05<br />
$139,850
FINAL REPORTS: INVESTIGATIONS 2009–2011<br />
Table 1. Bacterial and parasitic diseases presents in the seven Tilapia lines of the experiment<br />
Line Bacteria found Parasites found<br />
1 Pseudomonas fluorescens, Aeromonas hydrophila. Monogene and tricodina<br />
2 Pseudomonas fluorescens, Aeromonas sobria, Aeromonas<br />
hydrophila.<br />
Monogene and tricodina<br />
3 Pseudomonas fluorescens, Plesiomonas shigelloides,<br />
Aeromonas sobria, Moraxella spp y Aeromonas hydrophila.<br />
Monogene and tricodina<br />
4 Aeromonas hydrophila, Aeromonas sobria,Plesiomonas Absent<br />
shigelloides y Pseudomonas fluorescens.<br />
5 Aeromonas sobria, Pseudomonas putida, Plesiomonas<br />
shigelloides, Pseudomonas aeruginosa y Pseudomonas<br />
fluorescens.<br />
6 Pseudomonas fluorescens, Aeromonas hydrophila,<br />
Burkholderia cepacia, Pseudomonas putida y Photobacterium<br />
damselae.<br />
7 Pseudomonas putida, Aeromonas hydrophila y Pseudomonas<br />
aeruginosa.<br />
Weight (g)<br />
1.6<br />
1.4<br />
1.2<br />
1.0<br />
0.8<br />
0.6<br />
0.4<br />
0.2<br />
0.0<br />
(d)<br />
(c)<br />
1 2 3 4 5 6 7<br />
Lines of tilapia<br />
Figure 8. Initial weight of seven Tilapia lines tested in this study<br />
(f)<br />
(a)<br />
(e)<br />
518<br />
(b)<br />
(c)<br />
Monogene<br />
Monogene and tricodina<br />
Monogene, tricodina and<br />
other protozoa,<br />
unidentified parasites<br />
ciliates
Length (cm)<br />
5<br />
4<br />
3<br />
2<br />
1<br />
0<br />
(e)<br />
(c)<br />
(g)<br />
1 2 3 4 5 6 7<br />
Lines of tilapia<br />
Figure 9. Initial total length of the seven Tilapia lines tested on this study<br />
Weight (g)<br />
16<br />
14<br />
12<br />
10<br />
8<br />
6<br />
4<br />
2<br />
0<br />
(b)<br />
(a)<br />
(c)<br />
(a)<br />
(a)<br />
(f)<br />
(b)<br />
519<br />
(d)<br />
(a)<br />
1 2 3 4 5 6 7<br />
FINAL REPORTS: INVESTIGATIONS 2009–2011<br />
Lines of tilapia<br />
Figure 10. Weight growth of the seven Tilapia lines evaluated in this study during the first month<br />
of the experiment<br />
(a)<br />
(b)
FINAL REPORTS: INVESTIGATIONS 2009–2011<br />
Length (cm)<br />
Weight (g)<br />
10<br />
8<br />
6<br />
4<br />
2<br />
0<br />
35<br />
30<br />
25<br />
20<br />
15<br />
10<br />
5<br />
0<br />
(c)<br />
(b)<br />
(d)<br />
(a)<br />
1 2 3 4 5 6 7<br />
(c)<br />
Lines of tilapia<br />
Figure 11. Growth in length of the seven Tilapia lines tested in this study during the second<br />
month of the experiment<br />
(c)<br />
(ab)<br />
(c)<br />
(a)<br />
(bc)<br />
520<br />
(a) (a)<br />
1 2 3 4 5 6 7<br />
Lines of tilapia<br />
Figure 12. Growth in weight of the seven Tilapia lines tested during the second month of this<br />
experiment<br />
(a)<br />
(a)
Length (cm)<br />
Weight (g)<br />
14<br />
12<br />
10<br />
8<br />
6<br />
4<br />
2<br />
0<br />
100<br />
80<br />
60<br />
40<br />
20<br />
0<br />
(c)<br />
(b)<br />
(c)<br />
(a)<br />
(b)<br />
1 2 3 4 5 6 7<br />
521<br />
FINAL REPORTS: INVESTIGATIONS 2009–2011<br />
Lines of tilapia<br />
Figure 13. Growth in length of the seven Tilapia lines tested in this study during the second<br />
month of the experiment<br />
(c)<br />
(ab)<br />
(bc)<br />
(a)<br />
(ab)<br />
Lines of Tilapia<br />
Figure 14. Growth in weight of the seven Tilapia lines tested in this study for the third month<br />
(a)<br />
(a)<br />
(ab)<br />
1 2 3 4 5 6 7<br />
(ab)
FINAL REPORTS: INVESTIGATIONS 2009–2011<br />
Length (cm)<br />
Weight (g)<br />
20<br />
18<br />
16<br />
14<br />
12<br />
10<br />
8<br />
6<br />
4<br />
2<br />
0<br />
(cd)<br />
(bc)<br />
(d)<br />
(a)<br />
(ab)<br />
1 2 3 4 5 6 7<br />
Lines of tilapia<br />
Figure 15. Growth in length of the seven Tilapia lines tested in this study for the third month<br />
200 (d)<br />
150<br />
100<br />
50<br />
0<br />
(c)<br />
(c)<br />
(a)<br />
(ab)<br />
Lines of Tilapia<br />
Figure 16. Growth in weight during the 120 days of the experiment for the seven Tilapia lines<br />
tested in this study.<br />
522<br />
(b)<br />
(ab)<br />
1 2 3 4 5 6 7<br />
(c)<br />
(ab)
Length (cm)<br />
Weight (g)<br />
25<br />
20<br />
15<br />
10<br />
5<br />
0<br />
(d)<br />
(cd) (cd)<br />
(a)<br />
(ab) (b)<br />
1 2 3 4 5 6 7<br />
523<br />
FINAL REPORTS: INVESTIGATIONS 2009–2011<br />
Lines of Tilapia<br />
Figure 17. Growth in length during the 120 days of the experiment for the seven Tilapia lines<br />
tested in this study.<br />
200 (d)<br />
150<br />
100<br />
50<br />
0<br />
(c)<br />
(c)<br />
(a)<br />
(ab)<br />
1 2 3 4 5 6 7<br />
Lines of Tilapia<br />
Figure 18. Average growth value in weight of the seven lines of Tilapia during the 150 days of<br />
the experiment<br />
(b)<br />
(c)<br />
(c)
FINAL REPORTS: INVESTIGATIONS 2009–2011<br />
Length (cm)<br />
25<br />
20<br />
15<br />
10<br />
5<br />
0<br />
(d)<br />
Percentage of masculinization (%)<br />
(cd) (cd)<br />
1 2 3 4 5 6 7<br />
100<br />
90<br />
80<br />
70<br />
60<br />
50<br />
40<br />
30<br />
20<br />
10<br />
0<br />
(a)<br />
Lines of Tilapia<br />
(ab) (b)<br />
Figure 19. Average growth value in length of the seven lines of Tilapia during the 150 days of the<br />
experiment<br />
1 2 3 4 5 6 7<br />
Lines<br />
Figure 20. Percentage of masculinization of the seven Tilapia lines tested in this study (n=100 for<br />
each Tilapia line)<br />
524<br />
(c)
APPENDIX 1<br />
Universidad Juárez Autónoma de Tabasco<br />
División Académica de Ciencias Biológicas<br />
Laboratorio de Acuicultura Tropical<br />
Workshop on Integrated Aquaculture Agriculture Systems<br />
Agenda<br />
Registration 9-10 AM<br />
AUGUST 12, 2010<br />
Time Topic Instructor<br />
10:00-12:30 Introduction<br />
Concepts of Integrated Aquaculture<br />
Agriculture Systems (IASS)<br />
Practical activity<br />
12:30-13:00 Break<br />
13:00-14:00 Historical perspective<br />
IAA projects on development<br />
AUGUST 13<br />
9:00- 12:00 Principal objectives of the IAAS<br />
Function and development of IAAS<br />
Implementation of IAAS<br />
12:00-13:00 Break<br />
13:00-15:00 Actual status of IAAS projects around the<br />
World * Special participation Dr. Kevin<br />
August 14<br />
9:00- 14:00 field trip<br />
August 16<br />
9:00-11:00 Organic cycles involved in IAAS<br />
11:00-12:00 IAAS Project engineering<br />
12:00-13:00 Break<br />
13:00-14:00 Presentation of practical activity<br />
August 17<br />
9:00-12:00 Development process of IAAS<br />
12:00-13:00 Break<br />
13:00-14:00 Future perspectives of IAAS<br />
14:00 Closing<br />
525<br />
FINAL REPORTS: INVESTIGATIONS 2009–2011<br />
PhD. Candidate Rafael Martínez<br />
García<br />
Dr. Dennis McIntosh/ Dr. Kevin<br />
Fitzsimmons<br />
Dr. Dennis McIntosh<br />
Dr. Dennis McIntosh
FINAL REPORTS: INVESTIGATIONS 2009–2011<br />
Workshop on Integrated Aquaculture Agriculture Systems<br />
List of Participants<br />
1. Salomón Páramo Delgadillo<br />
2. María Fernanda Cifuentes Alonso<br />
3. Estuardo González Arévalo<br />
4. María de J. Contreras García<br />
5. Pablo González Alanís<br />
6. Lili Pérez Martínez<br />
7. Rosa Aurora Pérez Pérez<br />
8. Asunción Pérez Demecio<br />
9. Flavio Pérez Pérez<br />
10. Librado Demecio Álvarez<br />
11. Petrona del Carmen Govea Ek<br />
12. Anahi del Carmen Cachón Camacho<br />
13. Jesús David Magdonel Zurita<br />
14. Julián Sánchez Álvarez<br />
15. Fernando Víctor Iriarte Rodríguez<br />
16. Irma Gallegos Morales<br />
17. Mario Fernández Pérez<br />
18. Maximiano Antonio Estrada Botello<br />
19. Roberto Flores Botello<br />
20. Nancy Patricia Brito Manzano<br />
21. Álvaro Alejandro Zacarías Sánchez<br />
22. Alfonso Manuel Güemez Flores<br />
23. Benigno Domínguez Santiago<br />
24. Marisol Palma López<br />
25. Isaías López Castañeda<br />
26. Ady Ramírez Hernández<br />
27. Henry Manuel Ramos Jiménez<br />
28. Beatriz Adriana Hernández Vera<br />
29. María Domitila de la Cruz Valencia<br />
30. Álvaro Hernández Sosa<br />
31. Luis Domínguez Trejo<br />
32. Priscila Anaís González Pérez<br />
33. María del Carmen De la Cruz Ávalos<br />
34. Luis Manuel Gómez Díaz Durán<br />
526
Diario Avance Tabasco 10 January 2012 By: Luis Garcia de la Cruz<br />
527<br />
FINAL REPORTS: INVESTIGATIONS 2009–2011<br />
LA UJAT POR UNA COMBINACIÓN DE ACUACULTURA Y AGRICULTURA<br />
Explica Kevin Fitzsimmons, investigador de la Universidad de Arizona los proyectos que existen<br />
con la División de Biología.<br />
Kevin Fitzsimmons, investigador de la Universidad de Arizona.<br />
FOTO: Avance<br />
LUIS GARCÍA<br />
SEGUNDA Y ÚLTIMA PARTE<br />
Luego de reconocer que México tiene mucho interés en la exportación de productos del mar a través de la<br />
acuacultura, prevalece siempre la necesidad de soportar el consumo local, externó el investigador de la<br />
Universidad de Arizona, Kevin Fitzsimmons quien destaca el trabajo que mantiene la Universidad Juárez<br />
Autónoma de Tabasco en ese sentido.<br />
Cuestionado sobre el papel que juega la máxima casa de estudios el investigador en acuacultura, indicó<br />
que el trabajo que se realiza con la Universidad Juárez y en especial con la División de Biología, donde<br />
existen proyectos en coordinación con el doctor Wilfrido Contreras, son de suma importancia por todo lo<br />
avanzado, porque se desarrolla de manera rápida, la domesticación de peces, camarones, ostiones, almejas<br />
y las algas.<br />
“Algo que la UJAT y el doctor Wilfrido (Contreras), han estado trabajando en acuacultura y agricultura.<br />
La acuacultura tiene similares problemas a la agricultura, pues también causa contaminación, necesitamos<br />
encontrar alimentos para los peces, para ir eliminando las harinas de pescado por ser muy caras y no es<br />
suficiente para atender la alimentación de las especies domesticadas”.
FINAL REPORTS: INVESTIGATIONS 2009–2011<br />
Por ello, agregó, decidimos poner la acuacultura y la agricultura juntos, es mejor para la “Revolución<br />
azul”, que es la conjugación de la acuacultura y la agricultura, explica ante la presencia de sus colegas<br />
tabasqueños que escucharon atentos la explicación del especialista de la Universidad de Arizona.<br />
Y refrenda que es usar el agua que no sirve para los peces, utilizarla para irrigar las plantas, pues los<br />
desechos de los peces son muy orgánicos, pues tienen potasio, que las plantas necesitan y el productor<br />
puede ahorrar dinero, no se contamina el ambiente, porque son desechos de peces y no se usan<br />
fertilizantes. Un sistema similar que se usa con camarones y con algas marinas.<br />
Sostiene que es un sistema nuevo en América, tiene su prototipo en China, Japón, que han tenido por<br />
largos años la siembra de arroz y pescado, “ellos tienen el uso de plantas y peces juntos”.<br />
Indica que los investigadores norteamericanos y mexicanos explican a los granjeros como atender la<br />
tierra, pero en China, la gente no entiende los ciclos de los nutrientes, nosotros hemos trabajado con las<br />
comunidades, nuestros estudiantes se involucran con las comunidades para mostrar nuestros sistemas, dan<br />
asesorías, demostraciones, talleres en el campus.<br />
Precisa que en Tabasco se trabaja en Tacotalpa, en la comunidad de Caridad Guerrero; en Nacajuca en<br />
Oxiacaque, y un sistema en el campus universitario. Mientras que en otros estados, se trabaja con<br />
Chiapas, Oaxaca, Tamaulipas, Veracruz. Se trabaja con tilapias aunque el concepto es para todas las<br />
especies, también en Jalapita, Centla, se investiga con algas, camarón, manglar, ostión.<br />
Refirió que en el proyecto participan todos los profesores, todos los alumnos, todos los administrativos de<br />
acuacultura, es algo único en México. Porque está enfocado hacia la triple hélice, empresa, gobierno y<br />
universidad. Es importante el proyecto porque se logró traer a otros investigadores e instituciones. “Unas<br />
de las cosas por las que me gusta trabajar con los colegas de México, de aquí de la Universidad, es porque<br />
México le ha apostado más fuerte a la acuacultura que el mismo Estados Unidos, la industria de la tilapia<br />
ha crecido muy rápido, camarón, bagre en el norte, un programa muy fuerte para trabajar con las especies<br />
nativas como robalo, tenguayaca, casta rica, paleta y el pejelagarto, por supuesto”.<br />
Cuestionado sobre las perspectivas de desarrollo en materia de educación de la acuacultura y sobre todo<br />
de México, dijo que a través de programas como los que se están tratando de reproducir aquí en Ciencias<br />
Biológicas y explica que en Estados Unidos, se han comenzado a trabajar con las preparatorias, colocando<br />
estanques, peceras para que los muchachos aprendan a cuidar a los peces, principalmente en Arizona,<br />
porque la mayor parte de las secundarias y prepas están en áreas rurales. Antes, estudiaban vacas, cerdos,<br />
pollos, pero las ciudades han crecido y ahora las escuelas ya están dentro del perímetro de la ciudad en<br />
zonas urbanas. Con la acuacultura se pueden enseñar la crianza, mantenimiento y gestión de granjas y se<br />
pueden usar en sus clases de cocina. Pero lo más importante es que las personas dedicadas a la protección<br />
de animales, no se quejan porque son criaderos.<br />
Explicó que uno de los egresados del programa está trabajando en una escuela y ha comenzado a<br />
desarrollar esa misión. “Bueno, realmente no es una acción integrada, pero espera que con esa visión que<br />
tiene del programa más adelante se pueda reproducir esa forma de trabajo. Es el comienzo. Una de las<br />
cosas que admira de la UJAT es que todos los participantes, lo tienen muy claro, que tienen que tener una<br />
solida formación”, concluye Kevin Fitzsimmons.<br />
528
529<br />
FINAL REPORTS: INVESTIGATIONS 2009–2011<br />
Development of Polyculture Technology for Giant Freshwater Prawns<br />
(Macrobrachium rosenbergii) and Mola (Amblypharyngodon mola)<br />
Quality Seedstock Development/Experiment/09QSD03UM<br />
Md. Abdul Wahab<br />
Bangladesh Agricultural <strong>University</strong><br />
Mymensingh, Bangladesh<br />
Liu Liping<br />
Shanghai Ocean <strong>University</strong><br />
Shanghai, China<br />
James S. Diana<br />
<strong>University</strong> of Michigan<br />
Ann Arbor, Michigan, USA<br />
ABSTRACT<br />
This project evaluated potential developments in prawn polyculture by testing a variety of polyculture<br />
systems for growth and yield. Experiment 1 tested the effects of selective harvesting (SH) and claw<br />
ablation (CA) of blue-clawed (BC) prawns on an all-male freshwater prawn-finfish polyculture system.<br />
Ponds were stocked with all-male freshwater prawn Macrobrachium rosenbergii, silver carp<br />
Hypophthalmichthys molitrix, catla Catla catla and mola Amblypharyngodon mola at 12000, 2000, 500<br />
and 20000 per ha, respectively. Prawns were fed with pelleted feed. Ponds were fertilized regularly with<br />
urea, triple super phosphate and cow-dung. SH of BC prawns in treatment SH and CA in treatment CA<br />
started on the 60th day during a 137-day culture and continued at 15-day intervals until the final harvest.<br />
Treatment SH resulted in a higher (P0.05) among the treatments. Survival of<br />
prawn in monoculture irrespective of gender was lower than in polyculture with mola. Mean harvest<br />
weight, weight gain, specific growth rate, net and gross production of all female prawn was significantly<br />
(P
FINAL REPORTS: INVESTIGATIONS 2009–2011<br />
In experiment 3, the effects of adding silver carp and catla to mola and freshwater giant prawn in<br />
polyculture systems were evaluated. The experiment had five treatments: T1 (prawn and mola), T2 (prawn,<br />
mola and catla), T3 (prawn, mola and silver carp), T4 (prawn, mola, catla, and silver carp), and T5 (only<br />
mola), each with three replications. Stocking density of mola varied to produce approximately the same<br />
total fish biomass in all the treatments. Prawn stocking densities were 120 juvenile dm -1 (dm=decimal<br />
=40m 2 ) and 6 carp dm -1 . Feeds were supplied twice daily for prawn at appropriate feeding rates. Water<br />
quality parameters (except transparency) did not vary significantly among treatments. Survival of<br />
freshwater prawn in prawn-mola-carps polyculture system were relatively higher where prawn and mola<br />
were stocked with silver carp and catla, and with silver carp, respectively than with only mola or with<br />
mola and catla. Net and gross production of prawn were significantly higher with silver carp and with<br />
silver carp-catla but not with only mola or mola-catla. Average weight gains, SGR, net and gross<br />
production were significantly lower for silver carp than in catla or in catla-silver carp treatments. The<br />
balanced stocking densities of prawn-mola with catla - silver carp developed a synergistic interaction<br />
resulting higher net and gross productions. Net and gross productions were significantly higher in<br />
treatment T5, where only mola was stocked at higher densities. Therefore, carps can be added with prawn<br />
and mola to enhance total production, which would play a significant role in providing family nutrition as<br />
well as generating additional income.<br />
Experiment 1: Effects of Selective Harvesting and Claw Ablation on All-Male<br />
Freshwater Prawn Production<br />
INTRODUCTION<br />
The present study was carried out to determine the effects of bi-weekly selective harvesting (SH) and biweekly<br />
claw ablation (CA) of blue-clawed (BC) freshwater prawns on the growth and production of allmale<br />
prawn Macrobrachium rosenbergii stocked in polyculture systems with silver carp<br />
Hypophthalmichthys molitrix, catla Catla catla and mola Amblypharyngodon mola.<br />
MATERIALS AND METHODS<br />
The experiment was conducted using a completely randomized block design in 12 earthen ponds (nine<br />
ponds each with 100m2 and three ponds each with a150 m2 area) having1.0m water depth at the Fisheries<br />
Field Laboratory, Bangladesh Agricultural <strong>University</strong> (BAU), Mymensingh, during 137 days. The<br />
experiment included three treatments: SH, CA and SH+CA of all-male freshwater prawn and a control<br />
(Co) without SH and CA. Each treatment had four replicas. All ponds were treated with lime (powdered<br />
CaCO3) before stocking, and fertilized with urea and triple super phosphate (TSP) at the rate of 25 kg/ ha<br />
and semi-decomposed cow-dung at 1000 kg/ha 13 days after liming. Seven days after fertilization, all<br />
ponds were stocked with all male prawn juveniles (mean weight 5.58 g each), silver carp (17.93 g), catla<br />
(23.07 g) and mola (0.52 g) at stocking densities of 1.2, 0.2, 0.05 and 2.0 per m 2 respectively. Male prawn<br />
juveniles were selected manually. Freshwater prawns were fed with pellets (28% crude protein) daily at a<br />
rate of 6% of body weight for the first month, 4% for the second month and 3% for the rest of the culture<br />
period. Half of the daily ration was supplied in the morning at 8:00 and the rest in the evening at 17:00.<br />
Ponds were fertilized at 5-day intervals with urea and TSP at a rate of 6.25 kg/ha and cow-dung at 125 kg/<br />
ha to maintain natural food organisms.<br />
Periodic selective harvest of BC from treatment SH and ablation of BC in treatment CA were started on<br />
day 60 after stocking. These procedures were continued every 15 days until the final harvest. BC prawns<br />
were identified by their blue-colored and long. A seine (1.0 cm mesh size) was used for SH and CA of<br />
BC. Seining was performed twice at each sampling time in the respective ponds. All seined BC in<br />
treatment SH were harvested, and blue claws of all seined BC in treatment CA were ablated. Selectively<br />
530
531<br />
FINAL REPORTS: INVESTIGATIONS 2009–2011<br />
harvested BC prawns were not replaced, while claw-ablated BC prawns were released immediately into<br />
the respective ponds. Neither SH nor CA of BC prawns was performed in the control. Partial harvesting<br />
of larger mola using the same seine (1.0 cm mesh size) was started on day 75 and continued at 15-day<br />
intervals until the final harvest, because mola bred within 60-70 days of stocking in all ponds. The counts<br />
and weights of selectively harvested and claw-ablated prawns as well as the weights of partially harvested<br />
mola were recorded.<br />
All prawns, silver carp and catla harvested from each pond were counted, measured and weighed<br />
individually. Mola of each pond were batch weighed. Survival rate, specific growth rate (SGR) and<br />
individual weight of this species were not considered for calculation as mola were self recruiting and bred<br />
in all ponds during the culture period. The specific growth rate and feed conversion rate (FCR) of prawn,<br />
silver carp and catla was calculated.<br />
One-way analysis of variance (ANOVA) was performed for the statistical analysis of growth and<br />
production. Survival and per cent data were analyzed using arcsine-transformed data but per cent values<br />
are reported. All statistical tests were carried out at a 5% significance level using Statistical Package for<br />
Social Science (SPSS).<br />
RESULTS AND DISCUSSION<br />
The average individual weight of harvested prawn was significantly higher in treatment SH (55.45 g),<br />
followed by treatments CA (52.83 g) and Co (49.60 g, Table 1). The survival of prawn was also higher in<br />
treatment SH (76%) than in treatments CA (66%) and Co (65%). The survival rate of prawn in treatment<br />
SH was calculated on the basis of accumulated harvests. The SGR was significantly lower in treatment<br />
Co (1.59 %) than in treatments SH (1.68%) and CA (1.64%). The net production of prawn differed<br />
significantly among the treatments, with better performance in treatment SH (437 kg/ha), followed by CA<br />
(354 kg/ha) and Co (322 kg/ha). FCR was calculated for prawn, which was significantly lower in SH<br />
(2.19) than in CA (2.77) and Co (2.95).<br />
Table 1. Comparison of growth and production parameters (mean + SE, N = 4) of prawn in control (Co),<br />
selective harvesting (SH) and claw ablation (CA) treatments during a 137-day culture period.<br />
Species/parameters Co SH CA<br />
Freshwater prawn<br />
Individual stocking weight (g) 5.63 + 0.05 5.57 + 0.07 5.56 + 0.57 b<br />
Individual weight at harvest (g) 49.60 + 0.62 c 55.45 + 0.72 a 5.83 + 2.44<br />
Survival (%) 65.35 + 0.52 b 75.69 + 0.54 a 66.32 + 1.02 b<br />
SGR (%bw/day) 1.59 + 0.01 b 1.68 + 0.01 a 11.64 + 0.01 a<br />
Gross production (kg/ha) 481 +10 462 + 6 471 + 5<br />
Net production (kg/ha) 445 + 9 427 + 6 435 + 5<br />
Gross production (kg/ha)<br />
Large (50 g and above) 257 + 9 b 407 + 15 a 303 + 20 b<br />
Medium (33.3–49.9 g) 84 + 12 84 + 11 102 + 16<br />
Small (33.2 g and below) 48 + 4 a 13 + 1b 15 +1b<br />
Total 389 + 8 c 504 + 6 a 420 + 8 b<br />
Net production (kg/ha) 322 + 8 c 437 + 6 a 354 + 8 b<br />
Mean values with different superscripts indicate a significant difference (P
FINAL REPORTS: INVESTIGATIONS 2009–2011<br />
Individual growth parameters of silver carp and catla and the amount of mola at every harvest did not<br />
vary significantly among treatments (Table 2). The combined productions of finfish were also not<br />
significantly different among the treatments. However, the combined net productions of all species<br />
including freshwater prawn were higher in treatment SH (1244 kg/ha) than those of treatments CA (1161<br />
kg/ha) and Co (1137 kg/ha).<br />
Table 2. Comparison of growth and production parameters (mean + SE, N = 4) of silver carp and catla in<br />
different treatments during a137-day culture period.<br />
Species/parameters<br />
Co<br />
Silver carp<br />
Individual stocking weight (g) 17.74 + 0.40 17.66 + 0.10 18.19 + 0.29<br />
Individual weight at harvest (g) 240.47 + 4.86 231.06 + 2.95 235.68 + 2.44<br />
Survival (%) 100 100 100<br />
SGR (%bw/day) 1.90 + 0.01 1.88 + 0.01 1.87 + 0.01<br />
Gross production (kg/ha) 481 +10 462 + 6 471 + 5<br />
Net production (kg/ha) 445 + 9 427 + 6 435 + 5<br />
Catla<br />
Individual stocking weight (g) 22.83 + 1.14 22.13 + 0.90 24.05 + 0.73<br />
Individual weight at harvest (g) 477.27 + 10.94 466.92 + 7.19 468.38 + 16.46<br />
Survival (%) 100 100 100<br />
SGR (%bw/day) 2.22 + 0.05 2.23 + 0.02 2.17 + 0.01<br />
Gross production (kg/ha) 242 + 2 237 + 4 238 + 5<br />
Net production (kg/ha) 231 + 3 226 + 4 225 + 5<br />
Carp combined<br />
Gross production (kg/ha) 723 + 10 699 + 3 709 + 9<br />
Net production (kg/ha) 676 + 10 653 + 3 660 + 9<br />
SGR, specific growth rate; Co, control; SH, elective harvesting; CA, claw ablation; bw, body weight.<br />
The amount of bi-weekly selectively harvested BC in treatment SH was19% of stocked prawn, which<br />
constituted 29% in weight of total harvested prawn. BC individuals in treatment CA were ablated<br />
biweekly and released back into the respective ponds, and they constituted 18% of stocked prawn in<br />
number. The cumulative selective harvest of BC (2267 individual/ha) and claw-ablated BC (2125<br />
individual/ha) did not vary significantly. The amount of BC at final harvest was significantly higher in<br />
treatment Co (1325 per ha) than that in treatments SH (758) and CA (758). However, treatment SH<br />
yielded a significantly higher total number of BC (3025 per ha), followed by CA (1741) and Co (1325).<br />
Aggregate number of all harvested prawn was also significantly higher in treatment SH (9083 per ha) than<br />
in CA (7958) and Co (7841).<br />
The percentages of three different morphotypes among harvested male prawns within each treatment were<br />
estimated. Blue claws, orange claws (OC), and small males (SM) were 34.6%, 58.7% and 6.7%<br />
respectively in treatment SH; 22.9%, 68.5% and 8.6% in treatment CA; and 17.7%, 55.1% and 27.2% in<br />
treatment Co. Some female prawns (4-5% in number) were also recovered at harvest due to error in<br />
manual selection of juveniles before stocking. However, the percentage of female prawns did not vary<br />
significantly both by number and weight among treatments. Harvested females were of two morphotypes:<br />
females with eggs (berried) and females with wide open pleura, indicating that they had already spawned.<br />
532<br />
SH<br />
CA
533<br />
FINAL REPORTS: INVESTIGATIONS 2009–2011<br />
The mean weight of BC was significantly higher in Co (85.2 g) than in CA (71.8 g) and SH (68.3 g). The<br />
mean weight of OC and SM did not vary significantly among treatments; however, the mean weight of all<br />
types of male prawn collectively was significantly higher in SH (55.9 g), followed by CA (53.2 g) and Co<br />
(50 g).<br />
Selective harvesting and CA contributed to a 36% and 10% increase in net production of freshwater<br />
prawn, respectively, over controls. These differences could have resulted from the survival rate and<br />
individual weight differences attained at harvest. While the SGR of prawn between treatments SH and CA<br />
did not vary significantly, the survival rate and individual weight at harvest were significantly higher in<br />
treatment SH. Interestingly, the numbers of selectively harvested BC in treatment SH and claw-ablated<br />
BC in treatment CA were almost similar. Thus, the remaining prawns in both treatments had an equal<br />
opportunity to remain free from the growth suppression due to BC (Karplus et al.,1989). However,<br />
periodic harvest of BC from treatment SH reduced the prawn density, which also minimized the intraspecific<br />
competition for food, space and shelter (Fujimura & Okamoto, 1972), which was not the case in<br />
treatments CA and Co. Significantly higher numbers of SM at harvest found in Co indicated that a large<br />
number of SM were not able to transform into BC through OC, and their growth was stunted (Karplus et<br />
al., 1992) by the suppression phenomenon of BC.<br />
The amounts of prawn and fish harvested are important under the conditions in Bangladesh. Treatment<br />
SH yielded 504 kg/ha of prawn, which represented 30% and 20% increased production over Co and CA.<br />
This production figure is comparable to other reported values considering the stocking densities and<br />
culture period (Kunda et al., 2008; Jose et al., 1992; Nair et al., 1998). Treatment SH had the best FCR<br />
(2.2), although this index does not always reflect the direct contribution of diets (D’Abramo & New,<br />
2000), because of natural productivity.<br />
In most polyculture systems, there is a target species and some minor species. The yield of minor species<br />
is usually considered to be a bonus to the yield of the target species (Garcia-Perez et al., 2000).<br />
Freshwater prawn was the prime species and thus finfish might be considered as secondary species.<br />
Although the prawn production (31-37% of total production) was less than finfish production in terms of<br />
biomass, its value in sale price was much higher and would constitute about 70-77% of the total benefit in<br />
all treatments. This has implications for both profit and household finfish consumption.<br />
Experiment 2: Addition Of Mola Into Polyculture With Freshwater Giant<br />
Prawn<br />
INTRODUCTION<br />
Bangladesh is considered one of the most suitable countries in the world for giant freshwater prawn<br />
farming, because of its favourable resources and agro climatic condition. The prawn and shrimp sector as<br />
a whole is the second largest export industry after readymade garments, generating US$ 380 million<br />
annually which is 5.6% of the total value of exports (DoF, 2006). Marine shrimp and freshwater prawn<br />
production for 2008-2009 was 145,585 MT. Therefore, this sector had good performance and is gradually<br />
changing economic status of the farmers, as well as creating new employment opportunities. But prawn<br />
production is low compared to neighboring countries. Males grow larger and faster than females at<br />
maturity and, therefore, all-male culture would be economically advantageous (Sagi and Aflalo, 2005).<br />
Monosex all male prawn culture may be one means to increase giant freshwater prawn production.<br />
Mola is a very important small indigenous species which is a good source of essential nutrients,<br />
particularly vitamin A. Poor farmers in this country are incapable of providing protein rich meals to their<br />
children due to high price of commodities, including fish. Culture of freshwater prawn for export market
FINAL REPORTS: INVESTIGATIONS 2009–2011<br />
and mola in the same pond for household consumption may be an innovative option. Introduction of mola<br />
will also improve the culture environment by controlling phytoplankton blooms, which are produced<br />
mainly due to wastes derived from the high protein diet used in prawn farming (Assaduzzaman et al.,<br />
2005). Therefore, the purpose of the proposed study is to develop a new sustainable polyculture<br />
technology for all-male giant freshwater prawns and mola to increase the average productivity of highvalue<br />
prawns for export, as well as to provide highly nutritious fish for household consumption.<br />
MATERIALS AND METHODS<br />
Experiments 2 was done in 15 earthen ponds (9 ponds 100 m 2 each and 6 ponds 140 m 2 each) for 135<br />
days in a completely randomized design into five different treatments with three replications each (Table<br />
3).<br />
Table 3: Experimental design with density of mola and gender difference of prawn as the main variables.<br />
Stocking density/ m<br />
Species<br />
-2<br />
Treatment Treatment Treatment Treatment Treatment<br />
1 2<br />
3<br />
4<br />
5<br />
Male prawn 3 - 3 3 3<br />
Female prawn - 3 - - -<br />
Mola - - 1 1.5 2<br />
All unwanted fishes were eradicated by rotenone application at 30 g decimal -1 (one decimal = 40 m 2 ) and<br />
lime was applied at 250 kg ha -1 five days after rotenone application. Urea and TSP were applied at a rate<br />
of 50 kg ha -1 in each pond after application of lime. Juvenile freshwater prawn (1.75 g) and mola (0.80 g)<br />
fry were collected from a nearby nursery in Mymensingh and stocked according to the experimental<br />
design.<br />
Formulated feeds were applied at 10% body weight in the first month, reduced to 7% in the second<br />
month, then reduced to 3% until the end of the experiment. Feeds were prepared using a local pellet<br />
machine with following ingredients: fish meal 15%, mustard oil cake 20%, soybean meal 20%, rice bran<br />
20%, maize flour 20%, molasses 4%, and vitamin-mineral premix 1%.<br />
Water quality parameters were monitored on biweekly basis and growth sampling on monthly basis to<br />
adjust the feeding rate and to evaluate fish growth. A number of water quality parameters such as<br />
temperature ( 0 C), transparency (cm), pH, dissolved oxygen (mg l -1 ), alkalinity (mg l -1 ), phosphatephosphorus<br />
(mg l -1 ), nitrate-nitrogen (mg l -1 ), nitrite-nitrogen (mg l -1 ), ammonia-nitrogen (mg l -1 ), and<br />
chlorophyll-a were measured biweekly. Temperature, transparency, pH and dissolved oxygen were<br />
measured in situ and the remaining parameters were measured at the Water Quality and Pond Dynamics<br />
Laboratory, Faculty of Fisheries, Bangladesh Agricultural <strong>University</strong>, Mymensingh.<br />
Prawn and mola were sampled monthly using a seine. Length and weight of 10 individuals of each<br />
species from each pond were measured separately to assess health condition and growth. Length was<br />
measured using a centimeter scale and weight was taken using a portable balance (OHAUS, model<br />
No.CT-1200-S). Culture animals were completely harvested on 17 December 2010 after 135 days of<br />
rearing. Partial harvesting was performed by repeated netting, using a seine. Final harvesting was done by<br />
draining the ponds using a pump. During harvest, all individuals from each pond were counted and<br />
weighed to assess survival rate and pond production.<br />
534
535<br />
FINAL REPORTS: INVESTIGATIONS 2009–2011<br />
For the statistical analysis, a one-way ANOVA (Analysis of Variance) was done by using the SPSS<br />
(Statistical Package for Social Science) version-11.5. Significance was assigned at the 0.05 level.<br />
RESULTS AND DISCUSSION<br />
The experiment had five treatments: all male prawn + 1 mola m -2 , all male prawn + 1.5 mola m -2 , all male<br />
prawn + 2 mola m -2 , only male prawn, and only female prawn, and were treated as T1, T2, T3, T4 and T5,<br />
respectively with three replications each.<br />
All physical and chemical parameters except transparency and chlorophyll-a did not differ significantly<br />
among different treatments (Table 4). In treatment T4, and T5, where mola was not stocked with prawn,<br />
transparency was significantly lower than the other treatments, where prawn was stocked with mola.<br />
There were no significant differences (P0.05) among the<br />
treatments. Nitrate, nitrite, ammonia and phosphate did not show significant differences among treatments<br />
and were also in suitable range for aquaculture. In treatments T4 and T5, prawns were monocultured so<br />
that they could not utilize all the nutrients produced in the water body since formulated feed was supplied.<br />
On the contrary, in the treatments T1, T2, and T3, mola was stocked with prawn, utilized the phytoplankton<br />
produced in the water-body, and transparency was higher in those ponds.<br />
Table 4: Mean values (± SD, N= 33) of water quality parameters for each treatment. Means with the<br />
different superscripts are significantly different (P
FINAL REPORTS: INVESTIGATIONS 2009–2011<br />
was significantly (P
537<br />
FINAL REPORTS: INVESTIGATIONS 2009–2011<br />
Mola mainly feed upon plankton grown in the water-body and prevent plankton blooms in the culture<br />
system. Dense growth of phytoplankton can deplete dissolved oxygen in the water-body. Freshwater<br />
prawn is an omnivorous species, but mainly a benthivore that utilizes artificial feed. So, a large amount of<br />
phytoplankton produced in monoculture ponds remains unutilized and nutrient decomposition associated<br />
with this causes heavy growth of phytoplankton, reducing transparency and depleting dissolved oxygen,<br />
which is harmful for prawn survival. Mola consume phytoplankton and help to retain better water quality<br />
without hampering prawn growth or competing with prawn for feed.<br />
Addition of mola at different densities had no effect on survival, gain in weight, and production<br />
performance of prawn. Therefore, mola may be stocked as an additional species with freshwater prawn<br />
that would give higher total gross production, provide family nutrition as well as generate additional<br />
income. Freshwater prawn polyculture with mola has good potential to be implemented in Bangladesh<br />
and can be a sustainable way for income generation, as well as a good source of vitamin A. Moreover,<br />
water quality management will be easier and good pond ecology more sustainable for production of<br />
freshwater prawn.<br />
Experiment 3: Effects of Addition of Carps on Growth, Size Structure and<br />
Production of Prawn and Mola in A Polyculture System<br />
INTRODUCTION<br />
Several methods have been employed to increase per unit production (kg/ha) of prawns, including<br />
increased size at stocking, increased stocking densities, grading animals prior to stocking and selective<br />
harvesting of the largest animals during the growing season, but it is still a challenge is to develop a<br />
technology that can raise pond productivity in a sustainable way, while minimizing the use of inputs like<br />
energy and capital.<br />
The farmers of Bangladesh are incapable of providing protein rich meal to their children due to the higher<br />
price. Zafri and Ahmed (1981) reported that, mola contains 200 IU of vitamin-A per gram of edible<br />
protein. A medium size mola individual has about 2.0 g of edible protein in its muscles, which contain<br />
400 IU of vitamin-A. This means that if four mola are eaten daily, it may provide more than 1500 IU of<br />
vitamin-A, sufficient to save children from night blindness caused by deficiency of vitamin-A.<br />
Introduction of mola also improves the culture environment by reducing phytoplankton blooms, which<br />
are mainly due to waste derived from high protein diet used in prawn farming (Assaduzzaman et al.,<br />
2005).<br />
Aquaculture in Bangladesh has been developed through the culture of large carps of both native (e.g.,<br />
rohu (Labeo rohita), catla, and mrigal Cirrhinus mrigala and exotic (e.g., silver, grass Ctenopharyngodon<br />
idella, and common carp Cyprinus carpio origin. Several experiments have been carried out to evaluate<br />
any interference in the pond among feeding fish (Alim et al., 2004; Milstein et al., 2002; Wahab et al.,<br />
2001, 2002, 2003). Silver carp is expected to have a strong impact on the pond ecology because it is a<br />
very effective filter feeder and releases nutrients as feces (Milstein, 1992; Milstein et al., 1985). It also is<br />
significant to the farmer’s family nutrition as it is a cheap fish that a family can afford to eat instead of<br />
selling. It is also easily accessible to the poorer section of the population because of its low market price.<br />
Among the Chinese carps, silver carp is popular due to its fast growth and unique food habits. They are<br />
mainly phytoplankton feeders and can reduce algal blooms. Catla is the fastest growing fish among the<br />
three Indian major carps and a suitable species for polyculture. It has also a good market value.
FINAL REPORTS: INVESTIGATIONS 2009–2011<br />
Development of appropriate culture technologies is one of the most important issues in Bangladesh to<br />
contribute to the national economy and to improve the standard of living of people through production of<br />
freshwater prawn along with high valued carps and nutrient rich small fish. Polyculture may produce<br />
increased yield if fish with different feeding habits are stocked in proper ratios and combinations (Halver,<br />
1984). To address this issue, this study was designed to investigate impacts of including carps on growth,<br />
production, and pond ecosystem in freshwater prawn-carp-mola polyculture systems.<br />
In order to develop prawn-carp-mola polyculture technology and to enhance overall production and<br />
economic benefit, the following objectives were set out for the proposed research: 1. To evaluate the<br />
effects of inclusion of catla and silver carp on growth and production of prawn and mola; and 2. To<br />
evaluate the effects of addition of carps on pond ecology, prawn-mola production and overall production<br />
in the system.<br />
MATERIALS AND METHODS<br />
The experiment was carried out at the Fisheries Field Laboratory, Bangladesh Agricultural <strong>University</strong>,<br />
Mymensingh, Bangladesh in 15 earthen pond (all ponds are of 140 m 2 each) for a period of 70 days in a<br />
completely randomized design into five different treatments with three replications of each (Table 6).<br />
Table 6: Stocking densities of animals in each treatment. To maintain same total biomass, mola stocking<br />
density varied among treatments.<br />
Species<br />
Treatment (Stocking density per 40m 2 )<br />
T1 T2 T3 T4 T5<br />
Prawn 120 120 120 120 -<br />
Mola 83 60 60 60 272<br />
Catla - 6 - 2 -<br />
Silver carp - - 6 4 -<br />
All unwanted fishes were eradicated by drying the pond, and lime was applied at 250 kg ha -1 five days<br />
after drying. Urea and TSP were applied at 50 kg ha -1 in each pond after application of lime. The average<br />
weight of freshwater prawn juveniles, mola, catla, and silver carp were 2.3, 1.5, 20.94, 20.82 g. They<br />
were collected from a nearby nursery in Mymensingh and stocked according to the experimental design.<br />
Stocking densities of mola were different in the treatments T1 and T5 in order to maintain comparable fish<br />
biomass among treatments.<br />
Formulated feeds were applied at 10% body weight of prawn for the first month, reduced to 7% for the<br />
second month, then reduced to 5% until the end of the experiment. Feeds were prepared using a local<br />
pellet machine with following ingredients: Fish meal 15%, Mustard oil cake 20%, Soybean meal 20%,<br />
Rice bran 20%, Maize flour 20%, Molasses 4%, Vitamin-mineral premix 1%.<br />
A number of water quality parameters, including temperature ( 0 C), transparency (cm), pH, dissolved<br />
oxygen (mg l -1 ), alkalinity (mg l -1 ), phosphate-phosphorus (mg l -1 ), nitrate-nitrogen (mg l -1 ), nitritenitrogen<br />
(mg l -1 ), ammonia-nitrogen (mg l -1 ), and chlorophyll-a were measured biweekly. Temperature,<br />
transparency, pH, and dissolved oxygen were measured on site and the remaining parameters were<br />
measured at the Water Quality and Pond Dynamics Laboratory, Faculty of Fisheries, Bangladesh<br />
Agricultural <strong>University</strong>, Mymensingh.<br />
Prawn, mola, catla and silver carp were sampled monthly using a seine. Length and weight of 10 animals<br />
of each species from each pond were measured separately to assess growth and to adjust feeding rate.<br />
538
539<br />
FINAL REPORTS: INVESTIGATIONS 2009–2011<br />
Length was measured by using a centimeter scale and weight was taken by using a portable balance<br />
(OHAUS, model No.CT-1200-S). Animals were completely harvested on 10-12 September 2011 after 70<br />
days of rearing. Partial harvesting was performed by repeated netting, using a seine. Final harvest was<br />
done by draining the ponds using a pump. During harvesting, all animals in each pond were counted and<br />
weighed individually to assess survival rate and pond production.<br />
For statistical analysis of the data, one-way ANOVA (Analysis of Variance) was done by using the SPSS<br />
(Statistical Package for Social Science) version-11.5. Significance was assigned at the 0.05% level.<br />
RESULTS<br />
The experiment had five treatments: prawn-mola, prawn-mola-catla, prawn-mola-silver carp, prawnmola-catla-silver<br />
carp, and only mola, and were redorded as T1, T2, T3, T4 and T5, respectively with three<br />
replications each.<br />
All physical and chemical parameters, except transparency did not differ significantly among treatment<br />
(Table 7). Water temperature was about 2.8 ºC and transparency about 32 cm. In treatments T3, where<br />
silver carp was stocked with prawn and mola, transparency was significantly higher than the treatments<br />
without silver carp (Table 7, Figure 2). pH was approximately 8.4, DO about 6.1 mg l -1 , and alkalinity<br />
130 mg l -1 . Nitrate concentrations were about 0.02 mg l -1 , NO2-N about 0.003 mg l -1 , NH3-N about 0.03<br />
mg l -1 , PO4-P about 1.7 mg l -1 , and chlorophyll-a about 130 µg l -1 .<br />
Table 7: Mean values (± SD, N= 18) of water quality parameters of different treatments. Means with the<br />
different superscripts are significantly different (P
FINAL REPORTS: INVESTIGATIONS 2009–2011<br />
Transparency (cm)<br />
41<br />
39<br />
37<br />
35<br />
33<br />
31<br />
29<br />
27<br />
25<br />
23<br />
6/30/11<br />
7/7/11<br />
7/14/11<br />
7/21/11<br />
Figure 2. Variation in transparency among treatments.<br />
T1 T2 T3 T4 T5<br />
7/28/11<br />
8/4/11<br />
There were no significant differences in harvested weight, weight gain, or specific growth rate of<br />
freshwater prawns in any treatment (Table 8). However, net and gross productions of prawn were<br />
significantly higher in T3 and T4, than in T1and T2, indicating that polyculture with silver carp improved<br />
prawn yields.<br />
Survival, weight gain, and daily growth rate of mola did not differ significantly among different<br />
treatments. The net and gross production of mola was significantly higher in T5 than in other treatments.<br />
This was the result of a much higher stocking density of mola in monoculture (T5) compared to<br />
polyculture.<br />
The survival rates of carps were not significantly different among treatments (Table 8). However, average<br />
final weight, weight gain, and daily growth rate of carps were significantly lower in T3 (silver carp-prawnmola)<br />
than T2 (prawn-mola-catla) and T4 (prawn-mola-catla-silver carp), indicating that production<br />
performance of silver carp alone was lower than that of catla alone, or silver carp with catla. Both net and<br />
gross production were again significantly higher in the treatment T2 and T4 than in T3.<br />
As the experiment was designed on the basis of same biomass among different treatments, then total net<br />
production can be a good indicator to evaluate production performance among different combination of<br />
species. Total net production and total gross production were significantly higher in polyculture<br />
treatments T2 and T4 with catla or silver carp-catla compared to other treatments.<br />
Date<br />
540<br />
8/11/11<br />
8/18/11<br />
8/25/11<br />
9/1/11<br />
9/8/11
5<br />
FINAL REPORTS: INVESTIGATIONS 2009–2011<br />
Table 8. Production performance of prawn, mola, and carps in each treatment. Mean values (± SD,) with the different superscripts in the same rows<br />
were significantly different (P
FINAL REPORTS: INVESTIGATIONS 2009–2011<br />
DISCUSSION<br />
Suitable ranges of all water quality parameters are very important for fish culture, as they provide good<br />
environment for health, growth, and development of fish food. The ranges of water temperature in this<br />
study were similar to those recorded from rice field culture by Uddin (1998) and Das (2002), who found<br />
maximum carp production at those temperatures. pH was similar to values observed to values by Whitton<br />
et al. (1988), and dissolved oxygen to values observed by Uddin (1998) and Nirod (1997), again resulting<br />
in rapid growth. Similarly, NH3 values were within acceptable ranges for goods survival growth.<br />
Transparency ranged from 25-42 cm in the present study which was within the recommended optimum<br />
range 15-40 cm suggested by Boyd (1992). Significantly higher transparency in treatment T3 was<br />
probably due to stocking silver carp. The silver carp is a phytoplanktivorous filter-feeder, consuming<br />
algae of various sizes (Cremer and Smitherman, 1980; Smith, 1989). It is an appropriate species for<br />
polyculture with freshwater prawn and other carps (Rahman, 2010). The fast-growing silver carp<br />
increased grazing pressure on phytoplankton, which increased water transparency. Catla consumes<br />
zooplankton that collects in open waters (Natarajan and Jhingran, 1961), while mola consume<br />
phytoplankton (Jhingran and Pullin, 1985). The number of phytoplankton increased dramatically in the<br />
absence of silver carp in ponds supplied with fertilizer, and at the same time, catla consume zooplankton<br />
to reduce grazing pressure on phytoplankton.<br />
In the present study, average harvested weight of prawn was comparable with the findings of Karim<br />
(2001) for 70 days of culture. Average weight gain and SGR of prawn did not differ significantly among<br />
the treatments. Net and gross production values were comparatively lower than Lan et al. (2006) who<br />
reported net production at 194-373 kg h -1 . Net and gross production of prawn were significantly higher<br />
with silver carp and with silver carp-catla, but not with mola and mola-catla, probably due to the grazing<br />
interactions indicated above. Inclusion of carps did not harm the production of prawn, but maintained<br />
higher water quality. Milstein (1992) stated that silver carp can also raise benthophagous fish food<br />
resources through faecal pellets in polyculture systems.<br />
Different combinations of carp species with prawn and mola did not show significant differences among<br />
treatments in terms of survival of carps. Gross production of catla and silver carp ranged from 260-566 kg<br />
h -1 in 70 days, which were lower than annual finfish production of 660 kg h -1 mentioned as expected by<br />
Asaduzzaman et al. (2006a). Average weight gain, SGR, net and gross production of all carps combined<br />
were significantly lower for silver carp alone than catla alone or catla-silver carp. Lack of a zooplankton<br />
feeding fish in the cultures without catla may have limited overall carp production in T3. Balanced<br />
stocking densities of prawn, mola, catla and silver carp appeared to develop a synergistic interaction<br />
(Milstein, 2005) that resulted in net and gross production increases.<br />
Average final weight and average weight gain of mola did not differ significantly among treatments as<br />
stocking density was adjusted to achieve the same biomass. Average weight gain was negative in<br />
treatment T5, as mola offspring of smaller size were found during harvesting. Net and gross productions<br />
were significantly higher in treatment T5 in which only mola was stocked in higher densities. But no<br />
significant difference was found in mola production with prawn, prawn-catla, prawn-silver carp, and<br />
prawn-catla-silver carp indicating there were no negative effects of polycultures on the growth and<br />
production of mola.<br />
Net and gross productions were significantly higher when prawn and mola were stocked with catla or<br />
with catla-silver carp than with only silver carp or without carps. The lowest production was found by<br />
stocking only mola indicating mola was unable to utilize all of the water column and cannot be an<br />
economic monoculture system.<br />
5
543<br />
FINAL REPORTS: INVESTIGATIONS 2009–2011<br />
Freshwater prawn in polyculture with carps and mola have good potential to be implemented in<br />
Bangladesh. It can be a sustainable way for income generation due to high production as well as a good<br />
source of protein. Moreover, water quality management will be easier and good pond ecology can be<br />
assured. Above all, the farmers will make higher profit with prawn and carp and be able to provide<br />
nutrition to family members by inclusion of small indigenous fish, mola.<br />
LITERATURE CITED<br />
M A Alim, M.A., M.A. Wahab , and A. Milstein, 2004. Effects of adding different proportions of the<br />
small fish punti (Puntius sophore) and mola (Amblypharyngodon mola) to a polyculture of large carp.<br />
Aquaculture Research, 35:124-133.<br />
Asaduzzaman, M., M.A. Wahab, A. Kadir, A.S.M. Kibria, and M. Kunda, 2005. Observation on the some<br />
of the environmental parameters and feed quality of selected giant freshwater prawn Macrobrachium<br />
rosenbergii farms in Bangladesh. Bangladesh Journal of Fisheries Research, 9:112-122.<br />
Asaduzzaman, M., M.A. Wahab, Y. Yi, and J.S. Diana, 2006a. Bangladesh prawn-farming survey reports<br />
industry evolution. Global Aquaculture Advocate, 9:41-43.<br />
Asaduzzaman, M., M. A. Islam, M. Kunda, M. S. Uddin, M.A. Wahab, 2006b. Performance of overwintering<br />
juveniles of giant freshwater prawn under monosex and mixed sex culture systems.<br />
Progressive Agriculture, 17:212-223.<br />
Boyd, C.E., 1992. Water quality management for pond fish culture. Elsevier Science Publishers B. V.,<br />
Amsterdam, the Netherlands, 318 p.<br />
Cremer, M., and R.O. Smitheran. 1980. Food habits and growth of silver and bighead carp in cages and<br />
ponds. Aquaculture, 20:57-64.<br />
D’Abramo L.R. and M. B. New. 2000. Nutrition, feeds and feeding. In: Freshwater Prawn Culture. M.B.<br />
New and W.C. Valenti (Editors), Blackwell Science, Oxford, UK, pp. 203-220.<br />
Das, B.C., 2002. Studies on the effects of stocking density on growth, survival and yield of<br />
Amblypharyngodon mola and the performance of Rohtee cotio in combination with Barbodes<br />
gonionotus and with Cyprinus carpio in rice fields. M.Sc. Thesis, Department of Aquaculture,<br />
Bangladesh Agricultural <strong>University</strong>, Mymensingh, 113 p.<br />
DoF (Department of Fisheries), 2006. Fishery Statistical Yearbook of Bangladesh, 2005-2006. Fisheries<br />
Resources Survey System, Department of Fisheries, Bangladesh, Dhaka.<br />
Fujimura, T., and H. Okamoto. 1972. Notes on progress made in developing a mass culturing technique<br />
for Macrobrachium rosenbergii in Hawaii. In: Coastal Aquaculture in the Indo-Pacific Region,<br />
T.V.R. Pillay (Editor),. Fishing News Books, Blackwell Science, Oxford, UK, pp. 313-327.<br />
Garcia-Perez A., D.E. Alston, and R. Cortes-Maldonado. 2000. Growth, survival, yield and size<br />
distributions of freshwater prawn Macrobrachium rosenbergii and tilapia Oreochromis niloticus in<br />
polyculture and monoculture systems in Puerto Rico. Journal of World Aquaculture Society, 31: 446-<br />
451.<br />
Halver, J. E., 1984. Special methods in pond fish husbandry. Akademiai Nyomda, Budapest, 146 p.<br />
Jhingran, V.G., and R.S.V. Pullin, 1985. A Hatchery Manual for the Common, Chinese and Indian Major<br />
Carp. ICLARM Contribution, ADB & ICLARM Publication. Vol. 252. 191 p.<br />
Jose S., C.M. Nair, and D.M. Thampy. 1992. Culture of Macrobrachium rosenbergii in homestead ponds.<br />
In: Freshwater Prawns. Proceedings of the National Symposium of Freshwater Prawns<br />
(Macrobrachium spp.). E.G. Silas (Editor), Kerala Agricultural <strong>University</strong>, Thrissur, India, pp. 247-<br />
250.<br />
Karim, M., 2001. Report on Feasibility of Early Shrimp Farming with Over-Wintered Galda Juveniles. p.<br />
13.<br />
Karplus, I., E. Samsonov, G. Hulata, and A. Milstein. 1989. Social control of growth in Macrobrachium<br />
rosenbergii. I. The effect of claw ablation on survival and growth of communally raised prawns.<br />
Aquaculture, 80:325-355.
FINAL REPORTS: INVESTIGATIONS 2009–2011<br />
Karplus, I., G. Hulata, D. Ovadia, and R. Jaffe. 1992. Social control of growth in Macrobrachium<br />
rosenbergii. III. The role of claws in bull-runt interactions. Aquaculture, 105:281- 296.<br />
Kunda M., M.E. Azim, M.A. Wahab, S. Dewan, N. Roos, and S.H. Thilsted. 2008. Potential of mixed<br />
culture of freshwater prawn (Macrobrachium rosenbergii) and self-recruiting small fish mola<br />
(Amblypharyngodon mola) in rotational rice-fish/prawn culture systems in Bangladesh. Aquaculture<br />
Research, 39:506-517.<br />
Lan, L.M., D.N. Long, and J. Micha, 2006. The effects of densities and feed types on the production of<br />
Macrobrachium rosenbergii (de Man) in the rotational rice-prawn system. Aquaculture Research,<br />
37:1297-1304.<br />
Milstein, A., 1992. Ecological aspects of fish species interactions in polyculture ponds. Hydrobiologia,<br />
231:177-186.<br />
Milstein, A., 2005. Effect of periphyton on water quality. In: Azim, M.E., M.C.J. Verdegem, A.A. van<br />
Dam, and M.C.J. Biveridge (Editors), Periphyton, Ecology, Exploitation and Management. CABI<br />
Publishing, Wallingford, U.K., pp. 179-190.<br />
Milstein, A., and B. Hepher, 1985. Principal component analysis of interaction between fish species and<br />
the ecological conditions in the fish ponds: I. Phytoplankton. Aquaculture and Fisheries Management,<br />
16: 305-317.<br />
Milstein, A., M.A. Wahab, and M.M. Rahman, 2002. The effects of common carp, Cyprinus carpio (L.)<br />
and mrigal, Cirrhinus mirgala (Hamilton) as bottom feeders in major Indian carp polyculture.<br />
Aquaculture Research, 33: 547-556.<br />
Nair K.G.R., S. Jose, P.T. Mathew, and J. Stephen. 1998. Growth, survival and production of<br />
Macrobrachium rosenbergii (De Man) with an indigenous feed. In: Proceedings of the National<br />
Symposium on Technological Advancement in Fisheries and its Impact on Rural Development. M.S.<br />
Hameed and B.M. Kurup (Editors), CUSAT, Cochin, India, pp. 135–140.<br />
Natarajan A.V., Jhingran A.G., 1961. Index of preponderance – A method of grading the food elements in<br />
the stomach analysis of fishes. Indian Journal of Fisheries, 8:54-59.<br />
Nirod, D.B., 1997. Effect on stocking density on the growth and production of mola (Amblypharyngodon<br />
mola). M.S. Thesis, Department of Fisheries Management, Bangladesh Agricultural <strong>University</strong>,<br />
Mymensingh. 75 p.<br />
Rahman, S.M.S, M.A. Wahab, M. Kunda, M.A. Islam, and M.E. Azim, 2010b. Density effects of silver<br />
carp Hypophthalmichthys molitrix and catla Catla catla on the production system in all-male<br />
freshwater prawn-finfish polyculture ponds. Aquaculture Research, 41:456-466.<br />
Sagi A. and E.D. Aflalo, 2005. The androgenic gland and monosex culture of freshwater prawn<br />
Macrobrachium rosenbergii (De Man): a biotechnological perspective. Aquaculture Research<br />
36,:231-237.<br />
Smith, D.W., 1989. The feeding selectivity of silver carp, Hypophthalmicthys molitrix Val. Journal Fish<br />
Biology, 34:819-828.<br />
Uddin, M.J., 1998. Effects of fish culture in rice fields on the yields of rice and nutrients availability in<br />
soil, straw and grain. M.S. Thesis, Department of Fisheries Management, Bangladesh Agricultural<br />
<strong>University</strong>, Mymensingh, 115 p.<br />
Wahab, M.A., M.A. Alim, and A. Milstein, 2003. Effects of adding the small fish punti (Puntius sophore)<br />
and/or mola (Amblypharyngodon mola) to a polyculture of large carp. Aquaculture Research, 34:149-<br />
164.<br />
Wahab, M.A., M.M. Rahman, and A. Milstein, 2002. The effect of common carp Cyprinus carpio (L) and<br />
mrigal Cirrhinus mrigala (Hamilton) as bottom feeders in major Indian carp polycultures.<br />
Aquaculture Research, 33:547-557.<br />
Wahab, M. A., M.M. Rahman. and A. Milstein, 2001. The effect of common carp Cyprinus carpio and<br />
mrigal Cirrhinus mrigala as bottom feeders in Indian carp polyculture. World Aquaculture, 32:50-52<br />
& 69.<br />
Whitton, B.A., A. Aziz, P. Franeis, J.A. Rother, T.W. Simon, and Z.N. Tahmida, 1988. Ecology of deep<br />
water rice in Bangladesh (physical and chemical environment). Hydrobiologia, 169:3-67.<br />
544
545<br />
FINAL REPORTS: INVESTIGATIONS 2009–2011<br />
Zafri, A. and K. Ahmed, 1981. Studies on the vitamin-a content of fresh water fishes, content and<br />
distribution of vitamin-A in mola (Amblypharyngodon mola) and dhela (Rohtee cotio). Bangladesh<br />
Journal of Biological Sciences, 10:47-53.
FINAL REPORTS: INVESTIGATIONS 2009–2011<br />
Evaluation of Performance of Different Tilapia Species<br />
Quality Seedstock Development/Experiment/09QSD04PU<br />
Sebastian W. Chenyambuga, Ester Meiluidie, Nazael Madalla and<br />
Berno V. Mnembuka<br />
Sokoine <strong>University</strong> of Agriculture<br />
Morogoro, Tanzania.<br />
Rebecca Lochmann<br />
<strong>University</strong> of Arkansas at Pine Bluff<br />
Pine Bluff, Arkansas, USA<br />
ABSTRACT<br />
A growth trial was carried out for 90 days to compare the growth performance and survival rate of Nile<br />
tilapia (Oreochromis niloticus) and Jipe tilapia (Oreochromis jipe), Wami tilapia (Oreochromis urolepis<br />
hornorum) and Ruvuma tilapia (Oreochromis ruvumae).. The study was conducted on-station at Sokoine<br />
<strong>University</strong> of Agriculture (SUA) and on-farm in ponds of small-scale fish farmers at Mkuyuni, Morogoro,<br />
Tanzania. In the on-farm experiment, the mean final weight, weight gain, growth rate, final length and<br />
final width differed significantly (P0.05) difference<br />
between O. niloticus and O. hornorum, but the two species differed significantly (P
INTRODUCTION<br />
547<br />
FINAL REPORTS: INVESTIGATIONS 2009–2011<br />
Aquaculture in Tanzania started in the 1950’s with the pond culture of the tilapia species native to the<br />
region, including Mozambique tilapia (Oreochromis mossambicus), Nile tilapia (Oreochromis niloticus)<br />
and Zanzibar tilapia (Oreochromis urolepis hornorum) (Rice et al., 2006). Other species which have been<br />
used commercially in Aquaculture include O. urolepis hornorum originating from the Wami river of<br />
north-central Tanzania and O. karongae native to Lake Nyasa (Lake Malawi). At the moment, more than<br />
95% of the farmers culture Nile tilapia (Oreochromis niloticus) in earthen ponds under mixed-sex culture<br />
(Kaliba et al., 2006). Pond culture of Nile tilapia is now viewed as a possible source of livelihood for<br />
farmers residing in proximity to the urban markets of cities and towns. The emphasis of the national<br />
fisheries policy (URT, 1997) is on a semi-intensive integrated mode of fish culture, focusing on Nile<br />
tilapia. The Nile tilapia is given first priority due to their better characteristics that include fast growth,<br />
short food chain, efficient conversion of food, high fecundity (which provides opportunity for distribution<br />
of fingerlings from farmer to farmer), tolerance to a wide range of environmental parameters, and good<br />
product quality (Hussain et al., 2000; Neves et al., 2008).<br />
In Tanzania, fish farmers obtain fingerlings from government fry centres and fisheries institutes. Some<br />
fish farmers produce their own fingerlings and sell them to other farmers. Because of the lack of<br />
controlled breeding, most ponds in the country are yielding only small-sized tilapia and production of fish<br />
is not encouraging. Quite a number of farmers feel that their fish are small due to stunted growth, and this<br />
is discouraging them from continuing with fish farming operations. Therefore, there is a need for bioprospecting<br />
for various species of tilapia to identify the species suitable for aquaculture in Tanzania.<br />
Because Tanzania is a region with very high natural tilapiine fish diversity (Rice et al., 2006), the ability<br />
to tap into the diverse natural pool of tilapiine fish genes is very important. This study was intended to<br />
evaluate the productive performance (growth rate, feed conversion ratio and market body weight) of<br />
different species of tilapia.<br />
The objectives of the study were;<br />
1. To compare the performance (growth rate, survival, feed conversion ratio and mature body size) of<br />
different species of Nile tilapia<br />
2. To carry out economic analysis of raising the different species<br />
3. To determine the management requirements of the best tilapia species identified under objectives one<br />
and two.<br />
4. To train farmers on the proper methods to culture the improved tilapia species.<br />
MATERIALS AND METHODS<br />
Study location and experimental Fish<br />
Growth performances of Nile tilapia (Oreochromis niloticus), Jipe tilapia (Oreochromis jipe), Wami<br />
tilapia (Oreochromis urolepis hornorum) and Ruvuma tilapia (Oreochromis ruvumae) were studied. The<br />
study was undertaken on-station in ponds at Sokoine <strong>University</strong> of Agriculture (SUA) and on-farm in<br />
ponds of small-scale fish farmers at Chang’a and Kibwaya villages in Mkuyuni division, Morogoro rural<br />
district, Tanzania. Nile tilapia (Oreochromis niloticus) fingerlings were collected from Kingolwira Fish<br />
Farming Centre. The fingerlings of Oreochromis jipe were collected from Lake Jipe in Mwanga district<br />
while Oreochromis urolepis hornorum and Oreochromis ruvumae were collected from river Wami at<br />
Dakawa sub-town, Mvomero district and river Ruvuma at Litapwasi village, Songea district, respectively.<br />
The fingerlings were collected from their respective sources and brought to SUA. At SUA the fingerlings<br />
of each species were kept separately in concrete tanks prior to the start of the experiment.<br />
Experimental procedure<br />
The experiment was conducted for 90 days, from April to July 2011. For the on–station experiment, two
FINAL REPORTS: INVESTIGATIONS 2009–2011<br />
earthen ponds (300 m 2 each) were used and each pond was fitted with four hapas of 6 m 2 surface area and<br />
one meter depth each. In total eight hapas were used and each tilapia species was allocated to one hapa in<br />
each pond at random. Prior to commencement of the experiment the ponds were drained, cleaned and<br />
allowed to dry for one week. Then the hapas were set and the ponds were refilled with water and poultry<br />
manure was added at a rate of 7.5 kg per pond. Stocking density was 2 fingerlings per m 2 in each hapa.<br />
All Fish in the hapas were supplemented daily with concentrate comprised of soybean meal (40%), maize<br />
bran (59%) and mineral (1%). The concentrate diet was provided at a level of 10 %, 7% and 5% of fish<br />
biomass during the first month, second month and third month of the experiment, respectively. Body<br />
weights of fish were measured using a digital weighing balance at the start of the experiment and then at<br />
monthly intervals for a period of 90 days. Similarly body length and width were measured at the<br />
beginning of the experiment and then at monthly intervals by using a measuring board with a ruler. Water<br />
quality parameters were measured at weekly intervals. Temperature and dissolved oxygen (DO) were<br />
measured by using YSI 55 instrument; water pH, nitrate, nitrite by using JBL Easy Test strips and water<br />
transparency by using secchi disk. The experiment was completed on 20 th July 2011.<br />
For the on–farm experiment, a total of six farmers from Chang’a and Kibwaya villages participated in the<br />
experiment. Each species of tilapia was distributed to two different farmers, making two replications for<br />
each species. The pond size varied from farmer to farmer and ranged between 50 m 2 and 200 m 2 . The<br />
ponds were filled with water by using channels available in the villages and fertilized by using farm yard<br />
manure. The fingerlings were stocked at a density of 2 fish per m 2 in each pond. The farmers provided<br />
supplementary feeds to their fish. The supplementary feeds included maize bran, vegetables and kitchen<br />
left overs that were obtained within the farmers’ homesteads. Body measurements (weight, length and<br />
width) of fish and water quality parameters were measured as in the on-station experiment, at the start of<br />
the experiment and then at monthly intervals. The experiment was completed on 19 th July 2011.<br />
In both experiments growth parameters that were determined included body weight gain (W1- W0) and<br />
average daily body weight gain (W1 -W0)/t, expressed as weight gain per fish per day, whereby W0 and<br />
W1 are initial weight and final weight, respectively, and t is time interval in days. Survival rate was<br />
calculated as ((N- D)/N) x 100, where by N is total number of fish stocked and D is number of fish died.<br />
The profitability of raising each species was computed using Gross Margin Analysis as follows:<br />
GM = TR – TVC<br />
Where:<br />
GM = Gross margin<br />
TR = Total revenue (Sales from fish)<br />
TVC = Total variable costs (Costs of feeds, fingerlings, transport and labour)<br />
Data analysis<br />
The data were analyzed using the General Linear Model (GLM) of the Statistical Analysis System (SAS<br />
1998) software. The effect of species on body weight, body length, body width and growth rate of the fish<br />
was tested. Factors tested were species, location and their interactions. Initial body measurements were<br />
used as a covariate during the analysis of growth data. Descriptive statistics were generated for water<br />
quality parameters. The Chi-Square (χ 2 ) test was used to assess the effect of species on survival rate of the<br />
fish.<br />
RESULTS<br />
The water quality parameters that were measured in this study include water temperature, Dissolved<br />
oxygen, pH, nitrite and nitrate and their mean values during the experimental period are shown in Table 6.<br />
548
549<br />
FINAL REPORTS: INVESTIGATIONS 2009–2011<br />
The results show that water pH and transparency differed significantly (P
FINAL REPORTS: INVESTIGATIONS 2009–2011<br />
highest variable costs per ha (2,577,280.00 ≈ US$ 1460.86) was found on fish ponds of the farmers who<br />
cultured O. niloticus while those who cultured O. ruvumae had the lowest variable cost (2,359,080.00 ≈<br />
US$ 1363.63). The farmers who cultured O. niloticus had the highest profit per ha (3,558,970.00 ≈ US$<br />
2,057.21), followed by those who cultured O. hornorum (1,262,320.00 ≈ US$ 729.67). The culture of O.<br />
ruvumae resulted into a loss of TZS 775,080.00 (≈ US$ 448.02) per ha.<br />
CONCLUSIONS<br />
1. The Nile tilapia (Oreochromis niloticus) is superior to Jipe tilapia (Oreochromis jipe), Wami tilapia<br />
(Oreochromis urolepis hornorum) and Ruvuma tilapia (Oreochromis ruvumae) in terms of growth<br />
performance and survival rate.<br />
2. The Wami tilapia (Oreochromis urolepis hornorum) is better than the other species (Oreochromis jipe<br />
and Oreochromis ruvumae) and can be cultured in ponds and give performace like that of Nile tilapia.<br />
3. The culture of Nile tilapia (O.niloticus) in small-scale fish ponds is more profitable than the culture of<br />
Wami tilapia (O. hornorum) and Ruvuma tilapia (O. ruvumae).<br />
4. Instead of looking for other tilapia species to replace the Nile tilapia, other means of improving the<br />
performance of the Nile tilapia should be sought, including selective breeding and better feeding.<br />
REFERENCES<br />
Hussain M.G., Kohinoor A.H.M., Islam M.S., Mahata S.C., Ali M.Z., Tanu M.B., Hossain M.A. and<br />
Mazid M.A. 2000. Genetic evaluation of GIFT and existing strains of Nile Tilapia, Oreochromis<br />
niloticus L.,under on-station and on-farm conditions in Bangladesh. Asian Fisheries Science 13: 117-<br />
126<br />
Kaliba A.R., Osewe K.O., Senkondo E.M., Mnembuka B.V. and Quagrainie K.K. 2006. Economic<br />
Analysis of Nile Tilapia (Oreochromis niloticus) Production in Tanzania. Journal of the World<br />
Aquaculture Society 37 (4): 464 – 473.<br />
Neves P. R., Ribeiro R. P., Vargas L., Natali M.R.M., Maehana K. R. and Marengoni N.G. 2008.<br />
Evaluation of the Performance of Two Strains of Nile Tilapia (Oreochromis Niloticus) In Mixed<br />
Raising Systems. Brazilian Archives of Biology and Technology 51 (3): 531 – 538<br />
Rice, M.A., A. J. Mmochi, L. Zuberi and R.M. Savoie. 2006. Aquaculture in Tanzania. World<br />
Aquaculture 37(4):50-57<br />
SAS (1998). Statistical Analysis System, SAS/STAT user’s guide. Statistical Analysis Institute, Inc.,<br />
Cary, NC, USA.<br />
URT. 1997. National Fisheries sector policy and strategy statement. Ministry of Natural resources and<br />
Tourism, Dar es Salaam, Tanzania.<br />
550
Table 1: Water quality parameters in the experimental fish ponds<br />
Variable On – Farm Mean values On–station – Mean values<br />
Temperature 0 C 25.1 ± 1.3 25.2 ± 2.0<br />
DO 5.14 ± 1.4 5.4 ± 1.0<br />
pH 7.4 ± 0.7 6.7 ± 0.2<br />
Transparency 34.4 ± 8.2 42.2 ± 7.6<br />
Nitrate 0-0.5 0-0.5<br />
Nitrite 0-10 0-10<br />
Table 2: Comparison of growth performance (mean ± se) of different tilapia species reared on-station and on-farm<br />
Variable On–farm Species On–station Species<br />
Oreochromis<br />
urolepis<br />
hornorum<br />
Oreochromis<br />
niloticus<br />
Oreochromis<br />
ruvumae<br />
551<br />
Oreochromis<br />
urolepis<br />
hornorum<br />
Oreochromis<br />
niloticus<br />
FINAL REPORTS: INVESTIGATIONS 2009–2011<br />
Oreochromis<br />
ruvumae<br />
Oreochromis<br />
jipe<br />
FnWt (g) 41.2±2.4 b 67.6±2.4 a 17.6±2.4 d 26.4±3.8 c 26.7±3.1 c 23.4±3.2 cd 16.3±2.0 d<br />
Wt gain (g) 35.3±2.5 b 61.3±2.5 a 13.8±2.5 d 21.8±4.0 c 24.2±3.2 c 17.4±3.3 cd 12.3±2.0 d<br />
GR (g/d) 0.4±0.03 b 0.7±0.03 a 0.15±0.03 d 0.24±0.04 c 0.3±0.04 c 0.2±0.04 cd 0.14±0.02 d<br />
SGR 2.04±0.14 a 2.2±0.14 a 1.61±0.14 b 2.0±0.22 a 2.4±0.2 a 1.23±0.2 b 1.5±0.1 b<br />
FnL (cm) 12.7±0.2 b 15.1±0.2 a 10.0±0.2 d 12.1±0.4 b 11.5±0.3 bc 11.0±0.3 c 10.15±0.3 c<br />
FnWD (cm) 3.8±0.1 b 4.5±0.1 a 2.8±0.1 d 3.4±0.1 c 3.3±0.1 c 3.0±0.1 d 2.7±0.1 d<br />
Length gain (cm) 6.0±0.3 b 8.5±0.3 a 4.1±0.3 c 6.0±0.5 b 6.3±0.4 b 4.0±0.5 c<br />
Survival rate (%) 63.5 85.6 78.0 66.7 100 95.8 95.8
FINAL REPORTS: INVESTIGATIONS 2009–2011<br />
Table 3: Comparison of chemical composition (mean ± sd) of different tilapia species reared on-station<br />
and on-farm<br />
Location Species DM (%) CP (%) EE (%) Ash (%)<br />
On - farm O.niloticus 27.99±3.13 a<br />
52.23±2.7 b 16.83±1.64 b 13.27±1.37 a<br />
On – farm O.hornorum 25.59±1.95 a 58.09±1.2 a 30.12±10.86 a 14.46±1.53 a<br />
On - farm O.ruvumae 30.74±0.48 a 53.15±0.66 b 17.9±2.83 b 13.56±0.28 a<br />
On - station O.niloticus 33.83±8.49 a 62.86±3.91 a 16.92±2.8 b 14.08±0.30 a<br />
On – station O.hornorum 27.50±1.92 a 55.86±5.88 a 39.75±4.45 a 15.80±0.28 a<br />
On – station O. ruvumae 29.35±3.4 a 56.30±5.23 a 18.77±3.92 b 14.40±2.12 a<br />
On - station O.jipe 25.76±1.17 a 61.46±1.09 a 17.46±1.15 b 14.92±0.57 a<br />
Table 4: Gross margin analysis of the different tilapia species cultured in ponds of small-scale farmers<br />
Parameter Species<br />
O.niloticus O.hornorum O.ruvumae<br />
Fingerlings costs/ha 1,600,000.00 1,600,000.00 1,600,000.00<br />
Feed costs/ha 237,280.00 155,680.00 69,080.00<br />
Labour/ha 540,000.00 540,000.00 540,000.00<br />
Transport 150,000.00 150,000.00 150,000.00<br />
Total variable costs/ha 2,527,280.00 2,445,680.00 2,359,080.00<br />
Fish yield, kg/ha 1352.50 824.00 352.00<br />
Fish price/kg 4500 4500 4500<br />
Total revenue/ha from sales of fish 6,086,250.00 3,708,000.00 1,584,000.00<br />
Profit/ha 3,558,970.00 1,262,320.00 -775,080.00<br />
Note: The costs and revenue are computed in Tanzanian shillings (1730 TZS = 1 US$)<br />
552
553<br />
FINAL REPORTS: INVESTIGATIONS 2009–2011<br />
Training Program in Propagation and Hatchery Management of Tilapia<br />
(Oreochromis niloticus) and Catfish (Clarias gariepinus) in Ghana<br />
Quality Seedstock Development/Activity/09QSD05PU<br />
Stephen Amisah<br />
Kwame Nkrumah <strong>University</strong> of Science & Technology<br />
Kumasi, Ghana<br />
Kwamena Quagrainie<br />
Purdue <strong>University</strong><br />
West Lafayette, Indiana, USA<br />
Joseph Padi and Felix Attipoe<br />
Aquaculture Research Development Centre – Water Research Institute<br />
Akosombo, Ghana<br />
ABSTRACT<br />
Increasing government support for aquaculture development in Ghana has the potential to create new jobs<br />
and improve food security among poor households. Unfortunately, technical know-how and skills in<br />
fingerling production is fairly restricted and most fish farmers lack the basic skills required for a<br />
successful fish production regime. Training programmes in fish propagation and hatchery management of<br />
Tilapia (Oreochromis niloticus) and Catfish Clarias gariepinus were conducted in Ghana at two separate<br />
locations in the Eastern and Ashanti regions. The training targeted small to medium scale fish farmers and<br />
potential fish farmers to provide them with technical knowledge and skills to enhance sustainable<br />
production of Tilapia and catfish fingerlings from hatchery stage to maturity. Over 60 fish farmers were<br />
trained in hatchery management and propagation of tilapia and catfish. It is anticipated that the skills<br />
acquired would enhance capacity of farmers and result in sustainable production of tilapia and catfish<br />
fingerlings to cope with the rising demand for fingerlings for commercial fish farming.<br />
INTRODUCTION<br />
Whilst fish consumption per capita in Ghana is estimated to be as high as 20kg compared to the global<br />
average of 13kg per capita, the fish farming sector is confronted with several problems. In the aquaculture<br />
sector, technical problems associated with fish production, particularly the lack of quality fingerling<br />
supply has limited the supply of market size fish to meet increasing demand. Some of the major setbacks<br />
to the production of fish to meet the increasing fish demand in Ghana are limited hatchery facilities, lack<br />
of proper management in hatcheries, and lack of quality fingerlings. Knowledge on the propagation and<br />
hatchery management of early stages of the Nile Tilapia (Oreochromis niloticus) and the African catfish<br />
(Clarias gariepinus) remains considerably restricted. The shortfalls of quality fingerlings seriously affect<br />
small- and medium-scale commercial fish farms, with a considerable number of farmers continuing to<br />
rely heavily on fingerlings harvested from the wild.<br />
On the strength of these setbacks, a joint action by the Department of Fisheries and Watershed<br />
Management of Kwame Nkrumah <strong>University</strong> of Science and Technology, Ghana, the Ghana Fisheries<br />
Commission and the Aquaculture Research Development Centre - Water Research Institute (ARDEC-<br />
WRI), Ghana as well as Purdue <strong>University</strong>, USA, was undertaken to train fish farmers and potential fish<br />
farmers alike to acquire knowledge and practical skills in various aspects of fish hatchery, including
FINAL REPORTS: INVESTIGATIONS 2009–2011<br />
hatchery location and design, construction, operation and management; and fry and fingerlings production<br />
for the benefit of the small- and medium-scale sector of the aquaculture industry in Ghana. The joint<br />
action is in consonance with the pursuit of the national agenda to ensure food security and poverty<br />
reduction through fish farming to meet domestic fish requirements. There is, therefore, a need to focus on<br />
hatchery production and management, and fingerling production.<br />
Training Location<br />
To facilitate a considerable outreach and coverage for farmers in the country, the training sessions were<br />
conducted at two locations in Ghana: Aquaculture Research Development Centre (ARDEC-WRI) at<br />
Akosombo in the eastern region of Ghana to cater for those (but not exclusively) located in the Eastern,<br />
Volta, and Greater Accra regions. The other training session was held at the Fisheries Commission’s Pilot<br />
Aquaculture Centre at Tano-Odumasi near Kumasi to cater for the training needs of the Ashanti, Brong<br />
Ahafo and the adjoining regions.<br />
METHODOLOGY<br />
A 2-day practical hands-on approach was adopted for the workshop training of farmers at both locations.<br />
The program followed both the lecture format with classroom presentations / lecture and a practical<br />
hands-on session where workshop participants handled fish for various purposes. Participants handled<br />
fish to examine and differentiate the sexes, identify mouth brooders incubating their eggs in the mouth,<br />
strip fish for eggs, and for pituitary injection.<br />
Topics covered in the training program included the following:<br />
• Spawning: natural and artificial reproduction strategies of fish.<br />
• Managing eggs in mouth brooding tilapia<br />
• Hatchery management from egg, larval fish, fry, juvenile, and consequently grow-out into market size<br />
adults.<br />
• Management of fingerling production stages.<br />
• Developing strategies for induced spawning in the African catfish<br />
• Sex reversal techniques for Tilapia<br />
• Water quality management and threats to fish life stages<br />
• Packaging and transporting fingerlings<br />
OUTPUT<br />
The program trained over 60 fish farmers, 3 extension agents from the Fisheries Commission, several<br />
prospective fish farmers, and at least 2 research scientists. Each received practical-hands on approach to<br />
managing and handling fish from their early stages.<br />
Each participant was equipped with knowledge and skills in:<br />
• Identifying stages of the fish life cycle and identifying the progression from egg, larval fish, fry,<br />
juvenile, to adult and<br />
• Describing natural and artificial reproductive strategies of fish<br />
• Contrasting the reproductive strategies of tilapia and catfish.<br />
• Hands-on learning in fish early life cycle development management from spawning through the<br />
fingerling production stages.<br />
The training brought together collaboration of fish farmers, the Fisheries Commission, the Aquaculture<br />
Research Development Centre of the Water Research Institute, Council for Scientific and Industrial<br />
Research, Purdue <strong>University</strong> and an aquaculture expert from Kenya.<br />
554
555<br />
FINAL REPORTS: INVESTIGATIONS 2009–2011<br />
Brochures were produced that described the life cycle and reproductive strategies of Tilapia<br />
(Oreochromis niloticus). Clarias gariepinus is produced via induced spawning (hypophysisation) on the<br />
farm and induced spawning by adult fish and sex reversal techniques were taught during the training.<br />
DISCUSSION<br />
The training was found to be very timely and beneficial at a time when the government of Ghana is<br />
encouraging people to go into fish farming through the formation of workers brigade, cooperatives,<br />
farmer organizations, etc. It is hoped that the training will have a ripple effect as trained farmers will help<br />
train others or share new information from the training. It is expected that the knowledge acquired by the<br />
farmers will enhance their capacity to produce and manage their farms and hatcheries to improve quality<br />
fingerling production and ultimately aquaculture production to meet the deficit in fish demand.<br />
CONCLUSION<br />
The training has been successfully accomplished and farmers who participated have suggested that the<br />
training be repeated periodically for upcoming farmers and for the benefit of areas that could not be<br />
reached. On their part they would teach other farmers the techniques they learnt to sustain the effort.<br />
ACKNOWLEDGEMENTS<br />
We wish to acknowledge Dr. Seth Agyarkwah of the Water Research Institute (CSIR), Ghana, Mr.<br />
Mantey Mensah, former Director of the Directorate of Fisheries, Ghana, Mr. Poku Gyinaye of BIAV Fish<br />
farms, Ghana and Mr. James Mugo of Mwea Fish Farm, Kenya for their diverse contributions and inputs<br />
in the running of the training program.
FINAL REPORTS: INVESTIGATIONS 2009–2011<br />
Photos courtesy of Steve Amisah<br />
APPENDICES<br />
A workshop participant handling Nile tilapia to show incubating eggs in the mouth<br />
A workshop participant handling African catfish to differentiating between male and female;<br />
male on the left and female on the right<br />
556
557<br />
FINAL REPORTS: INVESTIGATIONS 2009–2011<br />
Workshop participants stripping catfish for eggs and another performing a pituitary injection.
FINAL REPORTS: INVESTIGATIONS 2009–2011<br />
Co-Management and Bivalve Sanitation for Black Cockles (Andara<br />
spp.) in Nicaragua<br />
Human Health Impacts of Aquaculture/Experiment/09HHI01UH<br />
Nelvia Hernández, Erick Sandoval and Juan Ramón Bravo<br />
Central American <strong>University</strong><br />
Managua, Nicaragua<br />
Maria Haws<br />
<strong>University</strong> of Hawai’i at Hilo<br />
Hilo, Hawai’i, USA<br />
ABSTRACT<br />
Black cockles (Anadara tuberculosa and A. similis) are an economic mainstay of many poor coastal<br />
communities in Latin America with over 2000 Nicaraguans directly benefitting from the harvest alone.<br />
Over-harvest and mangrove removal have reduced populations and the current regulatory system has been<br />
inadequate to fully address the situation. Beginning in 2006 as part of an integrated coastal management<br />
program (SUCCESS/USAID), and continuing under the auspices of <strong>AquaFish</strong> <strong>CRSP</strong>, several efforts<br />
began with the communities of the Aserradores Estuary to improve shellfish sanitation issues, increase<br />
direct revenues to cockle collectors and test whether voluntary, community-managed no-take zones would<br />
prove to be a feasible alternative management methods for cockles. Four no-take zones (25.56 ha total)<br />
were chosen, managed and monitored with direct participation by cockle collectors. After five years of<br />
monitoring, results indicate that A. tuberculosa cockle populations increased significantly both inside the<br />
no-take zones and in adjacent áreas. Increases were also observed for nearly all size classes for A.<br />
tuberculosa, but particularly for the smaller size classes, suggesting that the no-take zones resulted in<br />
increased recruitment. There was no significant change in A. similis populations. Following the success<br />
of this model, similar efforts are being pursued with other coastal communities in coordination with<br />
government agencies.<br />
INTRODUCTION<br />
Black cockles (Anadara tuberculosa and A. similis) are the most commonly harvested bivalves in<br />
Nicaragua, and are also a common fisheries target along most of the Pacific Coast of Latin America. In<br />
general, bivalve fisheries are generally overlooked in terms of fisheries management, with the result that<br />
in Latin America, most bivalve population are under considerable stress. This is also linked to issues with<br />
mangrove management, the habitat favored by Anadara spp. Lack of fully effective management methods<br />
and over-exploitation of cockle resources is considered to be an ubiquitous issue throughout Latin<br />
America (Mora and Moreno 2007, 2008; Silva and Bonilla 2001; Campos et al. 1990).<br />
Cockle management began in Nicaragua in 1985 with the passing of regulations intended to protect<br />
cockle stocks. These regulations established an annual closed season from April 21 to June 15. In 2008,<br />
additional regulations were approved that addressed cockle management issues in protected areas, many<br />
of which are inhabited by, and still fished by fishers. These regulations have not been effective in<br />
maintaining cockle populations, in part because the closed season is not fully respected by fishers.<br />
Enforcement is difficult in the remote coastal areas covered by dense mangroves. It also does not<br />
necessarily protect cockles during their peak reproductive season. Moreover, coastal inhabitants are<br />
driven by the need to collect cockles for daily subsistence and modest income (Cheves 2011); many<br />
cockle collectors have few alternatives other than cutting mangroves for firewood.<br />
558
559<br />
FINAL REPORTS: INVESTIGATIONS 2009–2011<br />
In an effort to find more effective means of maintaining cockle populations while not adversely affecting<br />
the fishers, in 2006 CIDEA began working with the Aserradores community to test alternative<br />
management methods, improve shellfish sanitation and increase benefits to collectors with support from<br />
the USAID SUCCESS program. Additional <strong>CRSP</strong> support in 2009 allowed for continuation and<br />
expansion of these efforts until 2012. The combined work over the last six years included:<br />
• Water quality testing to determine which areas of the estuary had sufficiently good water quality<br />
to allow for harvesting of cockles that are safe to eat (SUCCESS/USAID and <strong>CRSP</strong> 07IND0UH);<br />
• Testing of field and laboratory depuration methods and rates (<strong>CRSP</strong> 07IND0UH);<br />
• Development of a solar-powered, community operated depuration center (European Union); and<br />
• Establishment and monitoring of no-take zones to increase cockle populations (<strong>CRSP</strong><br />
09HHI01UH).<br />
This report addresses activity #4, which was the focus of the recent investigation (09HHI01UH).<br />
Study site<br />
The Aserradores Estuary is located on the Pacific coast of Nicaragua in the Department of Chinandega,<br />
approximately 169 km from the capital of Managua (Figure 1). There are approximately 450 inhabitants<br />
in the villages living in 110 houses. The villages are relatively new settlements, being initially populated<br />
from neighboring areas by fishers looking for better disembarkation sites. Seventy-four percent of the<br />
residents fish, 24% harvest cockles and 1% cut mangroves for firewood (CIDEA 2007). Fishing volume<br />
and average fish sizes have declined, and the patterns of good fishing days have also changed. Previously,<br />
the fishers could count on at least 15 days of good fishing monthly, now they usually only have good<br />
catchs for 2-3 days per month (Reyes 2011). Some tourism is now growing in the area, but the decline in<br />
fishing has put increased strains on the cockle fishery.<br />
The Aserradores Estuary has 3,976 ha of mangroves, the majority of which is red mangrove (CATIE<br />
2001). The extensive mangrove forest is used for cockle collection and cutting for firewood.<br />
Figure 1. Location of the community of Aserradores<br />
in the Department of Chinandega, Nicaragua.<br />
Asseradores was chosen as original test site for this work in 2006 due to the high level of participation in<br />
the cockle fishery by its inhabitants. It was also considered a model site due to the generally poor<br />
economic status of the community and the multiple stressors on the community, as well as the<br />
surrounding habitats. This village exemplifies dozens of other small, coastal villages which depend on<br />
natural resources and which are socially marginalized.<br />
The stakeholders who harvest cockles consist of 78 families in two small villages within the area.<br />
Ninety-four percent of these villagers depend largely upon cockle harvest. Complete data does not exist
FINAL REPORTS: INVESTIGATIONS 2009–2011<br />
for the entire area, but for one of the smaller villages (Teodoro King), there are 311 people, of which 157<br />
are women. The population, like the rest of Nicaragua, is relatively young, with 64.3% of the population<br />
being 20 years of age or younger. Women-headed households are common. Only 0.3% of the population<br />
is over 65 years of age<br />
MATERIALS AND METHODS<br />
The approach used to develop a co-management system for cockle was based on principles for<br />
community participation in coastal management initiatives articulated in Olsen and Ochoa (2004). Work<br />
with the Aserradores community began in 2006 with a series of community visits, workshops and general<br />
awareness-raising activities. Part of these activities were exercises with the community to chose the<br />
estuary areas where the voluntary no-take management zones would be located. At the same time, CIDEA<br />
initiated other management activities with the communities such as testing depuration of the cockles to<br />
improve human health, and evaluate the possibility of certification to improve the price paid to the<br />
collectors.<br />
Initially three no-take zones were selected with the communities, and three years later, another no-take<br />
area was added at the suggestion of the community. Currently the total area under management as one of<br />
the no-take zones is 26.56 ha (Table 1).<br />
Table 1. Description of no-take zones.<br />
No Name Size (ha) Date declared as a no-take zone<br />
1 Los Tonos 4.22 Sept. 6, 2006<br />
2 Río Viejo 5.95 Sept. 6, 2006<br />
3 Castepe 10.39 Sept. 6, 2006<br />
4 La Chanchera 6.00 April 19, 2009<br />
In choosing the no-take zones with the community, several criteria were used: 1) the sites would be<br />
distributed such that no segment of the cockle collecting population was inequitably affected by the<br />
prohibition on harvesting; 2) the areas should be easily marked and recognized; 3) historically cockles<br />
had been present and harvested there; and 4) were sites not subject to wide flucuations in salinity.<br />
560
Río Viejo<br />
Castepe<br />
Los Tornos<br />
La Chanchera<br />
561<br />
FINAL REPORTS: INVESTIGATIONS 2009–2011<br />
Legend<br />
Areas<br />
4.22 ha<br />
5.95 ha<br />
10.39<br />
ha<br />
6.00 ha<br />
Figure 2. Location of the no-take zones within the Aserradores Estuary.<br />
Each no-take zone was demarcated using painted plastic bottles which were hung in the surrounding<br />
mangrove trees above the high tide zone (Figure 3). The markers were periodically replaced. Meetings<br />
and visits within the cockle collecting villages were held to assure that everyone was familiar with the<br />
areas, the voluntary rules on collection and the potential benefits to the communities. General educational<br />
awareness presentations were also given.<br />
Figure 3. Painted plastic bottles were used to mark the boundaries of the no-take zones.<br />
To determine the cockle population density, a stratified sampling method was used. Fourteen 14 points<br />
within the estuary were selected for sampling. Six of these were located at points along the principal<br />
branch of the estuary (harvested areas) and two in or near each no-take zone. Of the latter two, one was<br />
within the boundaries of the no-take zone and one was located 100 meters from the no-take zone.<br />
Sampling in the latter was of interest to determine if a possible spill-over effect would result from the<br />
management of the no-take zones. Coordinates of the sampling sites are presented in Table 2 and a map<br />
of the sampling sites is shown in Figure 4. For each sampling event, three replicate plots (4 m 2 each)<br />
within each site were sampled. The participation of the cockle collectors, including children, was
FINAL REPORTS: INVESTIGATIONS 2009–2011<br />
essential for the sampling as cockles are difficult for non-experienced people to find, given their habit of<br />
living amongst mangrove roots. Even with this expert help, population numbers may be under-counted.<br />
Table 2. Sampling sites to determine population densities.<br />
No Designation Coordinates<br />
X Y<br />
1 Point No.1 463656 1396888<br />
2 Point No.2 464457 1396355<br />
3 Point No.3 465273 1398249<br />
4 Point No.4 465895 1397454<br />
5 Point No.5 465072 1398514<br />
6 Point No.6 465145 1398738<br />
7 Los Tornos inside (within no-take zone) 465700 1394100<br />
8 Los Tornos outside (adjacent to no-take zone) 465600 1394200<br />
9 Río Viejo inside (within no-take zone) 463685 1397411<br />
10 Río Viejo outside (adjacent to no-take zone) 463946 1397273<br />
11 Castepe inside (within no-take zone) 465932 1398943<br />
12 Castepe outside (adjacent to no-take zone) 465373 1399086<br />
13 La chanchera inside (within no-take zone) 466243 1396571<br />
14 La Chanchera outside (adjacent to no-take zone) 465845 1396458<br />
562<br />
No-take<br />
zones<br />
Areas adjacent to<br />
no-take areas<br />
Unmanaged<br />
areas<br />
Figure 4. Map of the sampling sites within the Aserradores Estuary. The no-take zones are<br />
indicated, as well as the sampling sites that are adjacent to the no-take zones and sampling<br />
areas which were not under management, i.e. subject to uncontrolled cockle harvest.
563<br />
FINAL REPORTS: INVESTIGATIONS 2009–2011<br />
Cockles (Anadara tuberculosa and A. similis) were then removed from each of the sample sites. Three<br />
replicate samplings were taken at each of the 14 sample sites and each sample comprised an area of 4 m 2 .<br />
Between 2006 and 2011, eight sampling periods occurred. These represented months 0 (initiation of the<br />
trial), 6, 12, 23, 30, 49, 55 and 59 months. Data collected included the number of cockles at each site, and<br />
length (DVM) and weight. Data was analyzed using SPSS software for ANOVA, box plots and frequency<br />
histograms.<br />
RESULTS<br />
Population Densities<br />
At the establishment of the no-take zones, minimum and maximum densities for both species were 1.42 ±<br />
0.45 and 5.17 ± 0.45 cockles/m 2 , respectively, and the mean was 3.07 ± 0.45 cockles/m 2 . For A.<br />
tuberculosa, the minimum density was 1.33 ± 0.37 cockles/m 2 and the maximum was 4.42 ± 0.37<br />
cockles/m 2 . For A. similis, the minimum density was 0.08 ± 0.08 cockles/m 2 and the maximum was 0.75<br />
± 0.08 cockles/m 2 (Table 3).<br />
Table 3. Cockle densities at the beginning of the study. Minima and maxima are the average for<br />
each parameter among all the sites.<br />
Population densities at the beginning of the<br />
study (cockles/m 2 )<br />
A. tuberculosa and<br />
A. similis<br />
Anadara<br />
tuberculosa<br />
Anadara<br />
similis<br />
Initial minimum population density 1.42 ± 0.45 1.33 ± 0.37 0.08 ± 0.08<br />
Initial maximum population density 5.17 ± 0.45 4.42 ± 0.37 0.75 ± 0.08<br />
Initial mean population density 3.07 ± 0.45 2.71 ± 0.37 0.37 ± 0.08<br />
Fifty-nine months after establishment of the no-take zones, the combined average densities for the two<br />
species had increased from 3.07 ± 0.45 to 8.02 ±1.08 cockles/m 2 , representing an increase of 4.95<br />
cockles/m 2 . The minimum and maximum densities were 1.92 ± 1.08 cockles/m 2 and 19.75 ± 1.08<br />
cockles/m 2 for both species. The final mean densities for the two species was 7.62 ± 0.97 cockles/m 2 (A.<br />
tuberculosa) and 0.40 ± 0.12 cockles/m 2 (A. similis) (Table 4).<br />
Table 4. Cockle densities at the end of the study (after 59 months of management). Minima and<br />
maxima are the average for each parameter among all the sites.<br />
Population densities at 59 months after<br />
initiation of the study (cockles/m2)<br />
A. tuberculosa and<br />
A. similis<br />
Anadara<br />
tuberculosa<br />
Anadara<br />
similis<br />
Final minimum population density 1.92±1.08 1.83±0.97 0.00±0.12<br />
Final maximum population density 19.75±1.08 19.08±0.97 1.25±0.12<br />
Final mean population density 8.02 ± 1.08 7.62±0.97 0.40±0.12
FINAL REPORTS: INVESTIGATIONS 2009–2011<br />
ANOVA analysis show that population increases for A. tuberculosa were significantly higher, but<br />
changes for A. similis densities over the 59 months of management were not significantly different (Table<br />
5).<br />
Table 5. ANOVA results for cockles densities at zero and 59 months.<br />
Density (cockles/m 2 )<br />
Anadara tuberculosa<br />
Density (cockles/m 2 )<br />
Anadara similis<br />
Between groups<br />
Sum of<br />
squares df<br />
564<br />
Mean<br />
square F Sig.<br />
258.195 5 51.639 4.296 .002<br />
Within groups 769.340 64 12.021<br />
Total 1027.535 69<br />
Between groups<br />
.393 5 .079 .470 .797<br />
Within groups 10.699 64 .167<br />
Total 11.092 69<br />
Given that changes in population densities over the 59 months of management did not change<br />
significantly for A. similis, the following discussion presents the detailed results for A. tuberculosa only.<br />
The box plot for A. tuberculosa densities at all sampling sites shows some flucuations in the average<br />
density over the years between 2006 and 2011. The overall trend is an increase in densities. The fourth<br />
no-take area, “La Chanchera”, which was established in 2009, always had population densities higher<br />
than at the other sampling points (Figure 5).<br />
20.000<br />
15.000<br />
10.000<br />
5.000<br />
Densidad poblacional (inv/m2) Anadara tuberculosa 25.000<br />
0.000<br />
2006<br />
Rio Viejo dentro<br />
2008<br />
2009<br />
Años del Monitoreo<br />
Figure 5. Box plot for A. tuberculosa densities combined for all sampling points.<br />
2007<br />
la chanchera dentro<br />
2010<br />
la chanchera dentro<br />
la chanchera dentro<br />
2011
565<br />
FINAL REPORTS: INVESTIGATIONS 2009–2011<br />
The densities for the sampling points within the no-take zones and the adjacent areas, shows a pattern<br />
similar to the densities considered for all sampling points (Figure 6).<br />
20.000<br />
15.000<br />
10.000<br />
5.000<br />
Densidad poblacional (ind/m2) Anadara tuberculosa 25.000<br />
0.000<br />
Los Tornos dentro<br />
2006<br />
Rio Viejo dentro<br />
2007<br />
2008<br />
2009<br />
Años del Monitoreo<br />
la chanchera dentro<br />
Figure 6. Population densities for A. tuberculosa for sampling stations within the no-take zones and the<br />
adjacent areas.<br />
ANOVA results (Table 6) also indicate that the population densities for A. tuberculosa inside the no-take<br />
zones and the adjacent areas did not differ significantly. Figure 7 shows the densities for the sampling<br />
stations within the no-take zones, while Figure 8 presents the results from sampling points from areas<br />
where harvest was permitted.<br />
Table 6. A. tuberculosa densities within the no-take zones and at adjacent<br />
sites.<br />
Sum of<br />
Mean<br />
squares df square F Sig.<br />
Between groups 164.151 5 32.830 2.056 .090<br />
Within groups 670.728 42 15.970<br />
Total 834.878 47<br />
2010<br />
la chanchera dentro<br />
la chanchera dentro<br />
2011
FINAL REPORTS: INVESTIGATIONS 2009–2011<br />
2008<br />
2009<br />
Años del Monitoreo<br />
Figure 7. A. tuberculosa population densities in the no-take zones.<br />
20.000<br />
15.000<br />
10.000<br />
5.000<br />
Densidad poblacional (ind/m2) Anadara tuberculosa 25.000<br />
0.000<br />
20.000<br />
15.000<br />
10.000<br />
5.000<br />
Densidad poblacional (ind/m2) Anadara tuberculosa 25.000<br />
0.000<br />
Los Tornos dentro<br />
2006<br />
2006<br />
2007<br />
2008<br />
2009<br />
Años del Monitoreo<br />
Figure 8. A. tuberculosa population densities in the areas where harvest was allowed.<br />
At the end of 2011, the mean population density for all sites increased significantly (Figure 9, blue<br />
histogram). The highest individual counts encountered among the sites also increased from 11 to 22<br />
cockles, although flucuations in maximum counts varied over time (Figure 9, green trend line).<br />
566<br />
pts4<br />
2010<br />
2010<br />
2011<br />
2011
25.000<br />
Densidad Mean poblacion Density media (cockles/m de Anadara<br />
tuberculosa 2 )<br />
2006<br />
2007<br />
2008<br />
2009<br />
Años Year del Monitoreo<br />
50<br />
40<br />
30<br />
Frecuencia 60<br />
20<br />
10<br />
0<br />
567<br />
0.00<br />
10.00<br />
FINAL REPORTS: INVESTIGATIONS 2009–2011<br />
Figure 9. Mean densities for all sampling sites (in blue histogram) and maximum count at any sampling<br />
site during the sampling period (green line). In the case of years where two samplings were conducted,<br />
results are combined to represent the average for that year.<br />
Population structure<br />
According to the distribution histogram, there was an increase in all size classes, but particularly for the<br />
size classes between 5 and 50 mm for A. tuberculosa (Figure 10).<br />
50<br />
40<br />
30<br />
Frecuencia 60<br />
20<br />
10<br />
0<br />
20.000<br />
15.000<br />
10.000<br />
0.00<br />
5.000<br />
0.000<br />
11<br />
3.154<br />
4.491<br />
Media =23.1903<br />
Desviación típica =11.61577<br />
N =192<br />
10.00<br />
20.00 30.00 40.00<br />
0 meses peso (gr)<br />
7<br />
50.00<br />
7<br />
6.571<br />
60.00<br />
12<br />
4.737<br />
Media =20.7901<br />
Desviación típica =11.<br />
72849<br />
N =517<br />
20.00 30.00 40.00<br />
59 meses peso (gr)<br />
Figure 10. Size class distributions at months 0 (left) and 59 (right) for A. tuberculosa.<br />
11<br />
3.902<br />
2010<br />
22<br />
8.091<br />
2011<br />
25<br />
20<br />
15<br />
10<br />
5<br />
0<br />
Count<br />
Maximum count at sampling site<br />
50.00<br />
60.00
FINAL REPORTS: INVESTIGATIONS 2009–2011<br />
DISCUSSION AND CONCLUSION<br />
Information on cockle population densities is not available for the Aserradores Estuary for periods prior<br />
to initiation of this research. Arrechavala and Estrada (2004) found population densities for cockles at six<br />
Nicaraguan estuaries ranged from 0.005 to 0.82 cockles/m 2 for A.tuberculosa and 0.002 to 0.6 m 2 for A.<br />
similis. Silva and Bonilla (2001) found that A. tuberculosa densities in Costa Rica were 0.8±0.1 to<br />
1.2±0.1 cockles/m2. Densities in Ecuador were reported as 3.74±0.72 ind/m 2 (Mora and Moreno 2006).<br />
Since cockle densities for both species increased from 3.07 ± 0.45 cockles/m 2 in 2006 to 8.02 ± 1.08<br />
cockles/m 2 in 2011, representing an increase of 4.95 cockles/m 2 in 59 months, this suggests that the notake<br />
zones were effective in protecting the cockle population and led to an increase in population<br />
densities. The final results also compare favorably to the cockle densities found in other heavy fished<br />
estuaries in Nicaragua, Costa Rica and Ecuador. For the species A. tuberculosa, increases in densities<br />
over the 59 month period led to mean final densities (19.75 cockles/m 2 ) that were also much higher than<br />
those reported elsewhere. While A. similis populations did not display a signficant change in population<br />
densities, the densities at least did not decrease, which may have been a possibility considering the<br />
intensity of the cockle fishing in the area. One issue with both the lack of significant increases of A.<br />
similis over the 59 month period, as well as the flucuations in densities between years may be sampling<br />
error. Cockle distribution tends to be patchy. They can also be difficult to find and although most of the<br />
cockle collectors participating in the monitoring tended to participate throughout the five years, there<br />
could have been some change in either the expertise or level of effort among the collectors.<br />
The differences in population densities for A. tuberculosa and A. similis at the final stages of this study<br />
are not dissimilar to differences in populatio ratios for the two species encountered in other studies. In<br />
Ecuador the ratio of A. tuberculosa to A. similis was found to range from 3.5:1 to 4:1 (Mora and Moreno<br />
2006). The two species also occupy slightly different habitat types within the estuary. A. tuberculosa<br />
tends to be found in clay-like soil under Rhizophora mangle roots at a depth between 5-30 cm while A.<br />
similis is found between 15 and 50 cm in soft substrates in subtidal areas, often in open areas not covered<br />
by mangrove (Mora 1990; Fisher et al. 1995; Borda and Cruz 2004). A. similis may therefore be more<br />
subject to harvest and thus may need additional no-take zones to fully protect this species.<br />
The highest counts from any sampling site at each sampling period increased from 11 in 2006 to 22 in<br />
2011. This information is particularly persuasive to cockle collectors since their livelihoods depends on<br />
being able to readily locate patches of cockles with high counts in order to improve the efficiency of<br />
collection, particularly since collection time is limited by the tides. The ability to locate and collect large<br />
numbers of cockles also affects the cost per unit for collection since collectors may rent canoes to access<br />
some areas. Collectors reported that even at the first sampling period (6 months), their perception was<br />
that more cockles, particularly small cockles, were found in and around the no-take zones.<br />
Previous studies suggest that Anadara cockles may reproduce up to three times yearly (Garcia et al. 2008;<br />
Maldonaldo 2005). Reproductive size is believed to be between 23.2 and 26.2 2 mm (Ampie and Cruz<br />
1988) with the maximum size of 81 mm being reached in five years (de Madrigal 1980; Campos et al<br />
1990; Borda and Cruz 2004) for A. tuberculosa. The legal minimum size for the two species is 40 mm for<br />
A. similis and 50 mm for A. tuberculosa. Within the five year period of this study, at least two<br />
generations of cockles should have reached sexual maturity. The increases in the size classes under 50<br />
mm may be reflecting increased recruitment and growth of the smaller size classes. The lack of change in<br />
size classes above 50 mm and the lack of very large cockles, may indicate the continuing intensity of<br />
fishing for larger, legal sizes.<br />
568
569<br />
FINAL REPORTS: INVESTIGATIONS 2009–2011<br />
An important component of this work was the collaboration with other institutions and communities in<br />
order to replicate this work if the establishment of no-take zones as a management method proved to be<br />
successful. UCA collaborated closely with INPESCA, FUNDAR, MARENA, UNAN-León to conduct<br />
the research and to raise awareness of cockle management issues and approaches in other coastal<br />
communities. This included several efforts not originally included in the planned work, but which will<br />
contribute signficiantly to improved management of bivalve sanitation and fisheries management. UCA is<br />
now developing a solar powered depuration center in the Aserradores community. Government agencies<br />
and other communities are also now evaluating the use of no-take zones as a legally acceptable<br />
management method. Additionally, the institutions involved in this work also collaborated to develop a<br />
strategic management and development plan (2012-2016) for the cockle sector. Results from this work<br />
were presented at numerous community workshops, and two regional workshops (Cental America and<br />
Mexico) supported by <strong>CRSP</strong>. The latter is described in the final technical report for <strong>CRSP</strong> investigation<br />
09HHI02UH.<br />
This work demonstrates that this co-management method based on no-take zones can be an effective<br />
alternative management method. The successful implementation of this approach is only effective when<br />
both the community and the regulatory agencies fully engage with, and participate in the efforts. Long<br />
term sponsor support is also key. Time is needed to lay the ground work to implement no-take zones, as<br />
well to detect changes in populations densities and structure that are not only scientifically valid, but are<br />
observable to the communities supporting the efforts and sacrificing some of their gathering areas.<br />
Continual efforts to keep the community informed as to the results is also important to maintain their<br />
interest and support.<br />
LITERATURE CITED<br />
Arrechavala, C. and Estrada, R. 2004. Evaluación ecológica y bromatológica de las especies Anadara<br />
tuberculosa y Anadara similis en los departamentos de León y Chinandega. Universidad<br />
Centroamericana. Tesis.<br />
Ampie, C. and Cruz, A. 1988. Tamaño y madurez sexual de Anadara tuberculosa (Bivalvia:Arcidae) en<br />
Costa Rica.<br />
CATIE. 2001. Estrategia para el Desarrollo y la conservación de la zona costera municipio El Viejo,<br />
Nicaragua/CATIE, Alcaldía Municipal El Viejo, Instituto de Desarrollo Rural, Ministerio de<br />
Ambiente y Recursos Naturales. Turrialba, CR. 98 p Serie técnica No 321.<br />
Campos, J. Founier, M. Soto, R. (1990) Estimación de la población de Anadara tuberculosa en Sierpe –<br />
Terraba Costa Rica. Rev Biol. Trop. 38: 477-480<br />
Borda, C.A. and R. Cruz. 2004. Crecimiento y tasas de mortalidad del bivalvo Anadara tuberculosa<br />
(SOWERBY, 1833) en el Pacífico Colombiano. Rev. Invest. Mar. 25(3):177-184.<br />
Centro de Investigación de Ecosistemas Acuáticos (CIDEA). Universidad Centroamericana. 2007. Linea<br />
de base y trayectoria del cambio, comunidad de Aserradores. Municipio de El Viejo. Managua,<br />
Nicaragua. 40 pp.<br />
Centro de Investigación de Ecosistemas Acuáticos (CIDEA). Universidad Centroamericana. 2005.<br />
Estudio de mercado de moluscos, ostras, mejillones y almejas en Centroamérica y del mercado<br />
interno de conchas negras en Nicaragua. Managua, Nicaragua.<br />
Cheves, C. (15 de Abril de 2011). Las conchas negras tienen rostro de pobreza extrema. (results of<br />
interview conducted by Nelvia Hernandez.).<br />
Mora, e. and J. Moreno. 2006. Estado de la pesquería del recurso conchas (Anadara tuberculosa y A.<br />
similis) en la Costa Ecuatoriana. Instituto Nacional de Pesca. Ecuador.
FINAL REPORTS: INVESTIGATIONS 2009–2011<br />
García, F., A. Haro, A. García, and C. Marcial, F. Villalejo and S. Rodríguez. 2008. Ciclo reproductivo<br />
de Anadara tuberculosa (Sowerby, 1833) (Arcidae) en Bahía Magdalena, México. Revista de<br />
Biología Marina y Oceanografía 43(1): 143-152.<br />
Hernández, N., A. Saavedra and C. Hernández. 2011. Diagnóstico sobre el estado de aprovechamiento del<br />
recurso conchas negras (Anadara tuberculosa y Anadara similis) en la costa pacífica de Nicaragua.<br />
Instituto CIDEA, Universidad Centroamericana.<br />
Hernández, C. 1992. Diagnosis del recurso conchas de la región II del Pacífico de Nicaragua UNAN.<br />
León Nicaragua, 7 pag. No publicado.<br />
Mora, E. and J. Moreno. 2007. Abundancia y estructura poblacional de Anadara tuberculosa y A. similis<br />
en las principales áreas de extracción de la costa Ecuatoriana. Informe técnico INP.<br />
Mora, E. and J. Moreno. J. 2008. Variación temporal de las densidades de Anadara tuberculosa y A.<br />
similis en los ecosistemas de manglar de la costa ecuatoriana. Informe Tecnico<br />
Maldonado, J. 2005. Aspectos Biológicos y Pesqueros de la Concha Prieta (Anadara tuberculosa) en<br />
Puerto El Morro entre septiembre y diciembre de 2005. Instituto Nacional de Pesca Ecuador.<br />
Investigación de los Recursos Bioacuáticos y su Ambiente.<br />
Olsen, S. and E. Ochoa. 2004. Marco Metodológico y conceptual para la Planeación e Implementación<br />
del Manejo de Ecosistemas Costeros. Centro de Recursos Costeros Universidad de Rhode Island y<br />
Fundación EcoCostas. Guayaquil.<br />
Rendón, M., E. Suárez and M. Mejía. date unknown. Manejo sustentable y comercialización de concha<br />
prieta en cautiverio en Puerto el Morro (Provincia del Guayas), para su exportación hacia España.<br />
Facultad de Ciencias Humanísticas y Económicas. ESPOL.<br />
Reyes, J. 2011. (20 septiembre 2011). Owner of a cockle consolidation center in Aserradores. Personal<br />
Communication. (Interview by Nelvia Hernandez).<br />
Resolución No. 243-2009. Reglamento técnico RTCA 67.04.50:08. Centroamericano. Alimentos.<br />
Criterios microbiológicos para la inocuidad de alimentos.<br />
Silva, M. and R. Bonilla. 2001. Abundancia y morfometría de Anadra tuberculosa y A. similis (Mollusca<br />
Bivalvia) en Manglar de Purruja, Golfo Dulce, Costa Rica. Centro de Investigación en Cinecias del<br />
Mar y Limnología (CIMAR), Universidad de Costa Rica. San José.<br />
Villalobos, C. and A. Baez. 1983. Tasa de crecimiento y mortalidad de Anadara tuberculosa (Bivalvia:<br />
Arcidae) en dos sistemas de cultivo en el Pacífico de Costa Rica.<br />
Ville, C. W. Walkerand F. Smith. 1990. Invertebrados superiores. En: Biología. México, Editorial<br />
McGraw- Hill.<br />
570
571<br />
FINAL REPORTS: INVESTIGATIONS 2009–2011<br />
Capacity Building in Aquaculture, Fisheries Management and Coastal<br />
Management for Coastal Women Workshop: “Opportunities for Coastal<br />
Women in Fisheries, Aquaculture and Coastal Management”<br />
Human Health Impacts of Aquaculture/Activity/09HHI02UH<br />
Maria Haws<br />
<strong>University</strong> of Hawai’i at Hilo<br />
Hilo, Hawai’i, USA<br />
Eladio Gaxiola Camacho and Lorena Irma Camacho Lopez<br />
Universidad Autónoma de Sinaloa<br />
Culiacan, Sinaloa, Mexico<br />
Nelvia Hernandez, Erik Sandoval, Carlos Rivas,<br />
Juan Ramon Bravo and Eufresia Balladares<br />
Central American <strong>University</strong><br />
Managua, Nicaragua<br />
ABSTRACT<br />
Two regional workshops were held in Nicaragua and Mexico for 127 participants from Nicaragua,<br />
Mexico, Honduras and El Salvador to exchange experiences and knowledge in the fields of aquaculture,<br />
fisheries management and coastal management. These workshops were designed to highlight the<br />
achievements of women’s groups. A video was also made which was shown on national televisión<br />
INTRODUCTION<br />
Since 1996, a team of UAS researchers has been working in coastal communities to develop coastal<br />
management efforts which culminated in two officially adopted coastal management plans (Bahia Santa<br />
Maria and Boca de Camichin). The findings and results from the Mexico work were published as part of<br />
the A<strong>CRSP</strong> program (Haws, et. al. 2008) and integrated into peer-reviewed publications as part of the<br />
USAID SUCCESS program (Crawford et. al. 2010; Haws et. al. 2010). Since that time, the same team<br />
and a number of partners from the education, government and private sectors have continued with<br />
implementation efforts following the recommendations of the management plans. A similar effort has<br />
been in place in Nicaragua since 1998, which led to the official adoption of the management plan for the<br />
Estero Real (Royal Estuary), a watershed which drains approximately 30% of Nicaragua and parts of<br />
Honduras and is a major tributary for the trinational Gulf of Fonseca. In both nations, the primary target<br />
groups have been socially-disadvantaged groups including women, fishers, disabled and indigenous<br />
groups. Women comprise approximately 80% of the total stakeholders involved. The range of the <strong>CRSP</strong><br />
work, including leveraged efforts and similar projects have included topics such as: fisheries comanagement,<br />
development of national regulations for previously unregulated fisheries species, alternative<br />
livelihoods (aquaculture, eco-tourism, handicrafts, bakeries), large-scale water quality monitoring,<br />
aquaculture best management practices, seafood sanitation and quality and bivalve sanitation. Two major<br />
cross-cutting themes in this work are conservation and food security. Although efforts have been made to<br />
disseminate the results of these many years of work for both the research and the extension efforts, more<br />
work needs to be done in this area. Additionally, although women are active and involved at all levels, the<br />
participation of women can be further enhance and their individual and collective capacity improved. This<br />
work proposed to accomplish this through holding two regional workshops, one in Nicaragua and one in
FINAL REPORTS: INVESTIGATIONS 2009–2011<br />
Mexico, to provide a venue for exchanging lessons learned and practical methods. Women, including<br />
young girls, were the primary audience for this work. Attempts were made to involve participants who<br />
had not had the opportunity to become involved previously.<br />
SPECIFIC OBJECTIVES INCLUDED:<br />
• Hold two regional workshops for women and female children to provide an opportunity to<br />
exchange lessons learned and identify future needs<br />
• Inclusion of young women to broaden the participation of women in the future<br />
• Provide training with a focus on alternative livelihoods (including aquaculture) that are<br />
specifically targeted to users of threatened natural resources (e.g mangrove wood cutters, shrimp<br />
post-larvae fishers)<br />
• Produce an outreach video highlighting the achievements of each nation’s women in these areas.<br />
This will be shown on TV channels in both countries and distributed to institutions working with<br />
these topics.<br />
METHODS<br />
Nelvia Herndez, Eufresia Balladares, Lorena Irma Camacho Lopez and Eladio Gaxiola took the lead on<br />
coordinating the planning and organization of the two workshops. Ms. Camacho Lopez (Sociologist)<br />
attended the workshop in Nicaragua and presented the coverage on the Mexico efforts. She was thus<br />
familiarized with the Nicaraguan efforts and was able to present that latter at the Mexico workshop. The<br />
Nicaragua workshop was regional in nature, with participants from Nicaragua, Honduras and El Salvador.<br />
The Mexico workshop was also regional, with women and community groups from the <strong>State</strong>s of Sinaloa,<br />
Nayarit, Sonora, Baja California Sur and Baja California Norte.<br />
RESULTS<br />
The Nicaragua workshop on July 26-27, 2011 and had 96 participants. Session topics included:<br />
• Development of an integrated plan for sustainable extraction (Gulf of Fonseca/El Salvador<br />
project).<br />
• Social Capital-a critical aspect of the success of oyster culture in Sinaloa Mexico (presented by<br />
Lorena Irma Camacho Lopez)<br />
• Seed production and culture of mangrove molluscs<br />
• Black cockle enclosure culture system<br />
• Program for alternative cockle fisheries management and shellfish sanitation<br />
• Visit to the voluntary no-take zones for black cockles in Asseradores Estuary<br />
• Visit to the cockle culture and tourism project in Las Peñitas-Leon<br />
The Mexico workshop took place in Guamúchil, Sinaloa, México on September 3 and 4, 2011. There 31<br />
participants on the first day and 28 on the second day. Session topics included:<br />
• Exchange of experiences from Baja California Sur, “Exportation of ornamental species”<br />
• Exchange of experiences from Nayarit <strong>State</strong>, “Women’s association of Boca de Camichin for the<br />
development of limited resources”<br />
• Exchange of experiences from Sonora <strong>State</strong>, “The only social cooperative of women oyster<br />
farmers”<br />
• Exchange of experiences from Baja California Sur, “Women shellfish growers”<br />
572
573<br />
FINAL REPORTS: INVESTIGATIONS 2009–2011<br />
• Exchange of experiences from Sinaloa <strong>State</strong>, “Women’s crab picking cooperative-production of<br />
crab meat”<br />
• Exchange of experiences from Sinaloa <strong>State</strong>, “Women’s production of handicrafts based on<br />
natural resources”<br />
• Exchange of experiences from Sinaloa <strong>State</strong>, “Playa Colorada Mariculture Cooperative”<br />
• Experiences from Nicaragua, “Women cockle collectors from Nicaragua”.<br />
• Tour of the oyster culture farm of the Playa Colorada Mariculture Cooperative.<br />
The workshops were video-taped and have been shown on Nicaraguan television. The participants<br />
expressed a high level of satisfaction with the workshops and the exchanges of information and<br />
experiences were valuable for all.<br />
CONCLUSION<br />
The workshop was very beneficial for increasing the level of communication and cooperation between the<br />
four institutions and the multiple community stakeholders participating in this work.<br />
BENEFITS<br />
One hundred twenty-seven participants from four countries increased their knowledge of approaches to<br />
sustainable fisheries and aquaculture.<br />
ACKNOWLEDGEMENTS<br />
The LSU, UHH, UAS and UCA teams are grateful to the Aquaculture and Fisheries <strong>CRSP</strong> which<br />
provided funding and support for this effort.<br />
REFERENCES<br />
Crawford, B.C., M.D. Herrera, N. Hernandez, C. Rivas-LeClair, N. Jiddawi, M. Semba, M.C. Haws.<br />
2010. Small scale fisheries management: lessons from cockle harvesters in Nicaragua and Tanzania.<br />
Coastal Management Journal. 38:195-215.<br />
Haws, M.C., B. Crawford, S.C. Ellis, N. Jiddawi, A. Mmochi, E. Gaxiola-Camacho, G. Rodriguez-<br />
Dominguez, G. Rodriguez, J. Francis, C. Rivas-LeClair, A. Saborio-Coze, N. Hernandez, E.<br />
Sandoval, K. Dabrowski, M.C. Portella and M. Jaroszewska. 2010. Aquaculture research and<br />
development as an entry-point and contributor to natural resources and coastal management. Coastal<br />
Management Journal: 38: 238-261.<br />
Haws, M.C., E. Ochoa-Moreno and A.A. Rojas Umana. 2008. (eds.). Human Health and Aquaculture:<br />
three case studies of the relationships between human health, the environment and aquaculture in<br />
coastal communities of Sinaloa, Mexico. Pond Dynamics/Aquaculture Collaborative Research<br />
Support Program, <strong>Oregon</strong> <strong>State</strong> <strong>University</strong>. 157 pp.