Mountain Glaciers
Mountain Glaciers
Mountain Glaciers

You also want an ePaper? Increase the reach of your titles
YUMPU automatically turns print PDFs into web optimized ePapers that Google loves.
<strong>Mountain</strong> <strong>Glaciers</strong><br />
By<br />
Marcus Arnold,<br />
James Clayton,<br />
Yogesh Karyakarte,<br />
Josianne Lalande
Index<br />
1. Introduction: ....................................................................................................................................... 1<br />
2. Purpose of study: ................................................................................................................................ 4<br />
3. Formation of a glacier: ........................................................................................................................ 4<br />
Glacial Landforms/Geomorphological Structures: .................................................................................. 5<br />
4. <strong>Mountain</strong> glacier landsystem: ........................................................................................................... 10<br />
Plateau ice field..................................................................................................................................... 10<br />
Glaciated valley systems ....................................................................................................................... 11<br />
Trimlines and weathering zones ........................................................................................................... 12<br />
<strong>Mountain</strong> ice field landsystem .............................................................................................................. 13<br />
5. Mass Balance of <strong>Mountain</strong> <strong>Glaciers</strong>:- ................................................................................................ 13<br />
Mass balance measurements techniques:- ........................................................................................... 14<br />
Direct measurements:- ......................................................................................................................... 14<br />
Remotely-sensed techniques:- .............................................................................................................. 15<br />
6. Retreat of glaciers:- ........................................................................................................................... 18<br />
7. Impacts on humans ........................................................................................................................... 23<br />
8. References: ....................................................................................................................................... 27<br />
<strong>Mountain</strong> Glacier Page ii
Index of figures<br />
Figure 1. Locations of mountain glacier - (Shape file = WGI- 2012, s/w: ArcGIS 9.2) .................................. 1<br />
Figure 2. Global distribution and surface area of glaciers (excluding the Greenland and Antarctic).<br />
<strong>Glaciers</strong> are divided into 100 regions ( shown in solid bars ); each region may represent one or many<br />
individual glaciers (Z. Zuo and J. Oerlemans, 1997) ................................................................................... 2<br />
Figure 3. Snow to Ice transformation. Source:<br />
http://www.thenakedscientists.com/forum/index.php?topic=38675.50 .................................................. 5<br />
Figure 4. Image depicting the formation of a Cirque. Source:<br />
http://www.bbc.co.uk/schools/gcsebitesize/geography/glacial_landscapes/glacial_erosion_landforms_r<br />
ev1.shtml .................................................................................................................................................... 6<br />
Figure 5. Image depicting the formation of a tarn. Source:<br />
http://www.geocaching.com/seek/cache_details.aspx?guid=83c76e57-5727-4e83-adde-bb0e357178196<br />
Figure 6. : A cirque and cirque glacier. Source: http://www.prairie.illinois.edu/shilts/gallery/shilts-<br />
0004.shtml .................................................................................................................................................. 7<br />
Figure 7. Evidence of past cirque glaciers in Iceland Photo: Mats Wibe Lund www.myndasafn.is ............ 7<br />
Figure 8. Cirques and Arete’s. Source: http://resources.teachnet.ie/ajordan/arete.jpg ............................ 8<br />
Figure 9. Large Arete. Source: http://www.nps.gov/glac/gallery/parkpics.htm ......................................... 8<br />
Figure 10. The Matterhorn. Source: http://countries-of-europe.com/wpcontent/uploads/2011/02/Matterhorn1.jpg<br />
.............................................................................................. 9<br />
Figure 11. Pyramidal Peak formation. Source:<br />
http://www.revisionworld.co.uk/files/pyramidal%20peak_0.jpg .............................................................. 9<br />
Figure 12. Large piedmont glaciers in the Canadian Arctic. Source:<br />
http://www.swisseduc.ch/glaciers/glossary/piedmont-glacier-en.html .................................................. 10<br />
Figure 13. Scematic diagram of landforms produced by plateau ice field landsystem (source : Benn &<br />
Evans, 2010) .............................................................................................................................................. 11<br />
Figure 14. End memnbers of the glaciated valley landsystem continuum defined by debris and ice sypply<br />
(source : Benn & Evans, 2010) .................................................................................................................. 12<br />
Figure 15. Glacial geomorphology from Scottish Highlands. Map of moraine ridges and mounds in valleys<br />
(source : Benn & Evans, 2010) .................................................................................................................. 13<br />
Figure 16. Regression relationship between accumulation area ratio and mass balance for Shaune<br />
Garang and Gor Garang glaciers. (Kulkarni et al, 2004) ............................................................................ 16<br />
Figure 17. Modelled surface mass balance from all glacierized grid cells 1961 – 2004 (10-3 mm SLE a-1).<br />
(Hock et al 2009) ....................................................................................................................................... 17<br />
Figure 18. 5 year running means of the annual mean net balance for 50 years for 17 regions. The bold<br />
black line indicates the area-weighted global mean, while the black straight lines indicate the<br />
accelerations for the periods of the last 50 years 1961–2010 ( thi ........................................................... 18<br />
Figure 19. Left: cumulative mass balance of the Tuyuksu glacier, 1937 –56 calculated from climate data,<br />
from 1957 measured data; right: area change since 1957 (sources: Dyurgerov et al., 1996, WGMS,<br />
http://www.geo.unizh.ch/wgms/ ). From Tobias Bolch, 2007 .................................................................. 19<br />
<strong>Mountain</strong> Glacier Page iii
Figure 20. Glacier area change and area measurements (%) based on Corona (27 September 1968) and<br />
ASTER (2006)............................................................................................................................................. 19<br />
Figure 21. Satellite imagery of IRS LISS-IV sensor from 16 September 2006 showing retreat of the<br />
Samudra Tapu glacier, Himachal Pradesh, India from 1976 (Kulkarni et al, 2011) .................................... 20<br />
Figure 22.. Glacier length records from different parts of the world. (Orlemans , 2005) ......................... 21<br />
Figure 23. : A collection of twenty glacier length records from different parts of the world. (IPCC Third<br />
Assessment Report, 2001) ........................................................................................................................ 22<br />
Figure 24. . Mount Kilimanjaro satellite images from 1993 and 2000, showing the rapid retreat of the<br />
glacier (NASA Earth Observatory 2000). ................................................................................................... 25<br />
Figure 25. The annual contribution from glaciers to sea level change (left axis, mm/yr), and cumulative<br />
value (right axis, mm) based on area-weighted averaged mass balance (National Snow and Ice Data<br />
Center 2006). ............................................................................................................................................ 26<br />
Index of tables<br />
Table 1. WGI - Glacier surface area, volume, and mean thickness (Atsumu Ohmura, 2011). ..................... 3<br />
Table 2. Change in glacier area for Chenab basin, India - indicating higher loss of area in smaller glaciers<br />
.................................................................................................................................................................. 20<br />
Table 3. Glacier retreat in Himalayas, Kulkarni et al, 2011........................................................................ 23<br />
<strong>Mountain</strong> Glacier Page iv
1. Introduction:<br />
A glacier cannot form unless is it above the snowline, the lowest elevation at which snow can<br />
survive year round. Precipitation and temperature plays main role in formation and survival of<br />
snow/ ice which form the glacier. <strong>Mountain</strong> glaciers are relatively well distributed worldwide<br />
and are found on every continent except for Australia. Most glaciers form in high mountain<br />
regions such as the Himalayas of Southern Asia or the Alps of Western Europe where regular<br />
snow and extremely cold temperatures are present. <strong>Mountain</strong> glaciers are also found in<br />
Antarctica, Greenland, Iceland, Canada, Alaska, and even South America (the Andes), California<br />
(the Sierra Nevada), and Mount Kilimanjaro in Tanzania. Figure 1 shows the locations of<br />
<strong>Mountain</strong> glaciers. The World Glaciological Inventory data shape file of 2012 used to prepare<br />
this map in ArcGIS 9.2.<br />
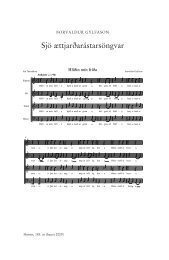
Z. Zuo and J. Oerlemans (1997) have estimated the surface area of glaciers from all part of the<br />
world (Figure. 2). The highest surface area was near Quttinirpaaq National Park of Canada<br />
followed by Svalbard and Himalayan glaciers.<br />
Figure 1. Locations of mountain glacier - (Shape file = WGI- 2012, s/w: ArcGIS 9.2)<br />
<strong>Mountain</strong> Glacier Page 1
Figure 2. Global distribution and surface area of glaciers (excluding the Greenland and Antarctic). <strong>Glaciers</strong> are divided into<br />
100 regions (shown in solid bars); each region may represent one or many individual glaciers (Z. Zuo and J. Oerlemans, 1997)<br />
Though the temperate and tropical mountain glaciers have very few mass compared to very large<br />
ice sheets and icecaps, they play major role in the environmental and social well-being of the<br />
mountain ranges in which they exist and the watersheds to which they drain. The general<br />
information about surface area, volume and thickness of glaciers is given in table 1 (Atsumu<br />
Ohmura, 2011).<br />
The Himalaya encompasses the world‟s third largest glacier systems after Antarctica and<br />
Greenland occupying about 15% of the mountain terrene. <strong>Glaciers</strong> are a source of continuous<br />
water supply to perennial river systems and two of the world‟s largest rivers, the Indus and<br />
Brahmaputra originate from these glacial lake systems and there by ensure round the year<br />
irrigation facility to agriculture, which is the main string of economy of the developing nations<br />
like of India.<br />
<strong>Mountain</strong> Glacier Page 2
Table 1. WGI - Glacier surface area, volume, and mean thickness (Atsumu Ohmura, 2011).<br />
<strong>Mountain</strong> Glacier Page 3
2. Purpose of study:<br />
<strong>Mountain</strong> glaciers are source of crucial water required by hundreds of millions of people,<br />
particularly in Asia and South America, with as many as one-sixth of the world‟s population<br />
residing in glacierized river basins. The water from these rivers is required for agriculture,<br />
industries and hydroelectricity power plants.<br />
<strong>Mountain</strong> glaciers are highly sensitive to climate change (Hoelzle et al. 2003) and as such, their<br />
study is of critical import for understanding and forecasting global environmental change<br />
(Knight 2006).<br />
<strong>Mountain</strong> glaciers are sensitive indicators of climate change, although which parameter is<br />
playing an important role and quantitative relationship between climate change and glacier<br />
fluctuations is still ambiguous, but it corresponded to a warming of ~ 0 .3 ºC in the first half<br />
of the 20th century in the northern hemisphere (Anthwal, et al, 2006). On the global scale, air<br />
temperature is considered to be the most important factor reflecting glacier retreat, but this has<br />
not been demonstrated for tropical glaciers (IPCC, 2001). So it is necessary to study these<br />
glaciers of different parts of world.<br />
<strong>Mountain</strong> glaciers are often the foci of tourism-based economies in otherwise impoverished<br />
communities, and their potential disappearance could have profound effect.<br />
3. Formation of a glacier:<br />
Now that we have looked at the factors which influence the formation of a mountain glacier, we<br />
will look at how the glacier itself is actually formed. Assuming that the conditions favourable to<br />
formation are met, we must look at how the transformation of snow to glacier ice occurs. As<br />
each accumulation season passes and more snow is deposited on top of the previous season,<br />
more pressure is applied to the underlying snow, or firn (which can be defined as snow which<br />
has survived one full ablation season (Furse, J, 2011)). This compression forces the snow to recrystallize,<br />
forming grains similar in size and shape to grains of sugar (National Snow & Ice<br />
Data Centre 2012). With time, the grains continue to grow and the region of air surrounding the<br />
growing grains becomes smaller resulting in the snow compacting and becoming denser<br />
(National Snow & Ice Data Centre 2012). Firn is the intermediate stage between snow and<br />
glacier ice. As this process continues, glacier ice is formed, and once it reaches a density of<br />
817kg/m cubed, it is referred to as glacier ice. It is also worth noting that very dry, cold snow is<br />
unfavourable to the birth of a glacier, as it is very un-cohesive, and will result in a longer time<br />
frame of snow to ice formation (Fig. 3).<br />
<strong>Mountain</strong> Glacier Page 4
Figure 3. Snow to Ice transformation. Source: http://www.thenakedscientists.com/forum/index.php?topic=38675.50<br />
Glacial Landforms/Geomorphological Structures:<br />
Cirques (corries) and Tarns:<br />
A cirque is a bowl-shaped basin that is created in the side of a mountain where glacial plucking<br />
has occurred (Fig. 4). Often a cirque forms where a glacier begins (Wilson Science, 2012). A<br />
cirque is the results of alpine glaciers, and can be up to around a square kilometre in size. They<br />
are formed when a glacier, with a presence of a large headwall depresses and erodes the land in a<br />
small area underneath it. Cirques are often situated at the beginning of a valley glacier. A cirque<br />
is often also home to a tarn, which is a lake caused by erosion and melt from the glacier (Fig. 5).<br />
<strong>Mountain</strong> Glacier Page 5
Figure 4. Image depicting the formation of a Cirque. Source:<br />
http://www.bbc.co.uk/schools/gcsebitesize/geography/glacial_landscapes/glacial_erosion_landforms_rev1.shtml<br />
Figure 5. Image depicting the formation of a tarn. Source:<br />
http://www.geocaching.com/seek/cache_details.aspx?guid=83c76e57-5727-4e83-adde-bb0e35717819<br />
<strong>Mountain</strong> Glacier Page 6
Figure 6. : A cirque and cirque glacier. Source: http://www.prairie.illinois.edu/shilts/gallery/shilts-0004.shtml<br />
Figure 7. Evidence of past cirque glaciers in Iceland Photo: Mats Wibe Lund www.myndasafn.is<br />
<strong>Mountain</strong> Glacier Page 7
Arete:<br />
An arête is the result of two cirque glaciers forming next to each other and eroding two side of a<br />
mountain leaving a knife like ridge between them as they erode backwards (Geography Site,<br />
2006). Common features are extremely steep sides and a sharp top edge, as seen in figure 8 and 9<br />
(Geography Site, 2006).<br />
Figure 8. Cirques and Arete’s. Source: http://resources.teachnet.ie/ajordan/arete.jpg<br />
Figure 9. Large Arete. Source: http://www.nps.gov/glac/gallery/parkpics.htm<br />
<strong>Mountain</strong> Glacier Page 8
Horn:<br />
A horn or pyramidal peak is formed when multiple glaciers erode the same mountain (Lemke, K,<br />
2010). As cirque retreat, if there is 3 or more acting upon the same mountain, a pyramidal peak,<br />
or horn will form. A classic example of this is the Matterhorn, in Valais, Switzerland (Fig. 10).<br />
Figure 10. The Matterhorn. Source: http://countries-of-europe.com/wp-content/uploads/2011/02/Matterhorn1.jpg<br />
Figure 11. Pyramidal Peak formation. Source: http://www.revisionworld.co.uk/files/pyramidal%20peak_0.jpg<br />
Piedmont <strong>Glaciers</strong>:<br />
<strong>Mountain</strong> Glacier Page 9
Piedmont <strong>Glaciers</strong> occur when steep valley glaciers flow out into a relatively flat plain, where<br />
they spread out, somewhat resembling a light bulb (NSIDC, 2012).<br />
Figure 12. Large piedmont glaciers in the Canadian Arctic. Source: http://www.swisseduc.ch/glaciers/glossary/piedmontglacier-en.html<br />
4. <strong>Mountain</strong> glacier landsystem:<br />
Plateau ice field<br />
They can be found at the fringe of the North Atlantic and Canadian Archipelago. It‟s a<br />
permanent snowfield at the onset of glacial conditions. When there is a very steep drop in a<br />
fjord, the glaciers are nourished below the ELA by dry calving from the glacier on the edge of<br />
the cliff. The landforms will be mostly produced at an advanced stage of local glaciations, in<br />
valleys between the plateaux. Since the glaciers are often cold-based, they leave little landmarks<br />
and do not transport much extra glacial debris. On the other side, some patches of warm-based<br />
ice, as seen around valley heads, drain the plateau summits eroding the land and creating debris<br />
that are transported which develops in marginal moraines. There is also the erratic that are<br />
emplaced by a regional ice flow over the plateaux. The largest accumulation will happen on<br />
lateral and latero-frontal moraines in valleys draining the plateaux. Push moraines can be found<br />
<strong>Mountain</strong> Glacier Page 10
at valley heads. Valley moraines are large cobble to boulder size angular material. Also, the<br />
active free faces can create enough debris to produce supra-glacial moraines and finally, the<br />
advance of outlet lobes into the lowlands filled with sediments will create large end moraines<br />
sequences. Some of these features can be found in the figure 13.<br />
Figure 13. Schematic diagram of landforms produced by plateau ice field landsystem (source : Benn & Evans, 2010)<br />
Glaciated valley systems<br />
There are very distinctive assemblages of sediments in this landform: ice-marginal, supra-glacial,<br />
sub-glacial, pro-glacial, sub-aquatic landform sediments. This system is unique since the valley<br />
sides are very important in the debris sources and topographic confinement of deposition. We<br />
can separate the system in two: high-relief and low-relief. The low-relief settings are found<br />
where the vertical distance between the two ridges is less than 1000 meters. For example, there<br />
are some in the glaciated valleys of Scotland, Norway and Labrador. The High-relief settings are<br />
characterized by steep valley sides, thousand of meters above the valley floor. They are<br />
associated with young or tectonically active mountain folds like in European and New Zealand<br />
Alps, High Andes and Himalaya.<br />
The beds of cirques glaciers can be separated into three zones: the erosional zone on the upper<br />
part. This zone is characterized by ice-moulded bedrock and bed erosion where one can find<br />
striations, roches moutonnées and abrasion. Second, the intermediate zone is down valley and is<br />
characterized by both depositional material and erosion. Thin tills can be found between the<br />
roche moutonnées and inside cavities. Third is the depositional zone, the lower part of the cirque<br />
covered by till. This pattern is similar to subglacial erosion found on continental ice sheet, but<br />
it‟s on a smaller scale that shows transport of debris down the margin of the glacier. Although<br />
the margins of the valley are often delimited by lateral-frontal moraines, it is important to<br />
consider the impact of melt water reworking the debris.<br />
<strong>Mountain</strong> Glacier Page 11
In the high-relief settings, we find margins well covered with supra glacial debris and<br />
sedimentation forming huge lateral-frontal dump moraines and ice contact fans and ramps. This<br />
forms a barrier for the glacier flow that can be 100 meters high. All the moraines left by the<br />
glacier usually do not last very long, they are eroded and all is left is erratic.<br />
These glaciers and not too much affected by minor climate change due to lateral-frontal moraine<br />
that keeps them from advancing and supra glacial debris covers that inhibits the ablation of the<br />
ice.<br />
A common feature of mountain glacier environment is temporary lakes that rapidly fill with<br />
sediments stretching into the valleys. When the dam retaining the water breaches, it can cause<br />
many damages to the villages established down the valley. The sediments accumulated will<br />
create terraces in the valley. These formations will easily be reworked and eroded with time,<br />
making it difficult to study.<br />
Figure 14. End members of the glaciated valley landsystem continuum defined by debris and ice supply (source: Benn &<br />
Evans, 2010)<br />
Trimlines and weathering zones<br />
Trimlines are the upper limit or valley sides of preserved erosion in glaciated valleys. Where<br />
deglaciation is recent, they are recognized by a limit of vegetation: striped off under the limit and<br />
developed vegetation above. In older glacial landscape, periglacial trimlines are preserved by<br />
studing the bedrock, where weathering or glacier advancing shows the upper limit. Several<br />
criteria are used to identify the trimlimes, which vary a lot depending on the rock type and<br />
structure and the slope activity. It is possible, coupled with lateral moraines and ice marginal<br />
landforms on the terrain to use the trimlines to reconstruct glaciological models and<br />
<strong>Mountain</strong> Glacier Page 12
paleoclimatic studies. This has been used in Scotland to show with more accuracy the glacial<br />
feature of the region.<br />
<strong>Mountain</strong> ice field landsystem<br />
<strong>Mountain</strong> ice field landsystem cover large areas of very different topography, and they develop<br />
in different climate ranges. Therefore, they can modify, disturb elements of smaller-scale<br />
landsystems and pre-existing deposits. Their margins carry large amounts of glaciagenic<br />
material; those are well seen from the Quaternary advances of piedmont glacier in Patagonia<br />
Icefield. It is very frequent to observe ice-dammed lakes that accumulate tons of sediments.<br />
These landforms will be best preserved in relatively low-relief settings.<br />
Figure 15. Glacial geomorphology from Scottish Highlands. Map of moraine ridges and mounds in valleys (source : Benn &<br />
Evans, 2010)<br />
5. Mass Balance of <strong>Mountain</strong> <strong>Glaciers</strong>:-<br />
<strong>Mountain</strong> Glacier Page 13
Specific mass balance is the change in the mass per unit area relative to the previous summer<br />
surface. Specific balance at the end of the balance year defines the annual balance or net balance<br />
for that year (The Physics of <strong>Glaciers</strong>). It is typically measured in units of mm of water<br />
equivalent depth.<br />
An increase in accumulation and or decrease in ablation will result in the addition of ice mass<br />
while increase in ablation and or decrease in accumulation will leads to the loss in mass of<br />
Glacier (Hagen and Reeh 2003).<br />
Net mass balance is typically calculated for the a single hydrological year (from the season of<br />
minimum ice mass in one year to the season of minimum ice mass in the next), with cumulative<br />
mass balance changes measured by summing the net balance of multiple years.<br />
Mass balance measurements techniques:-<br />
Mass Balance measurements are mainly of two types, viz. direct measurements and remotelysensed<br />
measurements.<br />
Direct measurements:-<br />
Direct measurement techniques consist of measurements carried out on the glacier itself. These<br />
provide the most accurate and detailed quantifications of mass balance changes (Kaser et al<br />
2003). But these techniques are restricted by economic and environmental difficulties.<br />
Direct measurements are carried out by following methods:-<br />
1) Stake method:-<br />
Stake measurements are made by placing iron rod into the glacier‟s surface. The snow/ice level<br />
marked on this rod. The repeatedly to determine how much mass is being added or removed<br />
between measurements. The ultimate variation from the beginning of one hydrologic year to the<br />
next represents the mass balance change for that year. Sometimes winter and summer mass<br />
balances are also measured separately.<br />
Multiple stake measurements made on different parts of the glacier are necessary for a relatively<br />
accurate estimate of total glacier change. The minimum number of ablation stakes needed to<br />
obtain a representative sample has been somewhat controversial, but generally it is assumed that<br />
10 is sufficient for small valley glaciers (less than 20 km²), with 10-20 necessary for larger<br />
glaciers up to 500 km² (Hagen and Reeh 2003).<br />
2) Geodetic surveys:-<br />
The other direct measurement technique is the use of geodetic surveys to calculate topographic<br />
changes of a glacier‟s surface area and elevation. Known points on the glacier surface are<br />
<strong>Mountain</strong> Glacier Page 14
surveyed from fixed stations off the glacier, with changes in the x, y, and z angles and distances<br />
used to measure addition or subtraction of glacial volume. The use of precise Global Position<br />
Satellite (GPS/ DGPS) survey techniques has been used to increase the accuracy.<br />
3) Hydrological balance method:-<br />
In the hydrological balance method, difference between accumulation by precipitation and<br />
ablation by evaporation, sublimation and runoff is estimated. Precipitation is measured at<br />
meteorological stations in water equivalent. Evaporation / sublimation rates are calculated by<br />
measurements of temperature, wind velocity and wind speed. Runoff is measured near snout at<br />
gauging stations.<br />
Mass Balance = Precipitation - Evaporation - Runoff<br />
Hydrological balance occurs when the amount of precipitation that falls on the glacier is matched<br />
by the volume of water lost via runoff and evaporation from the glacier. A positive difference<br />
reflects an increase in storage and thus a presumed increase in glacial mass; a negative difference<br />
represents a loss of storage and presumed wastage of glacial mass.<br />
But main disadvantage of this technique is snow may be added to glacial mass via wind or<br />
avalanche deposition as well (Hubbard and Glasser 2005).<br />
Remotely-sensed techniques:-<br />
Measurements of glacial mass balance changes utilize both aerial and satellite-based images to<br />
monitor variations in glacial surface area and surface elevation over time. This technique is very<br />
useful in that a significant time-series of images is often available, providing a means to monitor<br />
areal and volumetric changes of a glacier at a relatively fine temporal scale Acquisition of<br />
imagery is often easier and much less expensive than organizing field research on the subject<br />
glacier, especially in remote mountain ranges.<br />
Mass balance is measured by generally two ways.<br />
1) Estimation of changes in surface elevation:-<br />
In this methodology, Digital elevation model (DEM) is prepared by stereo pair satellite images<br />
like SPOT5, LIDAR (Jóhannesson et al, 2011) or SAR interferometry (Yu et al, 2010). DEMs<br />
are prepared for different time and the elevation change is calculated by subtracting one DEM<br />
from another.<br />
2) Relationship between AAR and specific mass balance<br />
AAR is a ratio between accumulation area and total glacier area (Meier et al, 1962). AAR is<br />
estimated by delineating snowline at the end of ablation season. A regression relationship<br />
<strong>Mountain</strong> Glacier Page 15
etween AAR and specific mass balance is established using field data of different years. If<br />
Regression analysis suggests a good correlation between AAR and mass balance, that equation<br />
can be used for estimation of specific mass balance of other glaciers of that region (Kulkarni et<br />
al, 2004).<br />
Kulkarni and coworkers (2004) have obtained regression equation for Shaune Garang and Gor<br />
Garang glaciers of Baspa Basin, Himachal Pradesh, India, which is then used to estimate specific<br />
mass balance of others glacier of that area. The correlation between accumulation area ratio and<br />
mass balance is plotted in Figure 16.<br />
Figure 16. Regression relationship between accumulation area ratio and mass balance for Shaune Garang and Gor Garang<br />
glaciers. (Kulkarni et al, 2004)<br />
The relationship between accumulation area ratio and mass balance is as follows.<br />
Y = 243.01 * X – 120.187<br />
Where, Y is the specific mass balance in water equivalent (cm) and X is the accumulation area<br />
ratio.<br />
Hock et al (2009) have used a grid-based modeling approach to estimate changes in surface mass<br />
balance on a global scale for <strong>Mountain</strong> glaciers and Ice caps. They have computed the global<br />
glacier surface mass balances on regular 1x1°global grid and converted into Sea level equivalent<br />
(SLE) (Sea level equivalent or SLE is defined as minus specific mass balance multiplied by<br />
glacier area divided by global ocean area) assuming that all glacier mass loss directly<br />
contributing to sea level. They have determined glacier area from the GGHYDRO 2.3 global<br />
hydro graphic data set, which gives the percentage of glacierization in a 1x1° global grid. The<br />
modeled surface mass balance from all glacierized grid cells for the period of 1961 – 2004 is<br />
shown in Figure 17.<br />
<strong>Mountain</strong> Glacier Page 16
Figure 17. Modeled surface mass balance from all glacierized grid cells 1961 – 2004 (10-3 mm SLE a-1). (Hock et al 2009)<br />
This observation indicates that almost all part of the world showing the negative mass balance<br />
trend except a few in Svalbard, Chilean Patagonia, and Canada. Surface mass loss due to changes<br />
in temperature and precipitation for the period 1961 – 2004 was 0.49 ± 0.30 mm SLE a-1,<br />
assuming the surface mass balance was zero at the start of the simulation.<br />
Atsumu Ohmura (2011) has studied 137 glaciers from 17 glaciered regions to calculate the<br />
annual net balance. These glaciers are located in the Andes (7), North American Cordillera (24),<br />
Canadian Arctic Islands (8), Alaska (4), Kamchatka (2), the Himalayas (4), the<br />
Tienshians/Dzungaria (14), Altai (4), Pamir (1), Polar Ural (2), Caucasus (7), the Alps/Pyrenees<br />
(21), Iceland (9), Scandinavia (23), Svalbard (5), Severnaya Zemlya (1), and Africa (1). Since<br />
the density of the observed glaciers is very inhomogeneous, he used the total surface areas of the<br />
glaciered regions as weights for calculating the global mean balance. This mass balance<br />
investigation is shown in Figure 18.<br />
<strong>Mountain</strong> Glacier Page 17
Figure 18. 5 year running means of the annual mean net balance for 50 years for 17 regions. The bold black line indicates the<br />
area-weighted global mean, while the black straight lines indicate the accelerations for the periods of the last 50 years 1961–<br />
2010 (thin line ) and for the last 20 years 1991–2010 (thick broken line )<br />
6. Retreat of glaciers:-<br />
Retreat of glaciers and corresponding changes in landscape and scenery could, in fact, be some<br />
of the most directly visible and most easily understandable signals of global warming. (Haeberli<br />
et a l, 1998).<br />
The growth or retreat of glacier depends on mass balance of that glacier (Hubbard and Glasser<br />
2005). Due to the mass loss, glacier starts retreating. Tobias Bolch (2007) (Figure 19) have<br />
compared the curve of the cumulative mass balance of the Tuyuksu glacier with the area retreat<br />
and found that they have similar tendency. <strong>Mountain</strong> glaciers are generally small, making them<br />
highly susceptible to impact from even modest adjustments in local climatic conditions<br />
(Beniston, 2003).<br />
<strong>Mountain</strong> Glacier Page 18
Figure 19. Left: cumulative mass balance of the Tuyuksu glacier, 1937 –56 calculated from climate data, from 1957 measured<br />
data; right: area change since 1957 (sources: Dyurgerov et al., 1996, WGMS, http://www.geo.unizh.ch/wgms/). From Tobias<br />
Bolch, 2007<br />
Amount of retreat varies from glacier to glacier and from basin to basin depending on parameters<br />
such as maximum thickness, mass balance and rate of melting at terminus. (Kulkarni et al 2005)<br />
On the global scale, air temperature is considered to be the most important factor reflecting<br />
glacier retreat except tropical glaciers (IPCC, 2001)<br />
Smaller glaciers are more vulnerable to climate change and retreating rapidly. Bhambri et al<br />
(2011) shown that smaller glaciers are retreating rapidly than larger glaciers (Fig. 20). Larger<br />
compound basin glaciers are less sensitive to climate change due to contributions from tributary<br />
glaciers in accumulation zones.<br />
Similar study is done by A. V. Kulkarni (2007) on Chenab Basin, India. They also found that the<br />
smaller glaciers are retreating rapidly than larger glaciers as shown in following table 2.<br />
A general trend of retreat of Samudra tapu glacier studied by satellite imageries is shown in<br />
figure 21.<br />
Figure 20. Glacier area change and area measurements (%) based on Corona (27 September 1968) and ASTER (2006)<br />
<strong>Mountain</strong> Glacier Page 19
Table 2. Change in glacier area for Chenab basin, India - indicating higher loss of area in smaller glaciers<br />
Figure 21. Satellite imagery of IRS LISS-IV sensor from 16 September 2006 showing retreat of the Samudra Tapu glacier,<br />
Himachal Pradesh, India from 1976 (Kulkarni et al, 2011)<br />
<strong>Mountain</strong> Glacier Page 20
Figure 22. Glacier length records from different parts of the world. (Orlemans , 2005)<br />
<strong>Glaciers</strong> of all over world are retreating. Orlemans (2005) has analyzed 169 glaciers from<br />
different part of world and estimated retreats. The 169 glaciers in the data set are located in the<br />
European Alps (93 records), Caucasus (8), tropical Africa (5), Central Asia (9), Irian Jaya (2),<br />
New Zealand (2), Patagonia (6), Northwest America (27), South Greenland (1), Iceland (4), Jan<br />
Mayen (1), Svalbard (3), and Scandinavia (8). The retreats in length for 6 glaciers from different<br />
part of world are shown in figure 22. It is obvious from the figure that all glaciers except the<br />
glacier from New Zealand are retreating.<br />
As published in IPCC Third Assessment Report, 20 glaciers from the various part of the world<br />
which have different lengths, are retreating (Figure 23). So it is confirmed that the glaciers of all<br />
over world are retreating. According to this report glacierized area in the Alps has decreased by<br />
40% since 1850, with an estimated volume loss of 50%. Spain has 13 glaciers remaining, a<br />
decline from 27 glaciers in 1980.<br />
<strong>Mountain</strong> Glacier Page 21
Figure 23. : A collection of twenty glacier length records from different parts of the world. (IPCC Third Assessment Report,<br />
2001)<br />
<strong>Mountain</strong> Glacier Page 22
Himalayan glaciers are retreating faster. A study by Kulkarni et al (2011) on 11 different basins<br />
in Western Himalayas shows high retreat rates as shown in table 3.<br />
Table 3. Glacier retreat in Himalayas, Kulkarni et al, 2011<br />
Glacier retreat is also influence by area altitude distribution, as snow and ice ablation is<br />
influenced by altitude. If large area is below the snowline at the end of ablation season negative<br />
mass balance and will lead to the retreat. (Kulkarni 2007)<br />
As glaciers retreat due to warming, drainage will increase for short term but decline once the<br />
glaciers disappear. (Barnett et al ., 2005)<br />
Shifts in climatic regimes, particularly precipitation, in space or seasonally in a changing global<br />
climate, would impact on the river systems originating in mountain areas. Thereby,<br />
socioeconomic structures of populations living within the mountains and those living<br />
downstream would be affected. (Haeberli et al, 1998)<br />
Anthropogenic climate changes have a significant impact on the cryosphere. (Rosenzweig et<br />
al, 2008)<br />
7. Impacts on humans<br />
Although glaciers are often far from population centers, their loss will impact communities<br />
significantly, especially in mountainous regions of the world. There are areas where glacial<br />
meltwater is a significant contributor to settlements water supplies. Melting glaciers also cause<br />
sea level to rise, which will affect coastal regions, all around the globe.<br />
<strong>Mountain</strong> Glacier Page 23
Small glaciers retreating in the Himalayas threaten local communities and people downstream<br />
who depend on the water coming down from the mountains. Two billion people rely on the<br />
meltwater from this area, but 21% glacial mass lost has been observed since 1962 (Kormann<br />
2009). Five major river systems are fed by Himalayan glaciers, which go on to irrigate much of<br />
China, India and Pakistan rice and wheat as well as being used for drinking water.<br />
Ganges: 407 million people<br />
Indus: 178 million people<br />
Brahmaputra: 118 million people<br />
Yangtze: 367 million people<br />
Yellow: 147 million people<br />
<br />
Combined with the rapidly increasing population of these countries, the less and less meltwater<br />
could result in famine and conflict. It‟s not just in this area that meltwater is important; areas in<br />
the Andes also rely on it. Glacial retreat would affect up to 77 million people who rely on the<br />
water from glacier here. Although the rapid melting has brought temporary increases in stream<br />
flow and contributed to flooding, it is predicted that within the next decade as the glaciers shrink<br />
further there will be a shortage of water during the dry season. Farmers have already begun to<br />
report shortages. Precipitation in Bolivia largely occurs during part of the year; this water is then<br />
normally stored on the glaciers and released throughout the year due to melt. If the glacier<br />
disappears, there would be no natural storage of water. Because of this threat, there is a question<br />
of compensation in this area, Bolivia is responsible for only 0.02% of global greenhouse<br />
emissions, yet the country is set to suffer more than many others that produce much of the<br />
emissions (Kormann 2009).<br />
Furthermore the disappearance of the glacial coverage is the cause of many local issues within<br />
the Kilimanjaro region. As the glaciers have retreated and lost size, the flow of glacial melt water<br />
has decreased significantly resulting in a fight for water throughout the towns on the Pangani<br />
River Basin (Hetherington 2010). The Pangani River Basin is home to roughly 3.7 million<br />
people, and is around 43000-square-kilometers in area. It begins on the high slopes of<br />
Kilimanjaro and meanders towards an estuary in the tropical town of Pangani. In the year 2000<br />
violence broke out in regions which depend upon the water of the Pangani River. During this,<br />
“district police were called in to calm the situation and restore order, while administrative<br />
authorities embarked on a lengthy process of dialogue and conflict resolution.”<br />
The cause of the conflict and violence quite simply comes down to access to water. For hundreds<br />
of years, the people of the townships which depended upon the water from Kilimanjaro‟s snows<br />
had an unwritten law of local knowledge, “that the highlands of the Pangani River Basin receive<br />
markedly more rainfall than its lowlands, and acknowledged the need to secure water for<br />
downstream users and the overall health of the ecosystem” (Hetherington 2010). In 1972<br />
however, increased political control of the region was enforced, and water flow downstream was<br />
heavily choked. It has since then been getting worse as the glaciers on Kilimanjaro are receding,<br />
providing less and less water every year. Consequently, violence and social unrest within the<br />
region has increased and will continue to do so as the glacier further recedes (Hetherington<br />
2010).<br />
<strong>Mountain</strong> Glacier Page 24
It is important to note that this not only effects human population within the area. The Pangani<br />
River also provides water to very bio diverse regions of forest, particularly the Eastern Arc<br />
<strong>Mountain</strong>s which is considered as one of earths 25 biodiversity hotspots. Around thirty per cent<br />
of roughly two thousand plant species are considered endemic, and approximately eighty per<br />
cent of the regions spider and other small insect populations are occasionally limited to one<br />
mountain of the region (Hetherington 2010). If water flow to these regions slows, the<br />
biodiversity will be at a great threat. The biodiversity of Kilimanjaro itself is extremely<br />
interesting, ranging from banana trees to alpine pine trees, and from tropical species to species<br />
living on an ice cap.<br />
Figure 24. . Mount Kilimanjaro satellite images from 1993 and 2000, showing the rapid retreat of the glacier (NASA Earth<br />
Observatory 2000).<br />
<strong>Mountain</strong> Glacier Page 25
The disappearance of glaciers also affects humans by causing sea level rise. Many of the world‟s<br />
largest cities are in coastal regions, as are arable regions. Defenses against sea level rise are<br />
unavailable in many areas and even when a country could potential put defenses into place they<br />
are still extremely costly.<br />
Figure 25. The annual contribution from glaciers to sea level change (left axis, mm/yr), and cumulative value (right axis, mm)<br />
based on area-weighted averaged mass balance (National Snow and Ice Data Center 2006).<br />
<strong>Mountain</strong> Glacier Page 26
8. References:<br />
Anil V. Kulkarni, B. P. Rathore, S. K. Singh, I. M. , (2011), Understanding changes in the<br />
Himalayan Cryosphere using remote sensing techniques, International Journal of Remote Sensing,<br />
Vol. 32, No. 3, 601–615<br />
Anthwal, et al, (2006), Retreat of Himalayan <strong>Glaciers</strong> – Indicator of Climate Chang e, Nature and<br />
Science, 4( 4)<br />
Atsumu Ohmura (2011), Observed Mass Balance of <strong>Mountain</strong> <strong>Glaciers</strong> and Greenland Ice Sheet in<br />
the 20th Century and the Present Trends, Surv. Geophys. , 32:537-554<br />
Barnett, T. P., Adam J. C. & Lettenmaier, D. P., (2005), Potential impacts of a warming climate on<br />
water availability in snow-dominated regions. Nature, 438, 303–309<br />
Benn, D.I., and J.A. Evans, 2010. <strong>Glaciers</strong> and glaciations, 2nd edition. Hodder Education, UK.<br />
802 p.<br />
Cuffey, K.M. and W.S.B. Paterson, The Physics of Glacier, (Fourth Edition),(Book)<br />
Cynthia Rosenzweig, David Karoly, Marta Vicarelli, Peter Neofotis, Qigang Wu, Gino Casassa,<br />
Annette Menzel, Terry L. Root, Nicole Estrella, Bernard Seguin, Piotr Tryjanowski, Chunzhen Liu,<br />
Samuel Rawlins and Anton Imeson, (2008), Attributing physical and biological impacts to<br />
anthropogenic climate change, Nature, Vol 453.<br />
Furse, J (2011). Lecture Notes on „<strong>Glaciers</strong>‟, Available:<br />
https://learning.secure.griffith.edu.au/webapps/portal/frameset.jsp?tab=courses&url=/bin/common/c<br />
ourse.pl?course_id=_100996_1&frame=top, Last accessed 12 March 2012.<br />
Hagen, J.O. and N. Reeh. 2003. In situ measurement techniques: land ice. Mass Balance of the<br />
Cryosphere : Observation and modelling of contemporary and future changes, eds. J.L. Bamber and<br />
A.J. Payne, 11-42. Cambridge, UK: Cambridge University Press.<br />
Hetherington, A. "The spoils of Kilimanjaro." Geographical Oct. 2008: 66+. Expanded Academic<br />
ASAP. Web. 19 Oct. 2011<br />
<strong>Mountain</strong> Glacier Page 27
Hoelzle, M., W. Haeberli, M. Dischl and W. Peschke. (2003). Secular glacier mass balances derived<br />
from cumulative glacier length changes, Global and Planetary Change, 36: 295-306.<br />
Hubbard, B. and N. Glasser,(2005), Field Techniques in Glaciology and Glacial Geomorphology.<br />
Chichester, UK: Wiley.<br />
IPCC Third Assessment Report, 2001<br />
Kaser, G., A. Fountain and P. Jansson, (2003), A manual for monitoring the mass balance of<br />
mountain glaciers, International Hydrological Programme Technical Documents in Hydrology, No.<br />
59, Paris: UNESCO.<br />
Knight, P.G., (2006), Glacier science and environmental change: introduction. Glacier Science and<br />
Environmental Change (Book)<br />
Kulkarni A. V., B. P. Rathore, Suresh Mahajan and P. Mathur, 2005, Alarming retreat of Parbati<br />
Glacier, Beas basin, Himachal Pradesh, Current Science, 88(11), 1844-1850.<br />
Kulkarni Anil V., Rathore B. P. , Alex Suja,(2004), Monitoring of glacial mass balance in the Baspa<br />
basin using accumulation area ratio method, Current Science, vol. 86, No. 1, pp. 185-190.<br />
Kulkarni, A. V. 2007. Effect of Global Warming on the Himalayan Cryosphere, Jalvigyan<br />
Sameeksha. vol 22<br />
Lemke, K A. (2006). Horn. Available:<br />
http://www4.uwsp.edu/geo/faculty/lemke/alpine_glacial_glossary/landforms/horn.html. Last<br />
accessed 12th March 2012.<br />
Martin Beniston , Climatic Change In <strong>Mountain</strong> Regions: A Review Of Possible Impacts, Climatic<br />
Change, 59: 5–31, 2003.<br />
Meier, M. F. and Post, A., (1962), Recent variations in mass net budgets of glaciers in western North<br />
America, IASH, , 58, 63–77.<br />
Oerlemans, J., (2005), Extracting a Climate Signal from 169 Glacier Records, Science, 308, 675.<br />
<strong>Mountain</strong> Glacier Page 28
Rakesh Bhambhri, Tobias bolch, RavindrakumarChaujar, Subhash Chhandra Kulshreshtha, (2011),<br />
Glacier Changes in the Garhwal Himalaya, India, from 1968 to 2006, from remote sensing, Journal<br />
Of Glaciology, 57<br />
Regine Hock, Mattias de Woul, Valentina Radic, and Mark Dyurgerov, (2009), <strong>Mountain</strong> glaciers<br />
and ice caps around Antarctica make a large sea-level rise contribution, Geophysical Research<br />
Letters, VOL. 36, L07501<br />
Ritter, M. (2006). Alpine Glacier. Available:<br />
http://www4.uwsp.edu/geo/faculty/ritter/glossary/a_d/alpine_glacier.html. Last accessed 12th March<br />
2012.<br />
Tobias Bolch, (2007), Climate change and glacier retreat in northern Tien Shan<br />
(Kazakhstan/Kyrgyzstan) using remote sensing data , Global and Planetary Change, 56, 1– 12<br />
Tómas Jóhannesson, Helgi Björnsson, Finnur Pálsson, Oddur Sigurðsson and Þorsteinn<br />
Þorsteinsson, (2011), LiDAR mapping of the Snæfellsjökull ice cap, Western Iceland, JÖKULL,<br />
No. 61.<br />
Unknown Author. (2012). Chapter 7, Earth Science. Available:<br />
http://wilsonscience.tripod.com/earthscience1/id11.html. Last accessed 12th March 2012.<br />
Wilfried Haeberli and Martin Beniston, Climate Change and Its Impacts on <strong>Glaciers</strong> and Permafrost<br />
in the Alps, Ambio. Vol. 27 No. 4, June 1998 pp. 258-265<br />
Yu, J., H. Liu, K. C. Jezek, R. C. Warner, and J. Wen (2010), Analysis of velocity field, mass<br />
balance, and basal melt of the Lambert Glacier–Amery Ice Shelf system by incorporating Radarsat<br />
SAR interferometry and ICESat laser altimetry measurements, J. Geophys. Res., 115, B11102,<br />
Zuo, Z. and J. Oerlemans, (1997) , Contribution of glacier melt to sea-level rise since AD 1865: a<br />
regionally differentiated calculation, Climate Dynamics, 13 : 835- 845<br />
<strong>Mountain</strong> Glacier Page 29