Greening Mass Transit & Metro Regions: The Final Report - MTA
Greening Mass Transit & Metro Regions: The Final Report - MTA
Greening Mass Transit & Metro Regions: The Final Report - MTA

Create successful ePaper yourself
Turn your PDF publications into a flip-book with our unique Google optimized e-Paper software.
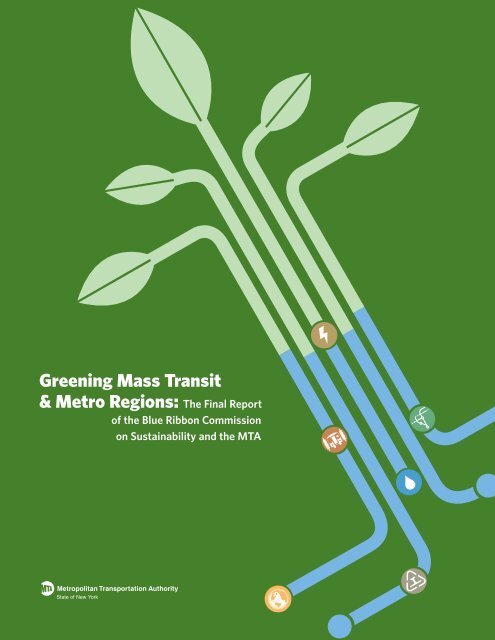
<strong>Greening</strong> <strong>Mass</strong> <strong>Transit</strong><br />
& <strong>Metro</strong> <strong>Regions</strong>: <strong>The</strong> <strong>Final</strong> <strong>Report</strong><br />
of the Blue Ribbon Commission<br />
on Sustainability and the <strong>MTA</strong><br />
State of New York
Elliot G. Sander<br />
Executive Director & CEO<br />
<strong>Metro</strong>politan Transportation Authority, NYS<br />
347 Madison Avenue, Seventh Floor<br />
New York, N.Y. 10017-3739<br />
Dear Lee,<br />
<strong>The</strong> Blue Ribbon Commission on Sustainability and the <strong>MTA</strong> is pleased to transmit to you its final report, <strong>Greening</strong><br />
<strong>Mass</strong> <strong>Transit</strong> & <strong>Metro</strong> <strong>Regions</strong>. Your decision to empanel this commission, which you convened in the fall of 2007 long<br />
before the impact of the global recession was known, turned out to be prescient.<br />
As my fellow commissioner Robert Yaro noted, this report calls for a green transformation and expansion of the <strong>MTA</strong><br />
network, which serves New York City, the Hudson Valley, Long Island and southern Connecticut. Our final report<br />
makes scores of recommendations in a number of key areas of sustainability planning. Implementing these recommendations<br />
will result in the comprehensive greening of our region’s transit system. We made every effort<br />
to ensure that our recommendations for greening the <strong>MTA</strong> also dealt with the economic realities described in the<br />
Ravitch Commission <strong>Report</strong>. As Commissioners, we believe that the recovery of the American economy and future<br />
well-being of the metropolitan region will hinge in part on new industries and new jobs created by greening the way<br />
we live and the way we work.<br />
Our recommendations will not only give the <strong>MTA</strong> agencies tools for reducing and managing the <strong>MTA</strong>’s ecological<br />
footprint, but also policies and strategies designed to accelerate the rate at which the <strong>MTA</strong> and the <strong>MTA</strong> region can<br />
reduce dependence on fossil fuels. While it has long and intuitively been understood that mass transit networks like<br />
the <strong>MTA</strong> play a pivotal role in reducing a region's carbon footprint, the Commissioners would like to see a future<br />
where this intuition can be quantified, verified and eventually monetized – thereby helping improve and expand mass<br />
transit in a carbon-constrained world. Anyone committed to enhancing regional mobility, spurring productivity, and<br />
promoting greener living environments will find this report to be a useful guide for reengineering the public and<br />
private sectors. <strong>The</strong> adoption of the Commission’s recommendations will help the region and the <strong>MTA</strong> weather the<br />
recession and will position the <strong>MTA</strong> and the region to thrive in the decades ahead. As our report makes clear, the<br />
transition to a lower-carbon economy and the development of green industries and green jobs will not succeed if the<br />
nation overlooks the greening power of rapid transit – as well as the greening power of integrating the expansion of<br />
rapid transit with green residential development and green commercial development.<br />
All of us who have served on the Commission are especially proud of the <strong>MTA</strong> employees from New York City <strong>Transit</strong>,<br />
the Long Island Rail Road, <strong>Metro</strong>-North Railroad, <strong>MTA</strong> Bridges & Tunnels, <strong>MTA</strong> Capital Construction and <strong>MTA</strong><br />
Consolidated Bus Operations who submitted their own ideas for greening the <strong>MTA</strong> to the Commission. It is gratifying<br />
to know that there are many folks among the <strong>MTA</strong>’s 70,000 employees who are committed to making<br />
sustainability part of the <strong>MTA</strong>’s DNA.<br />
While our work on this report is done, we stand ready to work with you – and to reconvene informally – to offer advice<br />
and to assess the <strong>MTA</strong>’s progress in greening the agencies and greening the <strong>MTA</strong>’s 5,000-square-mile<br />
service territory.<br />
Sincerely,<br />
Jonathan F. P. Rose<br />
Commission Chair<br />
Blue Ribbon Commission on Sustainability and the <strong>MTA</strong><br />
1
<strong>Greening</strong> <strong>Mass</strong> <strong>Transit</strong><br />
& <strong>Metro</strong> <strong>Regions</strong>:<br />
2<br />
What’s Inside<br />
<strong>The</strong> Blue Ribbon Commission<br />
on Sustainability and the <strong>MTA</strong><br />
5<br />
Why We Must Accelerate the <strong>Greening</strong><br />
of the <strong>MTA</strong><br />
6<br />
Why <strong>Greening</strong> the <strong>MTA</strong> Makes Economic Sense 8<br />
<strong>Transit</strong>’s Four Green Economic Impacts 8<br />
Top Recommendations for <strong>Greening</strong> the <strong>MTA</strong><br />
and the <strong>MTA</strong> Region<br />
10<br />
Strategy for the 21st Century: Legislative and<br />
Policy Recommendations at a Glance<br />
12<br />
<strong>Report</strong>s and Recommendations 15<br />
Energy/Carbon 17<br />
Baseline 18<br />
Transformational Recommendations 19<br />
Near-Term Recommendations 22<br />
Achievements To Date 25<br />
Facilities 26<br />
Baseline 29<br />
Transformational Recommendations 30<br />
Near-Term Recommendations 32<br />
Achievements To Date 32<br />
Smart Growth/TOD 35<br />
Baseline 36<br />
Transformational Recommendations 37<br />
Near-Term Recommendations 38<br />
Achievements To Date 41<br />
Materials Flow 42<br />
Baseline 44<br />
Transformational Recommendations 45<br />
Near-Term Recommendations 48<br />
Achievements To Date 49<br />
Water Management 51<br />
Baseline 52<br />
Transformational Recommendations 53<br />
Near-Term Recommendations 54<br />
Achievements To Date 55<br />
Climate Adaptation 56<br />
Baseline 58<br />
Transformational Recommendations 59<br />
Near-Term Recommendations 59<br />
Summary Findings and Next Steps 61
Strategy for the 21st Century:<br />
Legislative and Policy Recommendations<br />
63<br />
Federal Government’s Role 64<br />
Ten Regional Greenhouse Gas Initiatives<br />
(RGGI) States’ Role<br />
66<br />
State of New York’s Role 67<br />
State of Connecticut’s Role 68<br />
New York City’s Role 69<br />
Suburban Counties and City Governments’ Role 69<br />
<strong>Transit</strong>’s Triple Bottom Line 71<br />
Stillwell Avenue-Coney Island, Brooklyn is the first subway station to use solar energy.<br />
Acknowledgments 78<br />
Appendices 80<br />
Profile of the <strong>Metro</strong>politan Transportation<br />
Authority (<strong>MTA</strong>)<br />
81<br />
Energy/Carbon – Traction Power <strong>Report</strong> 81<br />
Energy/Carbon – Renewable Energy <strong>Report</strong> 81<br />
Smart Growth/TOD: Bicycles as a <strong>Transit</strong> Link 82<br />
Smart Growth/TOD: Case Studies 87<br />
Smart Fleets <strong>Report</strong> 89<br />
Climate Adaptation 89<br />
3
<strong>The</strong> Blue Ribbon Commission on Sustainability and the <strong>MTA</strong><br />
Appointed in September 2007 by <strong>MTA</strong> Executive Director and CEO Elliot G. Sander, the Commission was charged<br />
with developing sustainability-related recommendations for the <strong>MTA</strong> and its operating agencies. <strong>The</strong> recommendations<br />
aim to expand the greening power of transit to more riders and communities, while managing and reducing the <strong>MTA</strong>’s<br />
per-rider energy consumption and environmental footprint. To develop the plan, the 22 commissioners divided into<br />
Working Groups covering key areas of sustainability planning: Energy/Carbon, Facilities, Smart Growth/<strong>Transit</strong>-Oriented<br />
Development (TOD), Materials Flow, Water Management and Climate Adaptation. Each group worked with designated<br />
<strong>MTA</strong> staff, research consultants, and pro bono experts. <strong>The</strong> report also examines cost-savings through green initiatives,<br />
adaptation strategies for climate change, and legislative priorities. <strong>The</strong> report contains nearly 100 recommendations in<br />
all, with about 20 that are transformational, 40 near-term, and about 30 that require legislative and/or policy action by<br />
decision-makers at the federal, state, and local levels.<br />
Commission Chair<br />
Jonathan F.P. Rose, president, Jonathan Rose Companies. Jonathan F.P. Rose's business, not-for-profit, and public policy<br />
work focuses on integrating transportation, housing, environmental, and open space policies to create healthy, equitable<br />
metropolitan regions. Mr. Rose’s firm currently manages over $1.5 billion of projects creating models of green urban<br />
solutions. Mr. Rose serves on a number of boards, including the Enterprise Foundation, the Urban Land Institute, and<br />
the Natural Resources Defense Council.<br />
Commissioners<br />
Rohit T. Aggarwala, director, New York City<br />
Office of Long-Term Planning and Sustainability<br />
Julie Belaga, co-chair, Connecticut League<br />
of Conservation Voters<br />
Marcia Bystryn, president, New York League<br />
of Conservation Voters<br />
Peter A. Cannito, former president,<br />
<strong>MTA</strong> <strong>Metro</strong>-North Railroad<br />
Cecil Corbin-Mark, director of programs,<br />
WE ACT for Environmental Justice<br />
Robert F. Fox Jr., partner, Cook+Fox Architects<br />
Anna-Marie Francello, executive director and CPA, UBS<br />
Emil H. Frankel, director of transportation policy,<br />
Bipartisan Policy Center<br />
Ashok Gupta, air and energy program director,<br />
Natural Resources Defense Council<br />
Sarah Lansdale, executive director, Sustainable Long Island<br />
Kevin Law, chairman, Long Island Power Authority<br />
Emily Lloyd, former commissioner, New York City<br />
Department of Environmental Protection<br />
Thomas Maher, director of environmental coordination,<br />
Nassau County<br />
Alex Matthiessen, Hudson Riverkeeper and president,<br />
Riverkeeper<br />
Susan Metzger, board member,<br />
<strong>Metro</strong>politan Transportation Authority<br />
Janette Sadik-Khan, commissioner, New York City<br />
Department of Transportation<br />
Nancy Shevell, board member,<br />
<strong>Metro</strong>politan Transportation Authority<br />
Joseph J. Smith, senior vice president,<br />
<strong>MTA</strong> New York City <strong>Transit</strong> Department of Buses and<br />
president, <strong>MTA</strong> Bus Company and <strong>MTA</strong> Long Island Bus<br />
Ned Sullivan, president, Scenic Hudson<br />
Michael E. White, executive director,<br />
Long Island Regional Planning Board<br />
Robert D. Yaro, president, Regional Plan Association<br />
<strong>The</strong> <strong>MTA</strong> staff assigned to support the Commission included: Ernest Tollerson, director, Policy and Media Relations; Projjal Dutta, director, Sustainability Initiatives; Peter Bass,<br />
director, Agency Wide Environmental and Energy Policy; and other members of the Policy Group. A complete list of the <strong>MTA</strong> headquarters, and agency staff, pro bono experts,<br />
and consultants can be found on the acknowledgments page at the end of this report.<br />
5
6<br />
Why We Must Accelerate the <strong>Greening</strong> of the <strong>MTA</strong><br />
Robert D. Yaro, President, <strong>The</strong> Regional Plan Association<br />
This report calls for a green transformation and expansion<br />
of the <strong>MTA</strong> system, North America’s largest mass transit<br />
network. <strong>The</strong> recommendations in this report represent the<br />
most ambitious greening of a regional transit system ever<br />
undertaken and the most significant enhancement of the<br />
<strong>MTA</strong> system in half a century. Among its many transformational<br />
initiatives, the report calls for the <strong>MTA</strong> to draw 80<br />
percent of its total operating energy from clean, renewable<br />
energy sources by 2050. At the same time, it urges a significant<br />
expansion of regional transit access. It argues, in no<br />
uncertain terms, that the <strong>MTA</strong> transit system must reach<br />
and absorb two-thirds of the New York metropolitan area’s<br />
projected growth of 4 million people between now and<br />
2030 if we are to achieve sustainability, create more livable<br />
communities, and maintain our global economic dominance. 1<br />
<strong>The</strong> report contains scores of recommendations in a number<br />
of key areas of sustainability planning. In preparing these<br />
initiatives, every effort was made to address the economic<br />
realities described in the Ravitch Commission <strong>Report</strong>2 and<br />
to demonstrate how greening the <strong>MTA</strong> system can generate<br />
long-term savings and spur economic growth. <strong>The</strong> Blue<br />
Ribbon Commission strongly believes that these initiatives<br />
will be necessary to carry our unique, highly productive<br />
metropolitan area into the next half century. <strong>The</strong> proposed<br />
policies and strategies will enhance regional mobility, spur<br />
productivity, and promote greener, more attractive living<br />
environments. <strong>The</strong>y will reduce oil dependency, cut family<br />
fuel bills, and limit the CO2 emissions that contribute to<br />
global warming. <strong>The</strong>se recommendations, if adopted, will<br />
prepare the <strong>MTA</strong> and its service area to thrive in the 21st<br />
century while dealing with the challenges posed by intense<br />
economic competition, severe climate change, and worldwide<br />
demand for sustainable energy.<br />
This green transformation heralds the third major era of<br />
public transportation’s development in the <strong>MTA</strong> service<br />
area. <strong>The</strong> first era, from 1904 to 1940, saw the initial<br />
construction of the urban transportation systems that<br />
enabled the New York region to triple its population from<br />
6 million to 18 million residents and to rise to the pinnacle<br />
of world economic power. It is well to recall that much of<br />
this vital investment followed the Panic of 1907 and continued<br />
during the Great Depression of the 1930s, as New<br />
Yorkers sustained their confidence in the region’s future.<br />
In the second era, from 1980 to the present day, another<br />
generation of New Yorkers invested $76 billion to bring<br />
the <strong>MTA</strong> system back to a state of good repair after a<br />
generation of disinvestment and decay dating back to the<br />
1950s. This renewal and modernization of the <strong>MTA</strong> system<br />
enabled the region’s remarkable return from the fiscal crisis<br />
of the 1970s to a second period of global preeminence.<br />
Once again, this public investment in a world-class transit<br />
system was sustained despite recessions in the early 1980s<br />
and 1990s and the downturn following the terrorist attacks<br />
of 2001.<br />
Assuming this report’s proposals are carried out, the third<br />
era of development in the <strong>MTA</strong> region will equip the system<br />
for a low-carbon future while expanding capacity to meet<br />
the region’s growth and mobility needs through 2030.<br />
According to current projections, that growth will include<br />
some 4 million additional residents, 3 million new jobs,<br />
1.3 million more daily trips, and a 30 percent increase in<br />
the regional economy. By ensuring that an increased share<br />
of this growth develops as transit-oriented clusters rather<br />
than sprawl, the <strong>MTA</strong>’s expansion will have a significant<br />
impact not only on regional productivity, but on our national<br />
energy and climate-stabilization goals.<br />
This is an important point. As the Commission has<br />
emphasized throughout, the role of a transit system like<br />
the <strong>MTA</strong> in reducing greenhouse gases is not always fully<br />
appreciated. This role takes three forms. First, the mode<br />
shift from automobiles to transit ridership dramatically<br />
lowers CO2 emissions on a per-passenger-mile basis.<br />
Second, the resulting reduction in road congestion means<br />
that the remaining vehicle traffic runs more efficiently,<br />
further lowering emissions. Third and most significantly,<br />
by enabling clustered development, a transit network<br />
shrinks the average mileage between destinations. This<br />
reduces vehicle miles traveled overall while encouraging<br />
biking, walking, and greener lifestyles.<br />
<strong>The</strong> recommended system enhancements will reduce<br />
regional CO2 emissions throughout the metropolitan region,<br />
while expanding the mobility we need to maintain our global<br />
leadership in commerce, finance, culture, media, and higher<br />
education. <strong>The</strong> green transformations will mean a major<br />
step toward the urgent energy and sustainability priorities<br />
recently identified by New York State, New York City, Long<br />
1<strong>MTA</strong> projects a growth of 4 million people in its service area by 2030. <strong>The</strong> Commission recommends that the <strong>MTA</strong> system capture two-thirds of all new vehicle miles<br />
travelled (VMT) added in its service area and that two-thirds of all new development be clustered within a quarter-mile to a half-mile of <strong>MTA</strong> transit access.<br />
2New York State Governor David A. Paterson appointed the <strong>Metro</strong>politan Transportation Authority Financing Commission in June 2008. Its <strong>Final</strong> <strong>Report</strong> was released on<br />
December 4, 2008.
Island, the Hudson Valley, and Connecticut,<br />
as well as the administration of President<br />
Barack Obama. Achieving these transformations<br />
will also produce a valuable blueprint<br />
for greening transit agencies and other major<br />
public entities nationwide. But we must be<br />
absolutely clear about the stakes. If the<br />
recommendations are not implemented, the<br />
<strong>MTA</strong> system will not have the capacity to<br />
sustain the region’s projected economic and<br />
population growth.<br />
Should we fail to act now, there is little doubt<br />
that much of the projected economic growth<br />
will be diverted to those global cities capable<br />
of sustaining it, placing New York’s leadership<br />
at serious risk and undermining the economic<br />
potential for future generations. As we issue<br />
this report, London, Tokyo, Shanghai, Hong<br />
Kong, and other global competitors are<br />
launching similar efforts to expand and green<br />
their transit systems, in part as a conscious<br />
effort to help stimulate economic activity<br />
and capital investment during the global<br />
recession. <strong>The</strong> Commission’s recommendations<br />
are crucial steps toward slowing the<br />
potentially dire impacts of climate change.<br />
<strong>The</strong>y are also the investments New Yorkers<br />
must make now, following the can-do ethic<br />
of the city’s previous generations, to safeguard<br />
and expand an irreplaceable component<br />
of our economy and infrastructure<br />
during a period of financial adversity.<br />
Carbon Avoidance as a 21st Century Revenue Source<br />
By removing some 3 million drivers from the roads each day, the <strong>MTA</strong> avoids more carbon emissions<br />
from the atmosphere than 648,000 acres of forest can absorb. This “carbon avoidance” benefit of <strong>MTA</strong><br />
operations is increasingly viewed as a measurable commodity with societal benefits and a market value.<br />
In effect, the <strong>MTA</strong> provides unreimbursed carbon reduction services for which many industries now claim<br />
financial and funding credits.<br />
Clean Air Hybrid Electric Bus, <strong>MTA</strong> New York City <strong>Transit</strong><br />
GHG Emissions of Transportation Options<br />
SUV (solo driver)<br />
Car (solo driver)<br />
Airplane<br />
<strong>Transit</strong> Bus (1/4 full)<br />
Prius (solo driver)<br />
Amtrak<br />
Rail <strong>Transit</strong> (25 riders/car)<br />
Carpool (3 occupants)<br />
Vanpool (6 occupants)<br />
<strong>Transit</strong> Bus (3/4 full)<br />
Rail <strong>Transit</strong> (50 riders/car)<br />
Intercity bus<br />
Walk/bike<br />
Additional traveller:<br />
transit, carpool, vanpool<br />
Pounds CO2<br />
(or equivalents per passenger mile)<br />
0 0.2 0.4 0.6 0.8 1 1.2 1.4 1.6<br />
Sightline Institute (http://www.sightline.org/maps/charts/climate - CO2byMode)<br />
7
8<br />
Why <strong>Greening</strong> the <strong>MTA</strong> Makes Economic Sense<br />
David Lewis, Senior VP, National Director, Economics and Financial Services, HDR Inc.<br />
<strong>The</strong> policies and strategies proposed in this report will do<br />
more than achieve transit and climate-stabilization targets.<br />
<strong>The</strong>y will also have far-reaching implications for the New<br />
York metropolitan region’s short-term and long-term economic<br />
performance. Whether implemented singly or collectively,<br />
these recommendations have the potential to generate<br />
significant returns on investment, with benefits far outweighing<br />
costs.<br />
Equally important, these initiatives augur a new investment<br />
and operating philosophy for the <strong>MTA</strong>, one that will serve<br />
as a forward-looking model for other organizations. <strong>The</strong><br />
reality is that all enterprises today, public and private alike,<br />
must begin to account for the real costs of carbon-based<br />
technologies and the resulting CO2 emissions. This is no<br />
longer a matter of choice. Governments around the world<br />
are ramping up carbon taxes, cap-and-trade systems, and<br />
other policies designed to generate market signals that<br />
compel enterprises to account for climate and pollution<br />
costs as they would for any other investment and operating<br />
decision. <strong>The</strong> initiatives in this report will align the <strong>MTA</strong>’s<br />
decision-making and business practices with this rapidly<br />
emerging market reality.<br />
<strong>The</strong> current financial crisis gives these recommendations<br />
an even more immediate economic relevance. <strong>The</strong> crisis<br />
is widely viewed as a unique opportunity to frame stimulus<br />
actions in a way that will redirect public investment over<br />
the long term. Such redirection focuses on three longstanding<br />
concerns: climate change; energy security;<br />
and infrastructure renewal and expansion. All three of<br />
these priorities argue for expanded investment in transit.<br />
In other words, a transit system such as the <strong>MTA</strong> stands<br />
dead center at the stimulus sweet spot. 3<br />
Moreover, the <strong>MTA</strong> system stands as a model for other<br />
metropolitan regions as they adapt to a changing economy –<br />
an economy that will pay higher dividends for energy<br />
efficiency and dense concentrations of intellectual capital.<br />
With a third of all U.S. transit ridership, the <strong>MTA</strong> region is<br />
by far the most transit-oriented area in the country and –<br />
not coincidently – one of the most energy-efficient and<br />
economically productive. Of the nation’s 100 largest metro<br />
regions, it has the lowest transportation carbon emissions<br />
per capita. Compared to the average American, residents<br />
of the <strong>MTA</strong> region produce 43 percent less CO2 emissions<br />
and, thanks to the density of high-value services, enjoy a<br />
per capita GDP that is 30 percent higher than the average<br />
for U.S. metro areas. Similarly, in other U.S. cities, high<br />
levels of productivity tend to correlate with high levels of<br />
transit service. 4<br />
Rising energy costs and the pricing of CO2 emissions will<br />
only elevate the value of the <strong>MTA</strong> transit network as a<br />
model for other metropolitan areas. To sustain this value<br />
and the New York area’s leadership role, the <strong>MTA</strong> must<br />
keep pace with the other major global transit systems that<br />
are now rapidly modernizing and expanding for economic<br />
advantage. <strong>The</strong> importance of making this investment<br />
sooner rather than later should be a common concern of<br />
all commuters, businesses, citizens, and local governments<br />
that rely on <strong>MTA</strong> services and shape the context in which<br />
the <strong>MTA</strong> system operates.<br />
<strong>Transit</strong>’s Four Green Economic Impacts<br />
According to the recently published Stern Review, 5 failure<br />
to enact deep reductions in greenhouse gasses (GHGs)<br />
will result in overall costs from climate change equal to the<br />
loss of between 5 percent and 20 percent of global GDP,<br />
now and forever. This provides a dramatic example of the<br />
deeper connection between environmental sustainability<br />
and economic viability. As this Commission’s report makes<br />
clear, transit helps gains in productivity and sustainability to<br />
rise in tandem. An expanding transit system not only lowers<br />
carbon emissions, it raises property values. It not only<br />
reduces oil consumption, it concentrates high-value services<br />
and so forth. Here are four key factors through which transit<br />
leverages environmental and economic gains:<br />
1. Avoiding Carbon Emissions: A regional mode shift<br />
from automobiles to transit yields economic and environmental<br />
benefits at many levels. For example, the CO2<br />
emissions from transit ridership are about one-fifth of those<br />
produced by single occupancy automobiles, as measured<br />
on a per-passenger-mile basis. Thus, in addition to overall<br />
fuel efficiency, the shift from automobiles to transit means<br />
an 80 percent rate of carbon avoidance. Since transportation<br />
accounts for nearly 40 percent of GHG emissions in<br />
the U.S., the greening of the nation’s largest transit system<br />
has significant value, both directly and as an infrastructure<br />
model for other urban areas. As it continues to quantify<br />
its carbon avoidance rates, the <strong>MTA</strong> will also be well<br />
positioned for emerging carbon trade markets and carbonbased<br />
funding criteria.<br />
2. Managing Regional Congestion: <strong>Transit</strong> reduces<br />
traffic congestion, which cost the regional economy some<br />
$13 billion in 2007 alone, according to the Partnership for<br />
3 See, Deutsche Bank Group, Economic Stimulus: <strong>The</strong> Case for “Green” Infrastructure, Energy Security and “Green” Jobs, November 2008.<br />
4 (As cited in), David Lewis and Fred Lawrence Williams, Policy and Planning as Public Choice: <strong>Mass</strong> <strong>Transit</strong> in the United States, Ashgate, 1999.<br />
5 Nicholas Stern, <strong>The</strong> Economics of Climate Change: <strong>The</strong> Stern Review, Cambridge University Press, 2006.<br />
6 Partnership for New York City, Growth or Gridlock, 2006 (HDR|Decision Economics).
New York City. 6 By improving traffic flow, transit optimizes<br />
regional mobility for both passenger and freight sectors.<br />
This in turn reduces fuel costs, vehicle operating costs,<br />
and the costs associated with traffic accidents. By easing<br />
congestion, transit also reduces CO2 emissions from the<br />
remaining auto traffic, resulting in yet another level of<br />
carbon avoidance. Moreover, studies show that in periods<br />
of rapid land development and population growth, transit<br />
rail systems in highway corridors will absorb and stabilize<br />
any related rise in traffic congestion.<br />
3. Optimizing Land Use: <strong>Transit</strong> enables more clustered<br />
residential and commercial development, which brings<br />
dramatic economic and sustainability gains. According to<br />
a study by the National Research Council, more compact<br />
settlement patterns could save the nation $540 billion in<br />
building and infrastructure costs. 7 Moreover, compact<br />
transit-based development not only reduces automobile<br />
travel, it reduces the average miles between destinations<br />
for all modes of travel, including automobiles. Thus, the<br />
land-use patterns generated by transit produce a “virtuous<br />
spiral” with an ongoing decline in energy consumption and<br />
corresponding rise in carbon avoidance. This is clearly<br />
evident in high-density, transit-rich New York City, where<br />
per capita energy consumption is now about one quarter<br />
the national average.<br />
4. Generating Higher Values: <strong>The</strong> value of transit to<br />
regional economies will be felt through higher worker<br />
mobility, lower energy costs, reduced pressure on public<br />
services, and other effects. Significantly, those benefits<br />
will also extend beyond direct transit system users to the<br />
economy at large. One example is the impact on property<br />
values, as demonstrated in numerous studies. A study for<br />
the Federal <strong>Transit</strong> Administration, for example, indicates<br />
an increase in residential equity value of about $160 for<br />
every 100 additional feet of transit station proximity. 8<br />
Another study in Washington, D.C. shows that for each<br />
1,000 foot decrease in the distance to a transit rail station,<br />
commercial property values increased by $2.30 per square<br />
foot, while the total value for properties averaging 30,500<br />
square feet rose by over $70,000.<br />
<strong>The</strong>se examples indicate some of the ways in which the<br />
Blue Ribbon Commission’s recommended enhancements<br />
of the <strong>MTA</strong> system will achieve not only critical environmental<br />
goals but economic gains that will help to offset<br />
A <strong>Transit</strong>-Based Economy Produces More with Less Energy<br />
<strong>The</strong> <strong>MTA</strong> sells some 8.5 million passenger trips daily at twice the energy efficiency<br />
of the most advanced hybrid cars. Thanks largely to the <strong>MTA</strong>’s efficiency, New<br />
Yorkers are among the world’s most productive workers and thriftiest energy users<br />
– with a per capita BTU consumption of one quarter of the national average.<br />
recessionary effects across the region. <strong>The</strong> report will also<br />
begin the important process of quantifying carbon avoidance,<br />
implementing lifecycle accounting and other internal<br />
steps to prepare the <strong>MTA</strong> for an emerging low-carbon<br />
economy. <strong>The</strong>se include a Sustainability Return On<br />
Investment (SROI) model outlined within the chapter on<br />
the <strong>Transit</strong>’s Triple Bottom Line; see page 71. Such models<br />
are already in use at some major organizations and will<br />
further prepare the <strong>MTA</strong> for markets in carbon trading and<br />
carbon-based program funding.<br />
From an economist’s perspective, the Commission’s<br />
recommendations could not be more timely. State governments,<br />
federal legislators, and the Obama Administration<br />
all agree that faced with a daunting global recession, a large<br />
economic stimulus must be directed toward infrastructure<br />
projects with demonstrable economic returns. In addition<br />
to the benefits described above, economic data from the<br />
<strong>MTA</strong>’s previous capital programs provide a clear record of<br />
the stimulatory effects on regional employment and industrial<br />
contracts. Initial assessment of the current recommendations<br />
indicates a possible yield of 105,500 net new jobs<br />
per year, employment income of $5.1 billion a year, and<br />
regional economic output of fully $17 billion per year for<br />
the period from 2010 to 2019. 9<br />
This urgent stimulus priority at the federal level intersects<br />
with the equally urgent international commitment to contain<br />
global warming, reduce<br />
GHGs, and reach a goal<br />
of 80 percent renewable<br />
energy by 2050.<br />
As the Commission’s<br />
work has made amply<br />
clear, the <strong>MTA</strong> system<br />
is one of the few public<br />
assets in the United<br />
States capable of<br />
generating significant,<br />
measurable returns on<br />
investment in all of<br />
these crucial areas.<br />
Green Ideas from <strong>MTA</strong> Employees<br />
From the Shop Floor<br />
and Frontlines of<br />
<strong>MTA</strong> Agencies<br />
One initiative launched by<br />
the Commission was a<br />
Green Ideas survey sent<br />
to the <strong>MTA</strong>’s 70,000 employees.<br />
A number of these green ideas from<br />
employees are highlighted in special<br />
boxes within this report.<br />
7 Burchell, Robert, with George Lowenstein, William Dolphin, Catherine Galley, Anthony Down, Samuel Seskin, Katherine Gray Still and Terry Moore, Costs of Sprawl-2000,<br />
Transportation Cooperative Research Program, TCRP <strong>Report</strong> 74, National Academy Press, 2002.<br />
8 US Department of Transportation, Federal <strong>Transit</strong> Administration. <strong>The</strong> Value of Mobility Improvements in Fixed Guideway <strong>Transit</strong>, May, 2002.<br />
9 HDR Inc., economist David Lewis’ firm, adopted aggregated implied multipliers from a recently completed project that analyzed transit investment of a comparable magnitude<br />
and complexity in another jurisdiction. Specifically, the multipliers adopted are from the cost benefit and economic impact assessment of the Regional Transportation Plan for<br />
the Greater Toronto and Hamilton Area.<br />
9
10<br />
Top Recommendations for <strong>Greening</strong> the <strong>MTA</strong> and the <strong>MTA</strong> Region<br />
<strong>The</strong> 22 commissioners divided into Working Groups focusing on key areas of sustainability. Each group consulted <strong>MTA</strong> staff and pro bono<br />
experts, commissioned research studies, and produced long-term transformational recommendations and near-term recommendations.<br />
<strong>The</strong> complete set of recommendations are found in each chapter.<br />
Energy/Carbon Working Group Facilities Working Group Smart Growth/TOD Working Group<br />
■ <strong>The</strong> <strong>MTA</strong> should draw 80 percent<br />
of its energy from renewable sources<br />
by 2050. To help achieve this, the<br />
<strong>MTA</strong> should join a consortium of<br />
public entities to pursue offshore<br />
wind farms capable of generating up<br />
to 1,500 megawatts of clean energy.<br />
■ <strong>The</strong> <strong>MTA</strong> should identify carbon<br />
avoidance as a revenue source to<br />
underscore the <strong>MTA</strong>’s role as a provider<br />
of climate stabilization services in its<br />
region and to establish the value of<br />
<strong>MTA</strong> services under any decarbonization<br />
policy (carbon tax, cap-and-trade,<br />
post-Kyoto /Copenhagen rules, etc.).<br />
■ <strong>The</strong> <strong>MTA</strong> should reduce operational<br />
energy use and GHG emissions on a<br />
per-passenger mile basis by 25 percent<br />
by 2019 through energy retrofits, smart<br />
fleet technologies, and more.<br />
■ <strong>The</strong> <strong>MTA</strong> should establish a “green”<br />
<strong>Metro</strong>Card contribution program,<br />
through which customers could make<br />
voluntary, tax-deductible donations to<br />
fund green aspects of sustainable capital<br />
and operating projects at the <strong>MTA</strong>.<br />
■ <strong>The</strong> <strong>MTA</strong> should field test and<br />
implement weight reduction and<br />
regenerative braking technologies, as<br />
recommended by the Commission’s<br />
Smart Fleets Task Force.<br />
<strong>The</strong> Need for Sustainable Capital Spending at the <strong>MTA</strong><br />
■ <strong>The</strong> <strong>MTA</strong> should adopt Leadership<br />
in Energy and Environment Design<br />
(LEED) Silver as its standard for all<br />
building projects, new construction, and<br />
major renovations wherever applicable,<br />
and either recommission existing<br />
buildings or pursue LEED Existing<br />
Buildings: Operations and Maintenance<br />
(LEED-EB) where possible.<br />
■ For all other transit facilities not<br />
covered by LEED Silver standards,<br />
the <strong>MTA</strong> should develop <strong>MTA</strong> Green<br />
Design Guidelines based on the<br />
LEED system.<br />
■ <strong>The</strong> <strong>MTA</strong> should develop a green<br />
Lifecycle Analysis (LCA) system for<br />
facilities to track the upfront costs and<br />
long-term savings from high-performance<br />
and regenerative design features.<br />
■ <strong>The</strong> <strong>MTA</strong> should increase the number<br />
of LEED-accredited employees and<br />
require 90 percent of new hires for<br />
facilities design positions to be LEED-<br />
Accredited Professionals (AP).<br />
■ <strong>The</strong> <strong>MTA</strong> should seek a LEED-EB<br />
rating for Grand Central Terminal.<br />
On December 4, 2008, the Commission on <strong>Metro</strong>politan Transportation Authority<br />
Financing, appointed by Governor David Paterson and chaired by Richard Ravitch,<br />
concluded that the <strong>MTA</strong>'s 2010-2014 capital program would require around $30 billion.<br />
That Ravitch Commission finding was consistent with the <strong>MTA</strong>’s own forecasts of its capital<br />
needs for the 2010-2014 program, which will enable the <strong>MTA</strong> to keep its core infrastruc-<br />
■ <strong>The</strong> <strong>MTA</strong> should capture two-thirds<br />
of all new vehicle miles traveled (VMT)<br />
generated within its region through 2030.<br />
To achieve this, the <strong>MTA</strong> should advise<br />
communities and collaborate with them<br />
on how to create and expand feeder and<br />
distributor lines and eliminate gaps in<br />
the regional transit network.<br />
■ <strong>The</strong> <strong>MTA</strong> should promote clustered<br />
development throughout its region,<br />
seeking to draw two-thirds of all new<br />
development to within a quarter-mile<br />
to a half-mile of transit access within<br />
the <strong>MTA</strong> network.<br />
■ <strong>The</strong> <strong>MTA</strong> should take the lead in<br />
closing the “last mile” transportation<br />
gap by improving access to transit<br />
through robust, flexible feeder and<br />
distributor services, as well as pedestrian<br />
and bike improvements.<br />
■ <strong>The</strong> <strong>MTA</strong> should develop a systemwide<br />
TOD program that articulates<br />
principles and guidelines for TOD<br />
project development and should assist<br />
communities, developers, and stakeholders<br />
throughout the region in planning<br />
these community-based initiatives.<br />
ture in a state of good repair, continue work on its mega-projects and adjust the capital<br />
program to take account of inflation.<br />
<strong>The</strong> Blue Ribbon Commission on Sustainability and the <strong>MTA</strong> believes that the vitality of<br />
the region and its economy cannot be maintained without a robust, resilient <strong>MTA</strong> infrastructure.<br />
<strong>The</strong> Sustainability Commission has considered the impact of critical sustainability
Materials Flow Working Group Water Management Working Group Climate Adaptation Working Group<br />
■ <strong>The</strong> <strong>MTA</strong> should institute a green<br />
Lifecycle Analysis (LCA) system to<br />
manage materials from procurements<br />
through disposal.<br />
■ <strong>The</strong> <strong>MTA</strong> should introduce sourceseparation<br />
of waste in NYCT subway<br />
stations.<br />
■ <strong>The</strong> <strong>MTA</strong> should enhance its efforts<br />
to reuse and expand markets for its<br />
waste.<br />
■ <strong>The</strong> <strong>MTA</strong> should flex its market<br />
power to promote green goods.<br />
■ <strong>The</strong> <strong>MTA</strong> should seek more revenue<br />
and energy potential from <strong>MTA</strong> waste.<br />
■ <strong>The</strong> <strong>MTA</strong> should encourage the use<br />
of low-carbon local materials by all<br />
<strong>MTA</strong> agencies and vendors.<br />
■ <strong>The</strong> <strong>MTA</strong> should expand the<br />
procurement of sustainable railroad<br />
ties at all rail agencies.<br />
issues on <strong>MTA</strong> capital planning. <strong>The</strong> Commission believes that the <strong>MTA</strong> should have<br />
$75 billion to $100 billion over the course of the next two <strong>MTA</strong> capital plans (2010-<br />
2014 and 2015-2019) to prepare the <strong>MTA</strong> and its service region for a sustainable future.<br />
Investments at these higher levels will help the <strong>MTA</strong> region and the nation weather the<br />
current recession as well as accelerate the region's transition from fossil-fuel dependency<br />
■ <strong>The</strong> <strong>MTA</strong> should identify beneficial<br />
uses for the millions of gallons of<br />
groundwater pumped out of subway<br />
system tunnels.<br />
■ <strong>The</strong> <strong>MTA</strong> should reduce its use<br />
of potable water by up to 75 percent or<br />
more by 2020 by substituting rainwater,<br />
recycling greywater, and/or other<br />
conservation practices.<br />
■ <strong>The</strong> <strong>MTA</strong> should implement<br />
systemwide metering and submetering<br />
to reduce its water consumption.<br />
■ <strong>The</strong> <strong>MTA</strong> should improve water<br />
fixtures and conservation at <strong>MTA</strong><br />
facilities through water efficient designs,<br />
water-saving fixtures, and employee<br />
programs. As the Commission stated<br />
in the interim report, the <strong>MTA</strong> should<br />
encourage the use of local drinking<br />
water by its 70,000 employees to<br />
minimize bottled-water consumption.<br />
■ <strong>The</strong> <strong>MTA</strong> should improve the<br />
efficiency of its vehicle washes<br />
systemwide.<br />
■ <strong>The</strong> <strong>MTA</strong> should develop a climateadaptation<br />
decision matrix to identify<br />
options for protecting transit infrastructure<br />
from storm surge, extreme heat, and<br />
other manifestations of climate change.<br />
■ <strong>The</strong> <strong>MTA</strong> should implement a<br />
Climate Adaptation Resiliency Evaluation<br />
procedure (CARE), which would be<br />
activated when any new projects or<br />
major alterations are undertaken where<br />
critical structural components are<br />
located in present or potential coastal<br />
surge flood zones.<br />
to a low-carbon economy. <strong>The</strong> Commission recommends that all of these capital<br />
expenditures be designed to meet the green standards described in this report. For<br />
projects already designed, any design review or subsequent design iteration should be<br />
carried out in keeping with the recommendations contained in this report.<br />
11
12<br />
Strategy for the 21st Century: Legislative and Policy Recommendations at a Glance<br />
<strong>The</strong> Commission believes that a number of legislative and policy actions for federal, state, regional, and local decision-makers will be<br />
necessary to assure the sustainability and future well-being of the <strong>MTA</strong> network and the New York region. A complete set of legislative<br />
and policy recommendations are found in the full 21st Century chapter on page 63.<br />
FEDERAL<br />
Pass a $1 Trillion Green Stimulus Bill<br />
- Focusing on 21st century transit and renewable energy<br />
Authorize and Reform 2010-15 Transportation Bill at $1 Trillion<br />
- Emphasize state of good repair<br />
- Reform funds distribution process and prioritize funding for metropolitan areas<br />
- Develop performance measures that recognize existing densities/transit use<br />
- Incentivize regional, intermodal, and pricing projects<br />
- Streamline federal processes/procedures<br />
- Require minimum green construction and operating standards for receipt of federal funds<br />
Require Greenhouse Gas (GHG) Reductions<br />
- Link land use and infrastructure investment to reduce GHG emissions by adapting California’s SB 375 to work on a<br />
national scale through regional reduction targets and plans<br />
Provide Leadership/Funding for Climate Adaptation<br />
- Establish a lead federal agency to coordinate federal, state, and local efforts and funding for climate-adaptation plans,<br />
programs, and strategies<br />
Raise Federal Gas Tax 40 Cents Over 5 Years, Index It to Inflation, and Fund a Shift to Mileage-Based User Fees<br />
Establish Carbon Emissions Avoidance Market and Dedicate 25 Percent of Revenues to <strong>Transit</strong><br />
Increase Monthly Commuter Tax Benefit to $230/Month for <strong>Transit</strong> Commuters<br />
Provide Incentives to Lenders That Offer Location Efficient Mortgages (LEMs)<br />
Provide Incentives to Developers Who Design and Construct to LEED-ND Standards and Achieve Gold Rating<br />
NEW YORK STATE<br />
Provide New Funding for the <strong>MTA</strong><br />
- Enact a Regional Mobility Tax of 1/3 of 1 percent of wages as recommended by the Ravitch Commission<br />
- Authorize tolling and variable pricing strategies as recommended by the Ravitch Commission, in order to pay for transit<br />
operations and expansion<br />
- Allocate revenue from Regional Greenhouse Gas Initiative (RGGI) auctions to VMT reduction strategies, including transit<br />
- Create clean-air surcharge for vehicles<br />
Encourage Use of Pension Funds and Endowments for Investments in <strong>Transit</strong> Projects<br />
Require Greenhouse Gas (GHG) Reductions<br />
- Set an enforceable statewide limit on GHG emissions with measures to reduce 80 percent by 2050<br />
- Link land use and infrastructure investment to reduce GHG emissions by adapting California’s SB 375 to NY State through<br />
regional reduction targets and plans<br />
Create <strong>MTA</strong> Regional Bus Authority (RBA)<br />
- Integrate and expand bus service and accelerate the development of Bus Rapid <strong>Transit</strong> (BRT) routes throughout the<br />
region via RBA, as envisioned by the Ravitch Commission<br />
Expand Last-Mile Services<br />
- Improve access to transit through robust and flexible feeder and distributor services and pedestrian and bike improvements<br />
Reform Tax Increment Financing (TIF)<br />
Establish <strong>Transit</strong>-Oriented Development Districts<br />
- Smart Growth Cabinet and the <strong>MTA</strong> should establish <strong>Transit</strong> Development Districts to prioritize and coordinate funding<br />
- Provide assistance to local communities<br />
Authorize Automated Cameras for Bus Lane Enforcement
NEW YORK CITY<br />
Create an All-Agencies TOD Task Force to Work with the <strong>MTA</strong> to Accelerate In-City TOD<br />
Implement On-Street Parking-Pricing Strategies to Manage Parking Demand and Keep Lanes Clear for Buses<br />
- Charge higher rates at peak hours for city parking spaces to increase turnover and reduce the blocking of lanes by<br />
decreasing the amount of time motorists spend “cruising” for parking<br />
Scale-Up Street Management Programs<br />
- Expand street-management programs city-wide to reduce congestion, improve safety, and allow buses to travel faster and<br />
more reliably<br />
SUBURBAN COUNTIES AND CITIES<br />
Promote <strong>Transit</strong>-Oriented Development (TOD)<br />
- Institute zoning ordinances and TOD-friendly parking policies to encourage development at transit-supportive densities<br />
- Develop station-area plans to prepare TOD sites and ensure adequate station access<br />
Implement Bus Rapid <strong>Transit</strong> (BRT)/ Light Rail <strong>Transit</strong> (LRT) Routes<br />
- Dedicate right-of-way or existing lanes to BRT<br />
- Provide signal prioritization and physical street improvements<br />
Expand Last-Mile Services<br />
- Improve access to transit through robust and flexible feeder and distributor services and pedestrian and bike improvements<br />
Implement Parking-Pricing Strategies to Manage Parking Demand on Streets and at Stations<br />
Implement Street-Management Programs to Keep Lanes Clear for Buses<br />
REGIONAL<br />
Establish a Regional Gas Tax with the 10 Regional Greenhouse Gas Initiative (RGGI) States and Dedicate Revenues<br />
to VMT Reduction Strategies, Including <strong>Transit</strong><br />
CONNECTICUT<br />
Enhance Commuter Rail Parking<br />
- Increase parking capacity at commuter rail stations by establishing ConnDOT enforceable goals for towns<br />
- Implement all forms of parking and station access strategies including pricing, satellite parking, ped/bike improvements,<br />
bike parking, car-share/carpooling, and feeder services<br />
Promote <strong>Transit</strong>-Oriented Development (TOD)<br />
- Use principles developed by the Responsible Growth Task Force to guide decision-making around land use and transportation<br />
- Provide funding and assistance to local communities to encourage TOD<br />
Encourage Housing near <strong>Transit</strong><br />
- Prioritize allocation of housing tax credits, tax exempt bonds, Department of Economic & Community Development funds,<br />
HOMEConnecticut, and other funds to support multifamily and mixed-income housing development near transit<br />
- Promote and monitor the progress of the HOMEConnecticut program, which provides incentives to municipalities for<br />
higher density housing near transit<br />
Implement Bus Rapid <strong>Transit</strong> (BRT) Routes<br />
Expand Last-Mile Services<br />
- Improve access to transit through robust and flexible feeder and distributor services and pedestrian and bike improvements<br />
- Develop programs and strategies to encourage commuters to use buses (i.e., electronic displays reporting real-time<br />
customer information)<br />
13
14<br />
“Over the next 40 years, the U.S.<br />
is projected to grow by 90 million people and the<br />
New York metropolitan area by 4 million. We simply<br />
cannot afford the economic, social, and environmental<br />
impacts of sprawl. <strong>The</strong> solution is to<br />
develop our metropolitan areas around transit, and<br />
the <strong>MTA</strong> is a model of such regional transit service.<br />
In addition to accommodating future growth, we<br />
must also mitigate and adapt to the impacts of<br />
climate change and biodiversity loss. To do all this,<br />
the <strong>MTA</strong> system must both grow and, at the same<br />
time, reduce its own environmental footprint. <strong>The</strong><br />
result will be a more robust and resilient region.<br />
<strong>The</strong> work of this Commission, along with the contributions<br />
of hundreds of <strong>MTA</strong> employees, sets us<br />
on the right path to advance this essential work.”<br />
Jonathan F.P. Rose<br />
Chair, Blue Ribbon Commission<br />
on Sustainability and the <strong>MTA</strong>
<strong>Report</strong>s And Recommendations<br />
From <strong>The</strong> Blue Ribbon Commission’s Sustainability Working Groups<br />
Energy/Carbon Working Group<br />
Energy use, fuel consumption, emissions, and CO2 avoidance<br />
Chair: Ashok Gupta, air and energy program director, Natural Resources Defense Council<br />
Facilities Working Group<br />
Building and facility design, construction, operations, and maintenance<br />
Chair: Robert F. Fox Jr., Cook+Fox Architects<br />
Smart Growth/<strong>Transit</strong>-Oriented Development (TOD) Working Group<br />
Land-use planning, transit access, and transit-oriented development<br />
Chair: Ned Sullivan, president, Scenic Hudson<br />
Materials Flow Working Group<br />
<strong>Greening</strong> procurement, minimizing waste, and maximizing savings<br />
Co-chair: Marcia Bystryn, president, New York League of Conservation Voters<br />
Co-chair: Michael E. White, executive director, Long Island Regional Planning Board<br />
Water Management Working Group<br />
Water resources, management, conservation, and protection<br />
Chair: Alex Matthiessen, Hudson Riverkeeper and president, Riverkeeper<br />
Climate Adaptation Working Group<br />
Preparation for rising sea levels, storms, and other climate changes<br />
Chair: Klaus Jacob, Lamont-Doherty Earth Observatory, Columbia University<br />
Given the interdependence of sustainability policies, a number of these topics are covered in<br />
more than one working group section.<br />
15
16<br />
“<strong>The</strong> climate crisis calls for bold and urgent<br />
action that promotes investments in transit, renewables,<br />
energy efficient buildings and transit-oriented development.<br />
<strong>The</strong> result will be a much healthier metropolitan region,<br />
both economically and environmentally.”<br />
– Ashok Gupta, air and energy program director,<br />
Natural Resources Defense Council<br />
Chair, Energy/Carbon Working Group<br />
Offshore wind turbines © 2009 Bluewater Wind LLC
Energy/Carbon<br />
Energy use, fuel consumption, emissions and CO2 avoidance<br />
For policymakers worldwide, climate change is now an<br />
established fact demanding concerted action. Already, data<br />
indicate a closing window of opportunity if we are to forestall<br />
the worst environmental and economic effects of global<br />
warming. Against this backdrop, the <strong>MTA</strong> offers a working<br />
model of high-value infrastructure for a low-carbon economy.<br />
<strong>The</strong> <strong>MTA</strong> system provides the rapid mobility essential to<br />
a prosperous economy while reducing fossil fuel consumption.<br />
As a result, the <strong>MTA</strong> region enjoys one of the highest<br />
rates of economic productivity and lowest rates of energy<br />
consumption in the world. <strong>The</strong> <strong>MTA</strong> system demonstrates<br />
how investment can mitigate global warming while sustaining<br />
economic growth.<br />
<strong>The</strong> Commission looked at innovative ways to further<br />
improve the <strong>MTA</strong> system’s carbon efficiency. <strong>The</strong> resulting<br />
recommendations fall into two categories. <strong>The</strong> first is integral<br />
to the <strong>MTA</strong>’s mission as the nation’s largest public transit<br />
system. With every extension of its transit operations, the<br />
<strong>MTA</strong> system takes tens of thousands of additional drivers<br />
off the roads (typically on a permanent commuting basis),<br />
transporting them instead on fuel-efficient subways, trains,<br />
and clean-technology buses – thus reducing oil consumption<br />
and CO2 output. A slight increase in transit carbon output<br />
typically signals an exponentially higher increase in carbon<br />
avoidance. In other words, growing the <strong>MTA</strong>’s carbon<br />
footprint actually shrinks the region’s net carbon footprint.<br />
Having assumed an even greater global urgency, this traditional<br />
mission will continue to be the <strong>MTA</strong>’s foremost contribution<br />
to sustainability. Quantifying this regional benefit<br />
should provide new ways to identify and evaluate funds or<br />
resources for the <strong>MTA</strong>. <strong>The</strong> Commission’s recommendations<br />
for expanding <strong>MTA</strong> transit access region-wide are addressed<br />
primarily in the Smart-Growth/TOD and Strategy for the<br />
21st Century: Legislative and Policy Recommendations<br />
chapters of this report.<br />
Total Regional GHG Emissions<br />
<strong>Mass</strong><br />
<strong>Transit</strong><br />
Other<br />
Transportation<br />
<strong>Mass</strong><br />
<strong>Transit</strong><br />
Other<br />
Transportation<br />
Less <strong>Mass</strong> <strong>Transit</strong> More <strong>Mass</strong> <strong>Transit</strong><br />
A small increase in transit’s carbon footprint typically delivers<br />
an exponentially greater decrease in the region’s carbon<br />
footprint, resulting in substantial net carbon avoidance.<br />
Source: T. Papandreau, LA <strong>Metro</strong><br />
<strong>The</strong> second category, the main focus of this chapter,<br />
concerns energy and carbon reductions within the <strong>MTA</strong><br />
system itself. <strong>The</strong> <strong>MTA</strong> has a history of pioneering cleaner,<br />
more efficient energy consumption at every level of operations,<br />
from the nation’s largest all-CNG bus fleet at Long Island<br />
Bus to innovations in track design and green architecture.<br />
<strong>The</strong> sustainability gains show up in a number of statistics.<br />
For example, the <strong>MTA</strong> accounts for 65 percent of all New<br />
York City commutes while using just 5 percent of New York<br />
City’s total energy consumption. Likewise, the fact that New<br />
Yorkers consume one quarter as much energy per capita as<br />
the average American is largely attributable to the <strong>MTA</strong><br />
system. In other words, if the entire nation matched the<br />
energy/carbon profile of the <strong>MTA</strong>’s transit radius, we would<br />
cut foreign oil dependency dramatically and achieve the<br />
Kyoto Protocol carbon emission targets decades ahead<br />
of schedule.<br />
<strong>The</strong> Commission looked at energy/carbon solutions in<br />
all areas of operations, as outlined below. Since no single<br />
initiative can radically alter the <strong>MTA</strong>’s current energy consumption,<br />
the recommendations focus on a combination of<br />
traditional efficiency programs and strategic investments in<br />
new energy technologies. Several programs deserve special<br />
mention. <strong>The</strong> first involves energy retrofits of <strong>MTA</strong> facilities<br />
in conjunction with the New York Power Authority (NYPA),<br />
an ongoing program that is projected to save greater than<br />
78,000 megawatt hours of electricity and 123,000 gallons<br />
of diesel fuel per year by 2010. Related upgrades to energyefficient<br />
lighting throughout the system include compact<br />
fluorescent light bulbs (CFL) in subway tunnels and lightemitting<br />
diode (LED) lighting for the Verrazano Narrows<br />
Bridge, one of the first LED lighting systems installed on<br />
any major U.S. span. <strong>The</strong> second program of particular note<br />
involves the development and piloting of green technology<br />
initiatives, including the use of energy generated by solar<br />
panels and tidal turbines, as well as testing of energy storage<br />
technologies and researching wind energy potential on <strong>MTA</strong><br />
facilities and corridors. <strong>Final</strong>ly, to help obtain 80 percent of<br />
the <strong>MTA</strong> electrical power from green sources by 2050, the<br />
<strong>MTA</strong> should join forces with NYPA and others to develop<br />
the vast potential of offshore wind power. If carried out as<br />
recommended, this transformational clean-energy initiative<br />
would completely alter the energy/carbon profile of the<br />
<strong>MTA</strong> and its service area. Since energy/carbon reductions<br />
are a primary goal of all sustainability programs, additional<br />
initiatives can be found under the Facilities chapter and the<br />
other sections of this report.<br />
17
18<br />
A model for low-carbon, high-value<br />
productivity, the <strong>MTA</strong> system provides<br />
65 percent of all New York City<br />
commutes, while using just 5 percent<br />
of the city’s total energy consumption.<br />
Like all transit systems, the <strong>MTA</strong> is an energy-intensive operation. <strong>The</strong> system’s<br />
current electrical consumption is approximately 3.5 million megawatt hours (2007).<br />
Approximately 80 percent of this total goes for vehicle traction. <strong>The</strong> <strong>MTA</strong> is exploring<br />
advances in rail technology and optimal reductions in traction power, while also investing<br />
in alternative energy sources and continuing to squeeze energy efficiencies from facilities,<br />
lighting, and other non-traction energy uses.<br />
<strong>MTA</strong> Electricity Consumption Data 2000-07<br />
Total Electricity (MWh) in millions<br />
4.0<br />
3.5<br />
3.0<br />
2.5<br />
2.0<br />
1.5<br />
1.0<br />
.5<br />
0<br />
<strong>MTA</strong> GHG Emissions<br />
Segregated by Agency<br />
64%<br />
NYCT Subways & Buses<br />
<strong>Metro</strong>-North Railroad<br />
Bridges & Tunnels<br />
<strong>MTA</strong> Bus<br />
2000 2001 2002 2003 2004 2005 2006 2007<br />
14%<br />
Total Electricity Estimated Revenue Passenger Miles<br />
5%<br />
13%<br />
1%<br />
2%<br />
1%<br />
Long Island Rail Road<br />
Long Island Bus<br />
HQ<br />
BASELINE<br />
Revenue Fleet Fuel–traction<br />
Electricity–traction<br />
Non-Revenue Fleet<br />
–Non-traction<br />
15,000<br />
14,800<br />
14,600<br />
14,400<br />
14,200<br />
14,000<br />
13,800<br />
13,600<br />
13,400<br />
13,200<br />
Estimated<br />
Revenue Passenger Miles<br />
(Million Miles)<br />
<strong>MTA</strong> GHG Emissions, Segregated<br />
by Traction and Non-Traction<br />
46%<br />
33%<br />
13%<br />
3%<br />
5%<br />
Electricity–Non-traction<br />
Heating–Non-traction<br />
Note: Previously, carbon emission calculations for electricity, originally presented in <strong>The</strong> Interim <strong>Report</strong> of the Blue Ribbon Commission on Sustainability and the <strong>MTA</strong>, were<br />
based upon emissions data for NYC and did not take into account the lower emission factors associated with electricity generation in <strong>MTA</strong> service areas outside of the city.<br />
Consequently, total <strong>MTA</strong> carbon emissions associated with electricity were overstated (2.8 million metric tons). Current carbon emission data has been refined to account for<br />
all <strong>MTA</strong> sources of electricity with updated emission factors (based on <strong>The</strong> Climate Registry’s General <strong>Report</strong>ing Protocol).
Recommendation 1. Move Aggressively Towards Renewable Energy Generation<br />
<strong>The</strong> <strong>MTA</strong> should move forward with an aggressive schedule of renewable energy use, development, and generation, with<br />
an initial phase of 7 percent renewable energy by 2015 and a long-term goal of generating 80 percent of the <strong>MTA</strong>’s total<br />
electrical energy needs from clean, renewable energy by 2050. <strong>The</strong> <strong>MTA</strong> consumed approximately 3.5 million megawatthours<br />
of electricity in 2007, costing approximately $367 million.<br />
Combined with the <strong>MTA</strong>’s current contributions to carbon avoidance, this green transformation of the <strong>MTA</strong>’s electricity<br />
supply will represent a major step toward true regional sustainability and a permanent source of low-carbon economic<br />
productivity for the entire metropolitan area. To meet this goal, the <strong>MTA</strong> should take action now on the offshore wind<br />
farm initiative described in Project 1 below. In addition to generating clean energy, this transformational initiative will:<br />
• Help meet the growing demand for additional power sources in the densely populated New York metropolitan area.<br />
• Develop a renewable energy source that will function as a hedge against future “oil shocks” and rising fossil-fuel prices.<br />
For the initial phase, the <strong>MTA</strong> should use a mix of onsite distributed generation and Renewable Energy Credits (RECs) to<br />
achieve the 7 percent renewable energy goal by 2015, thus supporting the goals of the New York State Renewable Portfolio<br />
Standard. By seeking the long-term goal of 80 percent by 2050, the <strong>MTA</strong> will vigorously support the emerging consensus<br />
among scientists, policymakers, and environmental leaders worldwide regarding carbon reductions and climate stabilization.<br />
<strong>The</strong> Commission also recommends that the <strong>MTA</strong> target both percentages on the basis of its total energy consumption while<br />
continuing to increase ridership. Following are five Energy Projects for attaining this transformational recommendation.<br />
• Energy Project 1. Join Offshore Wind Consortium. To accelerate the <strong>MTA</strong>’s conversion to renewable energy, the <strong>MTA</strong><br />
should enter into a consortium with New York Power Authority (NYPA), Long Island Power Authority (LIPA), New York<br />
City, the suburban counties, and other parties to develop offshore wind sources along the coastlines of Kings, Queens,<br />
Nassau, and Suffolk counties capable of generating up to 1,500 megawatts (MW) of clean energy. Governor Paterson has<br />
already convened a working group with Con Edison and LIPA to assess the feasibility of wind turbines off Rockaway Point.<br />
NYPA has expressed a strong interest in joining forces with the <strong>MTA</strong>. <strong>The</strong> <strong>MTA</strong> should be a major player in the consortium.<br />
With its large, steady power requirements, the <strong>MTA</strong> is an ideal user of wind power. In addition, onsite renewable generation<br />
and consumption have the added advantage of avoiding congested transmission lines, which have often hindered the proliferation<br />
of renewable power in New York State. <strong>The</strong> scale, clean energy potential and high efficiency of offshore wind farming,<br />
along with the funding value of RECs, makes this a potentially transformational project for the <strong>MTA</strong>.<br />
Newark<br />
Paterson<br />
New York City<br />
Coney Island<br />
Long Beach<br />
Nassau County<br />
Freeport<br />
TRANSFORMATIONAL RECOMMENDATIONS<br />
Stamford<br />
Hempstead<br />
Copiague<br />
West Babylon<br />
Suffolk County<br />
Proposed Offshore Wind Park<br />
Long Beach<br />
13 miles<br />
Freeport<br />
Hempstead<br />
Copiague<br />
West Baby<br />
19
Modeling Carbon Avoidance<br />
Many businesses and public entities now use<br />
models that quantify reductions in carbon emissions<br />
and assign such reductions a market<br />
value. Similarly, the <strong>MTA</strong> has begun to quantify<br />
the “carbon avoidance” realized by any regional<br />
shift from automobiles to transit. Since carbon<br />
avoidance is one of the most cost-effective ways<br />
to reduce emissions, the <strong>MTA</strong> will seek to measure<br />
it in a way that can be applied in cap-andtrade<br />
markets or other funding systems. As documented<br />
in studies by the American Public<br />
Transportation Association (APTA), transit services<br />
produce three levels of carbon avoidance:<br />
• A direct reduction of carbon emissions on a<br />
per-passenger-mile basis through the mode shift<br />
from automobiles to transit ridership.<br />
• A reduction in emissions from the reduced<br />
traffic congestion, allowing more efficient automobile<br />
traffic flow with less idling and stop-start<br />
driving.<br />
• <strong>The</strong> reduction in emissions through more clustered<br />
land-use patterns that permanently reduce<br />
the mileage between destinations for all types of<br />
transportation, including automobiles.<br />
<strong>The</strong>se three tiers of carbon avoidance mean that<br />
expanding the <strong>MTA</strong> is among the most effective<br />
ways to permanently reduce regional carbon<br />
levels on a large scale. Apart from future revenue<br />
opportunities, the carbon-avoidance value<br />
of <strong>MTA</strong> transit is arguably the only way that<br />
New York City, Nassau County, and other government<br />
entities will be able to grow economically<br />
while achieving their stated or legally mandated<br />
carbon reduction goals. <strong>The</strong> same applies<br />
to states in the <strong>MTA</strong> service area and to the<br />
country as a whole.<br />
20<br />
• Energy Project 2. Initiate Renewable Energy Schedule with RECs. <strong>The</strong> <strong>MTA</strong><br />
should step up its commitment to renewable energy through the immediate purchase<br />
of more Renewable Energy Credits (RECs). <strong>The</strong> accelerating conversion to renewable<br />
energy will then advance in two phases. Phase One (2009-2014): RECs purchased<br />
through a NYPA-issued mini-RFP based upon market availability. Phase Two (2015<br />
and forward): <strong>MTA</strong> participates in offshore wind energy generation in collaboration<br />
with NYPA, LIPA, Con Edison, and others. In the event offshore wind proves to be<br />
infeasible or substantially delayed, the <strong>MTA</strong> should develop plans to participate in a<br />
NYPA-facilitated RFP for other new in-state renewable energy generation, including<br />
new land-based wind.<br />
• Energy Project 3. Purchase 6 Megawatts of On-Site Solar Power. <strong>The</strong> <strong>MTA</strong><br />
should participate in a NYPA-issued RFP for the purchase of up to 6 megawatts of<br />
power generated by solar panels installed on <strong>MTA</strong> roofs and property with the aim of<br />
acquiring solar power at a competitive, fixed price with a positive return on investment<br />
over the life of the project. <strong>The</strong> installations will be financed, owned, and operated by<br />
the solar power provider and the <strong>MTA</strong> should buy this solar power from NYPA. <strong>The</strong><br />
<strong>MTA</strong> and NYPA have issued a RFI (Request For Information) to solicit information on<br />
costs, services, and other factors from the widest range of potential providers. <strong>The</strong> RFI<br />
was issued on November 18, 2008 (http://www.nypa.gov/doingbusiness/powerpurchase/powerpurchase.htm).<br />
• Energy Project 4. Build Integrated Wind/Solar Energy Sources. <strong>The</strong> <strong>MTA</strong> should<br />
assess the feasibility and costs of integrating wind turbines, solar panels, or a mix of<br />
the two, into new roof installations. For example, at the Far Rockaway Bus Depot, this<br />
technology could supply approximately 30 percent of the depot’s 300 kilowatt (KW)<br />
load. At present, a feasibility study has been conducted and potential funding sources<br />
are being identified.<br />
• Energy Project 5. Tidal Power at Roosevelt Island Station. <strong>The</strong> <strong>MTA</strong> should<br />
pursue an agreement with a vendor to provide approximately 50 percent of the power<br />
for NYCT’s Roosevelt Island station using tide-powered turbines. At present, the<br />
supplier has reinstalled two tidal turbines and applied for a 1 megawatt commercial<br />
power license, with license approvals and installation of additional turbines slated for<br />
late 2010.<br />
Recommendation 2. Quantify Carbon Avoidance to Demonstrate<br />
<strong>Transit</strong>’s Climate-Stabilization Role and to Score <strong>Transit</strong>’s Share<br />
of Decarbonization Revenue<br />
<strong>The</strong> <strong>MTA</strong> should institute accounting procedures to quantify the carbon emissions<br />
avoided by its transit services. In addition to the mobility value provided by <strong>MTA</strong><br />
transit, the system’s carbon avoidance is now a measurable, unreimbursed commodity<br />
with an emerging market value. <strong>The</strong> <strong>MTA</strong> must begin to position itself not only as a<br />
transportation network, but as the provider of the same climate-stabilization benefits<br />
for which many industries now claim financial and funding credits. <strong>The</strong> <strong>MTA</strong> should<br />
continue its efforts with the American Public Transportation Association (APTA) to<br />
measure and log its carbon footprint with <strong>The</strong> Climate Registry (TCR). <strong>The</strong> <strong>MTA</strong>’s<br />
footprint should record not only carbon emissions produced by <strong>MTA</strong> operations, but<br />
carbon emissions avoided as well.<br />
Recommendation 3. Target Specific Energy and Carbon Reductions<br />
As a general guideline, the Commission recommends that the <strong>MTA</strong> publish long-term<br />
target dates and specific interim dates for its energy and carbon savings, much as it<br />
does for financial and ridership projections. <strong>The</strong> target of an 80 percent reduction in<br />
total GHGs by 2050 will set the framework and bring the <strong>MTA</strong>’s programs into line<br />
with internationally recognized sustainability goals. As a near-term example, the <strong>MTA</strong><br />
should establish the goal of a 25 percent reduction in energy consumption and CO2<br />
emissions on a per-passenger-mile basis within ten years (by 2019).
Recommendation 4. Leverage the <strong>MTA</strong>’s Market Power to Spur Renewable and Innovative Energy<br />
Industries and Partnerships<br />
As the <strong>MTA</strong> seeks to lower its carbon emissions and transition its operations into clean, renewable energy, it has an<br />
opportunity to incubate and support renewable and cutting-edge energy entrepreneurs, industries, and suppliers throughout<br />
the mid-Atlantic region. As a large energy consumer with highly consistent yet dispersed energy needs, the <strong>MTA</strong> is an ideal<br />
customer for many renewable energy technologies. And as a public benefit corporation, the <strong>MTA</strong> can pilot new energyefficiency<br />
technologies that may have a longer-term return on initial investments, whether on its own or in partnership with<br />
other major public entities. <strong>The</strong> <strong>MTA</strong>’s role in pushing the development and marketing of the diesel hybrid-electric bus is an<br />
example of this potential made real. Currently, the <strong>MTA</strong> is partnering with the New York State Energy Research and<br />
Development Authority (NYSERDA), which has dedicated $2.5 million in funding, in the form of a Program Opportunity<br />
Notice or PON (PON 1217) for pilot projects or research in transportation-related energy-efficient technology. Three projects<br />
have been selected, totaling approximately $1.25 million of $2.5 million available, with the second round of proposals to be<br />
evaluated in the first quarter of 2009. <strong>The</strong> selected project proposals, which involve cutting-edge energy technologies, are:<br />
(1) field test a giga-cell battery for wayside energy storage; (2) model onboard ultra-capacitor energy storage potential; and<br />
(3) perform Phase 2 of a regenerative-braking potential study. <strong>The</strong> Commission believes the <strong>MTA</strong> should continue to use<br />
this market power where possible to help build renewable energy industries throughout the mid-Atlantic region.<br />
On-Site Wind Power in the <strong>MTA</strong> System<br />
In addition to its long-term goal of offshore wind power, the <strong>MTA</strong> is investigating opportunities to develop wind power directly on some of its properties or right-of-ways.<br />
Due to acreage requirements and community constraints, the opportunities are limited to small-scale projects. Small wind turbines range from 20kW to 100kW. <strong>The</strong>y have<br />
very low maintenance requirements and a typical life of 20-plus years.<br />
<strong>The</strong> estimated total for cost-effective wind power on <strong>MTA</strong> properties is between 246 and 356 megawatt hours per year. Although that total is low as a percentage of the<br />
<strong>MTA</strong>’s renewable energy goals, the <strong>MTA</strong> does have an opportunity to be a market leader as the first U.S. transit authority to integrate wind energy with transit operations.<br />
<strong>The</strong> <strong>MTA</strong>’s project consultants identified six sites with potential for small-scale wind development. One of these potential sites was the Montauk Station on Long Island,<br />
shown above. <strong>The</strong> full Renewable Energy <strong>Report</strong> is available at www.mta.info/environment.<br />
21
22<br />
Recommendation 1. Accelerate NYPA Energy Retrofits and Energy-Efficiency Projects<br />
<strong>The</strong> <strong>MTA</strong> should expand its energy retrofits in collaboration with NYPA, which now have a proven record of significant<br />
and compounding energy savings. At present, the <strong>MTA</strong> plans to nearly double its program of energy retrofits and energyefficiency<br />
projects with NYPA. To set a clear framework for this important source of energy savings, the Commission<br />
recommends that the <strong>MTA</strong> set a goal of re-evaluating the energy efficiency potential in 100 percent of major <strong>MTA</strong><br />
facilities every 10 years.<br />
A Greener Subway Track<br />
Some energy savers, like Compact Fluorescent Lightbulbs (CFLs) in subway tunnels, are no-brainers. Others are not so obvious, such as the engineering of “humped tracks” on the<br />
Second Avenue Subway project. By adjusting track inclines at stations, designers use gravity to reduce the energy trains expend in braking and acceleration, shaving extra kilowatts<br />
off each train arrival. Similarly, minute calibrations of the turn radius in tracks can minimize energy loss in braking. <strong>MTA</strong>’s R160 subway cars, equipped with regenerative braking,<br />
have the potential to capture the braking energy as trains enter a station and transfer it to trains departing on the adjacent tracks. With the conversion to an all AC fleet, the <strong>MTA</strong><br />
would have the opportunity to use the full potential of regenerative braking and capture significant energy savings.<br />
2nd Ave Subway Cross Section – Humped Tracks<br />
NEAR-TERM RECOMMENDATIONS<br />
Recommendation 2. Field Test and Implement Weight Reduction and Regenerative-Braking<br />
Technologies, as Recommended by the Commission’s Smart Fleets Task Force<br />
<strong>The</strong> <strong>MTA</strong> should reduce its demand for propulsion power and fuel by moving aggressively to identify and implement the<br />
most energy-efficient innovations being tested in its Smart Fleets program. Both regenerative-braking systems and design<br />
innovations that lighten the weight of rolling stock while maintaining safety are the most promising advances in the current<br />
Smart Fleet programs. <strong>The</strong> <strong>MTA</strong> must continue to expedite testing of new technologies that shave the energy expended for<br />
traction power, by far the <strong>MTA</strong>’s largest energy demand.<br />
Recommendation 3. Expand the Use of LED Lighting<br />
<strong>The</strong> <strong>MTA</strong> should expand its use of LED lighting within the <strong>MTA</strong> system by taking advantage of opportunities for LED fixtures<br />
in signals, emergency cut-off lights, tunnel lighting, and other applications. <strong>The</strong> <strong>MTA</strong> should also expedite its replacement<br />
of bridge necklace lighting with new LED fixtures, which testing indicates cut energy consumption by approximately 73 percent<br />
and reduce crew maintenance costs. For the pilot project at the Verrazano-Narrows Bridge, LED necklace lights were delivered<br />
in November 2008 and installation will be completed by June 2009. <strong>The</strong> <strong>MTA</strong> should undertake LED installations at the<br />
three major remaining <strong>MTA</strong> bridges (Bronx-Whitestone, Robert F. Kennedy, and Throgs Neck).<br />
LED Bridge Lightning<br />
<strong>The</strong> <strong>MTA</strong> has begun replacing the existing necklace<br />
lighting on the Verrazano-Narrows Bridge with LED<br />
lighting, significantly reducing energy consumption,<br />
maintenance costs, and waste.
Potential Traction Power Reductions<br />
<strong>The</strong> <strong>MTA</strong>’s traction power alone requires some 2.8 billion kWh a year. NYCT consumes about 80 percent (2.3 billion kWh) of the total.<br />
<strong>The</strong> Commission examined technologies and techniques with the potential to reduce <strong>MTA</strong> traction power. <strong>The</strong>se take two forms:<br />
(1) Regenerative energy management techniques; and (2) <strong>Mass</strong> reduction of train-car components. <strong>The</strong> lighter the train cars, the less<br />
energy the <strong>MTA</strong> needs to move them.<br />
Regenerative techniques include on-board and trackside energy storage, operational enhancements such as start/stop synchronization,<br />
and software modifications allowing train cars to better use regenerated energy. <strong>Mass</strong> reduction techniques include elimination of<br />
redundant components, substituting lighter materials such as aluminum for steel, and design optimization to enable identical structural<br />
performance with reduced weight.<br />
10% (Low Case)<br />
Energy Saving Scenarios – 10%, 15%, 25%: Existing Fleet and New Car Procurement (R160 OP2 + R179, R188)<br />
Energy Reduction Goal Technology Required Issues/Special Requirements Total Cost (Differential Cost)<br />
15% (Medium Case)<br />
25% (High Case)<br />
• All Reasonable Lightweighting<br />
Technology (2.5% reduction)<br />
• Moderate Regeneration<br />
Performance (7.5% reduction)<br />
by on-board energy storage<br />
• All Reasonable Lightweighting<br />
Technology (2.5% reduction)<br />
• High Regeneration Performance<br />
by on-board energy storage<br />
(12.5% reduction)<br />
• All Reasonable Lightweighting<br />
Technology (2.5% reduction)<br />
• Very HIgh Regeneration<br />
Performance by on-board energy<br />
storage (22.5% reduction)<br />
Note: *Regenerative capable fleet is 4,182 cars = 2,270 existing fleet + 382 R160 Op2 + 1,530 R179, R188.<br />
• ~ 2,000 lbs per car average weight reduction must be<br />
applied to 4,800 car overhaul-eligible fleet and all<br />
1,500 new-build cars<br />
• Average regeneration of 3.75 kWh per stop, per 10 car<br />
train required for the 4182 regen capable fleet*<br />
• Implies that 31% of the regen capable fleet must have<br />
full 12 kWh on-board energy storage (1,300 cars)<br />
• Optimal regeneration requires special train braking<br />
performance (moderate stop)<br />
• ~ 2,000 lbs per car average weight reduction must be<br />
applied to 4,800 car overhaul-eligible fleet and all 1,500<br />
new-build cars (full fleet)<br />
• Average regeneration of 6.25 kWh per stop, per 10 car<br />
train required for the 4,182 regen capable fleet*<br />
• Implies that 52% of the regen capable fleet must have full<br />
12 kWh on-board energy storage (~2,200 cars)<br />
• Optimal regeneration requires special train braking<br />
performance (moderate stop)<br />
• ~ 2,000 lbs per car average weight reduction applied<br />
to 4,800 car overhaul-eligible fleet and all 1,500 new-build<br />
cars (full fleet)<br />
• Average regeneration of 11.25 kWh per stop, per 10 car<br />
train required for the 4,182 regen capable fleet*<br />
• Implies that 94% of the regen capable fleet must have full<br />
12 kWh on-board energy storage (~3,900 cars)<br />
• Optimal regeneration requires special train braking<br />
performance (moderate stop)<br />
• $35 M Lightweighting<br />
• $268.5 M<br />
Regeneration 40 yr<br />
lifecycle cost (2-year<br />
battery replacement<br />
interval)<br />
• $35 M Lightweighting<br />
• $447.5 M<br />
Regeneration 40-yr<br />
lifecycle cost (2-year<br />
battery replacement<br />
interval)<br />
• $35 M Lightweighting<br />
• $805 M<br />
Regeneration 40-yr<br />
lifecycle cost (2-year<br />
battery replacement<br />
interval)<br />
All three scenarios above are realistically achievable using technology that has a reasonable near-term availability. Achieving all three<br />
scenarios, however, is highly dependent on maximizing regenerative energy performance using regulated train braking and on-board energy<br />
storage using best-in-class lithium battery technology. Note: Cost estimates are associated with application on all applicable NYCT subway<br />
fleets. Further details are available online at www.mta.info/environment.<br />
23
24<br />
Existing Fleet – Retrofit<br />
(overhaul eligible)<br />
4,886 cars<br />
New Cars – designed<br />
but not yet built<br />
(R160 Opt 2) 382 cars<br />
New Cars –<br />
not yet designed (R179,<br />
R188) 1,530 cars**<br />
Lightweighting<br />
Technology<br />
Energy Impact<br />
(kWh)<br />
Key Takeaway<br />
<strong>The</strong> greatest annual energy savings is not necessarily<br />
the most cost efficient<br />
Key Takeaway<br />
3,988,604<br />
Other benefits, such as operational and safety<br />
improvements, can occur with these modifications in<br />
addition to weight savings<br />
Maximum Achievable Energy Savings by Fleet Groups<br />
Regeneration Lightweighting<br />
(Assumes perfect regeneration using a full 12kWh on-board)<br />
Energy Savings: 384,084,000 kwh<br />
CO2 Avoided: 165,156,120 kg<br />
Cost:* $23.3 M<br />
Note:* only 2,270 cars regen capable<br />
Energy Savings: 64,634,400 kwh<br />
CO2 Avoided: 27,792,792 kg<br />
Cost:* $3.9 M<br />
Energy Savings: 258,876,000 kwh<br />
CO2 Avoided: 111,316,680 kg<br />
Cost:* $15.7 M<br />
Costs are expressed as differential cost, defined as the increased cost necessary to achieve the desired savings beyond costs that would be incurred regardless. For regeneration,<br />
differential cost is equal to procurement cost since it is a new system addition to the fleet.<br />
*Regeneration Cost represents the recurring cost to replace the rechargeable batteries every 2 years due to extremely high cycling that occurs in an urban transit system.<br />
Lightweighting cost represents the differential cost and does not have an associated recurring cost metrics such as cost, CO2, or energy savings.<br />
**Note: R188 class “new cars” are actually composed of 386 new chassis, and 120 R142a up-converted chassis; however this does not materially impact key performance.<br />
Potential Annual Energy Impact by Lightweighting Innovations–Assume All Overhaul-Eligible and New Cars (R160 0p, R179, R188)<br />
4,491,429<br />
6,055,794<br />
7,514,128<br />
Energy Savings: 24,092,235 kwh<br />
CO2 Avoided: 10,359,661 kg<br />
Cost:* $20.9 M<br />
Note: Avg 1,440 lb per car savings<br />
Energy Savings: 2,709,009 kwh<br />
CO2 Avoided: 1,164,874 kg<br />
Cost:* $2.8 M<br />
Note: Avg 2,144 lb per car savings<br />
Energy Savings: 16,092,136 kwh<br />
CO2 Avoided: 6,919,619 kg<br />
Cost:* $11.9 M<br />
Note: Avg 3,203 lb per car savings<br />
12,546,308<br />
Composite instead of plymetal panel flooring<br />
Giga cell battery with alternative battery box<br />
Utilize Oilless Compressor concepts<br />
Corrugated wheels / Lightweight wheels<br />
Utilize single draft gear (tube style) link bar<br />
One free axle on 1 non-motorized truck replacing OSMES<br />
Gear unit with lowest weight<br />
Lightweight floor pans<br />
Eliminate OSMES, brackets and equipment<br />
Eliminate flip up seats<br />
Eliminate secondary center collision posts<br />
Trip cock linkage weight reduction<br />
Eliminate 1 of 2 coupler adapters on NMTs units<br />
Reduce weight of coupler guides on type 1 truck<br />
Reduce heater grill weight<br />
Reduce advertisement card clips weight<br />
<strong>The</strong> full version of this report can be viewed online at www.mta.info/environment.<br />
TOTAL<br />
42,685,643<br />
kWh
<strong>The</strong> <strong>MTA</strong>‘s energy retrofits with NYPA continue to squeeze significant amounts of energy out of <strong>MTA</strong> facilities, lighting<br />
systems, and other non-traction operations. While green technology grabs headlines, sustainability can also advance<br />
through innovations with less pizzazz. That's the case with one of <strong>MTA</strong>'s most effective energy-saving programs. <strong>MTA</strong><br />
works closely with NYPA on a bond-funded program of energy retrofits at <strong>MTA</strong> facilities. Where potential energy savings<br />
are found, NYPA draws on their bond capital to pay for new, energy-cutting upgrades. NYPA recoups its investment<br />
over a period of years through the resulting energy savings. <strong>MTA</strong> pays the same electricity bills during the payback<br />
period, but lowers its actual energy consumption. <strong>MTA</strong> gains major facility improvements without a dime of capital<br />
investment. <strong>The</strong> energy savings then revert to <strong>MTA</strong> after the payback period. Collectively, these ongoing projects will<br />
result in <strong>MTA</strong> energy savings of 78,000 megawatt hours (MWh) per year by 2010 (saving approximately $9.4 million<br />
per year) and will eliminate some 32,600 metric tons of CO2 emissions annually.<br />
<strong>The</strong> <strong>MTA</strong> agencies have also made initial reductions in energy consumption and the <strong>MTA</strong> carbon footprint by transitioning<br />
to various types of compressed natural gas (CNG) and hybrid vehicles; by integrating photovoltaic (PV) panels and fuel<br />
cells into new facilities; and through the purchase of renewable energy credits (RECs).<br />
Current totals are as follows:<br />
• Alternative-Fuel Vehicles: In its revenue bus fleets, the <strong>MTA</strong><br />
now runs 1,107 CNG buses and 875 diesel-hybrid-electric buses.<br />
In its non-revenue light-duty service fleets (maintenance vehicles,<br />
dispatch vehicles, etc.), the <strong>MTA</strong> has a total of 484 alternativefuel<br />
vehicles, mostly hybrid gas-electric. Some 91 percent of all<br />
new light-duty service vehicles purchased over the last year are<br />
alternative-fuel vehicles.<br />
• Renewable Energy Sources: <strong>The</strong> <strong>MTA</strong> facilities currently<br />
generate approximately 1,400 MWhs of energy from on-site<br />
PV panels and a hydrogen fuel cell. <strong>The</strong> <strong>MTA</strong> also supports the<br />
generation of renewable energy through its purchase of renewable<br />
energy credits (RECs). In 2007, the <strong>MTA</strong> purchased 7,500<br />
MWhs of RECs, of which 3,000 were from wind and 4,500<br />
from sustainably managed biomass.<br />
Energy-Efficiency Achievements:<br />
<strong>MTA</strong> Alternative Vehicle Fleets<br />
Revenue Vehicles<br />
CNG Buses<br />
Revenue Vehicles<br />
Diesel Hybrid-Electric Buses<br />
Light-duty Non-revenue<br />
Vehicles – Hybrid-electric<br />
(gasoline-electric)<br />
Light-duty Non-revenue<br />
Vehicles – Flex-fuel (E85)<br />
Light-duty Non-revenue<br />
Vehicles – CNG<br />
• LED Train Signals: New York City <strong>Transit</strong> has replaced nearly 100 percent of its incandescent train signals with<br />
high-efficiency LED signals, resulting in energy savings of approximately 6,000 megawatt hours of electricity per year,<br />
in addition to the substantial maintenance savings associated with less frequent signal light replacement.<br />
• Battery Energy Storage: Long Island Bus has completed the installation of a high-efficiency sodium sulfur battery<br />
energy storage system at their Mitchell Field facility. <strong>The</strong> battery system, which can store and discharge up to<br />
1 megawatt of electricity, is charged at night when electricity demand and utility rates are low and then used during<br />
the day to power compressors for fueling the Long Island Bus fleet of compressed natural gas buses.<br />
Green Ideas from <strong>MTA</strong> Employees<br />
Install Remote Meter<br />
Reading Devices for each<br />
type of utility meter (water,<br />
gas, and electric) so that all<br />
utility meters can be read on<br />
a consistent cycle (i.e.; every<br />
30 days, or 60 days etc.) This would also make<br />
it easy to read utility meters that are in hard to<br />
reach places.<br />
– Minna Hamilton, <strong>MTA</strong> Bus<br />
ACHIEVEMENTS TO DATE<br />
4% 2%<br />
46%<br />
13%<br />
36% 33%<br />
45%<br />
• Rapid Roll-Up Doors: <strong>MTA</strong> Bus Company has added high-speed<br />
rapid roll-up doors. <strong>The</strong> high-speed roll-up doors are well insulated<br />
and open and close up to three times faster than conventional steel<br />
roll-up doors, minimizing the air exchange between the depot and<br />
the outside environment and resulting in decreased heating and cooling<br />
demand throughout the year.<br />
25
26<br />
Facilities<br />
Building and facility design, construction, operations, and maintenance<br />
Along with major fixed structures such as bridges, rail lines,<br />
and tunnels, the <strong>MTA</strong> maintains a highly diverse building<br />
portfolio of hundreds of facilities, including rail stations,<br />
subway stations, maintenance barns, office buildings, and<br />
such landmark properties as Grand Central Terminal. <strong>The</strong><br />
buildings represent a wide range of functions and styles.<br />
Many are open-air structures; some border wetlands, rivers,<br />
or parks; most date from the early 20th century; a number<br />
feature state-of-the-art designs; several occupy some of<br />
the most valuable real estate in the world. <strong>The</strong> <strong>MTA</strong> acts<br />
as both a builder and operator of its facilities. Both roles<br />
involve extensive management of energy systems, materials,<br />
and other aspects of sustainability. Because these holdings<br />
are so extensive, the <strong>MTA</strong> can make a significant contribution<br />
to regional sustainability through green building design<br />
and management.<br />
<strong>MTA</strong>’s Corona Maintenance Facility was North America’s<br />
and the <strong>MTA</strong>’s first LEED (Leadership in Energy and<br />
Environmental Design) certified transit facility. Based on<br />
this pioneering effort, the Commission has determined<br />
that LEED standards can apply to some transit facilities,<br />
and the Commission has recommended that in the future<br />
all applicable <strong>MTA</strong> projects seek a LEED Silver certification.<br />
However, the current LEED standards do not substantially<br />
apply to many typical transit facilities, such as power substations<br />
and most rail stations. With guidance from the<br />
Commission, the <strong>MTA</strong> is drafting the green building guidelines<br />
that will specify how these facility types can be designed<br />
in a sustainable way (see table later in this chapter).<br />
<strong>The</strong> <strong>MTA</strong> Green Building Guidelines will incorporate LEED<br />
criteria, as well as <strong>MTA</strong>-specific environmental criteria<br />
relating to noise and vibration, security, maintenance of<br />
transit operations, visual impact, and other transit-specific<br />
qualities. Once developed, these guidelines can serve as an<br />
industry model for green transit facilities and should be<br />
submitted to the U.S. Green Building Congress (USGBC)<br />
for potential adoption as a LEED for <strong>Transit</strong> standard.<br />
<strong>The</strong> other area where LEED standards may not apply to<br />
<strong>MTA</strong> facilities is in older structures. <strong>The</strong> <strong>MTA</strong> portfolio<br />
includes a large number of legacy structures from the<br />
early 20th century or before. While there are LEED standards<br />
for existing buildings (LEED-EB), only a minority of<br />
<strong>MTA</strong> structures can be readily adapted to meet them due<br />
to their specified functions. <strong>The</strong> <strong>MTA</strong> should seek LEED-EB<br />
certification for Grand Central Terminal, which would make<br />
it a national showcase for greening landmark buildings.<br />
For greening most of the <strong>MTA</strong>’s facilities, two ready options<br />
exist. Many of the more recent buildings should be recommissioned<br />
to optimize all energy systems. <strong>The</strong> <strong>MTA</strong> is<br />
identifying and assessing such structures. <strong>The</strong> remaining<br />
facilities should undergo rigorous energy auditing, as<br />
described in the Energy/Carbon chapter of this report.<br />
<strong>The</strong> Commission has urged the <strong>MTA</strong> to accelerate its<br />
building energy retrofits in conjunction with the NYPA,<br />
recommending that <strong>MTA</strong> set a goal of reevaluating the<br />
energy-efficiency potential of 100 percent of major <strong>MTA</strong><br />
facilities every 10 years. <strong>The</strong> retrofits entail ongoing green<br />
enhancements, such as high-efficiency lighting systems,<br />
boilers, and HVAC systems. In addition, the <strong>MTA</strong> has a<br />
number of green innovations for its existing facilities in<br />
various stages of planning, including high-performance<br />
roofs (vegetated “green” roofs, white roofs, and rainwaterretentive<br />
“blue” roofs) and other rainwater capture systems,<br />
solar panels, motion-activated escalators, groundwater thermal<br />
exchange systems, and more. Greener building maintenance<br />
should become standard operating procedure and would<br />
complement the initiatives described in the Energy/Carbon,<br />
Materials Flow, and Water Management chapters of this report.<br />
In light of the current financial climate, the Commission<br />
looked carefully at costs and potential savings in green<br />
building design. Its survey showed that LEED buildings<br />
can achieve operating cost savings as great as 9 percent<br />
annually, often enough to absorb their somewhat higher<br />
project contracting costs within a reasonable payback period.<br />
Upfront capital costs for LEED buildings can vary widely,<br />
depending on the project and the level of LEED attainment<br />
sought, according to King County <strong>Metro</strong> <strong>Transit</strong> in<br />
Washington State and Los Angeles County <strong>MTA</strong>, two<br />
transit agencies with experience building LEED facilities.<br />
<strong>The</strong>y estimate that it can cost little or nothing extra for<br />
projects to attain LEED certification and as much as 25 percent<br />
extra to attain LEED Platinum. Los Angeles <strong>MTA</strong> also<br />
found that some building projects could move up from LEED<br />
certified to a higher LEED rating at little or no added cost.<br />
To realize the full value of green design, the Commission<br />
has also recommended that the <strong>MTA</strong> adopt a Lifecycle<br />
Analysis (LCA) system for buildings, like the one described<br />
in the Materials Flow chapter of this report. Building design<br />
and maintenance can also benefit from the Sustainable<br />
Return on Investment (SROI) model presented in the<br />
<strong>Transit</strong>’s Triple Bottom Line chapter.
“People often ask me ‘What makes a building green?’<br />
And I always answer, It’s not one big thing, it’s hundreds of little things.’ ”<br />
– Robert F. Fox Jr., AIA, LEED AP, Partner Cook+Fox Architects<br />
Chair, Facilities Group<br />
Cavern Stations, which are mined within bedrock, represent a number<br />
of opportunities for sustainable design on the new Second Avenue Subway.<br />
27
28<br />
LEED Certification<br />
<strong>The</strong> green building movement has generated a revolution in new criteria<br />
for measuring energy consumption, emissions, and other sustainability<br />
factors. <strong>The</strong> prime mover in this revolution is the 10,000-member U.S.<br />
Green Building Council (USGBC), a nonprofit organization of architects,<br />
builders, and organizations, including the <strong>MTA</strong>. <strong>The</strong> USGBC's Leadership<br />
in Energy and Environmental Design (LEED) certification is "a national<br />
rating system for developing high-performance, sustainable buildings."<br />
<strong>The</strong> council currently promulgates eight LEED rating systems for different<br />
types of construction, including standards for upgrading existing buildings.<br />
More on LEED standards can be found at www.usgbc.org.<br />
Green Design and ROI<br />
<strong>The</strong> Corona Yard Maintenance Facility, which opened in 2007, earned the <strong>MTA</strong>’s first full<br />
LEED certification from the U.S. Green Building Council.<br />
Both government and private sector analysis indicate significant energy and operating savings from green buildings, often enough to cover any extra costs. LEED buildings tend to have<br />
8 percent to 9 percent lower operating costs. <strong>The</strong> New Building Institute in a March 2008 study showed that the median Energy Usage Intensity (EUI) for 121 LEED-EB certified buildings<br />
was 69 kBTU/sq ft, 24 percent lower than the national average for commercial buildings, according to the Commercial Buildings Energy Consumption Survey (CBECS). <strong>The</strong> same study<br />
showed EUI for Gold and Platinum certified buildings was 50 percent lower EUI than the national average. In a study of 12 green buildings, the General Services Administration found that<br />
the buildings used 26 percent less energy than average, had 13 percent lower operating costs, emitted 33 percent less CO2, and had 27 percent higher customer satisfaction.<br />
<strong>Greening</strong> the Second Avenue Subway: Cut-and-Cover Stations<br />
Respond-to-Demand<br />
Escalator/Equipment<br />
Sound Absorbtion<br />
Heat Extraction<br />
Considered Recycled<br />
Plastic Railroad Ties<br />
Center Platform to Reduce Total<br />
Station Volume<br />
Economic Modular<br />
Construction<br />
Regenerative Braking<br />
Technology<br />
Cut-and-cover stations on the new Second Avenue Subway – trenched out from grade – incorporate a number of sustainable design elements.
<strong>MTA</strong> Facilities: A Small Sample<br />
Vehicular Tunnels<br />
MNR Car Repair Shops<br />
MNR Signal Power Generating Stations<br />
Vehicular Bridges<br />
MNR Train Yards<br />
Subway Rail Yards<br />
Subway Signal Towers<br />
Bus Depots<br />
MNR Traction Substations<br />
MNR Stations<br />
LIRR Stations<br />
Subway Fan Plants<br />
Underground Subway Stations<br />
Subway Power Substations<br />
Above-ground Subway Stations<br />
Subway Pump Rooms<br />
Subway Circuit Breaker Houses<br />
Greener and Grander<br />
BASELINE<br />
<strong>The</strong> <strong>MTA</strong> facility portfolio encompasses thousands of structures, from fan plants to office towers. This chart illustrates the<br />
diversity and quantity of just a few building types.<br />
0 50 100 150 200 250 300 350<br />
<strong>The</strong> <strong>MTA</strong>’s Grand Central Terminal is one of the world’s most magnificent train stations, glittering with hundreds of the city’s earliest electrical chandeliers. To help sustain this landmark<br />
in a low-carbon economy, the <strong>MTA</strong> has replaced over 1,700 light bulbs in interiors and tunnels with compact fluorescent bulbs (CFLs). <strong>The</strong> CFLs save more than 100,000<br />
kilowatt hours and over $100,000 annually. Because CFLs last approximately 7,500 to 10,000<br />
hours, up to ten times longer than incandescent bulbs, they also save the <strong>MTA</strong> thousands of dollars in<br />
replacement and labor costs.<br />
29
30<br />
TRANSFORMATIONAL RECOMMENDATIONS<br />
Recommendation 1. Adopt LEED Silver Standards for All Applicable <strong>MTA</strong> Buildings<br />
Expanding on the green innovations of its LEED-certified Corona Maintenance Shop and other recent projects, the <strong>MTA</strong><br />
should pioneer high-performance designs for all of its system facilities. To this end, the Commission urges that the <strong>MTA</strong><br />
adopt LEED Silver standards or higher for all new building projects, new construction, and major renovations wherever<br />
applicable. And the <strong>MTA</strong> should either recommission existing buildings or pursue certifications as LEED Existing Buildings:<br />
Operations and Maintenance (LEED-EB) where possible. For existing facilities, the <strong>MTA</strong> should determine which buildings<br />
can be adapted to the LEED-EB criteria and then pursue recommissioning according to a prioritized schedule.<br />
Recommendation 2. Develop New Green Design Standards for <strong>Transit</strong> Facilities<br />
Since the current LEED categories do not cover transit-specific infrastructure, such as stations, electrical substations, and<br />
pump rooms, the <strong>MTA</strong> should develop its own green building guidelines for facility design and renovation. <strong>The</strong> <strong>MTA</strong> Green<br />
Building Guidelines should be drafted in consultation with the USGBC and offered as a model for transit agencies nationwide.<br />
<strong>The</strong> <strong>MTA</strong> should then propose that the guidelines form the basis of a new LEED for <strong>Transit</strong> standard for transit facilities not<br />
covered by existing LEED programs, thus disseminating the standards through an independent auditing organization. An<br />
outline of the <strong>MTA</strong> Green Building Guidelines is shown later in this chapter with a full version to be available afterward on<br />
the <strong>MTA</strong> website at www.mta.info/environment.<br />
Recommendation 3. Intensify Green Renovations and Renewable Energy Sources at Existing <strong>MTA</strong> Facilities<br />
Where existing facilities cannot be readily brought into LEED-EB compliance, the <strong>MTA</strong> should expand its program of energy<br />
retrofits and building recommissionings. For energy audits, the <strong>MTA</strong> should set a goal of completing NYPA retrofits to<br />
reevaluate 100 percent of major <strong>MTA</strong> facilities every 10 years. For recommissionings, the <strong>MTA</strong> should classify all of its<br />
major facilities by age, system operations, and other factors to determine which can be recommissioned for optimal efficiency.<br />
As part of its facilities review, the <strong>MTA</strong> should plan to increase the percentage of its energy base load generated<br />
by on-site, renewable sources, both to reduce the carbon footprint of its building portfolio and as a hedge against rising<br />
energy costs and power failures. Specific technologies proven to have quick payback, such as high-efficiency lighting and<br />
motion-sensor based controls, should be fast-tracked for implementation while the comprehensive Facility Database and<br />
Recommissioning schedule is finalized.<br />
Recommendation 4. Adopt Green Lifecycle Analysis for <strong>MTA</strong> Buildings<br />
<strong>The</strong> Commission recommends that the <strong>MTA</strong> adopt a form of green Lifecycle Analysis (LCA) to track the upfront costs and<br />
long-term savings from high-performance design features – the same type of LCA process recommended in the Materials<br />
Flow chapter of this report. LCA will support the previous recommendations by identifying and justifying long-term savings in<br />
new building designs, in renewable on-site energy sources and in the renovation and recommissioning of existing structures.<br />
Green Ideas from <strong>MTA</strong> Employees<br />
“A predictive maintenance<br />
program using infrared<br />
thermography can help find<br />
incipient electrical problems<br />
before they affect operations.<br />
This can help reduce<br />
energy waste, save on maintenance costs and<br />
increase safety.”<br />
– Anthony Salamone, <strong>Metro</strong>-North Railroad<br />
Right: This is an example of how a LEED standard<br />
(LEED 2009 for New Construction) is being adapted<br />
for use in the <strong>MTA</strong> Green Building Guidelines. This<br />
example illustrates how some, but not all, LEED criteria<br />
are applicable to <strong>MTA</strong> substations. It also includes<br />
examples of <strong>MTA</strong>-specific environmental criteria<br />
that will be used in the facility design process.
<strong>MTA</strong> Green Building Guidelines New Construction/Major Renovation<br />
Project Scorecard for Substations – Selected Credits<br />
Sustainable Sites<br />
Substations Applicable<br />
Prereq 1 Construction Activity Pollution Prevention Yes<br />
Credit 1 Site Selection Yes<br />
Credit 2 Development Density & Comm Connectivity No<br />
Credit 4.2 Alt Transportation – Bicycle Storage No<br />
Credit 4.4 Alt Transportation – Parking Capacity No<br />
Credit 5.2 Site Development, Maximize Open Space Yes<br />
Credit 6.1 Stormwater Design, Quantity Control Yes<br />
Credit 7.1 Heat Island Effect, Non-Roof No<br />
Credit 8<br />
Water Efficiency<br />
Light Pollution Reduction Yes<br />
Prereq 1 Water Use Reduction, 20% Reduction Yes<br />
Credit 3<br />
Energy & Atmosphere<br />
Water Use Reduction No<br />
Prereq 1 Fundamental Commissioning of Bldg Energy Systems Yes<br />
Prereq 2 Minimum Energy Performance: 10% NC/5% EB Yes<br />
Prereq 3 Fundamental Refrigerant Management Yes<br />
Credit 1 Optimize Energy Performance No<br />
Credit 2 On-Site Renewable Energy No<br />
Credit 3 Enhanced Commissioning Yes<br />
Credit 6<br />
Materials & Resources<br />
Green Power Yes<br />
Prereq 1 Storage & Collection of Recyclables Yes<br />
Credit 1 Building Reuse Yes<br />
Credit 2.1 Construction Waste Management, Divert 50% from Disposal Yes<br />
Credit 3.1 Materials Reuse, 5% Yes<br />
Credit 4.1 Recycled Content, 10% (post-consumer + 1/2 pre-consumer) No<br />
Credit 5.1 Regional Materials, 10% Extracted/Processed/Manufactured Yes<br />
Credit 6 Rapidly Renewable Materials No<br />
Credit 7 Certified Wood No<br />
Environmental Quality — Indoor/Outdoor<br />
Prereq 1 Minimum IAQ Performance Yes<br />
Prereq 2 ETS Control Yes<br />
Credit 1 Outdoor Air Delivery Monitoring Yes<br />
Credit 2 Increased Ventilation Yes<br />
Credit 3.1 Construction IAQ Management Plan, During Construction Yes<br />
Credit 3.2 Construction IAQ Management Plan, Before Occupancy Yes<br />
Credit 4.1 Low-Emitting Materials, Adhesives & Sealants Yes<br />
Credit 4.3 Low-Emitting Materials, Flooring Systems No<br />
Credit 5 Indoor Chemical & Pollutant Source Control Yes<br />
Credit 8.1<br />
<strong>MTA</strong> Credits<br />
Daylight & Views, Daylight 75% of Spaces No<br />
Credit 1.1 Security Yes<br />
Credit 1.2 Noise & Vibration Yes<br />
Credit 1.3 Maintenance of <strong>Transit</strong> Operations Yes<br />
Credit 1.4 Visibility/Visual Design Excellence Yes<br />
31
32<br />
NEAR-TERM RECOMMENDATIONS<br />
Recommendation 1. Increase the Number of LEED Accredited Employees<br />
<strong>The</strong> <strong>MTA</strong> should aggressively increase the number of LEED-accredited employees, and require 90 percent of new hires<br />
to be LEED Accredited Professionals (AP) for facilities design positions. <strong>The</strong> <strong>MTA</strong> should provide support for employees<br />
preparing for the LEED examination and provide appropriate green training for current employees.<br />
Recommendation 2. Seek LEED-EB Rating for Grand Central Terminal<br />
<strong>The</strong> <strong>MTA</strong> should pursue LEED-EB certification for Grand Central Terminal. <strong>The</strong> greening of <strong>MTA</strong>’s highest-profile facility<br />
would provide useful lessons for other agency facility projects and serve an important role in educating the public about<br />
green buildings and <strong>MTA</strong>’s sustainability efforts.<br />
Recommendation 3. Accelerate the Use of Green Roofs and High-Performance Roofs<br />
Given the extensive square footage of its building portfolio, the <strong>MTA</strong> should assess the feasibility of green roofs, white<br />
roofs, rooftop renewable energy generation, and other high-performance roof designs across all of its existing facilities.<br />
Recommendation 4. Form an All-Agencies Green Team<br />
<strong>The</strong> Commission recommends that the <strong>MTA</strong> create an All-Agencies Green Team to oversee the final development<br />
and implementation of the <strong>MTA</strong> Green Building Guidelines. <strong>The</strong> Green Team will also coordinate the development and<br />
promotion of the <strong>MTA</strong>’s other sustainability initiatives.<br />
ACHIEVEMENTS TO DATE<br />
Since launching its five-year capital plans in 1980, the <strong>MTA</strong> has steadily upgraded the energy performance of its new and<br />
existing buildings. <strong>The</strong> ongoing energy retrofits described in the Energy/Carbon chapter will result in <strong>MTA</strong> energy savings<br />
of greater than 78,000 megawatt hours (approximately $9.4 million) per year by 2010. Many facility rehabilitation plans<br />
now include high-performance roofs, energy management systems, and other green features. Among the <strong>MTA</strong> facilities<br />
that have pioneered innovative green designs are the following:<br />
• <strong>The</strong> NYCT Corona Yard Maintenance Shop, North America’s first LEED-certified transit facility, featuring natural ventilation<br />
and lighting, recycled train wash water, a rainwater capture system, photovoltaic cells, a fuel cell, and heat recovery units.<br />
•<strong>The</strong> Coney Island-Stilwell Avenue Terminal, featuring interior day lighting and a majestic station canopy integrating the<br />
largest building-integrated photovoltaic (BIPV) installation in any transit station, generating 250 kW of clean power.<br />
• <strong>The</strong> Roosevelt Avenue-74th Street Station, Queens, produces 65 kW of power using two PV systems: a conventional<br />
system is on the roof; the second system, comprised of thin-film solar panels, is mounted to the metal standing seam<br />
canopy on the elevated subway platform.<br />
• <strong>The</strong> Gun Hill Bus Depot, the first NYCT depot to use solar panels, draws 40 percent of the facility’s power from photovoltaic<br />
cells, making it one of the largest PV facilities on the East Coast.<br />
• For more facts on <strong>MTA</strong>’s recent state-of-the-art facilities, visit www.mta.info.<br />
Right: <strong>The</strong> fuel cell at the Corona Car Maintenance Facility converts<br />
hydrogen and oxygen into electricity and heat to save energy.
"Today's housing, financial, and energy crises<br />
all create an extraordinary opportunity and a vital imperative.<br />
We must build the next generation of homes and businesses within<br />
walking distances of train and bus stations, all equipped with solar<br />
energy, green design, and bicycle-friendly facilities that reduce carbon<br />
emissions and protect us from the impacts of climate change.<br />
<strong>The</strong> <strong>MTA</strong> and Governor Paterson, in partnership with the Obama<br />
Administration, must seize the moment to create jobs, revitalize the<br />
economy and ensure a sustainable future for all New Yorkers."<br />
– Ned Sullivan, president, Scenic Hudson<br />
Chair, Smart Growth/TOD Group<br />
34
Smart Growth/TOD<br />
Land use planning, transit access, and transit-oriented development<br />
Smart growth and transit-oriented development (TOD) go<br />
to the heart of the <strong>MTA</strong>’s mission. <strong>The</strong>y also represent the<br />
<strong>MTA</strong>’s greatest contribution to regional sustainability. By<br />
expanding the reach and deepening the localization of its<br />
transit network, the <strong>MTA</strong> reduces the fossil-fuel consumption<br />
and the carbon footprint of the entire region. By enabling<br />
more clustered, transit-rich development, the <strong>MTA</strong> helps<br />
to mitigate the underlying causes of global warming while<br />
promoting more livable, sustainable communities.<br />
Emerging trends make this the right time for the <strong>MTA</strong> to<br />
redouble its TOD efforts. <strong>The</strong> <strong>MTA</strong>’s “Strategic Regional<br />
Review” projects a population increase in the service area<br />
of over 4 million by 2030. <strong>The</strong> Commission urges that the<br />
<strong>MTA</strong> work diligently with communities, developers, and<br />
government officials to direct this growth away from autodependent<br />
sprawl toward transit-centered development.<br />
<strong>The</strong> <strong>MTA</strong> should seek to capture two-thirds of this new<br />
growth. That is, the <strong>MTA</strong> transit network should strive to<br />
attract two-thirds of the additional vehicles miles traveled<br />
(VMTs) due to new growth between now and 2030; and<br />
the <strong>MTA</strong> should encourage public and private planners to<br />
cluster two-thirds of the new development within a quartermile<br />
to a half-mile of <strong>MTA</strong> transit access.<br />
Recessionary economic trends also argue for expanded<br />
TOD initiatives. <strong>The</strong> Commission recommends that the<br />
<strong>MTA</strong> strengthen all efforts to promote the environmental,<br />
economic, and lifestyle benefits of transit access to local<br />
communities, developers, legislators, and officials. Numerous<br />
studies, including those cited in this report, prove the positive<br />
correlation between TOD and property values. Local transit<br />
access widens employment opportunities, links commercial<br />
centers, reduces family fuel bills and helps create the livable,<br />
walkable communities that homebuyers increasingly seek.<br />
<strong>The</strong> Commission sees a prime opportunity for the <strong>MTA</strong><br />
to take ownership of what many refer to as the “last mile”<br />
problem. <strong>The</strong> <strong>MTA</strong> should apply its resources and regional<br />
overview to eliminate the remaining home-to-destination<br />
gaps in the regional transit network through feeder/distributor<br />
corridors, which includes feeder service (home to station),<br />
distributor service (station to employment centers), lightrail,<br />
bus rapid transit, shuttle service, bike routes and bike<br />
facilities, and other transit modes.<br />
Left: <strong>Metro</strong>-North is leading the Be in Beacon project that is<br />
encouraging transit oriented development near Beacon Station<br />
through a partnership with the State of New York, Dutchess County,<br />
the City of Beacon, and other stakeholders<br />
Public policy trends also look favorable for expanded<br />
Smart Growth and TOD initiatives. From the Obama<br />
Administration to state and local governments, a renewed<br />
emphasis on economic stimulus, infrastructure, and sustainability<br />
all play to the <strong>MTA</strong>’s strengths. In pursuing TOD<br />
projects with public officials and local stakeholders, the<br />
<strong>MTA</strong> brings many powerful tools and incentives to the<br />
table. <strong>The</strong> <strong>MTA</strong> now has a portfolio of successful TOD<br />
projects, extending from New York City boroughs to Long<br />
Island suburbs and Hudson Valley communities. All involve<br />
successful, long-term collaborations with multiple stakeholders.<br />
Examples include recent partnerships in Yonkers,<br />
Tarrytown, Beacon, Hudson Yards, the Atlantic Avenue hub,<br />
and TODs and downtown revitalizations with several Long<br />
Island communities.<br />
Given these trends, the Commission sees excellent opportunities<br />
for the <strong>MTA</strong> to leverage the proven economic, environmental,<br />
and lifestyle values of transit-oriented development<br />
through federal, state, and local partnerships.<br />
GHGs Per Person<br />
Kg CO 2 Equivalents/year<br />
Average In-town House Outperforms<br />
Even the Greenest Sprawl House with Hybrid Cars<br />
Million BTU per year<br />
10000<br />
8000<br />
6000<br />
4000<br />
2000<br />
250<br />
200<br />
150<br />
100<br />
50<br />
0<br />
0<br />
114<br />
125<br />
Suburban Single<br />
Family<br />
239 MBTU<br />
8,637<br />
Low Density High Density<br />
Transportation Buliding Operations Materials<br />
Suburban Single<br />
Family<br />
Green 158 MBTU<br />
Household Use<br />
71<br />
87<br />
3,341<br />
101<br />
35<br />
Urban Single<br />
Family<br />
136 MBTU<br />
Transportation Use<br />
Source: Journal of Urban Planning and<br />
Development, Norman, March 2006<br />
56<br />
26<br />
Urban Multi-<br />
Family<br />
Green 82 MBTU<br />
Source: Jonathan Rose Companies, LLC<br />
35
36<br />
Smart Growth<br />
For half a century the U.S. enthusiastically built up its automobile infrastructure. Today we are choking on our success. Decades of auto growth and transit disinvestment have produced oil<br />
dependency, global warming, infrastructure strains, and regional sprawl. Smart Growth is the name given to a nationwide response by urban planners, architects, developers, communities,<br />
environmentalists, and grassroots organizations. It seeks to freeze sprawl through concentrated, pedestrian-friendly development. Groups like Smart Growth America measure “sprawl effects”<br />
using systematic variables. By planning more compact, mixed-use environments with green space and transit links, Smart Growth increases economic viability while decreasing a region’s<br />
energy use and ecological impact. It also encourages more livable towns and cities. For many areas of the country Smart Growth means <strong>Transit</strong> Oriented Development (TOD), with a focus<br />
on pedestrian and bike-friendly transit access, downtown revitalization, and community links. See additional information on Smart Growth at www.smartgrowthamerica.org and at www.reconnectingamerica.org.<br />
BASELINE<br />
<strong>The</strong> <strong>MTA</strong> system covers a 5,000-square-mile area fanning out from New York City through Long Island, southeastern<br />
New York State, and southwestern Connecticut with approximately 15 million residents. <strong>The</strong> metropolitan region<br />
contains varied geography and nearly every type of development pattern, from some of the world’s highest density,<br />
mixed-use development in the center of Manhattan to nearby suburbs, small towns along the Hudson, Long Island<br />
and Connecticut suburbs, and dispersed housing in upstate New York and Connecticut. Within this service area, the<br />
<strong>MTA</strong> system provides some 8.5 million passenger trips daily, removing an estimated 3 million automobiles from the<br />
roads each day. More information on the <strong>MTA</strong> region and related topics may be found at www.mta.info.<br />
Comparison of Daily Vehicle Miles Traveled (VMT) Per Capita In Large U.S. Cities*<br />
Daily Vehicle Miles Traveled Per Capita<br />
Vehicle Miles Traveled<br />
25<br />
23<br />
21<br />
19<br />
17<br />
15<br />
13<br />
1990 1991 1992 1993 1994 1995 1996 1997 1998 1999 2000 2001 2002 2003 2004 2005 2006<br />
Los Angeles, CA<br />
San Francisco-<br />
Oakland, CA<br />
Phoenix, AZ<br />
Chicago-Northwestern, IN<br />
Portland-Vancouver<br />
New York-Northeastern, NJ<br />
New York (subset of Newark*)<br />
Due to the high-density, transit-based development in the New York metropolitan area, New York City has the lowest<br />
(most favorable) vehicle miles travelled (VMT) of all large U.S. cities.<br />
*U.S. Federal Highway Administration, Highway Statistics, Table HM-72, "Urban Areas-Selected Characteristics," 1990-2006 and HPMS Historical Data Spreadsheet, NY DOT<br />
and Annual Estimates of Resident Population US, NYS and Counties April 1, 2000-July 1, 2007.
TRANSFORMATIONAL RECOMMENDATIONS<br />
Recommendation 1. Capture Two-Thirds of Additional<br />
Vehicle Miles Traveled (VMT) in the <strong>MTA</strong> Region<br />
<strong>The</strong> <strong>MTA</strong> should work collaboratively with New York State,<br />
Connecticut, counties, cities, local communities, and other<br />
partners throughout its service region to create the conditions<br />
that will enable the <strong>MTA</strong> to capture two-thirds of all<br />
additional vehicle-miles traveled (VMT) between 2009<br />
and 2030. <strong>The</strong>se additional trips would be taken on the<br />
<strong>MTA</strong>’s transit network rather than on the metropolitan road<br />
network. <strong>The</strong> <strong>MTA</strong> should identify and research the best<br />
practices that will advance this goal. Clustering residential<br />
and commercial development around the <strong>MTA</strong> network will<br />
not only achieve environmental benefits, it will also expand<br />
the lifestyle choices of residents and newcomers. <strong>The</strong> <strong>MTA</strong>,<br />
in collaboration with its governmental and local partners,<br />
should work to create communities that reduce automobile<br />
usage, encourage pedestrian and bicycle travel, and enable<br />
the development of households and businesses with lighter<br />
environmental footprints.<br />
Recommendation 2. Cluster Two-Thirds of New Development Near <strong>MTA</strong> Access<br />
<strong>The</strong> <strong>MTA</strong>, in collaboration with New York State, New York City, the State of Connecticut, suburban counties, and local<br />
communities, should encourage the clustering of two-thirds of new residential and commercial development in its service<br />
region within a quarter-mile to a half-mile of <strong>MTA</strong> network access. <strong>The</strong> <strong>MTA</strong> should employ its geographic reach, influence,<br />
and expertise to assist communities in establishing greener land-use patterns throughout its service area. Eliminating gaps<br />
between residential areas and the transit network will allow the <strong>MTA</strong> to “capture” additional regional development. Acting<br />
as a consultant to local communities, the <strong>MTA</strong> should identify routes for station feeder systems, identify links between<br />
transit, residential neighborhoods, and employment centers, and improve synchronization of bus and rail schedules to<br />
optimize transit access.<br />
A Look at the California Model: SB 375<br />
<strong>The</strong> Two-Thirds Target For Greener Regional Growth<br />
<strong>The</strong> <strong>MTA</strong>’s greatest contribution to sustainability comes directly through the<br />
“mode shift” from single-passenger automobile traffic to rapid transit. This<br />
shift, in turn, brings a significant net decrease in regional greenhouse gas<br />
emissions and other air pollutants through denser development that allows<br />
pedestrian, bicycle, and other non-automotive travel, while also reducing<br />
traffic congestion. For the <strong>MTA</strong> the most effective way to promote this mode<br />
shift is by capturing shares of new growth, both in increased commuting and<br />
in green community development. For that reason, the Commission recommends<br />
that the <strong>MTA</strong> seek to capture two-thirds of all new growth in both categories<br />
by 2030. That means capturing two-thirds of the additional vehicle<br />
miles traveled (VMTs) in the <strong>MTA</strong> service area between now and 2030. It<br />
also means working with public and private partners. <strong>The</strong> <strong>MTA</strong> should foster<br />
conditions so that two-thirds of all new development through 2030 is within<br />
a quarter-mile to a half-mile of <strong>MTA</strong> bus or rail stations.<br />
Few ideas make as much “green sense” as smarter links between transportation and land development. That’s the aim of California’s new SB 375. <strong>The</strong> law provides incentives<br />
for development patterns that reduce driving and GHGs. It builds on existing law that requires all regional transportation plans to include a development plan. It then<br />
uses that development plan to achieve regional GHG reduction targets set by the region’s air quality regulatory agency, the California Air Resources Board (CARB).<br />
<strong>The</strong> law requires CARB to set regional GHG reduction targets. It then adds new smart growth incentives to the Regional Transportation Plan (RTP); new land use policies to<br />
decisions that implement a Sustainable Communities Strategy, new modeling provisions to account for the transportation impacts of land use decisions, and a new provision<br />
for determining the regional housing needs consistent with the Sustainable Communities Strategy.<br />
Recommendation 3. Position and Promote <strong>Transit</strong> as a Climate-Stabilization Strategy<br />
While the role of energy-efficiency and renewable-energy sources in reducing GHGs is now widely understood, the<br />
powerful greening effect of transit systems is not. <strong>Transit</strong> dramatically reduces GHGs by reducing automobile VMTs and<br />
promoting more clustered residential and commercial development. <strong>The</strong> <strong>MTA</strong>, in collaboration with the American Pubic<br />
Transportation Association (APTA), should intensify its efforts to educate legislators, regulators, industry leaders, and the<br />
public on the role of a major transit system like the <strong>MTA</strong> as a leading climate stabilizer – what experts call a climatestabilization<br />
wedge.<br />
37
38<br />
Recommendation 4. Take Ownership of the “Last Mile” Conundrum<br />
Using its unique overview of regional transportation, the <strong>MTA</strong> should take the lead in closing the “last mile” transportation<br />
gap between residential locations and final rider destinations. <strong>The</strong> <strong>MTA</strong> should help localities identify more feeder/distributor<br />
corridors linking homes to transit hubs through feeder service (home to station), distributor service (station to employment<br />
centers), light-rail, bus rapid transit, shuttle service, bike routes, and other transit modes. An opportunity to demonstrate<br />
this exists in establishing a pubic transportation link between <strong>Metro</strong>-North Railroad’s Port Jervis line, Stewart Airport,<br />
downtown Newburgh, and the City of Beacon’s waterfront and train station. Successful <strong>MTA</strong> network examples of this<br />
include <strong>Metro</strong>-North Railroad’s Hudson Rail Link feeders/ferries and a station-based rental car program. Examples at<br />
Long Island Railroad include synergies with <strong>MTA</strong> Bus at the Mineola Intermodal Center and elsewhere.<br />
Recommendation 5. Link Land Use and <strong>Transit</strong> Funding through State Policy and Legislation<br />
<strong>The</strong> Commission sees an overwhelming need and opportunity for state policy and legislation that links land use and<br />
transportation. <strong>The</strong> <strong>MTA</strong> should work diligently with New York State to implement policy and enact legislation similar to<br />
the recently passed California SB 375. Such policy and legislation will reduce GHGs in New York State by directly linking<br />
commercial and residential development with air quality goals and transportation resources.<br />
NEAR-TERM RECOMMENDATIONS<br />
Recommendation 1. Support TODs and Increase Trip Capture through System Extensions<br />
<strong>The</strong> <strong>MTA</strong> should work with state and local partners to expand access with intermodal transportation services, including<br />
such options as feeder service (home to station), distributor service (station to employment centers), light-rail, bus rapid<br />
transit, shuttle service, bike routes, and other transit modes. <strong>The</strong> Commission recommends that the <strong>MTA</strong> examine the<br />
potential benefits of increasing service on currently underutilized rail lines and of establishing bus rapid transit which can<br />
feed into TODs or station hubs. Examples are listed below by way of illustration. <strong>The</strong> following list provides a guide to<br />
assets in the <strong>MTA</strong> region that could be used to pursue smart growth and TOD.<br />
Possible TOD and Smart Growth Initiatives<br />
• Reactivation of the Maybrook Branch, which connects the <strong>Metro</strong>-North stations of Beacon (Hudson line), Brewster<br />
(Harlem line), and Danbury (New Haven line)<br />
• Extension of <strong>Metro</strong>-North’s Port Jervis line to Stewart Airport, downtown Newburgh, and Beacon<br />
• Integration of public transit components in plans for the Tappan Zee Corridor along with TODs in the corridor (BRT, LRT,<br />
and a <strong>Metro</strong>-North line)<br />
• Integration of public transit components into the Nassau Hub project, including the examination of a reactivation of the<br />
Long Island Rail Road Garden City spur into the hub<br />
• Integration of public transit components into the Pilgrim State project<br />
• Construction of the third track on the Long Island Rail Road’s Main Line<br />
• Construction of double track from Farmingdale to Ronkonkoma on the Long Island Rail Road’s Main Line<br />
• Construction of double track on the Port Jervis line and the expansion of the line’s rail yard facilities west of the Hudson River<br />
• Establishment of a green bus feeder corridor connecting Beacon Station to Main Street, Beacon, and other key TOD locations<br />
• Establishment of a ferry service from Glen Cove to Manhattan<br />
• Establishment of Bus Rapid <strong>Transit</strong> (BRT) corridors in all <strong>MTA</strong> sub-regions – New York City, Long Island,<br />
Westchester/Putnam/Dutchess counties, Rockland/Orange counties, and Connecticut. Potential BRTs could include:<br />
Nassau Hub (Nassau County), Route 110 corridor (Suffolk County), Central Avenue (Westchester County), Hylan Boulevard<br />
(Staten Island-Brooklyn), Nostrand Avenue (Brooklyn), 21st Street (Queens), and Greenwich-Norwalk (Connecticut)<br />
• Establishment of Greenport to Riverhead (Long Island) BRT<br />
• Reactivation of the Staten Island North Shore line (rail or BRT)<br />
• Reactivation of the West Shore line in Orange and Rockland counties
<strong>The</strong> Commission recommends that the <strong>MTA</strong> agencies make a thorough examination of underutilized capacity throughout<br />
the network to identify potential projects and investments that could eliminate choke points and increase capacity.<br />
Recommendation 2. Develop a Systemwide TOD Program<br />
<strong>The</strong> <strong>MTA</strong> should develop a systemwide TOD program that articulates the principles and guidelines for TOD project<br />
development and should assist communities, developers and stakeholders throughout the region in planning these<br />
community-based initiatives. <strong>The</strong> program should proactively identify current and potential sites for TOD planning and<br />
development with smart-growth initiatives throughout the <strong>MTA</strong> service region. Each agency must be provided the funding<br />
and resources to advance this project. NYCT and Long Island Rail Road should develop in-house smart growth/TOD units.<br />
Recommendation 3. Ensure Highest Standards of Sustainability<br />
<strong>The</strong> <strong>MTA</strong> should continue to work with communities, developers, and others to ensure that TODs meet the highest standards<br />
of sustainability with respect to energy and water conservation, building materials and project design, and mitigation of and<br />
adaptation to the anticipated effects of climate change.<br />
Recommendation 4. Develop a TOD Handbook<br />
<strong>The</strong> <strong>MTA</strong> should immediately develop a handbook and online guide to support and articulate the principles and guidelines<br />
of TOD project development. This document and online resource will provide information, guidance, and contact information<br />
that will assist local officials, developers, and stakeholders throughout the region in planning community-based TOD initiatives.<br />
This guidance will also lay out the expectations and/or requirements for TODs to meet high standards for green design and<br />
CO2 reduction goals, to adapt to the anticipated impacts of climate change, to use renewable energy, to recycle materials,<br />
and to access the full range of incentives available from NYS agencies such as NYSERDA.<br />
Recommendation 5. Work with the New York State Smart Growth Cabinet<br />
<strong>The</strong> <strong>MTA</strong> should work with Governor Paterson’s Smart Growth Cabinet to examine the TOD opportunities associated with<br />
all transportation projects under development, including the Tappan Zee Bridge/I–287 Corridor <strong>Mass</strong> <strong>Transit</strong> project, the<br />
Stewart Airport expansion, Long Island Rail Road’s Main Line Corridor Improvements, and East Side Access. <strong>The</strong> State and<br />
the <strong>MTA</strong> should collaborate to make available the capital necessary to enhance the viability of these projects. Additionally,<br />
more partnering between NYSDOT, the Empire State Development Corporation, and <strong>Metro</strong>-North Railroad/Long Island Rail<br />
Road will be essential to advance regional TODs.<br />
Together, the <strong>MTA</strong> and New York State should establish a process for providing the capital investments needed for<br />
<strong>MTA</strong>-supported TODs. <strong>The</strong>se can include structured parking, bike access, shuttle buses, and related facilities at or near<br />
transit stations that can facilitate TODs, non-auto station access, and enhanced transit usage. <strong>The</strong> following list provides<br />
some illustrations:<br />
Potential TODs in the <strong>MTA</strong> service region.<br />
• West-of-Hudson: <strong>Metro</strong>-North service area: Harriman, Middletown, Pearl River, Spring Valley, Nanuet, Owen Mills<br />
(in connection with Stewart Airport and downtown Newburgh)<br />
• East-of-Hudson: <strong>Metro</strong>-North service area: Beacon, Harrison, Tarrytown, Ossining, Croton Harmon, Cold Spring, Peekskill,<br />
Poughkeepsie, Purdy, Mount Vernon, Tenmile River<br />
• Connecticut: <strong>Metro</strong>-North service area: Stamford, Georgetown-Redding, West Haven, New Haven<br />
• Long Island Rail Road service area: Ronkonkoma, Port Jefferson, Stony Brook, Bellport, Hicksville, Farmingdale, Freeport,<br />
Central Islip, Hempstead, West Hempstead, Glen Cove, Flushing, Mineola, Huntington, Babylon<br />
• New York City service area: Morris Park, Sheepshead Bay, St. Albans, Williams Bridge, Station/Gun Hill Road, University<br />
Heights Station/Fordham Road, Mott Haven/E. 149th Street, Bedford Park Yards, Wakefield Station/E. 241st Street,<br />
Melrose Station/E. 162nd Street, Woodlawn Station/E. 233rd Street<br />
39
Recommendation 6. Increase Passenger Access at Stations<br />
To increase the capacity of train station parking lots, the <strong>MTA</strong> should expand the investment in parking programs and<br />
station access, adding spaces if possible, working closely with NYSDOT and NYS; the <strong>MTA</strong> should create more Park-and-<br />
Rides with feeder and connecting services. Incentivizing car pooling would also be beneficial, and the <strong>MTA</strong> should consider<br />
dedicating at least 5 to 10 percent of the best spaces for car-pool use only. Additionally, the <strong>MTA</strong> should consider the<br />
development of intermodal parking facilities at train stations. <strong>The</strong>se facilities will not only increase parking availability, they<br />
will coordinate transportation services, improve pedestrian/vehicular circulation and improve parking management. <strong>The</strong><br />
<strong>MTA</strong> should also review parking pricing as part of broader incentive strategies and expand facilities for those who want to<br />
bike to stations. Any investment in parking programs and station access should be part of a general strategy to discourage<br />
further sprawl.<br />
Recommendation 7. Improve the Integration of Stations into Communities<br />
<strong>The</strong> <strong>MTA</strong> should develop better integration of stations into the surrounding communities through improved facilities,<br />
bike and pedestrian access, and other station access plans. Train-to-trail linkages should be enhanced through collaboration<br />
with the New York State Office of Parks Recreation and Historic Preservation and local and regional organizations. <strong>The</strong><br />
<strong>MTA</strong> should explore a range of intermodal transportation services and links along <strong>MTA</strong> feeder corridors, including light<br />
rail, bus rapid transit, streetcars, bike facilities, and ferries. It should work with public or private partners to provide bus or<br />
other transit services linking stations to suburban villages or hamlets not on train lines, helping to increase more compact,<br />
efficient development.<br />
Recommendation 8. Support Bicycles as a <strong>Transit</strong> Link<br />
<strong>The</strong> <strong>MTA</strong> should play a prominent role in promoting cycling for commuters and recreational cyclists. <strong>The</strong> inclusion of<br />
bicycling as a mainstream mode of transportation has become a national objective, and the Commission recommends<br />
that it become a priority of the <strong>MTA</strong>.<br />
40<br />
Bicycles as a <strong>Transit</strong> Link<br />
To encourage and facilitate the use of bicycles as part of the <strong>MTA</strong><br />
passengers’ travel from point of origin to the final destination, the<br />
Working Group recommends that the <strong>MTA</strong>:<br />
• promote and facilitate bike parking at stations;<br />
• promote and facilitate bike transport on trains and buses;<br />
• promote and facilitate bike storage at <strong>MTA</strong> work sites;<br />
• provide consolidated and easily accessible bike information; and<br />
• act as an advocate and partner in promoting the use of bicycles<br />
as a sustainable link in urban and regional transit.<br />
See additional information on Biking as a <strong>Transit</strong> Link, prepared by<br />
Ned Sullivan, George Beane and the Smart Growth/TOD Working<br />
Group, in the Appendix of this report.<br />
<strong>MTA</strong> TA
TOD Case Study: NJ <strong>Transit</strong> Village Initiative<br />
<strong>The</strong> <strong>Transit</strong> Village Initiative (TVI) is a program sponsored by New Jersey<br />
<strong>Transit</strong> and the New Jersey Department of Transportation (NJDOT). It uses a<br />
smart-growth approach to redeveloping and revitalizing communities near<br />
transit facilities and making them more appealing places for people to live,<br />
work, and play, thereby reducing auto dependence and congestion and<br />
improving air quality. Under the TVI, municipalities must apply to a <strong>Transit</strong><br />
Village Task Force for <strong>Transit</strong> Village designation. Municipalities selected for<br />
<strong>Transit</strong> Village designation are those that have demonstrated a commitment<br />
to revitalizing and redeveloping the area around their transit facilities as a<br />
mixed-use neighborhood with a strong residential component. Much of the<br />
planning takes place prior to application. <strong>The</strong> <strong>Transit</strong> Village Task Force is<br />
comprised of 11 statewide agencies, including NJ <strong>Transit</strong> and NJDOT.<br />
Selections are made by the Task Force based upon a specific set of criteria,<br />
which includes:<br />
• A commitment for growth in jobs, housing, and transportation<br />
• A transit facility rail or light rail station, ferry terminal, a bus hub<br />
or bus transfer station<br />
• Vacant land and/or underutilized or deteriorated buildings within<br />
walking distance of transit where redevelopment can take place<br />
• An adopted land-use strategy (a redevelopment plan or zoning<br />
ordinance) for achieving compact, transit-supportive, mixed-use<br />
development within walking distance of transit<br />
• A strong residential component<br />
Ready-to-go projects:<br />
• Pedestrian and bicycle friendliness<br />
• <strong>Transit</strong> station as the focal point of the community, which can use<br />
its station plaza as a gathering place for community activities such as<br />
festivals, concerts, public ceremonies, and farmers’ markets<br />
• Station area is in a station area management plan, in a special<br />
improvement district (SID), or part of a Main Street New Jersey<br />
designation<br />
• Maximizing the appeal of transit through special features such as<br />
concierge service<br />
• Commuter parking for residents and non-residents<br />
• Support local arts and culture<br />
• Support the historic and architectural integrity of the community<br />
• Incorporate affordable housing<br />
<strong>The</strong> benefits of <strong>Transit</strong> Village designation include a commitment from the<br />
State of New Jersey to the municipality’s vision, coordination among the<br />
various state agencies that comprise the Task Force, priority funding from<br />
some state agencies, technical assistance, and eligibility for grants from<br />
NJDOT’s $1 million annual funding. Additional TOD Case Studies are located<br />
in the Appendix of this report.<br />
ACHIEVEMENTS TO DATE<br />
<strong>The</strong> <strong>MTA</strong> has a long history of investing in mixed-use development<br />
around transit stations – the most famous example being Grand<br />
Central Terminal, where the railroad created the swath of prime<br />
real estate along Park Avenue by leveraging the air rights over<br />
the terminal’s rail infrastructure – a model that the <strong>MTA</strong><br />
can continue to replicate today.<br />
A more contemporary example is the “Be in Beacon” project,<br />
a smart-growth partnership between <strong>Metro</strong>-North Railroad and<br />
the City of Beacon on the Hudson Line. <strong>The</strong> project arose out of<br />
collaboration between <strong>Metro</strong>-North, New York State, Beacon and<br />
20 other stakeholders, facilitated by the railroad. With its riverside<br />
setting and a burgeoning arts community, this waterfront town<br />
is undergoing a renaissance in which <strong>Metro</strong>-North is playing a<br />
key role. In October 2007, <strong>Metro</strong>-North issued a Request for<br />
Expressions of Interest (RFEI) relating to the “Be in Beacon” TOD<br />
projects, along with eco-friendly housing, riverfront development,<br />
and more. Other TOD projects in various stages of development<br />
by <strong>Metro</strong>-North or other partners include Harrison, Harriman,<br />
the Town of Amenia, Poughkeepsie, Mount Vernon, and several<br />
opportunities in the Bronx and suburban counties.<br />
<strong>The</strong> Long Island Rail Road has also extended its involvement in<br />
local smart-growth initiatives. Using a $25 million Federal <strong>Transit</strong><br />
Administration grant, the LIRR approached several townships with<br />
plans for intermodal projects. <strong>The</strong> result was a revitalization plan<br />
for Mineola centered on a new intermodal transit facility on the<br />
LIRR right-of-way – a short walk from the LIRR train station.<br />
Designed, scaled, and sited to enhance the downtown area, the<br />
facility earned several local smart-growth awards. <strong>The</strong> project<br />
also included plans for local business development, helping to<br />
concentrate growth around the LIRR station. In other projects,<br />
<strong>MTA</strong> and LIRR are working with officials from the Town of<br />
Brookhaven on a mixed-use, pedestrian-friendly commuting hub<br />
at the Ronkonkoma station. In addition, the <strong>MTA</strong> is partnering<br />
with the New York State Housing Finance Agency to identify<br />
TOD projects throughout Long Island, all aimed at concentrating<br />
future growth near rail and/or transit hubs.<br />
Other Current Initiatives at the <strong>MTA</strong><br />
At the instigation of the <strong>MTA</strong> and the Commission, the <strong>MTA</strong><br />
and Governor Paterson’s Smart Growth Cabinet have established<br />
a partnership and package of incentives to support TOD development.<br />
For additional Smart Growth/TOD information, see<br />
Appendices. Additionally, the <strong>MTA</strong> has established a single point<br />
of contact on its website www.mta.info/environment for communities<br />
in the <strong>MTA</strong> service area that express interest in Smart<br />
Growth/TOD projects.<br />
41
42<br />
Materials Flow<br />
<strong>Greening</strong> procurement, minimizing waste, and maximizing savings<br />
Given the scale and diversity of its operations, the <strong>MTA</strong><br />
must procure and dispose of thousands of tons of material<br />
goods each year. Collectively, the <strong>MTA</strong> agencies purchase<br />
some $2 billion worth of products and services annually<br />
in an operating budget of about $11 billion. In addition,<br />
the <strong>MTA</strong> must manage its customer-generated waste,<br />
process-generated waste, office waste, and construction<br />
and demolition debris. To improve its materials flow oversight,<br />
the <strong>MTA</strong> should link the procurement and disposal<br />
ends of its operations into a unified tracking process. It<br />
must then reduce both its intake of raw materials and its<br />
waste, reuse materials wherever possible, and recycle<br />
increasing percentages of the total flow.<br />
On the procurement end, the Commission sees new<br />
opportunities to integrate and expand the <strong>MTA</strong>’s existing<br />
green programs into a more unified system. <strong>The</strong> <strong>MTA</strong><br />
is in the process of developing an All-Agencies Green<br />
Procurement Action Plan for precisely such purposes.<br />
In addition to reducing waste at the front end, green<br />
procurements can achieve multiple aims. <strong>The</strong>se include<br />
screening toxins, reducing carbons in manufacturing and<br />
delivery, minimizing packaging, supporting green industries,<br />
services, and regional suppliers, and much more. In the<br />
bigger picture, green procurement also extends to the<br />
innovative materials used to lighten the <strong>MTA</strong> rolling stock<br />
or enhance green building designs and energy-efficient<br />
equipment, fixtures, and vehicles. To unify these multiple<br />
aims, the <strong>MTA</strong> should adopt a lifecycle analysis (LCA)<br />
process to help staff identify, price, and track sustainability<br />
value in agency purchasing decisions. Once implemented,<br />
these steps should ultimately produce sizeable savings.<br />
From a sustainability perspective, all procurements are<br />
future disposals. On the waste management and disposal<br />
end, the <strong>MTA</strong> already runs a variety of reclamation and<br />
recycling programs. <strong>The</strong>se range from green office policies<br />
and site-separation of station waste to <strong>MTA</strong> Capital<br />
Construction’s reuse of worksite construction materials<br />
and excavated soil. <strong>The</strong> Commission believes that the <strong>MTA</strong><br />
can capture more value at the disposal end, both through<br />
material reuse within the <strong>MTA</strong> and from salvage revenues.<br />
In a good economy, salvaged scrap at NYCT can generate<br />
some $3.7 million annually and the <strong>MTA</strong> should be able to<br />
tap emerging markets in scrap, oils, and organic waste energy<br />
for additional revenues. To manage its large volume of station<br />
waste, the <strong>MTA</strong> now uses both post-collection and sourceseparation<br />
recycling. <strong>The</strong> Commission recommends that<br />
wherever possible the <strong>MTA</strong> transition to source-separation<br />
bins, which have the added benefit of encouraging New<br />
Yorkers to recycle. Likewise, the <strong>MTA</strong> should take advantage<br />
of its wide public reach to promote recycling and other<br />
green habits among its customers and employees.<br />
Measuring, tracking, and greening a materials flow on the<br />
scale of the <strong>MTA</strong>’s is inevitably an ongoing task. To provide<br />
perspective, the Commission surveyed other transit agencies<br />
and extracted best practices for green procurements and<br />
disposals from two major agencies, London and Toronto,<br />
both comparable in function to the <strong>MTA</strong> and known for<br />
high environmental standards. <strong>The</strong> survey confirmed that<br />
the <strong>MTA</strong> currently equals the London and Toronto systems<br />
on many green practices and it identified some key areas<br />
for improvement. In transit agencies, as in all large organizations,<br />
what gets measured, gets managed. By better quantifying<br />
its materials flow, the <strong>MTA</strong> will have a powerful tool<br />
for reducing waste, adding revenues, and managing one of<br />
the 21st century’s most important sustainability issues.<br />
Scrap Commodity Management and Recycling<br />
New York City <strong>Transit</strong>’s Asset Recovery Unit manages a program that provides for<br />
the environmentally responsible recycling of all NYCT’s retired or obsolete buses.<br />
When buses are ready for retirement, they are sent to the Gershow Recycling<br />
Center in Medford, New York. At this center, <strong>MTA</strong> buses are first cut into pieces<br />
by giant industrial shears, and then placed on a conveyor belt leading up to a<br />
recycling machine. This recycling machine consists of 16 1,100 pound hammers<br />
which rotate on a drum and render the bus into silver-dollar size pieces of metal.<br />
As the crushed material travels on the conveyor belts, a series of magnets and<br />
vacuum lines separate the ferrous metal, which is later sold on the scrap market,<br />
from the non-ferrous metal, plastic, wood, and fiberglass materials.<br />
Reduce…Reuse…Recycle<br />
New York City <strong>Transit</strong> recycles tons of scrap each year, including heavy steel,<br />
copper, brass, scrap rail, subway car wheels, motors, generators, lead acid batteries,<br />
even whole subway cars and buses. In 2007 alone, NYCT recycled<br />
396,248 gallons of waste oil and sold 17,735 tons of scrap material for over<br />
$3.7 million.
"Procurement and waste disposal<br />
are not discrete and independent activities but<br />
rather parts of an integrated whole. Adopting<br />
this perspective at the <strong>MTA</strong> will result not only<br />
in a range of environmental benefits, but also<br />
create opportunities for significant cost savings."<br />
– Marcia Bystryn, president, New York League of<br />
Conservation Voters<br />
Chair, Materials Flow Group<br />
<br />
<br />
<br />
<br />
<br />
<br />
<br />
43
44<br />
BASELINE<br />
<strong>The</strong> <strong>MTA</strong>, like its peers, currently lacks the capacity to provide baseline data for procurements and disposals systemwide.<br />
<strong>The</strong> <strong>MTA</strong> agencies do run various “green office” and other procurement programs relating to sustainability. <strong>The</strong> <strong>MTA</strong>’s<br />
All-Agencies Procurement Council, in which agency representatives meet monthly to discuss costs, vendors, and other<br />
procurement issues, has taken the lead in sharing and expanding its existing green ideas and opportunities.<br />
In 2006, the <strong>MTA</strong> established a baseline for some areas of materials flow, focusing on water, hazardous/commercial<br />
waste, railroad ties, paper, batteries, fluorescent bulbs, and scrap metal. From this analysis, the <strong>MTA</strong> determined that all<br />
Waste Generated at<br />
<strong>MTA</strong> Agencies 2006 1<br />
35%<br />
2%<br />
23%<br />
1%<br />
37%<br />
1%<br />
Sampling of <strong>MTA</strong> NYCT<br />
Subway Waste 2008 2<br />
0.4%<br />
0.3%<br />
0.7%<br />
3.1%<br />
5.0%<br />
2.8%<br />
3.1%<br />
2.5%<br />
0.5%<br />
1.5%<br />
3.2%<br />
1.7%<br />
1.6%<br />
1.4%<br />
7.3%<br />
Plastic Bottles<br />
Newspapers<br />
Magazines<br />
White Paper<br />
Mixed Paper<br />
OCC (Cardboard)<br />
Metal Cans (AL/Tin)<br />
Glass<br />
<strong>Metro</strong>Cards<br />
12.7% 8.5%<br />
<strong>Metro</strong>-North Railroad<br />
Long Island Rail Road<br />
<strong>MTA</strong> Long Island Bus<br />
New York City <strong>Transit</strong><br />
<strong>MTA</strong> Bus<br />
<strong>MTA</strong> Bridges & Tunnels<br />
43.7%<br />
Paper Coffee Cups<br />
Clothing<br />
Mixed Colored Plastic<br />
Black Plastic Bags<br />
Juice Boxes<br />
Rubber<br />
Shoes<br />
Organic –Food Waste<br />
Miscellaneous<br />
transit agencies are purchasing Energy Star® equipment and several<br />
have more extensive green procurement plans underway.<br />
On the disposal side, the <strong>MTA</strong> runs a large number of successful<br />
recycling, salvage, and other programs through its operating agencies.<br />
All <strong>MTA</strong> transit and rail agencies manage various types of recycling,<br />
reclamation, and scrap salvage programs.<br />
Handling <strong>Transit</strong>’s Industrial Waste<br />
Charged with clearing and/or recycling transit’s nonhazardous industrial waste, the NYCT<br />
Asset Recovery Unit removed more than 1,626 tons of nonhazardous industrial waste in<br />
2007, including spent chemicals, oily rags, ether canisters, paint and paint booth residue,<br />
contaminated soil, and sludge from subway track drains. <strong>The</strong> team also recycled nearly<br />
143,000 gallons of antifreeze from buses and nonrevenue vehicles in 2007. <strong>The</strong> unit<br />
also helps extract value from other <strong>MTA</strong> waste, including commercial refuge, scrap commodity<br />
waste, and more.<br />
1 Baseline waste data is based on estimated waste and includes significant gaps as no formal agency-wide waste management tracking system is currently in place. <strong>Metro</strong>-<br />
North’s estimated waste includes generation from Grand Central Terminal, where the numerous tenants add to the solid waste volume. Estimated 2006 total was approximately<br />
252,000 tons.<br />
2 <strong>The</strong> above <strong>MTA</strong> NYCT subway waste categorization is based on a sample of subway waste taken in summer 2008 (resulting in the collection of 75,260 lbs of refuse).<br />
NYCT subway’s refuse profile is subject to numerous factors and can vary day by day.
TRANSFORMATIONAL RECOMMENDATIONS<br />
Recommendation 1. Quantify and Track the <strong>MTA</strong>’s Materials Flow<br />
<strong>The</strong> Commission calls on the <strong>MTA</strong> to develop a unified baseline of the materials flow across all agencies. This baseline<br />
should facilitate the development of a system for tracking and managing systemwide materials flow information, including<br />
procurement, waste disposal, and recycling. <strong>The</strong> system should eventually connect <strong>MTA</strong> procurements at one end with<br />
<strong>MTA</strong> waste recycling and disposal at the other, treating procurement, waste management, and recycling as parts of an<br />
integrated whole. <strong>The</strong> procurement goal should be to classify, green, lighten, minimize, and recapture a significant percentage<br />
of the <strong>MTA</strong>’s annual materials procurements. On the disposal side, the goal should be to quantify and track <strong>MTA</strong> waste in<br />
four categories: (1) customer-generated waste, (2) process-generated waste, (3) construction and demolition debris, and<br />
(4) office waste. By developing consistent metrics and steadily merging the procurement and disposal sides, the <strong>MTA</strong> will<br />
evolve a valuable system for reducing costs, recapturing materials, and greening its entire operation.<br />
Recommendation 2. Green the <strong>MTA</strong>’s Procurements and Operating Budget<br />
To begin action on Recommendation 1, the <strong>MTA</strong> should review the nearly $2 billion spent annually on material and service<br />
procurements, identifying purchase categories that can be greened, reduced, or recaptured. To further systemize its present<br />
green programs, the <strong>MTA</strong> should plan to unify policies and practices as recommended above. <strong>The</strong> plan should incorporate<br />
ongoing programs, while further specifying green materials, purchasing practices, performance standards, and contracts.<br />
<strong>The</strong> All-Agencies Procurement Council and the new<br />
<strong>MTA</strong> Businesses Services Center are natural places<br />
to begin this process. <strong>The</strong> plan should include:<br />
Developing LCA for <strong>Transit</strong> Systems<br />
• A unified electronic system for gathering data<br />
Lifecycle Analysis (LCA) assesses products all the way from raw materials through<br />
for convenient procurement tracking and an annual<br />
manufacturing, transportation, and disposal to determine the total environmental<br />
Sustainability Progress <strong>Report</strong>. Wherever possible, the<br />
and CO2 effects. An LCA process can be found in the subsections of the ISO 14000<br />
plan should convert projects into units of “carbon avoid- environmental management standards. ISO 14040:2006 provides the definiance,”<br />
using the SROI model presented in this report.<br />
tions, principles, and framework for LCA. ISO 14044:2006 specifies requirements<br />
and guidelines. <strong>The</strong> ISO standards offer a good starting point for the <strong>MTA</strong>'s LCA<br />
• An <strong>MTA</strong> Environmental Champions Program, in which<br />
program. Additionally, a survey of transit agencies undertaken by the Commission<br />
each <strong>MTA</strong> facility or department designates a volunteer<br />
identified a new transit-based LCA plan with 14 goals introduced by the Toronto<br />
Environmental Champion responsible for sustainability<br />
<strong>Transit</strong> Commission (TTC) in July 2008. <strong>The</strong> <strong>MTA</strong> is reviewing both the ISO 14000<br />
education, outreach, and motivation. This program could<br />
plans and the new TTC plan to begin developing an LCA plan that can be used by<br />
be coupled with employee incentives, including awards<br />
other transit agencies as well.<br />
for green ideas and achievements.<br />
Recommendation 3. Institute a Systemwide<br />
Green Lifecycle Analysis (LCA) System to Manage Materials from Procurements Through Disposal<br />
In accordance with the previous recommendation, the Commission suggests that the <strong>MTA</strong> institute a Lifecycle Analysis<br />
(LCA) system to manage materials from procurements through disposal. This LCA system will allow the <strong>MTA</strong> Agencies<br />
to accurately price and justify green procurement opportunities. <strong>The</strong> LCA would rationalize costs over the full lifecycle<br />
of the materials, products, or services, taking account of designated sustainability benefits. Examples include the lower<br />
maintenance cost associated with LED lighting or the lower CO2 output from rail shipping of excavation soil. <strong>The</strong> LCA<br />
plan should include:<br />
• Software models for efficient tracking and analysis, along with examples of current LCA programs. <strong>The</strong> <strong>MTA</strong> could use<br />
an off-the-shelf quantitative lifecycle software program (such as CMLCA, BEES, and others) or environmental management<br />
systems (such as the ISO 14044/14048 standards) to develop its own LCA system. Currently NYCT's CPM is ISO<br />
14001 Certified.<br />
• Develop an LCA Scoring System: Environmentally Preferable Purchasing (EPP) and Product Evaluation Model. <strong>The</strong> model<br />
would include six procedural steps: (1) compare off-the-shelf products categorized by product end-uses on a lifecycle basis,<br />
(2) determine product categories and subcategories, along with weighted decision criteria, (3) identify candidate products<br />
for the EPP list evaluation, using a range of screening tools, (4) assign positive procurement scores within the EPP+ lists,<br />
(5) gather information and score candidate products, and (6) promote the use of EPP+ lists.<br />
• Develop a method for identifying and quantifying cost savings – both dollar savings and carbon avoidance savings –<br />
from green initiatives.<br />
45
46<br />
• Develop a form for requesting “end-of-cycle” plans from <strong>MTA</strong> suppliers and contractors.<br />
• Develop an extension or adaptation of the LCA plan for rating <strong>MTA</strong> facilities, as recommended in the Facilities chapter<br />
of this report.<br />
• Develop special guidelines based on materials analysis used by the <strong>MTA</strong> Smart Fleets Task Force to reduce car weights<br />
and traction power, as described in the Energy/Carbon chapter of this report. Such analysis of vehicle materials and<br />
components can eventually be integrated into the overall materials flow plan.<br />
Lifecycle Analysis Process<br />
Design<br />
Supply Manuf.<br />
Environ.<br />
Information flow<br />
Environ.<br />
Sell Use Reuse<br />
Environ.<br />
Material flow Interactive with environment<br />
Recommendation 4. Seek More Revenue and Energy Potential from <strong>MTA</strong> Waste<br />
As it develops a unified materials baseline, the <strong>MTA</strong> should identify more opportunities to turn parts of its waste stream<br />
from a liability into an asset. <strong>The</strong> <strong>MTA</strong> should enhance its efforts to expand markets for its waste and pursue the potential<br />
for generating revenue from customer and industrial waste. <strong>The</strong> Commission also recommends that the <strong>MTA</strong> explore<br />
opportunities to turn its non-recyclable organic waste into energy by using Anaerobic Digester Gas (ADG) or other<br />
systems to generate electricity on a renewable basis, possibly in partnership with NYSERDA or other partners.<br />
Recommendation 5. Flex Market Power to Promote Green Goods<br />
<strong>The</strong> <strong>MTA</strong> should flex its market power to spur the creation of green goods and services in New York State, Connecticut,<br />
and the mid-Atlantic states. <strong>The</strong> <strong>MTA</strong> should procure fleets, equipment, and materials with energy-efficient technologies<br />
to aid in the reduction of CO2 emissions and hazardous materials and to fuel innovation in the development of sustainable<br />
technologies. This would extend to rail, bus, and car fleets, as well as to lighting fixtures, water appliances, and other equipment.<br />
<strong>The</strong> <strong>MTA</strong> should also use its market power to demand the reduction of<br />
Green Ideas from <strong>MTA</strong> Employees unnecessary packaging in the products and materials it purchases. As a large<br />
"We've done a lot of interest- regional consumer, the <strong>MTA</strong>’s procurement criteria can help drive green production<br />
ing work on investigating throughout the mid-Atlantic region.<br />
new products and materials<br />
to make rolling stock into<br />
more sustainable, smart<br />
“What Gets Measured Gets Managed“ – <strong>The</strong> <strong>MTA</strong> Green Action Plan<br />
fleets. <strong>The</strong> trick is light-<br />
<strong>The</strong> <strong>MTA</strong>’s recently conceived Green Procurement Action Plan will identify material cycles with the greatest<br />
weighting subway cars to reduce traction power<br />
measurable impact on the <strong>MTA</strong>’s ecological and carbon footprints. To be launched by the end of 2009, the<br />
without compromising safety. <strong>The</strong> <strong>MTA</strong> needs to<br />
initial plan will aim to reduce consumption of office paper, toner, plastics, and ink and identify recycled and<br />
stay out front on this kind of materials research<br />
other green products. <strong>The</strong> Plan will also provide guidance for standardizing and managing green office policies<br />
that will allow us to reduce our energy usage<br />
across all <strong>MTA</strong> agencies. It will help procurement departments define terms, evaluate products, and justify price<br />
and carbon emissions."<br />
premiums for greener products.<br />
– Gene Sansone, New York City <strong>Transit</strong><br />
Dispos.<br />
Source: http://www.congrex.nl/08c13/presentations%5Cpde2008-30-vanExel.ppt.
Materials Flow Goes Beyond Procurement<br />
and Disposal<br />
Sustainability planning depends on analyzing many<br />
interrelationships. Materials analysis, for example,<br />
figures in the ongoing research projects of the <strong>MTA</strong><br />
Smart Fleets Group, where lighter materials can<br />
help reduce traction power, the <strong>MTA</strong>’s largest energy<br />
cost. While it is primarily covered under traction<br />
power issues, the Smart Fleets projects can also be<br />
integrated into systemwide materials tracking.<br />
Summary of Lightweighting<br />
Technologies<br />
<strong>Mass</strong><br />
Impact<br />
(kg)<br />
Source: http://www.sumitomometals.co.jp/e/osakasteelworks/syarin/index.html<br />
Fleet-wide Annual<br />
Electrical Demand<br />
Impact (kWh)<br />
Cost Per<br />
10 Car<br />
Train ($k)<br />
One Free Axle on 1 non-motorized truck<br />
replacing OSMES (speed measurement) 3636 3,708,720 0 0<br />
Floor pans stamped on R160 (540lbs) vs. 282 1,036,611 0 0<br />
fabricated on R143 design (600lbs)<br />
Eliminate OSMES, brackets and equipment 327 763,996 0 0<br />
Eliminate flip up seats 164 409,268 0 0<br />
Eliminate unnecessary structural<br />
redundancy: secondary center collision 327 333,785 0 0<br />
posts (2 per A-car)<br />
Eliminate 1 of 2 coupler adapters on 200 254,908 0 0<br />
all NMTs units<br />
Advertisement card clips — changed 45 53,631 0 0<br />
from metal to plastic<br />
Investigate using Giga Cell Battery with 1658 7,514,129 4.5 0<br />
alternative battery box<br />
"Utilize single draft gear (tube style)<br />
link bar (used at B-Car link bar 1189 3,988,605 1.5 2<br />
interfaces only) "<br />
Corrugated Wheels / Lightweight Wheels 2545 4,491,430 5 6.4<br />
Composite instead of plymetal 3118 12,546,309 15 7<br />
panel flooring<br />
Payback<br />
Period<br />
(Years)<br />
Reduction in heater grill weight 36 77,374 0.5 36<br />
Reduce number and load on air compressor 445 2,018,598 12.5 37<br />
— Utilize Oilless Compressor concepts<br />
Redesign of trip cock linkage —<br />
(reduce weight from 53 lbs/truck on 145 263,925 0.5 38<br />
R142A/R143 design)<br />
Highly Rated Low Rated<br />
Technology<br />
Maturity<br />
Ease of<br />
Implementation<br />
47
Waste Management Best Practices at the TTC<br />
<strong>The</strong> Toronto <strong>Transit</strong> Commission (TTC) currently uses<br />
its own compactor trucks and internal services to<br />
collect waste and recyclables from stations, which are<br />
then turned over to a private contractor for sorting,<br />
processing, and sales. <strong>The</strong> contractor keeps the<br />
proceeds from sales, which offsets the costs of<br />
running a transfer station and disposals. By using internal<br />
collection with offsite private sorting, TTC avoids<br />
the need for permits and other costs of maintaining<br />
waste transfers operations. Waste collections are simplified<br />
by the use of different colored plastic bags.<br />
Recyclable and Reusable <strong>Metro</strong>Card<br />
In keeping with Recommendation 4, the <strong>MTA</strong> should<br />
implement a Reuse/Refill Incentive Program by<br />
charging a green fee for each newly purchased<br />
<strong>Metro</strong>Card. This reusable/recyclable <strong>Metro</strong>Card could<br />
be created from 100-percent recycled polyester and<br />
constitute a potential revenue source. This program<br />
could encourage commuters to reuse/refill their<br />
<strong>Metro</strong>Cards, eliminate littering of <strong>Metro</strong>Cards on station<br />
platforms, reduce maintenance operating costs,<br />
and drastically cut <strong>Metro</strong>Card inventory requirements<br />
and costs. In conjunction with a vigorous public<br />
awareness campaign, this program could have a<br />
great impact on commuter behaviors.<br />
Saving Forests One Tie At A Time<br />
<strong>The</strong> <strong>MTA</strong> has formed a Sustainable Railroad Tie Task<br />
Force, with both Track and Procurement representatives<br />
from three <strong>MTA</strong> rail agencies to work toward<br />
increasingly sustainable railroad tie solutions. One of<br />
the types of sustainable railroad ties being introduced<br />
and field tested is made from a composite of recycled<br />
plastic, waste tires, waste fiberglass, and structural<br />
mineral fillers. Innovations in technology and <strong>MTA</strong>’s<br />
adoption of them will substantially reduce the use of<br />
conventional, non-renewable railroad ties.<br />
48<br />
NEAR-TERM RECOMMENDATIONS<br />
Recommendation 1. Adopt Waste Management Targets<br />
<strong>The</strong> <strong>MTA</strong> should adopt robust recycling and waste management targets across<br />
agencies for its customer-generated waste, process-generated waste, construction<br />
and demolition debris, and office waste. <strong>The</strong>se metrics can be developed with current<br />
agency standards and with best practices based on the Commission’s survey of<br />
transit systems. Using this baseline information, the <strong>MTA</strong> can determine realistic<br />
recycling and waste minimization goals for various operations.<br />
Recommendation 2. Introduce Source Separation of Waste in NYCT<br />
Subways<br />
<strong>The</strong> <strong>MTA</strong> should introduce the source separation of recyclable materials in NYCT<br />
subway stations. <strong>The</strong> <strong>MTA</strong> should seek opportunities to partner with New York City<br />
and others on such programs, possibly through street-level collections by the city.<br />
<strong>The</strong> <strong>MTA</strong> should also partner with regional organizations in order to promote consistent<br />
recycling practices and ensure consistency in program design and branding<br />
to achieve greater customer recycling understanding and practices.<br />
Recommendation 3. Reduce Inventory and Warehouse Storage<br />
<strong>The</strong> <strong>MTA</strong> should reduce its inventory and warehouse storage needs and costs.<br />
<strong>The</strong> <strong>MTA</strong> should explore the potential for adopting an agency-wide inventory<br />
management system to reduce materials flow, costs, and energy consumption<br />
related to material management and warehousing.<br />
Recommendation 4. Promote <strong>MTA</strong> Rider and Employee Conservation<br />
In addition to existing programs and the recommended “Environmental Champion”<br />
program, the <strong>MTA</strong> should identify more opportunities for using its visibility and<br />
reach to promote daily conservation of water, materials, paper, fuels, and more<br />
among its millions of riders and more than 70,000 employees.<br />
Recommendation 5. Increase Sustainable Waste Management<br />
<strong>The</strong> <strong>MTA</strong> should continue to reduce landfill waste and reduce demand for new<br />
materials by expanding its reuse of <strong>MTA</strong> building materials and purchasing other<br />
used or recycled materials.<br />
Recommendation 6. Minimize Materials Packaging<br />
<strong>The</strong> <strong>MTA</strong> should continue to minimize materials packaging by revisiting procurement<br />
specifications to require alternative or reduced packaging, incentivizing reduced<br />
packaging and shipping weights among <strong>MTA</strong> vendors and contractors, and specifying<br />
a percentage reduction of packaging as criteria to evaluate procurement bids.<br />
Recommendation 7. Encourage Use of Low-Carbon Local Materials at all<br />
<strong>MTA</strong> Agencies and by Vendors<br />
<strong>The</strong> <strong>MTA</strong> should continue to encourage the use of low-carbon, local materials at all<br />
agencies and by vendors. Current <strong>MTA</strong> procurement statutes provide for New York<br />
State content to be given priority consideration on procurements for rail cars, buses,<br />
and other materials. Public Authorities Law Section 2879 includes provisions for<br />
tracking in-state and out-of-state vendors. However, the <strong>MTA</strong> should be more<br />
explicit in encouraging procurements that avoid the carbon and other GHG emissions<br />
associated with long-distance shipping. <strong>The</strong> same should apply to <strong>MTA</strong> contractors<br />
and vendors.
Recommendation 8. Increase the Use of Sustainable Railroad Ties<br />
<strong>The</strong> <strong>MTA</strong> should expand the procurement of sustainable railroad ties at all rail agencies. Initial goals should include reducing<br />
the purchase of tropical hardwood ties whenever possible, prioritizing alternatives, such as oak and composite plastic. A<br />
similar policy should apply to <strong>MTA</strong> vendor contracts. To the degree that the <strong>MTA</strong> must use tropical hardwood in some<br />
contexts (e.g. in switches and in areas prone to flooding), the <strong>MTA</strong> should only procure Forest Stewardship Council (FSC)<br />
certified or other sustainably harvested tropical hardwood.<br />
Recommendation 9. Evaluate Repair-Return-Leasing Opportunities<br />
<strong>The</strong> <strong>MTA</strong> should evaluate the potential for increasing leased products to reduce materials flow. Vendor contracts could require<br />
recycling and reuse of materials and products. <strong>The</strong> <strong>MTA</strong> is already using this approach in the leasing of bus tires and <strong>Metro</strong>-<br />
North M2 converters. <strong>MTA</strong> should pursue this cradle-to-grave concept and expand like-leasing opportunities when feasible.<br />
ACHIEVEMENTS TO DATE<br />
Since <strong>MTA</strong> materials flow programs have traditionally been undertaken and<br />
managed on an agency basis, the Commission surveyed the <strong>MTA</strong> agencies<br />
on recent initiatives. Examples of notable achievements are summarized below.<br />
• For recycling, NYCT uses both source-separation at facilities and offices and<br />
post-collection programs in stations. In 2007, source-separation recycling at<br />
NYCT facilities removed 466 tons of recyclables from over 100 locations.<br />
Post-collection at 468 subway stations yielded 8,931 tons of recyclables, nearly<br />
50 percent of all system refuse, one of the highest recycling rates in the U.S.<br />
• At construction sites, NYCT Capital Program Management (CPM) has<br />
implemented strict environmental and sustainability standards through its<br />
Environmental Management System (EMS), which governs energy efficiency,<br />
water and natural resources, waste and recycling, local purchasing and transport,<br />
and much more.<br />
• Bus salvage for spare parts is underway at the Eastchester Depot in the<br />
Bronx, where spare parts and functional systems are identified for salvage<br />
before the bus is sold for scrap metal.<br />
• <strong>Metro</strong>-North operates a source-separation recycling program with recycle<br />
bins at the majority of its stations. In addition, Grand Central Terminal collected<br />
642 tons of newspaper from over 90 recycling bins in 2007. <strong>The</strong> newspaper<br />
is collected by an <strong>MTA</strong> recycling vendor, who pays the <strong>MTA</strong> the per-pound<br />
market rate. <strong>Metro</strong>-North is also expanding the source separation of its<br />
passenger waste at its stations.<br />
• Since 2006, Long Island Rail Road has collected more than 6,000 gross tons of scrap using a high-rail crane equipped<br />
with a giant magnet. Mostly abandoned track rails, the scrap also includes old train wheels and axles, metal shavings,<br />
copper wire and railroad tie plates and fasteners. Metals salvaged as of 2006 brought in more than $3 million. Long<br />
Island Rail Road is also expanding the source separation of its passenger waste at its stations.<br />
• At its major expansion project worksites, <strong>MTA</strong> Capital Construction (<strong>MTA</strong>CC) currently recycles approximately<br />
80 percent of worksite debris, either as recycled waste or reused construction materials. <strong>MTA</strong> Capital Construction<br />
has also diverted thousands of tons of traditionally landfill-bound construction waste for recycling.<br />
• <strong>MTA</strong> Bridges and Tunnels manages a green office and procurements program, using third-party benchmarks, such as<br />
Green Seal, EcoLogo, Energy Star, and LEED. Green product and policy standards include remanufactured toner cartridges,<br />
100-percent post consumer waste (PCW) chlorine-free paper, double-sided printing, electronic distribution of documents,<br />
and digital filing. In 2007, <strong>MTA</strong> Bridges and Tunnels achieved a 19 percent reduction in paper usage. <strong>MTA</strong> Bridges and<br />
Tunnels also provides source-separation bins in offices, with recycle or disposal contracts for lighting refuse, batteries,<br />
computers, and other electronic equipment.<br />
A high-rail crane equipped with a giant magnet clears scrap metal from Long Island Rail Road tracks. <strong>The</strong> sale of scrap metal salvaged by the LIRR has<br />
brought in more than $3 million since 2006.<br />
49
Water Management<br />
Water resources management, conservation, and protection<br />
"As one of the world's leading<br />
transportation authorities and one of New<br />
York City's major water users, the <strong>MTA</strong> is<br />
uniquely positioned to set a global standard<br />
for innovative water resource management.<br />
By significantly reducing its use of potable<br />
water, guarding against future flooding risks,<br />
and making beneficial use of ground and<br />
storm water to run its operations, the <strong>MTA</strong><br />
can become a sustainability leader while<br />
addressing the challenges of a warming<br />
climate and saving the authority and its<br />
customers money."<br />
– Alex Matthiessen, Hudson Riverkeeper<br />
and president, Riverkeeper<br />
Chair, Water Management Group<br />
While the public is unlikely to associate the <strong>MTA</strong> with water<br />
issues, water management plays a distinct role in the<br />
authority’s sustainability efforts. Given the scale of its<br />
operations, the <strong>MTA</strong> is a major consumer of the metropolitan<br />
area’s potable water. Its daily operations also include pumping<br />
out groundwater to keep its track and tunnels dry. In addition,<br />
many <strong>MTA</strong> properties and rights-of-way border wetlands and<br />
waterways that serve vital ecological functions and that<br />
should be protected. <strong>The</strong> <strong>MTA</strong> must also manage wastewater<br />
and runoff from its properties and operations during intense<br />
storms, when flooding can both disrupt service and endanger<br />
local water quality by overwhelming sewer systems.<br />
At present, <strong>MTA</strong> operations are estimated to use roughly<br />
2.6 billion gallons of potable water per year, of which a large<br />
share, estimated between 1.2 and 1.4 billion gallons, is used<br />
in the flow process to cool NYCT subway system transformers.<br />
Washing vehicles also accounts for a significant share<br />
of the <strong>MTA</strong>’s overall water use. <strong>The</strong> Commission looked at<br />
ways to reduce the <strong>MTA</strong>’s potable water consumption,<br />
including expanded use of greywater and rainwater for<br />
nonpotable needs such as washing vehicles. A preliminary<br />
study undertaken by the Commission indicates that, in<br />
addition to incremental conservation measures, there are<br />
Left: A rainwater collection system on the roof of the Corona Maintenance Shop<br />
in Queens drains rainwater into a 40,000-gallon underground storage tank that<br />
supplies water to a subway car washer.<br />
a number of plausible options for significant reduction in<br />
the <strong>MTA</strong>’s use of potable water. Depending on which mix<br />
of programs and technologies proves feasible, the <strong>MTA</strong><br />
should be able to reduce its use of potable water by up<br />
to 75 percent by 2020.<br />
Research conducted by the Commission concluded that<br />
many transportation agencies place a relatively low emphasis<br />
on water-reduction targets. By significantly reducing its<br />
water consumption, the <strong>MTA</strong> would be viewed as an<br />
industry leader in sustainability. Globally, water is increasingly<br />
understood as a precious but diminishing resource,<br />
vital for life and economic prosperity.<br />
An important first step will be to implement consistent,<br />
systemwide water-metering and submetering at <strong>MTA</strong> facilities,<br />
which the Commission has cited as a top priority in its<br />
Interim <strong>Report</strong>. Conservation measures would then include a<br />
range of strategies, from staggered vehicle wash schedules<br />
to harvested rainwater and water-saving fixtures in public<br />
stations. Water management also plays a large role in facilities<br />
design. Among the green features of the <strong>MTA</strong>’s LEEDcertified<br />
Corona Maintenance Facility is a 40,000-gallon<br />
rainwater capture system to supply water for washing<br />
subway cars. Several other <strong>MTA</strong> facilities operate vehicle<br />
wash systems using recycled greywater to reduce strain<br />
on potable water systems, while water-control innovations<br />
such as green roofs are part of the design of <strong>MTA</strong> facilities.<br />
One of the more intriguing water management ideas involves<br />
the use of groundwater. <strong>The</strong> <strong>MTA</strong> currently pumps some<br />
8 million gallons of groundwater per day out of its subway<br />
tunnels on a dry day and up to 13 million gallons per day<br />
during storms. Once regarded as a nuisance, groundwater<br />
has a number of potential uses. From a global perspective,<br />
this water should be seen as a valuable resource latent in<br />
<strong>MTA</strong> properties. Possible uses include thermal exchange<br />
heating and cooling in <strong>MTA</strong> facilities or nearby buildings.<br />
<strong>The</strong> Commission is currently identifying potential uses near<br />
current groundwater pump sites.<br />
51
52<br />
<strong>The</strong> Fine Art of Flood Response<br />
BASELINE<br />
While many <strong>MTA</strong> facilities do meter water, the <strong>MTA</strong> does not currently do systemwide metering and submetering, creating<br />
gaps in its overall water usage baseline. <strong>The</strong> following charts show the larger breakdowns in <strong>MTA</strong> water consumption,<br />
according to the best available figures provided to the Commission.<br />
Estimated <strong>MTA</strong> Potable Water Usage for 2006<br />
3,000<br />
2,500<br />
2,000<br />
1,500<br />
1,000<br />
500<br />
0<br />
2.6B<br />
1.9B<br />
1.2B*<br />
490M<br />
210M<br />
Total Annual Consumption<br />
NYC <strong>Transit</strong><br />
NYC <strong>Transit</strong> Rail–Transformer Cooling<br />
NYC <strong>Transit</strong> Rail–Other Water<br />
580M<br />
100M 46M<br />
NYC <strong>Transit</strong> Bus<br />
<strong>Metro</strong>-North Railroad<br />
Long Island Railroad<br />
<strong>MTA</strong> Bus, Bridges and Tunnels,<br />
and Long Island Bus<br />
<strong>The</strong> <strong>MTA</strong> has introduced raised-grate street furniture to prevent subway flooding. This one, in front<br />
of 151 West Broadway between Worth and Thomas streets, provides benches and bicycle racks<br />
and represents a design that will be replicated at 15 locations along West Broadway between<br />
Chambers and Leonard Streets and on Varick Street between Leonard and Franklin streets.<br />
Green Roofs<br />
<strong>MTA</strong> Vehicle Wash Water Usage<br />
(gallons/year)<br />
53%<br />
29%<br />
12%<br />
3%<br />
1% 2%<br />
NYCT Department<br />
of Buses<br />
NYCT Department<br />
of Subways<br />
Long Island Rail Road<br />
<strong>MTA</strong> Bus<br />
<strong>Metro</strong>-North Railroad<br />
Long Island Bus<br />
To better evaluate areas for water conservation, the Commission graphed usage patterns based on aggregate volumes.<br />
<strong>The</strong> <strong>MTA</strong> uses approximately 2.6 billion gallons of potable water per year. 1 Of this total, NYCT uses approximately<br />
1.9 billion gallons, of which roughly 1.2 to 1.4 billion gallons are used to cool NYCT transformers, based upon engineering<br />
estimates of system capacity.<br />
In urban areas hungry for green space, rooftops offer acres of possibility. <strong>The</strong> "green<br />
roof" is a simple design idea that serves multiple functions. <strong>The</strong> design entails<br />
sealed roofing, insulation, and a drainage bed, above which sits a blanket of planting<br />
medium. Vegetation can range from gardens to low-maintenance desert plants.<br />
While beautifying skylines, cooling buildings, and sponging CO2 out of the air, green<br />
roofs also serve a "hidden" function. <strong>The</strong> drainage bed delays stormwater runoff,<br />
helping to prevent the sewer overloads that chronically threaten urban water<br />
systems. <strong>The</strong> <strong>MTA</strong> is exploring green roof designs at the <strong>MTA</strong> Bus Company’s Far<br />
Rockaway Depot and the Queens-Midtown Tunnel Service Building Annex.<br />
* <strong>The</strong> <strong>MTA</strong> does not currently collect data on the potable water used to cool transformers. <strong>The</strong> potable water consumption for NYCT transformer cooling is based upon<br />
engineering estimates. <strong>The</strong> “engineering” estimates are based upon calculations of systems capacity and operational circumstances such as peak/off-peak load factors.<br />
According to such estimates the transformers use approximately 1.2 to 1.4 billion gallons in 2006.
TRANSFORMATIONAL RECOMMENDATIONS<br />
Recommendation 1. Reduce Potable Water Used to Cool Transformers<br />
<strong>The</strong> Commission recommends that the <strong>MTA</strong> seek a significant reduction in its use of potable water by up to 75 percent<br />
by 2020. This target is based on engineering estimates rather than actual measurements and may be revised when more<br />
accurate data are available. <strong>The</strong> most dramatic reductions would come from innovations in the NYCT transformer cooling<br />
systems. <strong>The</strong> <strong>MTA</strong> currently draws between 1.2 to 1.4 billion gallons of potable water per year to cool subway transformers,<br />
at a cost of roughly $1 million annually. This water is currently used for once-through cooling and then discharged into<br />
storm or sanitary sewers. While nonpotable after use, the cooling water is relatively clean and could be recovered by the<br />
<strong>MTA</strong> or a private entity. It may also be possible to capture and use heat from the spent cooling water. <strong>The</strong> water could be<br />
directed to a manufacturer or other private ventures for reuse.<br />
If feasible, the <strong>MTA</strong> could purchase chilled water from buildings near substations with coolers and excess capacity. <strong>The</strong><br />
chilled water would be piped down to the substations, then piped back up to the building systems. This strategy, recommended<br />
by the Commission, could result in significant potable water reductions in a shorter period of time than the <strong>MTA</strong><br />
Capital Program's current plan to upgrade subway system substations by converting to air-cooled transformers by 2048.<br />
Recommendation 2. Seek Innovative Uses for Pumped Groundwater<br />
On a dry day, New York City <strong>Transit</strong> pumps some 8 million gallons of groundwater from underground streams and other<br />
subterranean sources to keep subway tunnels dry. <strong>The</strong> Commission believes the <strong>MTA</strong> could turn this liability into an asset<br />
by developing geothermal and other beneficial uses of the groundwater. <strong>The</strong> <strong>MTA</strong> should work with the NYC DEP to<br />
research and develop greywater resources for possible use in <strong>MTA</strong> subway stations and bus depots, geothermal uses for<br />
new residential construction, hospitals, businesses, and city agencies. Program steps would include:<br />
• Identify and map significant groundwater flows in subway tunnels and match to potential customers. <strong>The</strong> <strong>MTA</strong> has<br />
deep-well stations in East New York, Flatbush, Williamsburg, and Harlem.<br />
• Conduct feasibility studies to assess potential supply and demand; engineering and distribution feasibility; cost/benefit<br />
analysis; sustainable return on investment SROI (for SROI, see the chapter on <strong>Transit</strong>’s Triple Bottom Line); potential<br />
partnerships, carbon trade, and funding opportunities.<br />
OLLAND TUNNEL<br />
PATH<br />
Hudson River<br />
LINCOLN TUNNEL<br />
NJ<strong>Transit</strong> Amtrak<br />
PATH<br />
SIDE PARK<br />
k<br />
12 AV<br />
RIVERSIDE DR<br />
RIVERBANK<br />
STATE PARK<br />
RIVERSIDE DR<br />
Amtrak<br />
WASH AV<br />
WEST END AV 11 AV<br />
9 AV<br />
COLUMBUS AV<br />
AMSTERDAM AV 10 AV<br />
66 ST<br />
53 ST 34 St-Penn<br />
12 AV<br />
1<br />
145 ST<br />
23 ST<br />
L<br />
CHELSEA<br />
23 St<br />
B<br />
D<br />
14 St<br />
F<br />
A<br />
CE<br />
Christopher St<br />
V 8 ST<br />
9 St<br />
WASHINGTON<br />
SQUARE PARK<br />
1<br />
2<br />
NOHO<br />
3<br />
BLEECKER ST<br />
GREENWICH<br />
VILLAGE<br />
WEST ST<br />
BANK ST<br />
GREENWICH ST<br />
WEST ST<br />
PATH<br />
135 ST<br />
CHARLTON ST<br />
ST NICHOLAS AV<br />
r<br />
33 St<br />
WTC Site WTC E<br />
GRAND ST<br />
MADISON AV MADISON AV<br />
FIFTH AV 5 AV<br />
50 ST 50 ST<br />
JAVITS<br />
CENTER<br />
BROADWAY<br />
HUDSON RIVER PARK<br />
ELLIS<br />
ISLAND<br />
FREDERICK<br />
DOUGLASS BLVD<br />
BLEECKER ST<br />
HOUSTON ST<br />
CANAL ST<br />
ADAM CLAYTON<br />
POWELL BLVD (7AV)<br />
SPRING ST<br />
W 4 ST<br />
MALCOLM X BLVD<br />
(LENOX AV)<br />
PARK AV<br />
PEARL ST<br />
BOWERY<br />
THIRD AV 3 AV<br />
SECOND AV 2 AV<br />
79 ST<br />
72 ST<br />
2 AV<br />
ST ANNS AV<br />
BRUCKNER EXPWY<br />
YORK AV<br />
FIRST AV 1 AV<br />
66 ST<br />
F<br />
3 AV<br />
WATER ST<br />
T R AMWAY<br />
59 ST<br />
23 ST<br />
1 AV<br />
ALLEN ST<br />
BRIDGE<br />
ROBERT F KENNEDY<br />
QUEENS<br />
MIDTOWN<br />
TUNNEL<br />
EAST 8 ST<br />
VILLAGE<br />
CANAL ST<br />
E BWAY<br />
SOUTH ST<br />
QUEENSBORO BRIDGE<br />
AV A<br />
AV B<br />
MADISON ST<br />
163 ST<br />
4 ST<br />
2 ST<br />
BROOKLYN-BATTERY TUNNEL<br />
AV D<br />
PROSPECT AV<br />
Long<br />
Island<br />
City<br />
21 ST<br />
MANHATTAN BRIDGE<br />
BROOKLYN BRIDGE<br />
COLUMBIA ST<br />
20 AV<br />
East River<br />
Hunterspoint Av<br />
HICKS ST<br />
HENRY ST<br />
36 ST<br />
STEINWAY ST<br />
GREENPOINT AV<br />
LIRR<br />
LONG ISLAND EXPWY<br />
9 ST<br />
KENT AV<br />
DITMARS BLVD<br />
ASTORIA BLVD<br />
30 AV<br />
NASSAU AV<br />
FLUSHING AV<br />
BERGEN ST<br />
UNION ST<br />
BRONX-WHITESTONE BRIDGE<br />
125 ST UNION TURNPIKE<br />
BROADWAY<br />
LIBERTY<br />
ISLAND<br />
B<br />
ST NICHOLAS AV<br />
CENTRAL PARK WEST<br />
EIGHTH AV<br />
EIGHTH AV<br />
BROADWAY<br />
7<br />
SEVENTH AV<br />
B<br />
3<br />
4<br />
5<br />
6<br />
86 St 86 St<br />
A<br />
C<br />
B<br />
D MANHATTAN<br />
79 St<br />
UPPER<br />
WEST<br />
SIDE<br />
1<br />
2<br />
3<br />
CENTRAL<br />
PARK<br />
WEST Times Sq-42 SIDE St CENTRAL PARK SOUTH<br />
34 St-Herald Sq<br />
Canal St<br />
Chambers St<br />
Cortlandt St<br />
BATTERY<br />
PARK CITY<br />
Central Park<br />
GR ENWICH AV<br />
VARICK ST<br />
SIXTH AV<br />
SIXTH AV<br />
CHURCH ST<br />
TRINITY PL<br />
BATTERY<br />
PARK CITY<br />
5<br />
D<br />
METROPOLITAN<br />
MUSEUM<br />
OF ART<br />
53 ST<br />
BROADWAY<br />
BROADWAY<br />
1<br />
4<br />
North HARLEM 110 StHarlem<br />
125 St<br />
2<br />
3<br />
47-50 Sts-<br />
Rockefeller Ctr<br />
TRIBECA<br />
S<br />
WEST NEW<br />
BRIGHTON<br />
4<br />
5<br />
6<br />
SOHO<br />
NEW<br />
BRIGHTON<br />
125 St<br />
PARK AV S<br />
6<br />
LAFAYETTE ST<br />
J<br />
M<br />
Z<br />
LEXINGTON AV<br />
63 ST<br />
60 ST<br />
HOUSTON ST<br />
FINANCIAL<br />
DISTRICT<br />
THE HUB<br />
EAST<br />
HARLEM<br />
UPPER<br />
EAST<br />
SIDE<br />
UNITED<br />
NATIONS<br />
LITTLE ITALY<br />
CHINATOWN<br />
E 138 ST<br />
2 3<br />
M<br />
MOTT HAVEN<br />
6<br />
ROOSEVELT<br />
ISLAND<br />
EV<br />
RANDALLS<br />
ISLAND<br />
4<br />
6<br />
41 AV<br />
EAST<br />
RIVER<br />
PARK<br />
LOWER<br />
EAST SIDE<br />
DELANCEY ST<br />
RUTGERS ST<br />
A C<br />
WESTCHEST<br />
SOUTHERN BLVD<br />
VERNON BLVD<br />
LONG<br />
ISLAND<br />
CITY<br />
Queens Plaza<br />
23 St<br />
J M<br />
Chambers St<br />
GOVERNORS<br />
ISLAND<br />
MANHATTAN AV<br />
L<br />
N 7 ST<br />
WILLIAMSBURG<br />
BRIDGE<br />
F<br />
G<br />
7<br />
GREENPOINT<br />
BD<br />
FULTON<br />
LANDING<br />
BROOKLYN<br />
HEIGHTS<br />
HUNTS<br />
POINT<br />
36 St<br />
G<br />
31 ST<br />
NAVY<br />
YARD<br />
ASTORIA<br />
G<br />
NEW YORK<br />
TRANSIT MUSEUM<br />
CARROLL<br />
GARDENS<br />
RED<br />
HOOK<br />
RIKERS<br />
ISLAND<br />
V<br />
J M Z<br />
JAY ST<br />
SMITH ST<br />
BROADWAY<br />
QUEENS BLVD<br />
CALVARY<br />
CEMETERY<br />
WILLIAMSBURG<br />
FLATBUSH AV<br />
F<br />
EF<br />
7<br />
Flood-prone locations in the NYCT system and other locations where flooding or water entry into the<br />
system occurred in the past.<br />
G<br />
JACKSON<br />
HEIGHTS<br />
48 ST<br />
MYRTLE AV<br />
TH<br />
LAGUARDIA<br />
AIRPORT<br />
83 ST<br />
82 ST<br />
65 St<br />
D<br />
=N<br />
Woodside<br />
58 ST<br />
LIC-Court Square<br />
Broadway<br />
Borough Hall<br />
5<br />
Nevins St<br />
FORT GREENE Law rence St<br />
NEW<br />
CALVARY<br />
CEMETERY<br />
Jefferson St<br />
BUSHWICK AV<br />
BEDFORD AV<br />
FOURTH AV FOURTH A<br />
NINTH ST<br />
FIFTH AV<br />
J Z<br />
UNION AV<br />
LAFAYETTE AV<br />
FLATBUSH AV<br />
PARK<br />
SLOPE<br />
D<br />
M<br />
PROSPECT AV<br />
GREENWOOD<br />
CEMETERY<br />
NORTHERN BLVD<br />
7<br />
ROOSEVELT AV<br />
MAURICE AV<br />
37 AV<br />
MT ZION<br />
CEMETERY<br />
QUEENS<br />
BROOKLYN<br />
METROPOLITAN AV<br />
WILSON AV<br />
FULTON ST<br />
M<br />
G<br />
WASHINGTON<br />
PROSPECT<br />
PARK<br />
PARSONS BLVD<br />
NEW YORK AV<br />
BEDFORD AV<br />
69 ST<br />
WYCKOFF AV<br />
MYRTLE AV<br />
BROOKLYN<br />
BOTANIC<br />
GARDEN<br />
MC<br />
N PKWY PARKSIDE AV<br />
7<br />
JUNCTION BLVD<br />
EFG<br />
V<br />
Nostrand Av<br />
111 ST<br />
FOREST AV<br />
BUSHWICK AV<br />
O<br />
WHITESTONE EXPWY<br />
BROADWAY<br />
CONEY IS<br />
Shea Stadium<br />
QUEENS BLVD<br />
JUNIPER<br />
VALLEY<br />
PARK<br />
MIDDLE<br />
VILLAGE<br />
MT OLIVET<br />
CEMETERY LUTHERAN M<br />
CEMETERY<br />
S<br />
CORONA<br />
MASPETH<br />
Myrtle Av<br />
BEDFORD-<br />
STUYVESANT<br />
RIDGEWOOD<br />
BUSHWICK<br />
Flushing Av<br />
Hoyt Schermerhorn<br />
Union St<br />
A C<br />
LIRR<br />
BERGEN ST<br />
EASTERN PARKWAY<br />
2<br />
5<br />
E 15 ST<br />
L<br />
J<br />
7<br />
CROWN<br />
HEIGHTS<br />
Flushing<br />
FULTON ST<br />
FLATBUSH<br />
112 ST<br />
NORTHERN BLVD<br />
Murray<br />
Hill<br />
KI SENA BLVD<br />
UTICA AV<br />
NOSTRAND AV<br />
FLUSHING<br />
FLUSHING<br />
MEADOWS<br />
CORONA<br />
PARK<br />
MAIN ST<br />
COLLEGE POINT BLVD<br />
HORACE HARDING EXPWY<br />
AUSTIN ST<br />
REGO PARK<br />
Forest<br />
Hills<br />
FOREST<br />
HILLS<br />
WINTHROP ST<br />
FLATBUSH AV<br />
ST JOHNS<br />
CEMETERY<br />
4<br />
AV H<br />
MYRTLE AV<br />
UTICA AV<br />
CHURCH AV<br />
BEDFORD A<br />
GLENDALE<br />
NEW YORK AV<br />
2 5<br />
G<br />
Broadway<br />
EVERGREEN<br />
CEMETERY<br />
East NY<br />
KISSENA<br />
PARK<br />
JEWEL AV<br />
JACKIE ROBINSON PARKWAY<br />
FULTON ST<br />
VAN SINDEREN AV<br />
OCEAN HILL- Utica BROWNSVILLE Av<br />
EAST<br />
FLATBUSH<br />
LIVONIA AV<br />
KINGS HWY<br />
LIRR<br />
3<br />
BROOKLYN<br />
Auburndale<br />
E<br />
Kew<br />
Gardens<br />
KEW<br />
GARDENS<br />
BERGEN ST<br />
LIRR<br />
LIRR<br />
Bayside<br />
LONG ISLAND EXPWY<br />
REMSEN AV<br />
FLATLANDS AV<br />
164 ST<br />
QUEENS BLVD<br />
PITKIN AV<br />
QUEENS<br />
Top 4 Locations<br />
Other Locations<br />
KEW<br />
GARDENS<br />
HILLS<br />
METROPOLITAN AV<br />
FOREST<br />
PARK<br />
J Z<br />
RICHMOND<br />
HILL<br />
EAST<br />
NEW<br />
YORK<br />
JAMAICA AV<br />
L<br />
WOODHAVEN BLVD<br />
C<br />
3<br />
HILLCREST<br />
F<br />
VAN SICLEN AV<br />
PENNSYLVANIA AV<br />
FLATLANDS<br />
PARSONS BLVD<br />
WOODHAVEN<br />
LIBERTY AV<br />
CROSS BAY BLVD<br />
UTOPIA PKWY<br />
LEFFERTS BLVD<br />
111 ST<br />
A<br />
PITKIN AV<br />
OZONE<br />
PARK<br />
CANARSIE<br />
FRESH<br />
MEADOWS<br />
Parsons Blvd<br />
Sutphin<br />
Blvd/Archer<br />
Av/JFK Airport<br />
HILLSIDE AV<br />
A<br />
HOWARD BEACH<br />
NORTHERN BLVD<br />
CLEARVIEW EXPWY<br />
FRANCIS LEWIS BLVD<br />
JAMAICA<br />
ESTATES<br />
Jamaica<br />
Bay<br />
E J Z<br />
Jamaica<br />
ARCHER AV<br />
VAN WYCK EXPWY<br />
A<br />
F<br />
JAMAICA<br />
CROSS BAY BLVD<br />
JAMAICA<br />
BAY<br />
WILDLIFE<br />
REFUGE<br />
NEL DR<br />
CU<br />
JAMAIC<br />
GUY R.<br />
SUTPHI<br />
CONDUIT AV<br />
CR<br />
VETERA<br />
MEMORIAL<br />
BRIDGE<br />
S<br />
ROCK<br />
A S<br />
<strong>MTA</strong> Flood Response<br />
<strong>MTA</strong> water policies include coping with the kind of weather-related<br />
disruptions likely to be aggravated by climate<br />
change and rising sea levels. Most recently, a storm in<br />
August 2007 brought widespread flooding.<br />
Subways and low-lying rights-of-way were submerged;<br />
pumps were overwhelmed; debris blocked drains. As a<br />
result, much of the <strong>MTA</strong> rail system ceased to operate for<br />
several hours, while bus service saw disruptions across<br />
New York City and Nassau County. Bridges and Tunnels<br />
experienced traffic backups from localized flooding. In all,<br />
over 2.5 million transit customers were affected. In<br />
response, the <strong>MTA</strong> issued a comprehensive storm report<br />
and <strong>MTA</strong> agencies are now working with local communities<br />
to anticipate flood areas, prepare alternative routes,<br />
improve communications, deploy increased pump capacity,<br />
and other measures. For more on <strong>MTA</strong> storm response<br />
and related issues, see the Climate Adaptation chapter in<br />
this report or go to www.mta.info/environment. <strong>The</strong><br />
water management recommendations in this chapter will<br />
improve the <strong>MTA</strong>’s ability to deal with storms and their<br />
effects in the future.<br />
53
54<br />
Groundwater: From Old Nuisance to New Resource<br />
Like many subway systems, the <strong>MTA</strong> spends energy pumping<br />
groundwater out of tunnels, up to 8 million gallons per<br />
day on dry days. Once a nuisance, this water should be<br />
regarded as a valuable resource for thermal-exchange cooling<br />
and heating, washing vehicles and other non-potable uses.<br />
Typical Subway Drainage and Pumping System<br />
Rainwater Collection at Corona<br />
A rainwater collection system on the roof of the Corona<br />
Maintenance Shop in Queens drains rainwater into a<br />
40,000-gallon underground storage tank that supplies water<br />
to a subway car wash. Approximately 80 percent of the<br />
wash water is then collected as greywater and recycled, with<br />
potable water used only for the final rinse.<br />
<strong>MTA</strong> Impacts Wetlands and Vice Versa<br />
Wetlands filter pollution found in stormwater, serve as groundwater<br />
recharge zones, protect land from coastal<br />
erosions and against storm surges, and provide habitat for<br />
wildlife. <strong>The</strong>se benefits, if lost, are extremely costly to recreate.<br />
With many rights-of-way along wetlands, the <strong>MTA</strong> and its<br />
partners have a responsibility to protect and rehabilitate wetlands.<br />
Since wetlands buffer sea surges, the <strong>MTA</strong> also has a<br />
vested interest in such protection. In its systemwide sustainability<br />
planning, the <strong>MTA</strong> should include the value of wetlands,<br />
especially in relation to climate change impacts on the coastal<br />
environment. Dying wetlands in and around the city and<br />
Jamaica Bay could hasten erosion, disrupt wild bird flyways,<br />
and decrease land buffers to storm surges, which in turn<br />
threaten the <strong>MTA</strong>’s operations and long-term sustainability.<br />
NEAR-TERM RECOMMENDATIONS<br />
Recommendation 1. Implement Systemwide Metering and<br />
Submetering<br />
<strong>The</strong> <strong>MTA</strong> should install additional water meters to develop an accurate<br />
database covering various categories of water use, including washing<br />
buses, washing rolling stock, parts washing, employee usage, and transformer<br />
cooling. Metering would measure and track usage and would be<br />
useful in developing effective conservation strategies. It would be helpful<br />
in evaluating and monitoring effectiveness of new technologies installed.<br />
<strong>The</strong> introduction of metering should proceed in the following phases:<br />
• Phase One. Begin data collection on all major water demands using<br />
metering and submetering, supported by detailed estimates based on<br />
numbers of vehicles, pump capacities, and other data, as stated in the<br />
Commission’s Interim <strong>Report</strong>. This would include a leak-detection program.<br />
• Phase Two. Evaluate data to identify cost-efficient options for reducing<br />
water use. Collect supporting information, including the proximity and quality<br />
of alternative water sources and capital projects. Based on these analyses,<br />
set water reduction targets.<br />
• Phase Three. Prioritize and implement a schedule for achieving targets,<br />
beginning with the most affordable and least disruptive steps. In addition,<br />
the <strong>MTA</strong> should assess the value of joining the DEP automatic meter<br />
reading initiative.<br />
Recommendation 2. Improve the Efficiency of Vehicle Washes<br />
Washing vehicles represents about a fifth to a third of the <strong>MTA</strong>’s water<br />
use. <strong>MTA</strong> agencies should make greater use of stormwater, as is already<br />
done at the Corona Maintenance Shop. <strong>The</strong> <strong>MTA</strong> should consider the<br />
following steps for wash facilities and operations:<br />
• Minimizing wash cycles and detergents, reducing wash frequency,<br />
cutting the amount of rinse water, shorter wash cycles, lower pump<br />
capacities, and using alternative water sources.<br />
• Using advanced wash water treatments, such as: automated bus<br />
washing, water quality sensors and automation, multimedia filters,<br />
and chemical coagulants.<br />
• Using nonpotable water, such as treated groundwater to wash buses.<br />
Recommendation 3. Improve Stormwater Control and Reduce<br />
Stormwater Runoff<br />
Uncontrolled runoff from storms can overwhelm sewer systems, causing<br />
Combined Sewer Overflows (CSOs) and polluting waterways. Climate<br />
change is likely to exacerbate these problems, as discussed in the Climate<br />
Adaptation chapter of this report. In response, the Commission recommends<br />
that the <strong>MTA</strong> improve management of stormwater on <strong>MTA</strong> roofed<br />
facilities, parking lots, and other non-permeable properties, targeting a<br />
25 to 50 percent reduction in storm runoff by 2020. <strong>The</strong> Commission<br />
recommends the following steps.
Green Ideas from <strong>MTA</strong> Employees<br />
All <strong>MTA</strong> agencies should use<br />
hot/cold water coolers that<br />
filter tap water instead of<br />
purchasing drinking water,<br />
where feasible. This would<br />
result in cost, storage and<br />
transportation savings plus added carbon emissions<br />
reductions for the <strong>MTA</strong>.<br />
– Patricia McDonnell-Riggio, Long Island Bus<br />
• Phase One. Map stormwater flows, outfalls, and sewershed on and near <strong>MTA</strong><br />
properties. Identify properties where stormwater drains to both storm sewer and<br />
waste sewer systems. <strong>The</strong>se facilities should be prioritized for retrofits to maximize<br />
the on-site retention and flow management.<br />
• Phase Two. Develop design guidelines for new facilities and renovations,<br />
specifying stormwater management systems and minimizing impervious surfaces.<br />
• Phase Three. Develop ways to minimize stormwater discharge from parking<br />
lots and other impervious surfaces into the regional water systems, while also<br />
controlling pesticides, fertilizers, salt, and other pollutants in runoff.<br />
Recommendation 4. Set an <strong>MTA</strong> Agenda for Ecosystem and Wetlands<br />
Management<br />
Since many <strong>MTA</strong> facilities, properties and rights-of-way border forestland, watersheds, and wetlands crucial to regional<br />
water systems with important scenic, ecological, and recreational values, the <strong>MTA</strong> should develop more explicit guidelines<br />
for land and wetlands protection. <strong>The</strong> first steps are to educate the <strong>MTA</strong> workforce, identify proximate ecosystems and<br />
wetlands, and collect best practices for ecosystem wetlands protections, including control of runoffs, catching toxins,<br />
and other steps that apply generally to stormwater management. <strong>The</strong> Commission recommends that the <strong>MTA</strong> approach<br />
wetlands with more explicit commitments and schedules developed along with community and governmental partners.<br />
• Phase One. Work with NYC Department of Environmental Preservation (DEP) and NYS Department of Environmental<br />
Conservation (DEC) to identify and map critically important ecosystem wetlands adjacent to <strong>MTA</strong> properties, then commit<br />
to a protection plan. Work with both agencies to integrate guidelines for ecosystem and wetlands management, including<br />
impact on coastal lands and waters.<br />
• Phase Two. Partner with public and non-governmental entities on land preservation, ecosystem conservation enhancement<br />
and related projects, such as a pilot study with Queens College to improve water quality in the Flushing Bay watershed<br />
near Corona Park, the protection of high-priority coastal properties in the <strong>MTA</strong> service area, and a project with NYC<br />
DEP to develop an ecological design for a tidal wetlands area near the <strong>Metro</strong>-North’s Spuytin Duyvil train station.<br />
Recommendation 5. Improve Water Fixtures and Conservation at <strong>MTA</strong> Facilities<br />
<strong>The</strong> <strong>MTA</strong> should continue to expand and systemize its effort to improve water conservation at facilities, through waterefficient<br />
designs, water-saving fixtures, and employee programs. One simple approach would be to adopt the EPA “Water<br />
Sense” certified fixtures, a program similar to the Energy Star program. In addition, the <strong>MTA</strong> should increase the use of<br />
low-flow or no-flow fixtures, such as waterless urinals, systems for recycling flushed water, blue roofs (rainwater-retentive<br />
roofs), water-smart landscaping, and other facilities-level conservation measures. Also, as the Commission stated in its<br />
Interim <strong>Report</strong>, the <strong>MTA</strong> should encourage the use of local drinking water by its 70,000 employees to minimize bottled<br />
water consumption.<br />
ACHIEVEMENTS TO DATE<br />
Washing the <strong>MTA</strong>’s enormous vehicle fleets requires millions of gallons of water weekly. By harvesting rainwater and<br />
recycling greywater, the <strong>MTA</strong> minimizes the use of potable water and the impact on the city sewer system. Water management<br />
features at new facilities such as the LEED-certified Corona Maintenance Shop are cutting potable water consumption<br />
using a rainwater capture system and wash-water recycling.<br />
55
56<br />
Climate Adaptation<br />
Preparation for rising sea levels, storms, and other climate changes<br />
Climate change policies are frequently divided into two<br />
categories: mitigation and adaptation. Mitigation refers<br />
to policies intended to reduce carbon emissions and other<br />
GHGs, the primary cause of global warming. Mitigation<br />
policies constitute the primary focus of the Commission’s<br />
work and the substance of this report. Adaptation, as the<br />
term implies, refers to organizational planning, modification<br />
of built assets, and increased operational preparedness to<br />
address the anticipated effects of climate changes already<br />
underway. <strong>The</strong>se are the topics briefly described in this chapter.<br />
While the <strong>MTA</strong> network, like other legacy systems (London<br />
Underground and Paris <strong>Metro</strong>) is constantly adapting to a<br />
host of demographic, technological, and environmental<br />
changes, the onset of global warming due to rising levels<br />
of GHGs represents a new and potentially dire challenge,<br />
for which the <strong>MTA</strong> system is largely unprepared. A number<br />
of climate changes have been measured in the <strong>MTA</strong> service<br />
area, and altered weather patterns are already impacting the<br />
<strong>MTA</strong> infrastructure, primarily through increased storm activity<br />
and related flooding.<br />
After assessing the potential effects of climate change<br />
and the <strong>MTA</strong>’s level of preparedness, a team of climate and<br />
economics experts identified three key trends significantly<br />
impacting <strong>MTA</strong> operations: higher average temperatures,<br />
rising sea levels with related coastal surges, and increased<br />
storm activity with more severe precipitation events and<br />
related flooding. While long-term forecasts are imprecise,<br />
all three trends can already be measured in the <strong>MTA</strong> service<br />
area. In terms of average temperatures, models project<br />
increased summer highs, with the number of days over 100°F<br />
rising from an average of two days per summer before 1990<br />
to eight days per summer under low GHG emissions and up<br />
to 28 days under high GHG emissions around 2070. This<br />
trend will place added strain on vehicle and facility cooling<br />
systems, with corresponding demands on energy consumption<br />
and higher risks of power failures – issues that affect<br />
energy planning at all of the <strong>MTA</strong> agencies.<br />
Sea level rise (SLR) and the risk of related coastal storm<br />
surges are also on an upward trend in the <strong>MTA</strong> region.<br />
Regional SLR may approach or even exceed three feet in the<br />
current century, bringing increased risk to large portions of<br />
the <strong>MTA</strong> infrastructure. Recent evidence suggests that the<br />
severity of coastal storms may increase with warming ocean<br />
surface temperatures. Flood areas will definitely increase as<br />
a result of SLR, regardless of storm violence. <strong>The</strong> increased<br />
risk of storm surges will affect many areas of <strong>MTA</strong> operations,<br />
from emergency planning and facilities design to the protection<br />
of rolling stock and insurance programs. Since the <strong>MTA</strong><br />
coordinates emergency evacuation plans with New York<br />
City, adaptation to coastal storm surges must integrate<br />
evacuation plans with the relocation and protection of <strong>MTA</strong><br />
rolling stock and other assets during storms. Other obvious<br />
adaptation steps include inspection of existing or planned<br />
facilities within the expanded flood areas and reevaluation<br />
of the <strong>MTA</strong>’s internal “captive” insurance programs. Since<br />
<strong>MTA</strong> insurance risks are concentrated, outside insurance<br />
programs may offer better risk structuring. Because SLR will<br />
also elevate groundwater levels, plans for utilizing pumped<br />
groundwater as described in the Water Management chapter<br />
of this report can also have adaptation benefits.<br />
SLR and coastal surge risks will have their greatest impact<br />
on the <strong>MTA</strong> at subway system stations and tunnels below<br />
water level. Listed in the chart on page 58 are the subway<br />
lines with the lowest critical elevations measured in feet<br />
above the National Geodetic Vertical Datum 1929<br />
(NGVD/29). <strong>The</strong> lower the elevations, the more likely operations<br />
will be jeopardized by the SLR surge risks. Short-term<br />
adaptation strategies may include increased fixed-station<br />
pumping capacity, raised subway entrances, curbing and<br />
ventilation grates, and additional tunnel sealing. Long-term<br />
adaptation strategies could include sealing ventilation openings<br />
in high-risk sections of the subway and flood projection<br />
assessments for subway expansion projects currently in<br />
process. <strong>The</strong> creation of strategic storm barriers for the<br />
NYC harbor and estuary is a long-term possibility that may<br />
be evaluated with city, state, and federal agencies. <strong>The</strong> risks<br />
of increased rainfall and non-coastal rainstorms due to global<br />
warming would be similar to those posed by the SLR surge<br />
risks, with the most immediate impact on tunnels, tracks, and<br />
pumping capacities. Aside from the subway lines, other floodrisk<br />
points within the <strong>MTA</strong> system include Bridges and<br />
Tunnels Queens Midtown and Brooklyn-Battery tunnels; the<br />
Long Island Rail Road East River tunnels, Hunters Point<br />
Station, Long Beach Branch and Atlantic Avenue tunnels; the<br />
<strong>Metro</strong>-North’s Hudson and New Haven Lines; and a number<br />
of specific low-elevation bridges and causeways.<br />
Right: Tropospheric Ozone Impacts Global Climate Warming – Arctic Dissolve. Using the best available estimates of global emissions of gases that<br />
create ozone, the GISS computer model study reveals how much this single air pollutant and greenhouse gas has contributed to warming in specific<br />
regions of the world in 1990. Source: NASA/Goddard Space Flight Center Scientific Visualization Studio.<br />
1 An unabridged version of the paper that informed this chapter, <strong>MTA</strong> Adaptations to Climate Change – A Categorical Imperative, prepared by Klaus Jacob (Lamont-Doherty<br />
Earth Observatory) and Cynthia Rosenzweig, Radley Horton, David Major and Vivien Gornitz (Center for Climate Systems Research, Columbia University), can be found<br />
on the <strong>MTA</strong> website at www.mta.info/environment.
“To understand the challenge of Climate Adaptation,<br />
let me quote John F. Kennedy: <strong>The</strong>re are risks and costs to a<br />
program of action. But they are far less than the long-range<br />
risks and costs of comfortable inaction."<br />
– Klaus Jacob, Lamont-Doherty Earth Observatory,<br />
Columbia University1 Chair, Climate Adaptation Group<br />
1930 1950 1970<br />
1990<br />
57
58<br />
BASELINE<br />
<strong>The</strong> Commission’s adaptation study indicates that storm protections, facility redesigns, and other adaptation policies are<br />
currently being carried forward in an ad hoc manner by the various <strong>MTA</strong> agencies. <strong>The</strong> <strong>MTA</strong> has yet to develop a unified<br />
climate adaptation plan and lacks staff with specific expertise in climate projections and analysis. However, many of the<br />
recommendations in this report, particularly in the areas of energy-efficient cooling systems and water management,<br />
clearly have added value in terms of adaptation. Since flooding due to SLR, coastal surges, and increased rainfall are the<br />
most significant risks from climate change, the <strong>MTA</strong>’s current storm policies will also be useful for adaptation programs.<br />
In addition, the <strong>MTA</strong> is participating in three related government task forces: the New York State Sea Level Rise Task Force,<br />
the NYSERDA-sponsored ClimAID Project Task Force, and the New York City Climate Change Adapation Task Force. <strong>The</strong><br />
<strong>MTA</strong> is also coordinating strategies with Con Edison and other major regional partners. This report recommends that the<br />
<strong>MTA</strong> develop a comprehensive Climate Change Master Plan by 2015. <strong>The</strong> plan should integrate ongoing climate forecasts,<br />
emergency response plans, a decision-making matrix, extensive mapping of system elevations and flood risks, evaluation of<br />
facilities design, climate-risk assessment for TOD programs and expansion projects, target elevations for new construction,<br />
assessment of <strong>MTA</strong> insurance programs, and other adaptive strategies. Clearly, such strategies must be integrated into <strong>MTA</strong><br />
Capital Programs and coordinated with other public and governmental entities from the local to state and federal levels.<br />
<strong>The</strong> <strong>MTA</strong> has undertaken a thorough review of systemwide storm vulnerabilities and policies in response to the storm<br />
of August 8, 2007 (see August 8, 2007 Storm <strong>Report</strong> published September 2008, at www.mta.info). Remedial measures<br />
are being implemented and scheduled through an internal tracking system. <strong>The</strong> storm report lists 17 major initiatives,<br />
with more than two dozen projects that fall into three major categories: operations, engineering, and communications.<br />
In operations, projects include the establishment of early warning and response capabilities, procedures, and teams; the<br />
creation of an <strong>MTA</strong> emergency response center (ERC); and a revision of the agency storm operating protocol. <strong>The</strong> engineering<br />
initiatives include corrective engineering and procedural measures at some of the most notorious flood-prone locations,<br />
often involving close cooperation with and capital expenditures by the New York City DEP and DOT. Communications<br />
initiatives include a contract to install wireless communication capabilities that will allow the use of cell phones in subway<br />
stations. Six subway stations are scheduled to be cell-operational by the end of 2010 and all 270 underground stations<br />
should be cell-accessible by 2014. In addition, personnel at Long Island Rail Road, <strong>Metro</strong>-North Railroad and Bridges and<br />
Tunnels were equipped with additional communications devices to ensure communication redundancy in emergencies. <strong>The</strong><br />
storm-response measures, combined with climate trend projections and the agency surveys, provide a useful starting point<br />
for the <strong>MTA</strong>’s first systemwide climate adaptation strategies.<br />
No. of Days > 90°F<br />
In New York City<br />
Days per year over 90°F<br />
80<br />
60<br />
40<br />
20<br />
0<br />
No. of Days > 100°F<br />
In New York City<br />
Historic Emissions Higher Emissions Lower Emissions<br />
Forecast of number of days/year in New York City with temperatures exceeding 90 0 F (left) and 100 0 F (right) for<br />
different decadal periods and for two GHG emissions scenarios. <strong>The</strong> orange bar represents observed occurrences prior to<br />
1990. (Source: NECIA, 2006)<br />
Days per year over 100°F<br />
0<br />
1961-1990 2010-2039 2040-2069 2070-2099 1961-1990 2010-2039 2040-2069 2070-2099<br />
80<br />
60<br />
40<br />
20<br />
<strong>MTA</strong> Subway Lines<br />
Lowest Critical Elevations(LCEs)<br />
A C Lines 7.0 feet<br />
M NR Lines 7.5 feet<br />
1 Line 9.1 feet<br />
2 3 Lines 9.1 feet<br />
4 5 6 Lines 9.9 feet<br />
E F Lines 10.0 feet<br />
B Q Lines 12.7 feet<br />
Elevations measured in feet above the National<br />
Geodetic Vertical Datum of 1929 – NGVD’29.<br />
Source: Jacob et al. (2000) 2<br />
2 Jacob, K.H., N. Edelblum, and J. Arnold (2000). Risk Increase to Infrastructure due to Sea Level Rise. Sector <strong>Report</strong>: Infrastructure for Climate Change and a Global City:<br />
An Assessment of the <strong>Metro</strong>politan East Coast (MEC) Region. 58 pp. & Data Appendices. http://metroeast_climate.ciesin.columbia.edu/reports/infrastructure.pdf.
TRANSFORMATIONAL RECOMMENDATIONS<br />
Recommendation 1. Develop and Implement a Climate-Adaptation Decision-Making Matrix<br />
Over the next three to five years, the <strong>MTA</strong> should apply a climate-adaptation decision-making matrix/process to identify<br />
options for protecting vulnerable rapid transit infrastructure from storm surge, extreme heat, and other manifestations of<br />
climate change that have already occurred and cannot be mitigated by other strategies. In light of the scale of the climateadaptation<br />
risks and vulnerabilities for subway lines at or below sea level, commuter rail lines, and bridges and tunnels, the<br />
<strong>MTA</strong>, like other rapid transit agencies around the nation, must look to the states and federal government for financing to<br />
make long-term climate adaptation investments, many of which should ideally begin now, with significant adaptations<br />
completed or underway no later than 2030.<br />
Climate-Adaptation Decision-Making Matrix<br />
↑<br />
Value<br />
Risk →<br />
Low<br />
Medium<br />
Facilities that have a great impact on the system are deemed high-value and those that are low-lying or otherwise vulnerable<br />
are considered high-risk. For instance, an elevated station could be considered low-risk and, in the absence of a systemwide<br />
impact, considered low-value and may be placed in the bottom left-hand cell, whereas a trainyard on the water’s<br />
edge, with system-wide impact and vulnerability may be put into the top right-hand cell.<br />
NEAR-TERM RECOMMENDATIONS<br />
Recommendation 1: Adopt <strong>MTA</strong> Climate-Adaptation Policy Position<br />
By mid-2009, the <strong>MTA</strong> should have a basic adaptation policy in place. In effect, the policy should state the following.<br />
(1) <strong>The</strong> <strong>MTA</strong> is aware that adaptation to climate change is a necessity without which a stable, prosperous, and sustainable<br />
economy of the region and a reliable functioning of its transportation infrastructure cannot be achieved. (2) <strong>The</strong> <strong>MTA</strong> is<br />
committed to developing a strategic adaptation master plan with basic performance standards and milestones to achieve<br />
them. (3) <strong>The</strong> <strong>MTA</strong> will coordinate its adaptation efforts with those of other infrastructure operators, utilities, and local and<br />
regional planning efforts to foster a coherent action plan for the region, in which the transportation sector cannot proceed<br />
in isolation. (4) <strong>The</strong> <strong>MTA</strong> is committed to taking a leading role and setting a national example for making the largest mass<br />
transit system in the nation resilient to the challenges of climate change. (5) <strong>The</strong> <strong>MTA</strong> recognizes that both mitigation and<br />
adaptation strategies need to be balanced and pursued to achieve a sustainable future.<br />
Recommendation 2: Implement Operational Climate Change Database<br />
By the end of 2010, the <strong>MTA</strong> should have established a climate change database (or secured access to such a database).<br />
It should contain information on future trends of climate parameters, including but not limited to temperature, precipitation,<br />
floods, storms, and coastal storm surge patterns, as well as sea-level-rise (SLR) forecasts, for which it needs to undertake<br />
meaningful adaptation measures. <strong>The</strong> information should be in a form that provides a sound scientific-technical foundation<br />
for making the best strategic, operational, engineering, and management decisions for adaptation policies. Both mean<br />
trends and parameter variability (quantifying the magnitude and frequency of extreme weather and climate events) should<br />
be included. This compilation of climate forecasts should be updated on a regular basis at least every five years, or earlier<br />
when important new scientific data or forecasts become available. It should have enough spatial resolution, must serve the<br />
entire <strong>MTA</strong> service area, and should include forecasts out to at least 100 years and in some cases longer, to the extent that<br />
this is scientifically feasible. An essential part of the effort is to quantify the uncertainties by providing a measure of confidence<br />
for the provided forecasts and for different time horizons. <strong>The</strong> climate forecast data should be readily accessible to<br />
<strong>MTA</strong> staff, preferably online and in standard formats (where applicable for use in GIS or CAD applications) to allow ready<br />
use for day-to-day decisions. <strong>The</strong> <strong>MTA</strong> should partner with other infrastructure operators in the region to coordinate<br />
regional databases and may want to do this in cooperation with the NYC Climate Change Adaptation Task Force and its<br />
New York Panel on Climate Change (NPCC), or equivalent state-based efforts.<br />
High<br />
59
Recommendation 3: Complete a Quantitative Vulnerability and Risk Assessment<br />
By 2012 at the latest, the <strong>MTA</strong> should have completed a thorough, quantitative vulnerability and risk assessment of the<br />
system’s climate hazards, including the assets, facilities, operations, and income streams of the <strong>MTA</strong> operating agencies,<br />
as well as its centralized insurance program. This assessment should include the climate vulnerability of the existing systems<br />
and of all new capital projects in their various stages of construction or design. <strong>The</strong> vulnerability and risk assessment<br />
should be both scenario-based for typical expected events but must also be performed probabilistically to allow estimates<br />
of annualized losses integrated over the range of climate-event magnitudes and probabilities and over the current and<br />
planned range of all <strong>MTA</strong> assets and operations. <strong>The</strong> assessments should be made for the current asset inventory and for<br />
the inventory and climate conditions as projected for the 2020s and 2050s. For major system elements most vulnerable<br />
to SLR and coastal storm surge flooding, such as tunnels, rail beds, and subways near or below sea level, additional risk<br />
assessments beyond the 2050s to the end of this century should be produced.<br />
Recommendation 4: Develop a Climate Change Adaptation Master Plan<br />
By 2015, the <strong>MTA</strong> should have completed a strategic climate change adaptation master plan detailing how the <strong>MTA</strong><br />
envisions the transformation of its transit system to cope with the progressive demands from climate change, including<br />
cost estimates. <strong>The</strong> master plan should take into account the results originating from Recommendations 2 and 3 (climate<br />
database and vulnerability risk assessments, respectively) as a basis for arriving at optimal adaptation measures along<br />
various decision paths and time horizons, projecting out at least 100 years. Though the specificity of this master plan will<br />
decrease the further out the projections, the <strong>MTA</strong> will need some basis for fundamental decisions on long-term capital<br />
projects. In particular, the <strong>MTA</strong> will have to make complex decisions on whether those transit systems that rely on tunnels<br />
and rails now at or below sea level can be made resilient in their existing locations, or whether they may require a fundamental<br />
redesign and more elevated siting. If elevations are feasible and necessary, they must be planned to account for the<br />
continuing reach of SLR and expanding flood zones. Part of such a strategic master plan will be to decide whether or not<br />
the New York and New Jersey harbor estuary should and can be protected by storm surge barriers, and whether such barriers<br />
might fail under the most extreme storm conditions and eventually become ineffective and unsustainable. It should be<br />
noted, that portions of <strong>MTA</strong> mass transit systems operating in Brooklyn, Queens, and Long Island and in Westchester<br />
and Connecticut would not be protected by the barriers as currently conceived.<br />
Recommendation 5: Establish a Pre-Disaster Plan for<br />
Potential Future Sea Level Rise<br />
Post-Disaster Redevelopment (PDP-PDR)<br />
<strong>The</strong> Battery, NYC<br />
By 2015, the <strong>MTA</strong> should establish a framework Pre-Disaster<br />
3 Ft<br />
80<br />
Plan for Post-Disaster Redevelopment (PDP-PDR), in concert<br />
with local, state, and federal governments and with input from<br />
60<br />
2 Ft communities and the public and private sectors. While an earlier<br />
40<br />
completion date is desirable for a PDP-PDR internal to the <strong>MTA</strong>,<br />
1 Ft such plans need to go far beyond the <strong>MTA</strong>’s principal mission to<br />
20<br />
provide efficient, safe, reliable, and affordable public transporta-<br />
0<br />
tion to the region. Apart from dealing with scientific, technical,<br />
2000 2020 2040 2060 2080 2100 and engineering issues, basic land use, urban design, economic<br />
Year<br />
and social issues are at stake. For this reason a PDP-PDR may<br />
have to be developed in conjunction with the regional adaptation<br />
master plan of Recommendation 4. Again, the opportunities<br />
Range of projected local sea level rise (SLR) for New York City as<br />
provided in conjunction with PlaNYC and other initiatives should<br />
optional input for precautionary planning purposes. <strong>The</strong> different<br />
lines represent projections for various atmospheric greenhouse gas be used as far as possible. <strong>The</strong> purpose of the PDP-PDR is to<br />
scenarios and climate models. <strong>The</strong> orange band depicts a range of transform a disaster into a one-time opportunity for collecting<br />
optional SLR planning scenarios during this century, implying 2ft<br />
information and realizing design and planning gains which are<br />
SLR as a minimum scenario, and 3 ft by the end of this century as<br />
precautionary target planning scenario.<br />
less achievable in advance through incremental steps. Without<br />
(Source: Modified from Jacob et al, 2007).<br />
such institutional preparedness, the learning opportunities an<br />
actual disaster provides can be easily squandered.<br />
Recommendation 6: Create an Adaptation Priority Task Force (APT)<br />
By mid-2009, the <strong>MTA</strong> should establish an Adaptation Priority Task Force (APT) that identifies unique opportunities for<br />
adaptation measures. Some current and ongoing projects may provide unique one-time opportunities for new construction<br />
during the operational maintenance cycle, or during the ongoing design and planning stages of capital projects to which<br />
the <strong>MTA</strong> is currently committed. Such critical opportunities to include adaptation measures to the extent still possible<br />
60<br />
Sea Level Rise (cm)
should not be missed. <strong>The</strong> Adaptation Priority Task Force should act on a fast track and must not be held back by the<br />
more fundamental and time-consuming initiatives proposed under Recommendations 2 to 5, although APT must establish<br />
a strong working liaison with these other initiatives.<br />
Recommendation 7: Assign an <strong>MTA</strong>-Internal Adaptation Team (AT)<br />
<strong>The</strong> <strong>MTA</strong> should assemble a designated internal Adaptation Team (AT). This can be done immediately and should be<br />
completed by March 2009. <strong>The</strong> AT has a twofold purpose. First, it should represent the <strong>MTA</strong> outside its institutional and<br />
regional jurisdictions in efforts to determine policies, performance standards, research projects, and so forth that serve the<br />
needs of diverse stakeholders in the region. <strong>The</strong> second objective of the AT will be to perform a much-needed interface<br />
and educational role among the <strong>MTA</strong> agencies. <strong>The</strong> AT should partner with experts in academia, professional organizations,<br />
and technical fields for these “in-reach” efforts. <strong>The</strong> AT will need an operating budget and established goals for its activities<br />
not later than mid-2009. It should be operative for a period of at least three years and be reviewed in its third year for<br />
possible continuation depending on its achievements and effectiveness, and on the challenges that still need to be tackled.<br />
Recommendation 8: Prepare Adaptation/Mitigation Cross-Impact Checklists<br />
Each mitigation project the <strong>MTA</strong> undertakes needs a checklist indicating how it affects adaptation according to short- and<br />
long-term horizons. Each adaptation project needs a checklist to show how it enhances or hinders mitigation and energy<br />
conservation efforts and improves environmental performance. Depending on identified adverse cross-impacts, the project<br />
designs and implementation plans must seek modifications to strike a well-justified, documented balance if the outcomes<br />
are still mutually incompatible and no viable alternatives can be found.<br />
Recommendation 9: Implement Climate Adaptation Resiliency Evaluation Procedure (CARE Trigger Elevation)<br />
By the end of 2009, the <strong>MTA</strong> should establish, preferably in concert with local governments, a procedure called CARE<br />
(Climate Adaptation Resiliency Evaluation). It would be triggered when any new projects or major alterations are undertaken<br />
where critical structural components are located in present or potential coastal surge flood zones. <strong>The</strong> procedure would be<br />
triggered at a given Elevation X to be formulated, probably at not less than 15 feet above the mean-lower-low-watermark<br />
(MLLW), for example in the year 2000 at the Battery tide gauge. A trigger elevation substantially higher than 15 feet, at<br />
least for some regions of high risk exposure, may be advisable based on precautionary principles. <strong>The</strong> <strong>MTA</strong> should promote<br />
the development of CARE procedures and guidelines internally and externally, recommend its usage in Smart Growth/TOD<br />
projects, and should definitely adopt the CARE procedures for all <strong>MTA</strong> projects and in-house planning.<br />
Recommendation 10: Provide Visible <strong>MTA</strong> Leadership on Climate Change Issues<br />
<strong>The</strong> <strong>MTA</strong> should assume a highly visible leadership role in tackling the enormous challenges of adaptation. It should take a<br />
strong stand on climate change issues on the local, state, federal, and even global levels. It should be consistent and forceful<br />
in pursuing adaptation and mitigation policies, becoming a national voice on behalf of the country’s vital infrastructures,<br />
particularly in urban centers. It should seek institutional credibility through strong implementation of such policies, while<br />
balancing limited resources in pursuit of either mitigation or adaptation strategies. <strong>The</strong> <strong>MTA</strong> has made a clear start by<br />
enlisting the Blue Ribbon Commission on Sustainability and the <strong>MTA</strong>. This marks an important beginning. Achieving<br />
adaptation measures for the New York metropolitan region will demand the energy, innovation, and leadership characteristic<br />
of New Yorkers. <strong>The</strong> <strong>MTA</strong> can and must lead in preparing for this unavoidable and critical challenge.<br />
SUMMARY FINDINGS AND NEXT STEPS<br />
Without an adequate investment in adaptation measures, climate change will have even greater adverse impacts on the<br />
<strong>MTA</strong>’s vital infrastructure, operations, and revenue streams in the future. <strong>The</strong> chief risks to the metropolitan region and the<br />
<strong>MTA</strong> service area stem from more extreme heat and precipitation events, coastal storms and storm surges, flooding, and,<br />
in the longer term, rising sea levels. Preparation will mean a forward-looking plan for necessary redesigns, construction<br />
programs, and changes to operational procedures, including emergency preparedness. As such, the <strong>MTA</strong> will need to<br />
institutionalize adaptation measures over a wide range of operations and facilities. <strong>The</strong> most immediate threat will come<br />
from increased storm surges and SLR encroaching on existing facilities, especially those below sea level.<br />
<strong>The</strong> <strong>MTA</strong> should have a climate change adaptation master plan in place by 2015, one that includes realistic time tables<br />
and financing options. As it assesses the 10 recommendations above, the <strong>MTA</strong> should proceed to harden its system<br />
against more severe storms through regular maintenance and capital expenditures, while recognizing that major capital<br />
expenditures will be required to safeguard the system by or before 2050.<br />
61
Strategy for the 21st Century<br />
Legislative and Policy Recommendations<br />
63
64<br />
Strategy for the 21st Century Legislative and Policy Recommendations<br />
This chapter outlines a sustainability action agenda for<br />
federal, state, regional, and local decision-makers. It identifies<br />
legislative and policy actions which the Commission<br />
believes will be necessary to assure the sustainability and<br />
future well-being of the <strong>MTA</strong> network and the New York<br />
metropolitan area. In addition to these recommendations,<br />
the Commission strongly supports the findings and recommendations<br />
of the Ravitch Commission, which will be critical<br />
to the financial viability of the <strong>MTA</strong> transit network. This<br />
Commission joins the Ravitch Commission in calling for<br />
significant increases in transit funding and investment.<br />
Such investments will be crucial if the New York metropolitan<br />
area is to retain its high levels of productivity and its<br />
position as a global economic power.<br />
At present, our national infrastructure investments lag far<br />
behind those of our global competitors. <strong>The</strong> United States<br />
is currently investing only 2.4 percent of GDP in major infrastructure<br />
initiatives, as compared to 5 percent in Europe and<br />
9 percent in China. 1 In addition to maintaining competitive<br />
advantage in the future, more robust transit funding will also<br />
help to stimulate the regional job growth and economic<br />
activity needed to meet the present financial crisis. David<br />
Lewis' initial assessment of the current recommendations<br />
FEDERAL GOVERNMENT’S ROLE<br />
described in this report indicate a possible yield of 105,500<br />
net new jobs per year, employment income of $5.1 billion a<br />
year, and regional economic output of $17 billion per year<br />
for the period from 2010 to 2019. <strong>The</strong>se figures reinforce<br />
recent economic analyses conducted by the <strong>MTA</strong> and the<br />
Port Authority of New York and New Jersey which indicate<br />
that every $1 billion in <strong>MTA</strong> capital spending generates an<br />
estimated 8,500 jobs, $440 million in total wages, and<br />
$1.5 billion in total sales or economic activity in New York<br />
and the surrounding region.<br />
<strong>The</strong> time to pursue this important agenda is now. We now<br />
have a clear convergence of priorities at every level of government.<br />
President Obama’s environmental commitments<br />
and his stated focus on infrastructure investment are<br />
matched by the strong environmental records and economic<br />
priorities of Governor Paterson, Governor Rell, and Mayor<br />
Bloomberg, creating an unprecedented opportunity to<br />
advance an ambitious sustainability agenda. <strong>The</strong><br />
Commission believes that the legislative and policy actions<br />
recommended in this chapter will not only strengthen and<br />
green the <strong>MTA</strong> system, they will have a positive, lasting<br />
impact on sustainability and economic recovery – regionally,<br />
nationally, and globally.<br />
1. Establish new funding sources for transit.<br />
• Pass a green infrastructure stimulus bill with a large allocation to mass transit and renewable energy projects.<br />
Investments should target 21st century transit and renewable energy projects in major metropolitan areas. Priority should<br />
be given to new projects that can demonstrate climate-stabilization benefits and high priority “state-of-good-repair”<br />
projects that extend the useful life of existing infrastructure, safeguarding these major public investments.<br />
• Pass a climate/energy bill establishing a market for carbon emissions avoidance, allocating at least 25 percent of auction<br />
revenues to transit. Institute rules to define carbon avoidance as a measurable, verifiable, and tradeable commodity. For<br />
the <strong>MTA</strong>, carbon avoidance results from: (1) avoided car trips through mode-shift from automobiles to transit; (2) reduced<br />
traffic congestion, which reduces tailpipe emissions from idling and stop-start traffic; and (3) denser land-use patterns,<br />
which shorten the distances and travel times between daily destinations.<br />
• Raise the federal gas tax by 40 cents over the next five years, index it to inflation and fund the transition to a mileagebased<br />
user fee. <strong>The</strong> federal gas tax should be increased 8 cents per gallon per year for the next five years and then be<br />
indexed to inflation. Although not a long-term solution based on a concerted effort to move away from carbon-based<br />
transportation solutions, gas tax revenues will remain a critically important transportation funding source for at least the<br />
next 10 years. Commit a portion of the new revenues to fully developing the technologies and policies that will enable the<br />
implementation of a mileage-based user fee.<br />
• Allow transportation projects to receive funding through other federal bills in areas such as housing and the environment.<br />
Align federal capital investments in housing and other infrastructure to compliment sustainable transportation goals and<br />
objectives.<br />
1 <strong>The</strong> Cracks are Showing, Economist, June 26, 2008.
2. Authorize the next federal transportation bill at $1 trillion for 2010-2015.<br />
• Create a robust state-of-good-repair program. Target the rehabilitation and preservation of existing infrastructure<br />
investments in areas where the environmental and economic benefits are the greatest.<br />
• Reform the way in which funds are distributed. Move away from formulas and categories toward objectives and<br />
outcomes. Prioritize funding for green climate mitigation and adaptation projects in smart-growth locations in metropolitan<br />
areas in order to achieve environmental, economic, and equity goals.<br />
• Develop performance measures that recognize existing conditions. <strong>Transit</strong> investments in densely developed areas with<br />
a high transit-mode share serve to maintain existing densities and ensure riders do not divert to auto use. Measures must<br />
account for projects in these areas as well as projects aimed at attracting new riders and/or development.<br />
• Incentivize regional coordination, intermodal projects, and pricing. Provide incentives for the planning and development of<br />
regional transportation services which connect multiple jurisdictions and systems. Encourage pricing strategies to generate<br />
revenues and manage demand.<br />
• Streamline federal processes and procedures. Guarantee that authorized funds are appropriated annually by October 1<br />
and then received in a timely manner through enforceable timelines for grant review.<br />
• Require transit agencies seeking federal funds to commit to a baseline of green standards. <strong>The</strong> American Public Transportation<br />
Association (APTA) should work with the <strong>MTA</strong> and other transit agencies to develop these minimum standards.<br />
3. Pass a federal version of California’s SB 375, which links efficient land use with transportation infrastructure<br />
investment in order to reduce GHG emissions.<br />
A federal version of this bill would: (1) establish GHG reduction targets for metropolitan areas; (2) require regions to develop<br />
a land-use pattern and a transportation network that achieve the necessary reductions in emissions from cars and light<br />
trucks; and (3) provide federal infrastructure funding as an incentive for metropolitan areas to implement the regional plans.<br />
<strong>The</strong> bill should take into account conditions in New York City of existing high density and existing high transit mode share.<br />
4. Provide leadership and funding for climate adaptation.<br />
Establish a lead federal agency to coordinate federal, state, and local efforts and funding for climate adaptation plans,<br />
programs, and strategies.<br />
5. Increase the monthly commuter tax benefit to $230 per month for commuters using transit and index both the<br />
transit and parking benefits to inflation.<br />
Increasing the allowable tax-free amount to $230 per month for transit commuters will create equity between transit and<br />
commuter parking pre-tax benefits. This increase will provide a greater incentive for employers to offer pre-tax commuter<br />
benefits and for more employees to utilize these programs. <strong>The</strong> <strong>MTA</strong> will benefit by increasing revenues and lowering the<br />
costs associated with cash handling and individual fare transactions. <strong>The</strong> region’s employers also benefit through additional<br />
payroll tax savings.<br />
6. Provide incentives to lenders and financial institutions that offer Location-Efficient Mortgages (LEMs).<br />
LEMs use available transportation-related savings and flexible qualifying ratios to add thousands of dollars of home buying<br />
power to the budgets of people looking for homes well-served by transit—in what have been called “location efficient”<br />
communities. If homebuyers purchase homes in areas that are well served by transit, they are assumed to be saving money<br />
by foregoing auto expenses. This money is counted as income, thus allowing them to qualify for a mortgage and buy<br />
housing closer to transit. LEMs can be structured in various ways including lower interest rates or better debt-to-equity<br />
ratios and better down-payment terms.<br />
By increasing housing opportunities in location-efficient communities, LEMs achieve three main environmental goals: (1)<br />
they reduce fuel consumption; (2) they decrease the demand for sprawling developments and new road infrastructure; and<br />
(3) they lower pollution from automobiles. Additionally, LEMs are an excellent opportunity to make affordable housing<br />
available to more people.<br />
65
66<br />
7. Provide incentives to developers who design and construct to LEED-Neighborhood Development (ND) Standards<br />
and achieve a Gold rating.<br />
LEED standards, including LEED-ND, do not adequately account for the greening effects of transit and should be modified<br />
to reflect the strong per-capita GHG reduction that transit generates.<br />
8. Modify and/or expand existing funding programs to increase funding for transit.<br />
• Based on the growing demand for transit and high ridership levels, more resources from Section 53072 and 53093 programs are needed for maintenance, routine replacement, and expansion projects. <strong>The</strong>se programs provide guaranteed<br />
funding for transit.<br />
• Congestion Mitigation Air Quality (CMAQ). <strong>The</strong> eligibility should be revised so that vehicle miles traveled (VMT) reduction<br />
is not the sole criterion. Certain types of transit projects should be automatically eligible for CMAQ if significant transit<br />
mode share is demonstrated. Public transit benefits air quality and should be eligible for any funds whose objective is to<br />
improve the environment.<br />
• Surface Transportation Program (STP). Additional funding for enhancement programs under STP could be used for bike,<br />
pedestrian, and transit station access improvements.<br />
9. Reform federal processes and procedures to advance the <strong>MTA</strong>’s federally-funded transit projects as expeditiously<br />
as possible.<br />
<strong>The</strong> Commission recognizes the importance and necessity of federal oversight, but in some cases, processes and procedures<br />
should be revised so that projects can advance as quickly as possible in order to provide sustainability benefits to the New<br />
York metropolitan region.<br />
• Expand the categorical exclusion list to include more transit projects. All federally funded projects are subject to the<br />
National Environmental Policy Act (NEPA), which requires project sponsors to consider the environmental impacts of their<br />
proposed actions. Categorical exclusions (CEs) are projects that, based on past experience, do not individually or cumulatively<br />
have significant environmental impacts. <strong>The</strong>se projects require neither an environmental assessment nor an environmental<br />
impact statement and can move ahead more quickly. <strong>The</strong> list should be expanded to include the rehabilitation of<br />
transit stations and other facilities that do not require additional property. This addition will align the list of categorically<br />
excluded transit projects with the list for highway projects, which includes improvements to existing rest areas and truck<br />
weigh stations, where no additional property is needed.<br />
• Develop single regulatory process for multi-modal projects. A single process for the Federal <strong>Transit</strong> Administration (FTA)<br />
and Federal Highway Administration (FHWA) to follow for multi-modal projects will allow for faster implementation of<br />
projects that provide connections between modes and highway projects that include a transit component. Better connections<br />
between modes will encourage transit use.<br />
• Make procedural changes to expedite grant awards for state-of-good-repair projects. Minor procedural adjustments<br />
would allow for more timely grant awards. FTA should not wait to begin reviewing grants online while required project<br />
documents (e.g., project management plans, force account plans) are being completed. <strong>The</strong>se documents can be reviewed<br />
on a parallel track. When a project is funded through multiple grants, FTA should allow grantee to refer to FTA Quarterly<br />
<strong>Report</strong>s and/or prior grants for basic project description information. Concurrent internal review of grants by FTA departments<br />
would allow for more timely grant approval. When grants are not approved in a timely manner, they must be updated<br />
continually and re-reviewed by FTA.<br />
• Make procedural changes to the New Starts/Small Starts project development process that would decrease approvalrelated<br />
delays. <strong>The</strong> FTA’s New Starts program provides discretionary funding for major capital investment transit projects,<br />
such as <strong>MTA</strong>’s Second Avenue Subway and East Side Access projects. <strong>The</strong> FTA has developed detailed eligibility criteria to<br />
ensure that only the most meritorious projects receive New Starts funding. Project information is reviewed and approved at<br />
several points during design before final funding commitment from the FTA is granted. Because the cost of delay is particularly<br />
acute for large-scale construction projects, the New Starts process should be adjusted so that work never has to come<br />
to a stop while a project awaits an FTA approval. <strong>The</strong> Commission is confident this can be done without compromising the<br />
FTA’s ability to ensure compliance. For example, a single joint (FTA/grantee) risk assessment could be conducted prior to<br />
project grant agreement, replacing multiple risk assessments at different points of design.<br />
2 Section 5307 makes federal resources available for transit capital investments to urbanized areas with population over 50,000.<br />
3 Section 5309 provides capital assistance for fixed guide way modernization, bus and bus facilities and major capital investments (New Starts/Small Starts).
• Make changes to the New Starts/Small Starts project eligibility criteria. <strong>The</strong> criteria should be expanded to encourage<br />
TOD, pedestrian and bike links, and multi-modal transit systems. A “warrants” approach should be applied so that projects<br />
in areas with high existing population/employment density do not need to prove environmental benefits.<br />
• Expand the list of projects that can advance in event of an air quality conformity lapse. <strong>The</strong> Clean Air Act establishes<br />
target levels for specific pollutants for designated future years. Reaching these conformity targets is a condition of federal<br />
funding and the responsibility of <strong>Metro</strong>politan Planning Organizations (MPOs), which use a computer model to project<br />
future pollutant levels in their regions. If the model shows that any of the conformity targets are not anticipated to be met<br />
(a “conformity lapse”), the region must adjust the mix of projects in order to meet the targets. Under current regulations,<br />
only in-kind replacement projects may proceed in the event of a conformity lapse. Since transit is beneficial to regional air<br />
quality, additional transit projects should be allowed to advance as well. While all efforts should be made to ensure a<br />
conformity lapse does not occur, in the event of a lapse, transit projects that enhance capacity, convenience, and/or<br />
reliability should be allowed to proceed since they make transit a more attractive travel option.<br />
TEN REGIONAL GREENHOUSE GAS INITIATIVES (RGGI) STATES’ ROLE<br />
1. Establish a multi-state regional gas tax with the revenues dedicated to transit.<br />
Institute the first regional gas tax by using the framework of cooperation and governance established by the states participating<br />
in the first mandatory, market-based effort to reduce greenhouse gas emissions in the United States. A regional<br />
approach to the gas tax takes away the competitive disadvantage problem that might exist when a state institutes a tax on<br />
its own. <strong>The</strong> ten RGGI participating states are Connecticut, Delaware, Maine, Maryland, <strong>Mass</strong>achusetts, New Hampshire,<br />
New Jersey, New York, Rhode Island and Vermont. If successful, look to expand this model to additional states and the<br />
eastern provinces of Canada.<br />
STATE OF NEW YORK’S ROLE<br />
1. Establish new funding sources for transit.<br />
• Pass a Regional Mobility Tax to provide funding to the <strong>MTA</strong>. Pass legislation to enact a Regional Mobility Tax of one-third<br />
of 1 percent of wages paid in the 12-county <strong>MTA</strong> service area, as recommended by the Ravitch Commission. <strong>The</strong> proceeds<br />
of this tax would be dedicated to funding the <strong>MTA</strong>.<br />
• Authorize tolling and variable pricing strategies to fund transit. Pass legislation, also called for by the Ravitch Commission,<br />
to authorize state authorities and public benefit corporations with transportation responsibilities and cities to implement a<br />
range of tolling and variable pricing strategies as a means of reducing traffic congestion, improving air quality, and raising<br />
critical funds needed for transit. Legislation should specify that revenues in excess of operating and maintenance costs of<br />
the systems and/or crossings will be designated for transit improvements and expansion, in line with the recommendations<br />
of the Ravitch Commission.<br />
• Encourage the use of pension funds and endowments to fund transit projects. Explore socially responsible policies and<br />
practices of state and city pension funds, endowments of universities, foundations, and other entities as potential funding<br />
sources. This could include the dedication of between 0.5 percent to 2 percent of fund portfolios be invested in bonds to<br />
fund <strong>MTA</strong> sustainability projects. Consider supporting legislation that requires such investments.<br />
• Allocate Regional Greenhouse Gas Initiative (RGGI) auction revenues to VMT reduction strategies, including transit.<br />
Dedicate a portion of the proceeds from auction revenues to VMT reduction strategies annually.<br />
• Establish a clean air surcharge. Create a clean air surcharge and/or increase the annual vehicle inspection fee (safety and<br />
emissions fees) to compensate for carbon emissions created from owning a car or light truck. A surcharge or fee could be<br />
charged on a flat-fee rate, or on a sliding scale based on vehicle mileage, vehicle weight, engine type, and resultant emissions.<br />
<strong>The</strong>se revenues would be collected from vehicles within the region and dedicated to the <strong>MTA</strong>.<br />
67
68<br />
2. Pass legislation that will put an enforceable limit on statewide greenhouse gas (GHG) emissions.<br />
<strong>The</strong> bill should require that the limit would not be greater than statewide emissions for the year 2000 and that the<br />
statewide limit be reduced each year in order to reach 80 percent below the 2000 level by 2050. <strong>The</strong> Department of<br />
Environmental Conservation (DEC) should be charged with adopting regulations to require the reporting and verification<br />
of statewide GHG emissions and monitoring and enforcing compliance with this program. <strong>The</strong> use of both regulatory<br />
and market-based approaches should be encouraged to achieve the reduction levels necessary. <strong>The</strong> emissions reductions<br />
needed in the transportation sector to reduce statewide levels will in effect steer investment in and promote use of transit.<br />
It should be pointed out that the overall reduction goal may result in an increase in mass transit emissions.<br />
3. Pass legislation to link efficient land use with transportation infrastructure investment in order to reduce<br />
statewide GHG emissions by adapting California’s SB 375 for New York.<br />
<strong>The</strong> need for higher density development and more efficient land use, which leads to less driving, will be critical to reaching<br />
statewide GHG reduction targets. This bill would do the following: (1) establish regional GHG reduction targets; (2) require<br />
regions to develop a land-use pattern and a transportation network plan that achieves the necessary reductions in emissions<br />
from cars and light trucks; (3) provide state infrastructure funding as an incentive for cities and counties to implement the<br />
regional plans; and (4) make improvements to environmental review processes for more compact development projects<br />
that conform to the regional plan. <strong>The</strong> bill should take into account conditions in New York City of existing high density<br />
and existing high transit mode share.<br />
4. Pass legislation to reform the Tax Increment Financing (TIF) law to promote greater use of TIF for developments<br />
near transit.<br />
TIF is a way to utilize the increased tax revenues that will come from redeveloped properties within a defined district to pay<br />
for the costs of infrastructure improvements. TIF has not been used in New York as widely as in other states because<br />
increases in school property taxes are excluded in the current legislation. Reforming New York State’s General Municipal<br />
Law to allow school districts to include all or some portion of the school tax increment in the funding formula would enable<br />
widespread use of TIF as a tool for financing infrastructure improvements. Additionally, the criteria for defining TIF development<br />
districts and eligible projects should be amended to increase its applicability for use on projects concentrated near<br />
transit.<br />
5. Create an <strong>MTA</strong> Regional Bus Authority (RBA) responsible for comprehensive and coordinated bus service<br />
throughout the <strong>MTA</strong> service territory.<br />
<strong>The</strong> purpose of the RBA would be to integrate existing disparate services resulting in a more seamless and efficient regional<br />
bus system. This action would authorize but not require counties or other government entities within the <strong>MTA</strong> District to<br />
enter into agreements to have <strong>MTA</strong> run services on their behalf. <strong>The</strong> RBA would accelerate the implementation of Bus<br />
Rapid <strong>Transit</strong> (BRT) services throughout the region as well as coordinate routes, schedules, and fares more closely with the<br />
commuter railroads and other transit options to improve service levels. <strong>The</strong> RBA, a key proposal of the Ravitch Commission,<br />
is essential if New York City and the region expect to reap the full benefits of smart growth policies and TOD.<br />
6. Develop a state-sponsored partnership program with the <strong>MTA</strong>, counties, and local municipalities to fund<br />
development and ongoing operation of transit feeder and distributor services.<br />
This program will provide funding for improving access and connections to transit, especially in areas with existing lowdensity<br />
development. By improving feeder systems (buses, shuttles, trolleys, ferries, vans, etc.) to commuter rail stations<br />
as well as distributor systems from stations to employment centers, it will address the “last mile” problem. This initiative<br />
should consider all aspects of improving transit connections, including: types of vehicles; scheduling; fares; the provision of<br />
real-time customer information and way-finding signage; the condition and quality of bus stops, shelters, and stations; and<br />
car sharing and car pooling systems.<br />
Additionally, local projects that improve transit and station access through sidewalks, “smart streets,” and pedestrian<br />
ways, bike lanes and paths; bike parking; park and ride lots; and roadway improvements should be a part of this effort.<br />
This program will: (1) increase transit use; (2) help alleviate the growing demand for commuter rail parking; and<br />
(3) prevent environmentally damaging automobile “cold starts” and short auto trips to rail and/or bus stations.
7. Through Governor Paterson’s Smart Growth Cabinet, work with the <strong>MTA</strong> to establish a regional <strong>Transit</strong>-Oriented<br />
Development (TOD) program that would provide leadership, funding, and incentives to encourage development<br />
near transit within <strong>MTA</strong>’s service area.<br />
<strong>The</strong> Smart Growth Cabinet should:<br />
• Work with the <strong>MTA</strong> to identify <strong>Transit</strong> Development Districts which would serve as state designated areas to focus<br />
TOD resources and efforts.<br />
• Ensure that State investments are coordinated to promote economic development and growth in <strong>Transit</strong> Development<br />
Districts by giving transit supportive projects priority over investments which facilitate sprawl.<br />
• Identify and allocate new and existing state funding sources to provide grants to local governments for station area<br />
planning and consensus building, zoning change analysis, and land development assistance as well as tax incentives in<br />
order to generate support and investment in TODs.<br />
• Work with the <strong>MTA</strong> and other partners to develop model TOD ordinances, training materials for local governments and<br />
planning officials, and other resources on TOD benefits to encourage more development near transit.<br />
8. Pass legislation to authorize cities to utilize automated camera enforcement of bus lanes.<br />
Bus speeds in New York City are the slowest of any large city in the country. As the <strong>MTA</strong> and city begin to expand Select<br />
Bus Service and pursue other initiatives to improve bus mobility, keeping bus lanes clear is essential to make buses a fast<br />
and reliable transit option for more New Yorkers. As the miles of bus lanes expand, enforcement by police alone will be<br />
cost prohibitive. Automated enforcement has proven effective in cities around the United States and throughout the world.<br />
STATE OF CONNECTICUT’S ROLE<br />
1. Establish rail station parking goals for all towns that currently control rail parking under leases with the<br />
Connecticut Department of Transportation (ConnDOT).<br />
This effort would expand the number of parking opportunities at <strong>Metro</strong>-North rail stations and leave it to towns how to<br />
provide for meeting their assigned capacity goals. Where a town does not meet its goal to create new or additional parking<br />
capacity, ConnDOT should terminate the rail station operating lease and re-take control of rail parking to provide more<br />
spaces and parking opportunities. Parking solutions should include: pricing; satellite parking and feeder services; bike,<br />
car-share, and carpool parking; and other station access efforts such as pedestrian and bicycle improvements. <strong>The</strong> expansion<br />
of parking at commuter rail stations is the quickest way to reduce GHG emissions, since it will allow hundreds of lightduty<br />
vehicles to be removed from the highways in Fairfield and New Haven Counties. It will insure that commuter rail,<br />
particularly on an intrastate basis, is a viable alternative to driving for home-to-work trips.<br />
2. Provide funding and assistance to municipalities to increase development of TODs using the principles<br />
developed by Governor Rell’s Responsible Growth Task Force.<br />
This should include grants to local governments for station area planning and consensus building, zoning change analysis,<br />
and land development assistance as well as education and training efforts to generate support and investment in TODs.<br />
3. Finance more multi-family and mixed-income housing near transit stations through the Connecticut Housing<br />
Finance Authority (CHFA) and the HOMEConnecticut program.<br />
<strong>The</strong> Executive branch and the Legislature should: (1) prioritize the allocation of Low-Income Housing Tax Credits, State<br />
Housing Tax Credits, and other instruments to subsidize the appropriate level of affordability around transit; (2) promote<br />
and monitor the HOMEConnecticut program, which was created in 2007 to provide incentives to municipalities that develop<br />
mixed-income housing at higher densities near transit stations. This has the potential to be a key program for developing<br />
TODs along <strong>Metro</strong>-North lines throughout the state.<br />
69
70<br />
4. Expand transit options through flexible feeder and distributor services and Bus Rapid <strong>Transit</strong> (BRT) routes, and<br />
improve station access and coordination with <strong>Metro</strong>-North, Amtrak, and long-haul bus services.<br />
ConnDOT should work with Connecticut <strong>Transit</strong> and local transit districts to provide more reliable and seamless transportation<br />
services between home and work including feeder and distributor services as well as BRT routes. This initiative should<br />
consider all aspects of improving the connections to rail stations, including: the types of buses (shuttles, vans, etc.);<br />
scheduling; fares; the provision of real-time customer information and way-finding signage; the condition and quality of bus<br />
stops, shelters, and stations; sidewalks and pedestrian ways; bike lanes and paths; and bike parking. BRT routes should both<br />
complement and connect to rail services. <strong>The</strong>se efforts will increase transit use and remove automobiles from<br />
Connecticut’s roadways, thereby reducing GHG emissions.<br />
NEW YORK CITY’S ROLE<br />
1. Create an All-Agencies <strong>Transit</strong>-Oriented Development (TOD) task force to work with the <strong>MTA</strong> to develop in-city<br />
TODs.<br />
<strong>The</strong> purpose of the task force would be to coordinate all city agencies that have land-use powers so that they work more<br />
closely with the <strong>MTA</strong> on TOD plans and projects. This effort would focus on supporting TOD at transportation centers in<br />
the five boroughs, enabling both New York City and the <strong>MTA</strong> to leverage underutilized assets through public/private partnerships.<br />
<strong>The</strong> task force would explore rezoning districts around stations to encourage TOD; offering developers specific<br />
density bonuses for incorporating TOD; and potential funding for construction of platforms over <strong>MTA</strong> right-of-way to<br />
prepare sites for TOD. By concentrating new development around existing transit hubs, TOD can also support neighborhood<br />
revitalization efforts and contextual zoning initiatives.<br />
2. Implement on-street parking-pricing strategies to better manage parking demand and keep lanes clear for<br />
buses.<br />
New York City's Department of Transportation's PARK Smart NYC is a pilot program that charges higher rates at peak<br />
hours for city parking spaces, to encourage motorists to park no longer than necessary – thereby increasing turnover<br />
and reducing congestion by the amount of time motorists spend cruising for parking spaces. Additionally, effective curb<br />
management reduces the amount of double parking and thus congestion. PARK Smart and other parking pricing and<br />
management strategies should be expanded as they serve both the interests of the city and the <strong>MTA</strong>.<br />
3. Scale up comprehensive street management programs citywide.<br />
Expand and fund street-management programs to reduce congestion, improve safety, and allow buses to travel faster and<br />
more reliably. New York City’s Department of Transportation has begun to implement a series of new measures, including<br />
parking and lane management, signal prioritization and physical improvements. Other actions include increased enforcement<br />
of double-parked vehicles and vehicles blocking bus lanes and loading zones. Buses must be considered first among equals in<br />
city traffic flow. <strong>The</strong> Commission recommends continued collaboration and action by NYC DOT, NYPD, and the <strong>MTA</strong>.<br />
SUBURBAN COUNTIES AND CITY GOVERNMENTS’ ROLE<br />
1. Institute zoning ordinances and TOD-friendly parking policies, and create station area plans that will encourage<br />
development at transit supportive densities.<br />
Land-use decisions remain under local control and this means it is up to local municipalities to make zoning changes<br />
that will encourage improved linkages between land use and transportation. Parking policies such as reduced minimum<br />
parking requirements and allowance of shared parking can make TODs more viable. Comprehensive station area planning<br />
generates community acceptance and buy-in while attracting investment in TOD.
2. Work with the <strong>MTA</strong> to implement Bus Rapid <strong>Transit</strong> (BRT) routes, Light Rail <strong>Transit</strong> (LRT) routes, and last-mile<br />
services region-wide.<br />
<strong>The</strong> <strong>MTA</strong> is working closely with the NYC DOT on an extensive BRT network, but many opportunities exist in the surrounding<br />
suburban counties as well. In partnership with the <strong>MTA</strong>, counties and cities should assist in: running the services; establishing<br />
right-of-way and/or converting general purpose lanes for bus-only lanes; signal prioritization; and enforcement. BRT opportunities<br />
exist for north/south corridors in Nassau and Suffolk Counties, east/west corridors in Rockland, Westchester, and<br />
Putnam Counties, as well as corridors in Fairfield and New Haven Counties in Connecticut. Address the “last mile” problem<br />
by improving feeder systems (buses, shuttles, trolleys, ferries, vans, etc.) to commuter rail stations as well as distributor<br />
systems from stations to employment centers. This initiative should consider all aspects of improving transit connections,<br />
including: types of vehicles; scheduling; fares; the provision of real-time customer information and way-finding signage; the<br />
condition and quality of bus stops, shelters and stations; car sharing and car pooling systems; and pedestrian and bicycle<br />
improvements.<br />
3. Implement parking pricing strategies to better manage parking demand.<br />
On-street market-priced parking will encourage motorists to park no longer than necessary, thereby increasing turnover and<br />
reducing congestion and the blocking of lanes by reducing the amount of time motorists spend cruising for parking spaces.<br />
Market-priced parking at rail stations will also serve to increase capacity by promoting alternate ways of accessing the station.<br />
4. Implement street management programs to keep lanes clear for buses.<br />
Implement a series of measures including parking and lane management, signal prioritization, and physical improvements.<br />
Other actions include increased enforcement of double-parked vehicles and vehicles blocking bus lanes and loading zones.<br />
5. Take steps to support and promote safe bicycle use throughout cities in the region and on public transit.<br />
Support and promote safe bicycle use throughout cities in the region and on public transit within the <strong>MTA</strong> service area to<br />
improve pedestrian and bicycle safety and security.<br />
Sustainability Contribution Fund Green <strong>Metro</strong>Card,<br />
Ticket and E-ZPass<br />
<strong>The</strong> <strong>MTA</strong> is committed to lowering its carbon emissions<br />
and reducing its impact on the regional environment. To<br />
help expand this public commitment, the <strong>MTA</strong> is investigating<br />
the concept of a “green” <strong>Metro</strong>Card contribution<br />
program. <strong>The</strong> program would allow the riding public to<br />
make voluntary, tax-deductible donations to fund innovative,<br />
green aspects of sustainable capital and operating<br />
projects at the <strong>MTA</strong>.<br />
71
72<br />
<strong>Transit</strong>’s Triple Bottom Line<br />
David Lewis, senior VP, national director, Economics and Financial Services, HDR Inc. and<br />
Stephane Larocque, principal economist, HDR Inc. and<br />
Justin Beaudoin, economist, Economics and Financial Services, HDR Inc.<br />
Pricing carbon avoidance is a necessary step towards a<br />
more sustainable economy and a natural part of <strong>MTA</strong>’s<br />
mission. For the <strong>MTA</strong>, this may eventually lead to carbon<br />
offset trades in established markets. For the present, the<br />
Commission recommends the development and introduction<br />
of a Sustainable Return on Investment (SROI) model that<br />
can be used to select green initiatives in a manner compatible<br />
with the <strong>MTA</strong>’s standard accounting practices (see first<br />
figure on p. 73). Akin to Cost-Benefit Analysis, SROI-like<br />
frameworks are already in use at a number of major public<br />
organizations, such as the federal Office of Management<br />
and Budget. <strong>The</strong> SROI is based on a standard economic ROI<br />
calculation (which accounts for the benefits outlined above),<br />
but factors in the estimated amount of carbon averted as<br />
a result of a particular green initiative, valued at the real<br />
opportunity cost of carbon.<br />
To illustrate, consider the hypothetical option of adopting<br />
photovoltaic technology to heat and cool an <strong>MTA</strong> office<br />
building. Under traditional ROI, the <strong>MTA</strong> might consider the<br />
capital costs of installing the equipment and the future costs<br />
of operating and maintaining it. It would compare the present<br />
day value of these costs with the present day value of the<br />
electricity saved. Unless the comparison of present-day<br />
costs and cost savings works out to a rate of return above<br />
the “hurdle rate” (or equivalent pay-back criteria), the project<br />
is deemed financially infeasible. Under an SROI calculation,<br />
however, an estimate is made of the annual quantity of<br />
carbon emissions averted by switching the building out of<br />
fossil fuels. This quantity would be valued at the real opportunity<br />
cost (say, $30 to $50 a ton) and the present-dayvalue<br />
of this saving (calculated over the life of the building)<br />
would be added into the ROI calculation. If the resulting<br />
SROI exceeds the hurdle rate, the project can be deemed<br />
worthwhile, even though it fails the traditional ROI test.<br />
<strong>The</strong> Commission sees the SROI model as a means by<br />
which the <strong>MTA</strong> can ascertain the value proposition of initiatives<br />
in each of the two recommended sustainability tracks,<br />
namely “greening the region” (through initiatives to increase<br />
ridership and transit-oriented development) and “greening<br />
the system” (through steps to reduce the internal energy<br />
and resource footprints of <strong>MTA</strong> facilities, equipment, and<br />
operating modalities).<br />
Rate of Return on <strong>Greening</strong> the Region: Although SROI<br />
calculations must be viewed with considerable caution due<br />
to uncertainty in underlying data and assumptions, evidence<br />
is indicative of transit’s potentially significant value proposition.<br />
Summarized in the second figure on p. 73, a 2002<br />
federal report found that the strongest transit investments<br />
are those which expand the reach of existing systems.<br />
Adding more nodes and interconnectivity among routes was<br />
found to generate SROIs in excess of 50 percent among a<br />
sample of completed projects. Investment in the modernization<br />
of existing facilities and equipment was found to yield<br />
SROIs of more than 30 percent. <strong>The</strong>se rates of return do<br />
not include the additional output and employment related<br />
to construction activity. As indicated earlier, building and<br />
modernizing infrastructure facilities will not necessarily<br />
create new jobs and income if the economy is already<br />
strong. But in today’s extraordinary economic climate, the<br />
$75 to $100 billion spending program contemplated in this<br />
report for period 2010-2019 could yield 105,500 net new<br />
jobs per year, employment income of $5.1 billion a year, and<br />
regional economic output of fully $17 billion per year. It is<br />
important to note that studies of individual projects indicate<br />
the possibility of much lower SROIs, some not high enough<br />
to warrant the investment. In short, every investment must<br />
be evaluated on its merits.<br />
Related evidence of transit’s value proposition comes from<br />
models of the economically optimal level of transit investment.<br />
Taking account of the congestion costs created but not borne<br />
by autos and trucks and the role of transit in abating such<br />
costs, one recent study finds that transit capacity (vehiclemiles<br />
and route-miles) would need to be increased by at<br />
least 50 percent nationally in order to maximize the economic<br />
contribution of public transportation in the United States. 1<br />
Rate of Return on <strong>Greening</strong> the System: Many of the<br />
near-term and transformative investments proposed in<br />
this report involve steps to make existing facilities more<br />
environmentally efficient. Two initiatives considered in this<br />
report, Examples 1 and 2, illustrate how the SROI approach<br />
can be implemented for system-greening initiatives in<br />
practice. <strong>The</strong> illustrations demonstrate that the SROI model<br />
may possibly justify some green investments that might not<br />
pass traditional financial tests. It is important to note that<br />
not every green idea will emerge as a worthwhile investment,<br />
even under the SROI test – SROI is not a green light<br />
to every green idea. Indeed, the Commission believes that<br />
green investment proposals, like all investments, must be<br />
subject to the discipline of reasoned analysis and benchmarks<br />
of success.<br />
1American Public Transportation Association, <strong>The</strong> Optimal Level of <strong>Transit</strong>, (prepared by HDR|Decision Economics), 2008.<br />
2Adapted from U.S. Department of Transportation, Federal <strong>Transit</strong> Administration, <strong>The</strong> Value of Mobility Improvements in Fixed Guideway <strong>Transit</strong>, May, 2002.
Framework For Measuring Sustainable Return On Investment<br />
Capital<br />
Payback<br />
Period<br />
Project<br />
Costs<br />
Operating<br />
and<br />
Maintenance<br />
Local<br />
Environment<br />
Enhanced<br />
Mobility<br />
ROI<br />
SROI<br />
Congestion<br />
Management<br />
Internal<br />
Benefits<br />
Community<br />
Development<br />
Estimated Economic Rates of Return on a Sample 2<br />
CATEGORY OF<br />
TRANSIT<br />
INVESTMENT<br />
Additional Capacity to<br />
Existing Systems<br />
New Rail <strong>Transit</strong><br />
Systems<br />
Modernization<br />
ECONOMIC RATE OF<br />
RETURN<br />
54%<br />
35%<br />
32%<br />
Economic<br />
Output<br />
RISK ANALYSIS<br />
Internal Costs<br />
& Benefits<br />
Global<br />
Environment<br />
LOW HIGH<br />
39% 64%<br />
15% 52%<br />
13% 55%<br />
73
74<br />
Assumptions Used in the SROI Illustrations<br />
Each project in Examples 1 and 2 is examined over its expected duration in order to fully evaluate its impact<br />
over the long run and to assess the degree to which each project contributes to the sustainability of the <strong>MTA</strong>’s<br />
operations.<br />
A discount rate of 4 percent is applied in order to convert future costs and benefits into present value terms.<br />
This rate is consistent with common practice, 1 and the <strong>MTA</strong>’s internal financing costs and is necessary in order<br />
to ensure that costs and benefits arising over different periods of time are compared on a common footing.<br />
<strong>The</strong> calculation of each initiative’s financial return for the <strong>MTA</strong> is relatively straightforward and involves comparing<br />
the marginal costs and marginal revenues of each project (where the term marginal refers to changes in costs<br />
and/or revenues that are attributable to the initiative being considered). In addition, the SROI framework requires<br />
the inclusion of the external impact of each initiative – in the two initiatives considered here, the external impact is<br />
the environmental benefit concomitant with each initiative.<br />
Environmental impacts are called “non-market” effects (also known as “externalities”). Since no complete market<br />
exists for these impacts, no observed price is available to signal the true value of their effects. In order to add the<br />
costs and benefits of externalities to the anticipated financial effects, “shadow prices” are necessary in order to<br />
monetize the effects of the externalities. In the two initiatives, the shadow prices employed are the social costs<br />
of carbon and the shadow price of water.<br />
<strong>The</strong> social cost of carbon reflects the full long-run cost that a ton of carbon emissions imposes on society.<br />
Nordhaus estimates that the social cost of a ton of carbon is $27 per ton (US 2005), with the cost projected to<br />
increase 2 percent to 3 percent each year (in real terms). This social cost of carbon is used to value the social<br />
benefit of reduced carbon emissions over time. <strong>The</strong> social costs of nitrogen oxides (NOx), sulphur dioxide (SO2),<br />
volatile organic compounds (VOCs) and particulate matter (PM10) are also used, with the amount of each of<br />
these five emissions being estimated on a per kilowatt-hour basis. <strong>The</strong> shadow price of water reflects the long-run<br />
social cost of water (a value of $0.015/gallon is used in these evaluations) and is used to value the social benefit<br />
of reduced water consumption.<br />
<strong>The</strong> two initiatives are framed according to the SROI framework illustrated in the first figure on page 73.<br />
Three evaluation metrics are used to illustrate how the SROI framework differs from the typical approach<br />
to project evaluation:<br />
Payback period: <strong>The</strong> period of time required for the return on an investment to recover the sum of the original<br />
investment.<br />
Return on investment (ROI): <strong>The</strong> ratio of the net value of an investment relative to the cost of the investment,<br />
including only internal financial impacts.<br />
Sustainable return on investment (SROI): <strong>The</strong> ratio of the net social value of an investment relative to the full<br />
social cost of the investment, including both internal financial impacts and external impacts.<br />
1 See, Nordhaus, William A Question of Balance: Weighing the Options on Global Warming Policies. Yale University Press, 2008.
Example #1: Energy Efficient Lighting<br />
Project description:<br />
In Grand Central Terminal, 1,700 light bulbs have been replaced with energy-efficient compact florescent<br />
light bulbs (CFLs). Of these 1,700 light bulbs, 700 have been switched from 60W to 15W CFL bulbs and<br />
1,000 have been switched from 100W to 20W CFL bulbs. <strong>The</strong> new CFL bulbs require replacement on an<br />
annual basis, whereas the previous bulbs required monthly replacement. <strong>The</strong> impacts are evaluated over<br />
a 10-year time frame.<br />
Financial impact:<br />
<strong>The</strong>re are two financial impacts involved in the switch of light bulb type – the annual expense of purchasing<br />
light bulbs and the annual electricity cost. <strong>The</strong> CFL bulbs are more expensive than the previous type of<br />
bulb: $6.50 per CFL bulb versus $0.50 for the old bulbs. <strong>The</strong> annual cost of purchasing CFL bulbs,<br />
accounting for the differing frequency of replacement, exceeds that of the previous bulbs ($11,050 per year<br />
versus $10,200 per year). However, there are substantial cost savings with the CFL bulbs in terms of the<br />
annual cost of purchasing electricity – nearly $147,000 per year.<br />
External impact:<br />
In addition to the financial benefit to the <strong>MTA</strong>, the switch to CFL bulbs also generates a positive externality<br />
through a reduction in environmental emissions. While carbon emissions have the greatest impact, the<br />
reduction in electricity consumption also leads to a decrease in the amount of nitrogen oxides (NOx), sulfur<br />
dioxide (SO2), volatile organic compounds (VOCs) and particulate matter (PM10). This initiative reduces<br />
the annual consumption of electricity by nearly 980,000 kilowatt-hours each year, which is equivalent<br />
to 294 tons of carbon emissions. Over the 10-year timeframe, this is equivalent to a reduction of nearly<br />
3,000 tons of carbon. <strong>The</strong> social benefit of this reduction in carbon emissions is valued at $8,500 in the<br />
first year and increases to $11,100 per year by the 10th year after the switch is undertaken. Over the<br />
10-year period, the value of the other reduced emissions is an additional $15,000.<br />
Evaluation:<br />
Over the 10-year time frame, the switch to CFL light bulbs is estimated to result in a total cost savings of<br />
$1.46 million. <strong>The</strong> total social value of reduced emissions is estimated at an additional $115,000 over this<br />
period, $100,000 of which is attributable to carbon. <strong>The</strong> cost of the CFL light bulbs is recovered immediately<br />
and the social return is substantial:<br />
Payback period: Immediate<br />
Return on investment (ROI): 17,872%<br />
Sustainable return on investment (SROI): 19,243%<br />
Net present value (NPV), financial: $1.2 million<br />
Net present value (NPV), sustainable: $1.3 million<br />
Conclusion:<br />
<strong>The</strong> shift to CFL light bulbs pays immediate dividends, both financially and on the broader social level.<br />
<strong>The</strong> traditional financial evaluation tools recommend this initiative and the SROI framework is able to<br />
quantify the additional social value of the environmental benefit.<br />
75
76<br />
Example #2: Rainwater Harvesting and Water Reclamation<br />
Project description:<br />
At the Corona Maintenance Shop, a rooftop rainwater collection system has been installed. <strong>The</strong> system<br />
drains into a 40,000-gallon underground storage tank that supplies water to a subway car washer. Eighty<br />
percent of the wash water is then collected as greywater and recycled, with potable water being used only<br />
during the final rinse stage. <strong>The</strong> impacts of this project are evaluated over a 30-year time frame, which is<br />
the expected lifespan of the rainwater and greywater systems.<br />
Financial impact:<br />
<strong>The</strong> initial installation costs of the rainwater and greywater systems were $480,000 and $250,000,<br />
respectively. It is assumed that an annual maintenance cost equivalent to 3 percent of the initial cost<br />
will be required to keep the system functional in the future. <strong>The</strong> system is designed to save the <strong>MTA</strong><br />
2.5 million gallons of potable water each year -– based on the current and projected cost of water, this<br />
saves the <strong>MTA</strong> $8,000 in the first year, and the cost savings increase over the project’s lifecycle as the<br />
cost of water increases. Over the 30-year time frame the projected total savings in the cost of purchasing<br />
water will be $1.6 million.<br />
External impact:<br />
<strong>The</strong> savings in the amount of water purchased by the <strong>MTA</strong> also results in a social benefit insofar as this<br />
water is then available for other uses. With 2.5 million gallons of water being saved each year, this<br />
amounts to a total reduction of 75 million gallons over the 30-year timeframe. Given an external social<br />
valuation of $0.015 per gallon, the social benefit from the initiative is equivalent to $37,500 each year and<br />
$1.125 million over the project lifespan.<br />
Evaluation:<br />
<strong>The</strong> rainwater harvesting and reclamation initiative provides an illustration as to how the SROI framework<br />
can provide a different recommendation than that of the typical financial-based analysis. Although the initial<br />
investment costs are recovered after 12.5 years, in present-value terms the net value of the project is<br />
$0.4 million if only the financial implications are considered. However, including a valuation of the broader<br />
social impact of the savings of potable water leads to a positive net present value of $0.3 million over the<br />
project’s duration:<br />
Payback period: 12.5 years<br />
Return on investment (ROI): -52%<br />
Sustainable return on investment (SROI): 41%<br />
Net present value (NPV), financial: -$0.4 million<br />
Net present value (NPV), sustainable: $0.3 million<br />
Conclusion:<br />
Although the installation of the rainwater harvesting and water reclamation system is not viable from<br />
the perspective of traditional decision criteria (payback period and financial return on investment), it does<br />
emerge as a very strong project in terms of sustainable return on investment. <strong>The</strong> initiative thus provides<br />
an important illustration of the perspective that the SROI model would bring to <strong>MTA</strong> decision-making<br />
regarding potential green investments.<br />
Right: Solar Roof, Roosevelt Avenue Station, <strong>MTA</strong> New York City <strong>Transit</strong>
Summary:<br />
<strong>The</strong> <strong>MTA</strong> system is a fundamental public benefit that is essential to<br />
economic prosperity, quality of life, and energy savings, not only for the<br />
downstate <strong>MTA</strong> region, but also for New York State as a whole.<br />
Revitalization of the <strong>MTA</strong> system since 1980 enabled the downstate<br />
region to recover after its deepest post-war downturn and experience<br />
robust growth in the 1980s, 1990s, and 2000s. Today, transit ridership<br />
is growing faster than the system can keep up with. <strong>The</strong>refore, expanding<br />
and modernizing <strong>MTA</strong> services is economically overdue.<br />
Disinvestment in the system now will undercut the region’s economic<br />
potential for decades. <strong>The</strong> capacity of the transit system must be<br />
expanded to accommodate future growth and keep pace with global<br />
competitors while sustaining a high quality of life.<br />
Overall, investing in the <strong>MTA</strong> represents a high-value, high-return<br />
means of reducing energy consumption and highway congestion and<br />
preventing global warming. Furthermore, investing in transit stimulates<br />
job growth during the current economic recession.<br />
77
78<br />
Pro Bono Experts<br />
Amanda Eaken, Natural Resources Defense Council<br />
Amy Coffman, Cook+Fox Architects<br />
Andy Haughwout, Federal Reserve Bank of New York<br />
Angela Licata, NYC Department of Environmental Protection<br />
Anthony Perl, Simon Fraser University<br />
Bill Dornbos, Natural Resources Defense Council<br />
Brad Tito, Nassau County, County Executive’s Office<br />
Brandi Colander, Natural Resources Defense Council<br />
Brendan Sexton, Sexton Co.<br />
Bruce Schaller, NYC Department of Transportation<br />
Buz Paaswell, University Transportation Research Center<br />
Carlton Brown, Full Spectrum NY<br />
Chris Garvin, Cook+Fox Architects<br />
Chris Jones, Regional Plan Association<br />
Cynthia Rosenzweig, Center for Climate Systems Research,<br />
Columbia University<br />
David Lewis, HDR Inc.<br />
David Major, Center for Climate Systems Research,<br />
Columbia University<br />
Donna DeCostanzo, Natural Resources Defense Council<br />
Edward Linky, Environmental Protection Agency<br />
Emily Yuhas, NYC Office of Long-Term Planning<br />
and Sustainability<br />
Eric Hesse, TriMet<br />
Eric Rothstein, eDesign Dynamics<br />
Franco Montalto, eDesign Dynamics & Drexel University<br />
Gary Prince, King County <strong>Metro</strong><br />
George Beane<br />
Gil Quinones, New York Power Authority<br />
Helle Maide, New York Power Authority<br />
Janice Wells, Permanent Citizens Advisory Board<br />
Jason Bram, Federal Reserve Bank of New York<br />
Jessica Taylor, NYC Department of Transportation<br />
Jim Leitner, New York Power Authority<br />
Jim Orr, Federal Reserve Bank of New York<br />
John McLaughlin, NYC Department of Environmental Protection<br />
John Williams, HDR, Inc.<br />
Jon Orcutt, NYC Department of Transportation<br />
Jonathan Drapkin, Pattern for Progress<br />
Josh Nachowitz, New York League of Conservation Voters<br />
Justin Beaudoin, HDR Inc.<br />
Kathleen Fortino, Scenic Hudson<br />
Kevin Law, Long Island Power Authority<br />
Klaus Jacob, Lamont-Doherty Earth Observatory<br />
Larry Levine, Natural Resources Defense Council<br />
Lisanne Altmann, Long Island Power Authority<br />
Margaret Newman, NYC Department of Transportation<br />
Marko Bradica, New York Power Authority<br />
Munsun Park, Jonathan Rose Companies<br />
Mysore Nagaraja, former president <strong>MTA</strong> Capital Construction<br />
Neal Parikh, NYC Office of Long-Term Planning and Sustainability<br />
Paul Beyer, NYS Director of Smart Growth<br />
Acknowledgments<br />
Peter M. Iwanowicz, NYS Department of Environmental<br />
Conservation<br />
Radley Horton, Center for Climate Systems Research,<br />
Columbia University<br />
Rae Rosen, Federal Reserve Bank of New York<br />
Rae Zimmerman, New York University<br />
Richard M. Cicciari, Citi<br />
Rino Trovato, New York Power Authority<br />
Robert Yaro, Regional Plan Association<br />
Shelley Poticha, Reconnecting America<br />
SolMarie Jones, Sustainable Long Island<br />
Stephane Larocque, HDR Inc<br />
Stephanie Puzo, NYC Office of Long-Term Planning<br />
and Sustainability<br />
Stephen Hammer, Columbia University<br />
Tim Papandreou, San Francisco Municipal Transportation Agency<br />
Val Menotti, Bay Area Rapid <strong>Transit</strong><br />
Vincent Gil, New York Power Authority<br />
Vivien Gornitz, Center for Climate Systems Research,<br />
Columbia University<br />
Walter Hoefer, Long Island Power Authority<br />
Will Carry, NYC Office of Long-Term Planning and Sustainability<br />
William Solecki, Hunter College, City University of New York<br />
Zac Frank, NYC Department of Transportation<br />
<strong>MTA</strong> Executive Director & Agency Presidents<br />
Elliot G. Sander, Executive Director & CEO<br />
David Moretti, former acting president, <strong>MTA</strong> Bridges & Tunnels<br />
Helena Williams, president, Long Island Rail Road<br />
Howard H. Roberts Jr., president, NYCT<br />
Howard Permut, president, <strong>Metro</strong>-North Railroad<br />
Joseph J. Smith, senior vice president, NYCT Dept of Buses, and<br />
president, <strong>MTA</strong> Bus Company, and Long Island Bus<br />
Michael Horodniceanu, president, <strong>MTA</strong> Capital Construction<br />
Susan Kupferman, president, <strong>MTA</strong> Bridges & Tunnels<br />
<strong>MTA</strong> Executive Staff<br />
Ben Fernandez, director, Labor Relations<br />
Chris Boylan, deputy executive director, Corporate and<br />
Community Affairs<br />
Ernest Tollerson, director, Policy and Media Relations<br />
Gary Dellaverson, Chief Financial Officer<br />
Hilary Ring, director, Government Affairs<br />
James Henly, deputy executive director, General Counsel<br />
Linda Kleinbaum, deputy executive director, Administration<br />
Michael Fucilli, Auditor General<br />
Myrna Ramon, Chief of Staff<br />
William Morange, deputy executive director, Director of Security<br />
William Wheeler, director, Special Project Development &<br />
Planning
<strong>MTA</strong> Headquarters – Policy & Media Relations<br />
Ernest Tollerson, director, Policy & Media Relations<br />
Joe Chan, Strategic Initiatives<br />
Kirke Stanfield, Strategic Initiatives<br />
Melissa Bain, Strategic & Sustainability Initiatives<br />
Nathan Gilbertson, Special Assistant for Policy<br />
Agency Liasons<br />
Audrey Heffernan, <strong>MTA</strong>CC<br />
Collette Ericsson, NYCT,<br />
<strong>MTA</strong> Bus & LI Bus<br />
Other <strong>MTA</strong> Headquarters Staff<br />
Alicia Martinez<br />
Angie Hacker<br />
Darren Jurgens<br />
Debra Pollack<br />
Gordon Johnson<br />
<strong>MTA</strong> Agency Staff<br />
Adam McCool, LIRR<br />
Afshin Hezarkhani, LIRR<br />
Al Muir, MNR<br />
Alan Stapler, MNR<br />
Andrew Bata, NYCT<br />
Anthony Bombace, MNR<br />
Anthony Greco, MNR<br />
Anthony Muratore, NYCT,<br />
<strong>MTA</strong> Bus & LI Bus<br />
Benton Levons, NYCT<br />
Bernadette Humphrey-Nicol,<br />
NYCT<br />
Christine Lema-Foley, LIRR<br />
Clare Sammon, NYCT<br />
Connie Crawford, NYCT<br />
Daniel Donahue, <strong>MTA</strong> Bus<br />
Daniel Hom, NYCT<br />
Daniel O’Connell, MNR<br />
David Cannon, <strong>MTA</strong>CC<br />
David Henley, NYCT<br />
Dennis Mahon, LIRR<br />
Dennis Ramdahin, NYCT<br />
Dennis Varley, NYCT<br />
Derek Braithwaite, NYCT<br />
Derek Piper, <strong>MTA</strong>CC<br />
Elissa Picca, LIRR<br />
Janet Lanphier, NYCT<br />
Jennie Mandelino, NYCT,<br />
<strong>MTA</strong> Bus & LI Bus<br />
Jennifer Badali<br />
Lara Muldoon<br />
Larry Fleischer<br />
Michelle Woods<br />
Naomi Renek<br />
Elizabeth DeLuca, NYCT<br />
Frank Jezycki, NYCT<br />
Frank Payton, NYCT<br />
Gary Feil, NYCT, <strong>MTA</strong> Bus<br />
& LI Bus<br />
Gary Waclawski, B&T<br />
Gene Sansone, NYCT<br />
George Bassil, B&T<br />
George Menduina, NYCT,<br />
<strong>MTA</strong> Bus & LI Bus<br />
Gloria Russo, LIRR<br />
Howard Matza, NYCT<br />
Jacqueline Bertone, B&T<br />
Jay Sherman, NYCT<br />
Jeannie Kwon, NYCT<br />
Jennifer Barry, MNR<br />
Jennifer Wuotinen, NYCT<br />
Jesse Samberg, Business<br />
Service Center<br />
Joanne Reilly, MNR<br />
Joel Brill, NYCT<br />
John Brennan, LI Bus<br />
John Dellas, NYCT<br />
John Grzelewski, NYCT<br />
John Hoban, NYCT<br />
John Melnichuk, LIRR<br />
Pate Felix, Policy & Media Relations<br />
Peter Bass, director, Agency Wide Environmental & Energy Policy<br />
Projjal Dutta, director, Sustainability Initiatives<br />
Steve Toth, Strategic Initiatives<br />
Karen Timko, MNR<br />
Ken Ragone, LI Bus<br />
Kieth Lambrestge, MNR<br />
Natatia Griffith<br />
Patrick Cashin<br />
Rick Osborne<br />
Risa Williams<br />
Robert Paley<br />
Joseph Sardo, NYCT<br />
Joseph Yurman, NYCT<br />
Joy C. Bennett, <strong>MTA</strong> Bus<br />
Judith Kunoff, NYCT<br />
Kate Aglitsky, NYCT<br />
Kenneth McHale, MNR<br />
Lancelot Anderson, LIRR<br />
Larisa Baronova, NYCT, <strong>MTA</strong><br />
Bus & LI Bus<br />
Larry Gould, NYCT<br />
Lew Wunderlich, <strong>MTA</strong>CC<br />
Linda Corcoran, MNR<br />
Linda Weiburg, LIRR<br />
Lisa Blugh-Willis, <strong>MTA</strong>CC<br />
Michael Chubak, NYCT<br />
Michael G. Zacchea, NYCT<br />
Michael Iorino, NYCT<br />
Mindy Giberstone, B&T<br />
Neil Yellin, LIRR<br />
Nejat Haim Hooshang, NYCT<br />
Patrick Parisi, B&T<br />
Philip Cross, NYCT<br />
Rachel Weisslitz, NYCT<br />
Randall Fleischer, MNR<br />
Rashmin Shah, NYCT<br />
Richard Bagala, NYCT<br />
Paul Manske, LIRR<br />
Roy Parks, B&T<br />
Thomas Abdallah, NYCT<br />
Sarah Rios<br />
<strong>The</strong>resa O'Loughlin<br />
Tom Savio<br />
Robert Cumella, NYCT<br />
Robert Iorizzo, NYCT<br />
Robert Maclagger, MNR<br />
Robert Schmitt, NYCT<br />
Robert Walker, MNR<br />
Ryan Flaim, LIRR<br />
Scott Howell, LIRR<br />
Shelley Prettyman, NYCT,<br />
<strong>MTA</strong> Bus & LI Bus<br />
Sheryll Navarro, NYCT<br />
Silvana Salas, NYCT<br />
Stanley Grill, NYCT<br />
Steve Stroh, MNR<br />
Timothy McCarthy, MNR<br />
Tom Robertson, LIRR<br />
Tom Young, NYCT<br />
Vanessa Pettiford, NYCT<br />
Veronique Hakim, <strong>MTA</strong>CC<br />
Wendy Johnston, MNR<br />
William DeSantis, NYCT<br />
William DeTore, NYCT<br />
William Keenan, <strong>MTA</strong> Bus<br />
Zafira Lateef, NYCT<br />
Consultants<br />
David Erne, Booz Allen Hamilton Inc. Gary Rahl, Booz Allen Hamilton Inc. Nelson Smith, freelance writer<br />
79
80<br />
Appendix<br />
Profile of <strong>The</strong> <strong>Metro</strong>politan Transportation Authority<br />
Energy/Carbon – Traction Power <strong>Report</strong><br />
Energy/Carbon – Renewable Energy <strong>Report</strong><br />
Smart Growth/TOD: Bicycles as a <strong>Transit</strong> Link<br />
Smart Growth/TOD: Case Studies<br />
Smart Fleets <strong>Report</strong><br />
Climate Adaptation <strong>Report</strong>
Profile of <strong>The</strong> <strong>Metro</strong>politan Transportation Authority<br />
Elliot G. Sander, <strong>MTA</strong> Executive Director and CEO<br />
<strong>The</strong> <strong>MTA</strong> is North America’s largest mass transit network, serving 14.7 million people<br />
across a 5,000-square-mile region straddling downstate New York and Southern<br />
Connecticut. <strong>The</strong> <strong>MTA</strong> is governed by a 17-member board nominated by the Governor<br />
of New York and confirmed by the New York State Senate. <strong>MTA</strong> trains, subways and buses carry over 8.5 million riders per<br />
day; <strong>MTA</strong> Bridges and Tunnels handle over 857,000 daily crossings. <strong>The</strong> <strong>MTA</strong> system provides over 2.6 billion customer<br />
trips per year.<br />
<strong>MTA</strong> Agencies<br />
<strong>MTA</strong> New York City <strong>Transit</strong> operates a subway system with 26 lines, 468 stations and 6,485 cars; a bus system with<br />
4,576 buses and 243 routes; and Staten Island Railroad with 22 stations and 64 cars. Ridership is approximately seven<br />
million daily and over 2.3 billion annually.<br />
<strong>MTA</strong> Long Island Rail Road the largest commuter railroad in North America, operates 11 rail lines with 124 stations and<br />
1,153 cars. Ridership is approximately 289,000 daily and over 82 million annually.<br />
<strong>MTA</strong> Long Island Bus operates one of North America’s largest all-CNG fleets with 330 buses on 54 fixed routes.<br />
Ridership is approximately 109,000 daily and over 32 million annually.<br />
<strong>MTA</strong> <strong>Metro</strong>-North Railroad includes five rail lines with 120 stations and 1,195 cars. Ridership is approximately 265,000<br />
daily and over 80 million annually.<br />
<strong>MTA</strong> Bridges and Tunnels operates two tunnels and seven bridges. Vehicle crossings are approximately 857,000 daily<br />
and over 304 million annually.<br />
<strong>MTA</strong> Capital Construction manages the construction of the <strong>MTA</strong>’s major expansion projects, including East Side Access,<br />
Second Avenue Subway and 7 Line Extension, as well as the “Downtown Mobility Projects,” the Fulton Street <strong>Transit</strong> Center<br />
and South Ferry Terminal.<br />
<strong>MTA</strong> Bus Company, formed out of seven private lines in 2006, operates 1,354 buses on 81 local and express routes.<br />
Ridership is approximately 368,000 daily and over 109 million annually.<br />
Energy/Carbon – Traction Power <strong>Report</strong><br />
<strong>The</strong> <strong>MTA</strong> provides over 8.5 million<br />
passenger trips daily with an energy<br />
efficiency equivalent to 100 mpg, over<br />
twice the efficiency of today’s most<br />
advanced hybrid cars.<br />
<strong>MTA</strong> traction power use is significant. Traction power alone comprises approximately 2,800 GWh per year, at an electricity<br />
cost of approximately $294 million annually. <strong>MTA</strong> NYC <strong>Transit</strong> consumes about 80% (2,240 GWh) of the annual <strong>MTA</strong><br />
traction power usage. Technologies and other innovative operating techniques to reduce this energy consumption (and subsequent<br />
significant CO2 emissions) are examined. <strong>The</strong> methods utilized to reduce traction energy consumption are broken<br />
down into two categories:<br />
• Regenerative energy management techniques<br />
• <strong>Mass</strong> reduction of train car components<br />
Regenerative energy management techniques include on-board energy storage, trackside energy storage, operational<br />
enhancements such as start/stop synchronization, and software modifications for train cars to better utilize regenerated<br />
energy. <strong>Mass</strong>-reduction techniques include elimination of redundant components, substituting lighter materials such as aluminum<br />
for steel and developing innovative design optimization techniques to enable identical structural performance with<br />
reduced weight.<br />
Additional information on this subject is available at www.mta.info/environment.<br />
Energy/Carbon – Renewable Energy <strong>Report</strong><br />
<strong>The</strong> <strong>MTA</strong> has established a goal to increase its renewable energy use to 7% by 2015, through both distributed generation<br />
and green power purchases (renewable energy credits). This is a significant challenge, as any transit agency has an<br />
extremely high energy intensity due to the traction power demands, and <strong>MTA</strong> is no exception. <strong>MTA</strong>’s power demand was<br />
approximately 3.5 million MWh (megawatt hours), approximately 80% of which is traction power demand. <strong>MTA</strong> currently<br />
purchases wind energy renewable energy credits (RECs) from the New York Power Authority (NYPA) and has nearly 500<br />
81
82<br />
kW (kilowatts) of self-generation from solar photovoltaic (PV) panels. <strong>MTA</strong> is estimating the costs to meet 1% of its power<br />
demand via renewable power in 2009, gradually stepping up its purchases and self-generation to meet its 7% goal by<br />
2015. In addition to helping New York State meet its renewable goals, renewables can provide <strong>MTA</strong> with long-term price<br />
certainty in an era of increasing fossil fuel prices. Demand for natural gas will continue to increase, driving up prices, particularly<br />
with the advent of U.S. greenhouse gas regulations that impose a cost on carbon dioxide emissions. Using natural<br />
gas to generate electricity produces much less carbon dioxide than coal-fueled generation with which it competes.<br />
In order to progress towards the goal of increased renewable energy use, <strong>MTA</strong> tasked Booz Allen Hamilton to review<br />
opportunities to develop wind energy on <strong>MTA</strong> properties and rights of way. Prime wind locations are flat, open areas with<br />
consistent wind speeds. <strong>The</strong> majority of wind development in the northeastern US has been in upstate New York, where<br />
Class 4 and higher winds exist.<br />
Additional information on this subject is available at www.mta.info/environment.<br />
Smart Growth/TOD – Bicycles As A <strong>Transit</strong> Link<br />
<strong>MTA</strong> Blue Ribbon Commission on Sustainability and the <strong>MTA</strong> Smart Growth-TOD Working Group<br />
Developed by Ned Sullivan, George Beane and the Smart Growth/TOD Working Group<br />
Introduction<br />
An objective of the <strong>MTA</strong> is to “develop and implement programs to improve the environment.” 1 <strong>The</strong> <strong>MTA</strong> plays a key<br />
role in Mayor Bloomberg’s PlaNYC for a Greener, Greater New York2 and should, either by interaction or example, play<br />
a leadership role in other city and federal transportation improvement programs3 as well.<br />
PlaNYC’s Transportation Initiative 9 calls for the city to promote cycling in various ways including “the implementation<br />
of the city’s 1,800-mile bike lane master plan” and “increasing necessary bicycling infrastructure” such as bike racks<br />
and lockers. Doubling the number of intra-city bike commuters is a key goal of the NYC Department of Transportation’s<br />
strategic plan. 4 A bill to promote reasonable bicycle access by employees at existing office buildings5 has been introduced<br />
in the City Council’s Transportation Committee and is being redrafted with input from the Mayor's office, DOT, and other<br />
interested parties. <strong>The</strong> Department of City Planning intends to propose a Bicycle Parking Zoning Text Amendment requiring<br />
appropriate indoor bicycle parking facilities in all new buildings.<br />
<strong>The</strong>re has been an enormous increase in non-recreational cycling in New York and, if the experiences of other cities around<br />
the world can be a guide, the number of intra-city cyclists will increase dramatically as cycling becomes safer and more<br />
convenient. To reduce traffic congestion and air pollution, the <strong>MTA</strong> should play a prominent role in promoting cycling for<br />
inter- and intra-city commuters and for recreational cyclists who wish to enter and leave the city. <strong>The</strong> inclusion of bicycling<br />
in the transportation mainstream has become a national objective and this Working Group recommends that it become a<br />
priority of the <strong>MTA</strong>.<br />
Bicycle Recommendations<br />
<strong>The</strong> Smart Growth/TOD Working Group makes the following recommendations to encourage and facilitate the use of<br />
bicycles as part of <strong>MTA</strong> passengers’ travel from point of origin to point of final destination.<br />
1. Promote and facilitate bike parking at stations<br />
2. Promote and facilitate bike transport on trains and buses<br />
3. Promote and facilitate bike storage at <strong>MTA</strong> work sites<br />
4. Provide consolidated and easily accessible information<br />
5. Act as an advocate and partner in promoting the use of bicycles as a sustainable link in urban and regional transit<br />
1 http://www.mta.info/nyct/facts/ffenvironment.htm<br />
2PlaNYC: A Greener, Greater New York; Transportation chapter, pp 72-97, pp 150-151.<br />
3For example, <strong>The</strong> Transportation Equity Act for the 21st Century (TEA-21); U.S. Code, Title 23, Section 217; U.S. Code, Title 49, Section II, Ch. 49-III §5501(3): “<strong>The</strong> National<br />
Intermodal Transportation System shall include significant improvements in public transportation necessary to achieve national goals for improved air quality, energy conservation,<br />
international competitiveness, and mobility for . . . economically disadvantaged individuals in urban. . . areas of the United States”; TEA-21 §3037(f): “. . . In awarding grants<br />
under this section . . . the Secretary shall consider . . . in the case of an applicant seeking assistance to finance an access to jobs project, the need for additional services in the<br />
area to be served by the applicant (including bicycling) to transport welfare recipients and eligible low-income individuals to and from specified jobs, training, and other employment<br />
support services . . .”<br />
4http://home2.nyc.gov/html/dot/html/pr2008/pr08_024.shtml 5NYC Council Intro. 871-2008, <strong>The</strong> Bicycle Access Bill.
1. Bike Parking at Stations<br />
<strong>The</strong> <strong>MTA</strong> does not own the land adjacent to many of its stations and does not have the right to install bike parking racks<br />
on land it doesn’t own; neither does it have space within many of its stations to provide bike parking. Nevertheless, it is<br />
the recommendation of this Working Group that the <strong>MTA</strong> establish bike parking at its stations as a principal goal; where<br />
the <strong>MTA</strong> does not have room on its own property it should encourage and assist adjacent property owners in providing<br />
bike parking.<br />
Railroad Stations:<br />
• Bicycle racks, either fee-based or free, should be placed in visible, centrally located, and preferably sheltered locations at<br />
all railroad stations.<br />
i) <strong>The</strong> number of racks depends on the station, but there should always be enough excess capacity to assure potential<br />
riders that they will find a place to lock their bikes. Stations in geographically flat communities with a sizeable number<br />
of commuters who live within two miles of the station should have more racks than stations in hilly areas, like Yonkers,<br />
or where commuters live at great distances from the station, like New Canaan. 6<br />
ii) Visible, centrally located racks are important so that commuters will know the racks are there and to increase protection<br />
from theft and vandalism.<br />
iii) Some railroad stations have large underused spaces that should be converted to secure fee-based storage with 24-hour<br />
access. Fee-based storage provides revenue and reduces the use of the space for dead storage. For example, on MNR, the<br />
former taxi entrance to Grand Central Terminal on Vanderbilt Avenue and the area under the stairs from the street to the<br />
tracks at the 125th Street Station are two locations where there is both need and opportunity for placement.<br />
iv) As bike-link commuting increases, enclosed, as opposed to sheltered, bike racks may become desirable. 7 Individual,<br />
fully enclosed bicycle lockers are available at a number of <strong>Metro</strong>-North Railroad and Long Island Rail Road stations, 8<br />
but until bicycle commuting is more popular and there is a demand for rented bike lockers, the cost of providing more<br />
individual bike lockers outweighs the benefits.<br />
Subway Stations:<br />
• Bicycle racks should be in accessible, visible, and preferably sheltered locations in9 or adjacent to10 subway stations that<br />
serve passengers who do not live or work within easy walking distance of the station.<br />
i) Indoor bike storage would be suitable for the mezzanines of some IND stations, including on the A, B, C, D, and F lines.<br />
Where bike racks are installed below street level, narrow (wheel width) ramps should be added along a wall at the sides of<br />
stairways to facilitate access. Where bike racks cannot be placed on <strong>MTA</strong> property, the <strong>MTA</strong> should work with NYC DOT,<br />
other city agencies, and local community boards to see that racks are installed nearby.<br />
ii) Subway stations by some bridges to other boroughs and at the ends of train lines such as the 7 at Main Street, Flushing,<br />
and the 1 at Broadway and 242nd Street (adjacent to Van Cortland Park) should be considered for bike rack installation. In<br />
some cases like 242nd Street at Van Cortland Park, end of the line bike storage might be combined with franchised bike<br />
shops that offer repairs and sales. Independently owned and operated bike shops are likely to open near stations in<br />
commercial areas where there is heavy use of transit-link bike parking.<br />
Bus Stops:<br />
• Bicycle racks should be in accessible, visible, and preferably sheltered locations adjacent to bus stops in sparsely served<br />
areas. Where bike racks cannot be placed on <strong>MTA</strong> property, the <strong>MTA</strong> should work with NYC DOT, other city agencies,<br />
and local community boards to see that racks are installed nearby.<br />
6 Approximately 90 percent of auto emissions occur in the first mile after a cold start and emissions from one or two mile trips are nearly as great as five to ten mile trips. National<br />
Bicycling and Walking Study (1992) Case Study No. 9: Linking Bicycle/Pedestrian Facilities with <strong>Transit</strong>. FHWA Publication No. FHWA-PD-93-012. Washington D.C. (p. 84).<br />
7 Bike racks are currently located at about 90 percent of the New Jersey <strong>Transit</strong> stations and at many other railroad stations throughout the world. <strong>The</strong> bike parking ramp at<br />
Amsterdam’s Central Station holds 7,000 bikes. Union Station, Washington DC: DDOT (District Dept. of Transportation) is developing a Bicycle <strong>Transit</strong> Center (also known as a<br />
Bike Station) adjacent to the station. It will provide bicycle parking, rentals, repairs and accessories. See renderings on line at<br />
http://www.ddot.washingtondc.gov/ddot/frames.asp?doc=/ddot/lib/ddot/information/bicycle/pdf/3ds-context.pdf. Tokyo’s Kasai Station has a multi-storey computerized bike<br />
parking facility that can accommodate 9,400 bicycles at a fee of about $1 for a single use or $17.50 for a monthly pass.<br />
8 Bike lockers are currently located on the <strong>Metro</strong>-North line at Cortlandt, Dover Plains, Patterson, Tenmile River, Wassaic, and Pawling Stations. Bike lockers are currently located<br />
on the LIRR line at Bridgehampton, Central Islip, Cold Spring Harbor, Copiague, Farmingdale, Greenlawn, Greenport, Hicksville, Huntington, <strong>Mass</strong>apequa, Northport, Oakdale,<br />
Patchogue, Port Jefferson, Ronkonkoma, Sayville, Stony Brook, and Wantagh stations.<br />
9 Chicago <strong>Transit</strong> Authority has indoor or sheltered bike parking at 83 stations (Chicago <strong>Transit</strong> Authority). (http://egov.cityofchicago.org/city/webportal/home.do _Traffic &<br />
Transportation _ Cycling, _ Indoor CTA Stations). McDonald's Cycle Center at Chicago’s Millennium Park is a 300-space, heated indoor bicycle parking facility that provides<br />
lockers, showers, a snack bar, bike repair, bike rental and other amenities. Bicycle parking spaces are available free of charge. (http://www.millenniumpark.org/generalinformation).<br />
Los Angeles County <strong>MTA</strong>’s Del Mar Gold Line station also provides indoor bike parking. (http://www.metro.net/riding_metro/Del%20Mar%20Station.htm; http://transitguide.<br />
caltech.edu, _bikes on public transit).<br />
10 An example of the success of outdoor bike racks can be seen at the Bedford Avenue L station in Williamsburg, Brooklyn. <strong>The</strong> NYC Dept. of Transportation replaced automobile<br />
parking spaces with bike racks in 2007. Bike commuting to the station increased to such an extent that demand exceeded rack space. Bike racks are not needed near stations<br />
where most passengers live within easy walking distance, such as on the Upper West Side of Manhattan.<br />
83
84<br />
2. Bike Transport on Trains and Buses<br />
• Using a bicycle at the beginning and the end of a journey for commuting and leisure purposes permits <strong>MTA</strong> riders to<br />
combine two modes of transportation and should be encouraged to achieve maximum sustainability. That means, for example,<br />
an <strong>MTA</strong> customer could ride from home to the train or bus, put the bicycle on board, and ride to work at the other end.<br />
• Towns in New York State and elsewhere have begun to promote bicycle tourism. 11 <strong>MTA</strong> railroad trains should be able<br />
to accommodate tourists traveling with bikes on trains to weekend and holiday destinations. Policies implementing the<br />
transport of bicycles on rail and bus systems have been established by more than 56 cities in the United States.<br />
• Railroad Trains<br />
i) <strong>The</strong> <strong>MTA</strong> should expand its provisions for transporting bicycles on railroad trains. 12 Design specifications for new trains<br />
should include space for standard and folding bicycles.<br />
ii) Permits13 and special regulations for bicycles should be eliminated. Instead, the <strong>MTA</strong> should rely on existing city/state<br />
laws and general <strong>MTA</strong> regulations against unruly and dangerous conduct and on cyclists’ own reasonable behavior.<br />
• Subways<br />
<strong>The</strong> <strong>MTA</strong> has a progressive policy for on-subway bicycle transport. Cyclists may bring standard frame bikes aboard the<br />
New York City subway at any time, but are discouraged from bringing them aboard subway trains that are crowded. As<br />
cycling becomes a more popular transit link, it may be necessary to provide priority transport space for bicycles in designated<br />
cars, as is the case in some other cities.<br />
• Buses<br />
i) <strong>The</strong> <strong>MTA</strong> should continue its policy permitting folding bicycles inside <strong>MTA</strong> city buses. 14<br />
ii) Buses are equipped with passenger-loaded bike racks in many cities throughout the United States. 15 <strong>MTA</strong> buses should<br />
be so equipped on routes that cross bridges without bike paths, such as the Whitestone, Throgs Neck, and Verrazano-<br />
Narrows bridges, and where prospective passengers live beyond easy walking distance to a bus stop. As of 2002, more<br />
than 40,000 buses operated by over 300 U.S. transit agencies were equipped with bike racks. 16 A bikes-on-buses (BOB)<br />
user survey of 15 transit agencies showed that “transit agencies generally view the initial investment and operational costs<br />
of BOB to be minimal compared to the return on investment.” It also showed that “BOB programs attract new patrons,<br />
encourage increased use of transit, and expand the transit service area.” 17 Bus-mounted bike racks collapse so that they<br />
extend only four inches in front of the bus without bikes; 18 they can be loaded by novices in about 15 seconds and by<br />
experienced users in from 4 to 10 seconds. 19<br />
3. Bike Storage at <strong>MTA</strong> Work Sites<br />
• Bicycle racks should be provided in accessible, visible, and preferably sheltered locations at permanent <strong>MTA</strong> work sites.<br />
• It should be an <strong>MTA</strong> policy that indoor storage for employees’ bicycles be provided wherever possible.<br />
11Saratoga Springs, although not on a <strong>Metro</strong>-North line, is an example of a town which is served by a railroad and has begun to promote bike tourism<br />
(www.saratoga.com _search "bike"). Local buses have been equipped with bike racks so that people, including tourists who arrive by train (Amtrak), can get out of town onto<br />
the area’s country roads and bicycle trails.<br />
12Bicycles are allowed aboard LIRR and MNR trains at most times except rush hours and major holidays. Bicycles can be brought aboard the Staten Island Railway except on<br />
rush-hour trains traveling in the peak direction.<br />
13Permits, purchased in advance, are required for conventional bicycles on <strong>MTA</strong> trains. Folding bikes can be taken on the LIRR without a permit.<br />
14Folding bicycles are considered luggage and are permitted on local and limited buses at all times. All other bicycles are prohibited. Conventional bikes are not allowed on board<br />
buses operated by New York City <strong>Transit</strong>, the <strong>MTA</strong> Bus Company, or Long Island Bus.<br />
15See, for example, San Francisco <strong>MTA</strong>: http://www.sfmta.com/cms/bcomm/BikesonMuni.htm; Seattle: http://transit.metrokc.gov/tops/bike/bikeride.html; Boston:<br />
http://www.mbta.com/riding_the_t/bikes; Atlanta: http://itsmarta.com/howto/bikes.htm; Chicago, Washington DC, and many other cities.<br />
16Bikes on <strong>Transit</strong> Database. http://www.bikemap.com/bikesontransit/view_transit.php<br />
17A Return on Investment Analysis of Bikes-on-Bus Programs, <strong>Final</strong> <strong>Report</strong>, Chistopher Hagelin Principal Investigator, National Center for <strong>Transit</strong> Research, National Center for<br />
Urban Transportation Research, University of South Florida, June 2005, pg. iii. http://www.nctr.usf.edu/pdf/576-05.pdf<br />
18Sportworks® bike racks for buses. http://www.bicycleracks.com<br />
19A Return on Investment Analysis of Bikes-on-Bus Programs Ibid., pg. 7.
4. Consolidated and Easily Accessible Information<br />
• A consolidated and accessible information system is an extremely helpful way to promote cycling in conjunction with mass<br />
transit. Through an enhanced web presence known as “<strong>MTA</strong>+Bike,” the <strong>MTA</strong> has consolidated bicycle travel information for<br />
each of its transit systems onto one location. 20 <strong>The</strong> websites of transit authorities in other cities provide good examples of<br />
how the internet is used elsewhere to encourage and facilitate cycling as a transit link. 21 <strong>The</strong> <strong>MTA</strong> should continue to<br />
improve its website and provide useful and regularly updated information. It should include information about <strong>MTA</strong> transit<br />
links to parks, greenways, bike trails and out of town destinations which would be of interest to recreational cyclists. 22<br />
5. <strong>MTA</strong> as an Advocate and Partner in Promoting the Use of Bicycles as a Sustainable Link in Urban and Regional <strong>Transit</strong><br />
• Insofar as possible, the <strong>MTA</strong> should participate in the early planning stages of Smart Growth/TOD projects within its<br />
region to ensure that proposed development includes acceptable facilities for bike-link transit.<br />
• <strong>The</strong> <strong>MTA</strong> should work with the NYC DOT and other appropriate agencies to facilitate bike-link transit. This collaboration<br />
should include but not be limited to: bike parking adjacent to <strong>MTA</strong> transit stations; signage clearly marking the way to<br />
bike parking; easily accessible bike lanes and redesigned intersections leading to and from and connecting busy transit<br />
hubs such as Grand Central Terminal, Penn Station, and the Port Authority Bus Terminal to encourage potential bike-link<br />
commuters; and links from the <strong>MTA</strong> website to related websites, providing additional information whenever possible.<br />
• Bike-sharing23 is a generic program24 that is being seriously considered for New York City. <strong>The</strong> central concept is lowcost<br />
or free access to bicycles for short trips within the city and the reduction of traffic congestion, noise, and air-pollution.<br />
Washington, D.C. recently launched – and is the first North American city to have – a bike sharing program. 25 Bike-sharing<br />
programs are in place in many other cities around the world, 26 including Copenhagen (since 1995) and eleven large cities<br />
in France. 27 Chicago, Boston, and San Francisco are among the American cities in the process of initiating bike-sharing<br />
programs. <strong>The</strong> Chicago transit agency has come under some criticism for not participating in the early stages of planning.<br />
<strong>The</strong> Smart Growth-TOD Working Group recommends that the <strong>MTA</strong> become an active participant in the planning and<br />
implementation of New York City’s bike-sharing program and encourage its coordination with the <strong>MTA</strong> transportation<br />
to the extent possible.<br />
Priorities<br />
Short Term: <strong>The</strong>se are priorities which the <strong>MTA</strong> should accomplish within one year.<br />
• Adopt as an explicit goal the substantial increase of bicycle/<strong>MTA</strong> transit-linked journeys.<br />
• Promote cycling as a transit link through a major publicity campaign, including posters on buses, subways, and trains;<br />
transit-linked cycling should be presented as a healthy, efficient, and cheap form of transportation for commuters and<br />
recreational cyclists.<br />
• Provide information and training to conductors and other staff to facilitate the <strong>MTA</strong>’s new “cycling as a transit link”<br />
campaign.<br />
• Provide bike racks at all <strong>MTA</strong>-owned facilities.<br />
• Provide secure fee-based bike storage at Grand Central Terminal and 125th Street Station and other major stations with<br />
<strong>MTA</strong>-controlled parking sites.<br />
• Improve the <strong>MTA</strong>’s website, promoting its objective to increase cycling as a transit link and providing cyclists with useful<br />
information, including recreational opportunities.<br />
• Eliminate special permits for bicycles on railroad trains.<br />
20www.mta.info/bike: “<strong>MTA</strong>+Bike complements and supports the goals of the blue ribbon Commission on Sustainability and the <strong>MTA</strong>, which released a series of interim<br />
recommendations last month on ways the <strong>MTA</strong> can reduce its environmental impact and promote transit-oriented development.”<br />
21Atlanta: http://itsmarta.com/howto/bikes.htm; San Francisco: http://www.sfmta.com; Seattle (King County): http://transit.metrokc.gov/tops/bike/bike.html<br />
22An example is the Harlem Valley rail trail, accessible from the <strong>Metro</strong> North station at Wassaic, Dutchess County. <strong>The</strong> Harlem Valley rail trail website (http://www.hvrt.org)<br />
provides excellent local information and additional links that are extremely useful to the cycling visitors.<br />
23http://en.wikipedia.org/wiki/Community_bicycle_program 24See Exhibit 1, attached. Public Bike Share: Best Practices by Caroline Samponaro, Director of Bicycle Advocacy, Transportation Alternatives.<br />
25 https://www.smartbikedc.com<br />
26 http://bike-sharing.blogspot.com<br />
27 Paris, Lyon, Marseille, Toulouse, Nantes, Besancon, le Mans, Rouen, Valenciennes, Mulhouse, and Aix en Provence.<br />
85
86<br />
Medium Term: <strong>The</strong>se are high priorities that may take longer to achieve because they require the cooperation of other<br />
agencies.<br />
• Work with NYC DOT and other government agencies to provide bike parking at all railroad train stations and selected<br />
bus and subway stations where the <strong>MTA</strong> does not control the adjacent parking sites.<br />
• Work with NYC DOT and other government agencies to provide signage and safe bicycle access to and from major<br />
transit hubs.<br />
• Work with city agencies to implement a “bike-sharing” program in New York City.<br />
Longer Term: <strong>The</strong>se are priorities that should be planned now for future implementation.<br />
• Design on-board storage facilities for all new trains, buses, and subways.<br />
• Provide passenger-loaded bike racks for the fronts of buses on some routes.<br />
• Promote the use of bicycles as a transit link in TOD and Smart Growth developments throughout the <strong>MTA</strong> region.<br />
Exhibit 1: Public Bike Share: Best Practices<br />
Caroline Samponaro, Director of Bicycle Advocacy, Transportation Alternatives<br />
Brief Definition:<br />
A public Bike Share is a city-wide program of low-cost [nearly free] public-use bicycles designed to be an integral<br />
component of the city's larger public transportation network.<br />
Summary:<br />
Bike Share programs increase public transportation options at a relatively low cost to the city. Any registered user can<br />
"borrow" a bike from a station for a nominal fee and return it to any other station in the system. Bike Share should not be<br />
confused with free bike rental, however, because users typically pay an annual fee, borrow and return bikes to multiple<br />
locations, and ride mainly for transportation, not for recreation. While users may take the bikes for as long as they need,<br />
the usage charge for the time incrementally increases to encourage short, transit-oriented trips (the first half-hour should<br />
be free to encourage short trips and reduce barriers of entry).<br />
Defining Features:<br />
Public Bike Share programs hold enormous potential to transform mobility in cities by:<br />
• expanding the reach and flexibility of the existing public transportation system<br />
• discouraging the use of single occupancy vehicles<br />
• freeing up space on overcrowded subways and buses<br />
• adding a low-cost, sustainable, and healthy transportation option<br />
• enabling a network of bicycle transit in a dense urban environment<br />
<strong>The</strong> most successful bike share systems provide:<br />
• 1 bike per 100-300 residents living within the chosen boundaries of a program (attention should be paid to the daytime<br />
vs. nighttime population in Manhattan)<br />
• a dense network of stations (1/1000 feet) integrated onto the streetscape, facilitating traffic calming and the removal<br />
of car parking spaces<br />
• 30 free minutes of cycling to encourage transportation trips<br />
• connectivity to/from popular, transit-poor destinations<br />
• connectivity to/from other modes of public transportation<br />
• integration into the existing public transit system options (e.g. via <strong>Metro</strong>Card)<br />
• strong anti-theft technology, including locks on bicycles for quick stops by users<br />
• incentivized bike redistribution scheme to minimize use of operating vehicles
Cities well-suited to a Bike Share program have:<br />
• the density and mixed land use necessary to generate sufficient ridership<br />
• relatively flat terrain<br />
• an on-street bicycle network, including lanes, bicycle boulevards, and slow streets (e.g. every 2-3 Avenues offer protected<br />
cycling routes, residential street speed limits reduced to 15 mph)<br />
Bike Share is NOT:<br />
• a drain on the city budget (it potentially generates revenue)<br />
• free bike rentals (its purpose is public transportation and it integrates with other transit modes)<br />
• a network of bicycle rental locations (the system is automated and capitalizes on low barriers to entry)<br />
• a program only for pre-existing bicycle enthusiasts (Bike Share in Paris increased cycling by 168 percent in one year and<br />
brought bicycle mode share from less than 1 percent to almost 5 percent in the same amount of time)<br />
• a detriment to private bike sales and traditional bike rentals (in cities like Paris it has increased both)<br />
Impact:<br />
By placing stations strategically – at transit hubs and other popular origins and destinations – Bike Share transforms<br />
urban mobility by adding a flexible, cost-effective and sustainable transportation option to the existing public transportation<br />
network in a city. Public bike system trips in Europe have replaced bus or subway trips by 34 to 65 percent, depending on<br />
the city, and car or motorcycle trips by 6 to 10 percent. In Paris cycling increased by 168 percent in only the first year of the<br />
bike share program and the bicycle mode share went from less than 1% to almost 5% in the same amount of time.<br />
Bike Share holds huge potential to free-up much needed space on existing public transit modes and to favorably change<br />
urban commuter behavior as part of a larger plan to reduce carbon emissions, calm traffic to enhance street safety and<br />
improve public health.<br />
Smart Growth/TOD - Case Studies<br />
<strong>Metro</strong>-North Case Studies - New York<br />
Beacon:<br />
Bike Share programs increase public transportation options at a relatively low cost to the city. Any registered user can<br />
"borrow" a bike from a station for a nominal fee and return it to any other station in the system. Bike Share should not<br />
be confused with free bike rental, however, because users typically pay an annual fee, borrow and return bikes to multiple<br />
locations, and ride mainly for transportation, not for recreation. While users may take the bikes for as long as they need,<br />
the usage charge for the time incrementally increases to encourage short, transit-oriented trips (the first half-hour should<br />
be free to encourage short trips and reduce barriers of entry).<br />
A policy to promote transit-oriented development (TOD) as a way of increasing ridership, supporting efficient land use, and<br />
leveraging public assets reflects the proactive role <strong>Metro</strong>-North Railroad plays in encouraging development in and around<br />
its stations. At Beacon Station, <strong>Metro</strong>-North recognized the importance of a broad-based outreach process in achieving a<br />
region-wide perspective while understanding the role of the station within the community.<br />
In 2002 <strong>Metro</strong>-North initiated and facilitated a community planning charrette for a Station Area Master Plan that<br />
would improve station access at Beacon. <strong>The</strong> charrette engaged more than 20 key stakeholders, including the town,<br />
county, federal and state agencies, and major environmental, cultural, and local groups. This laid the groundwork for<br />
continued planning over the next two years.<br />
A public workshop was later held to gather additional feedback on three alternatives developed from the charrette.<br />
Comments from the stakeholder groups and the public identified a preferred option and ongoing planning meetings refined<br />
the Master Plan to achieve consensus on the final version.<br />
In 2004 a short-term improvement plan and a long-term Master Plan for the station area was finalized. <strong>The</strong> long-term<br />
Master Plan included a TOD design to improve service for current <strong>Metro</strong>-North customers and to generate economic<br />
growth in the City of Beacon. <strong>The</strong> key element of the Master Plan was a self-sustaining mixed-use TOD that would act as<br />
a gateway to the Beacon waterfront. <strong>The</strong> TOD element seeks to:<br />
• Promote smart-growth principles including improved access to public transit, increased development density with lower<br />
parking requirements, and commercial and cultural activities.<br />
87
88<br />
• Integrate already existing multimodal transportation at the site.<br />
• Support development approaches for the site that complement the local economy.<br />
• Enhance access to and preserve key views of, the Hudson waterfront.<br />
• Fund enhancements to the transportation facilities through a TOD/public-private partnership.<br />
• Develop linkages to connect the station area to other local venues.<br />
<strong>Metro</strong>-North then pursued a two-step approach to implement the Master Plan. <strong>The</strong> first step was the development of a<br />
Request For Expression of Interest (RFEI) which allowed interested developers to provide input regarding the site’s potential<br />
thus assisting in establishing realistic parameters for the issuance of a formal Request For Proposal (RFP). <strong>The</strong> RFEI was<br />
issued in October 2007. Over 60 firms requested a copy of the RFEI. Based on the information received from the developer<br />
community <strong>Metro</strong>-North created a model TOD plan for the station area that best represented what was economically<br />
achievable at the levels of density and parking needed, along with the optimal mix of residential and commercial development.<br />
<strong>The</strong> model served as a basis to encourage the City of Beacon to make further zoning changes and was used to<br />
frame the creation of the TOD Request for Proposal.<br />
With the expected release of the Request for Proposal in early 2009, the proposed TOD at the 18-acre site will take a<br />
step closer to completion. Beacon provides an excellent example of the ways in which transit can participate in the local<br />
planning process to develop TODs in suburban communities.<br />
Yonkers:<br />
<strong>The</strong> Yonkers transit-oriented development (TOD) project was a cooperative effort between <strong>Metro</strong>-North, New York State,<br />
the City of Yonkers, the Federal <strong>Transit</strong> Administration, and private developers. It is a clear example of the power of public<br />
and transportation development to act as an economic catalyst for a community.<br />
<strong>The</strong> TOD project began with <strong>Metro</strong>-North’s capital investments that resulted in the majestically-restored Yonkers station,<br />
which stands as the anchor and gateway for the Yonkers waterfront. Through a collaborative effort, excellent working<br />
relationships, and sound design and planning initiatives between <strong>Metro</strong>-North, the City of Yonkers, and private developers,<br />
the Yonkers waterfront is a strong testimonial to a successful transit-oriented development.<br />
With the newly restored station completed in 2005, major infrastructure improvements by <strong>Metro</strong>-North complemented<br />
the City of Yonkers’ ongoing waterfront development projects and assisted in the downtown revitalization efforts. <strong>The</strong> project<br />
created a new pedestrian access way to the Hudson River and a new park area next to the train station. Beginning in 2002,<br />
the early construction activity at the station was an enticement to other developers, with the rehabilitated Yonkers station<br />
serving as the gateway for many visitors to the waterfront and providing an excellent first impression to visitors. <strong>The</strong><br />
<strong>Metro</strong>-North investment of renovation and related infrastructure totaled $43 million.<br />
<strong>The</strong> City of Yonkers constructed the waterfront esplanade to connect the train station and provide a direct waterfront<br />
entrance to the station. Through the collaborative effort of the city and <strong>Metro</strong>-North, the new entrance to the Yonkers<br />
station provides improved access for <strong>Metro</strong>-North customers residing on the waterfront. <strong>The</strong> city also provided significant<br />
investment in roadway infrastructure and an intermodal plaza at the station to enhance access. <strong>The</strong> work that Yonkers and<br />
<strong>Metro</strong>-North accomplished afforded benefits to market residential units that were being developed as part of the TOD.<br />
A private developer working with the City of Yonkers, New York State, Scenic Hudson and <strong>Metro</strong>-North, began construction<br />
of mixed-use development at the station. <strong>The</strong> first phase included 266 residential units, 17,000 square feet of retail/restaurant<br />
space, and 28,000 square feet of office space. <strong>The</strong> second phase, completed in 2008, resulted in 294 additional units.<br />
<strong>Metro</strong>-North Case Studies - Connecticut<br />
Georgetown-Redding:<br />
After 180 years of operation, a Connecticut wire mill went bankrupt but found new life from transit-oriented development.<br />
In 2002 the Town of Redding found a partner to restore and revitalize the 55-acre wire mill site centered around a new<br />
train station on the <strong>Metro</strong>-North line.<br />
Groundbreaking occurred in 2006 with an estimated completion date in 2009. <strong>The</strong> new TOD will be guided by the<br />
principles of sustainable green development. It will include:
• Renovation of historically significant structures;<br />
• Functional green technology, including photovoltaic’s and green roofs;<br />
• Hydroelectric dam and power plant using the existing infrastructure for power;<br />
• New train station on the <strong>Metro</strong>-North line;<br />
• Mixed use development with a diverse community of single-family houses, townhouses, affordable senior housing, and<br />
affordable artist work/live lofts;<br />
• Wide assortment of retailers which reflect the needs of the residents and complement the character of the TOD; and<br />
• Pedestrian-friendly environment with a village center, open public spaces and easy access to public transportation.<br />
Stamford:<br />
<strong>The</strong> pursuit of transit-oriented development is a main component of Stamford’s efforts to make the city a national leader<br />
in sustainability. Stamford has pursued TOD as a strategy to:<br />
• create an active and pedestrian-friendly environment in the city’s core business center;<br />
• increase density on the city’s main street;<br />
• build new residential neighborhoods around Stamford’s train stations;<br />
• promote the rehabilitation and redevelopment of the city’s South End neighborhood including a feasibility study for a<br />
light rail line connecting the South End to the north side of downtown Stamford; and<br />
• expand the city’s walkable and lively historic center.<br />
In June 2008 ground was broken for the development of the <strong>Metro</strong> Green Apartments, which is the first phase of <strong>Metro</strong><br />
Green Residential. <strong>The</strong> project will include 238 mixed-income rental and for-sale residences on a mixed-use, TOD site. <strong>The</strong><br />
<strong>Metro</strong> Green project will serve as a model for smart growth in Connecticut and beyond. In addition to the residential units,<br />
<strong>Metro</strong> Green will feature a 350,000-square-foot, 17-story, “best in class” LEED Platinum candidate office tower, as well as<br />
numerous public improvements to the streetscapes in the area, including the creation of a new public plaza.<br />
Smart Fleets <strong>Report</strong><br />
<strong>The</strong> Smart Fleets Taskforce was convened to develop and evaluate sustainability strategies for energy consumption within<br />
the <strong>MTA</strong>’s subway and commuter rail networks. It is composed of lead rail-car designers from New York City <strong>Transit</strong>, Long<br />
Island Rail Road, and <strong>Metro</strong>-North Railroad. To date, the committee’s work has focused on improving efficiency, weight<br />
savings, and reducing total energy demand without compromising performance or passenger service. <strong>The</strong> existing vehicle<br />
equipment/systems, vehicles currently being procured – and the requirements for future fleets – were all considered with<br />
regard for the unique operating demands and regulatory environment for each agency.<br />
NYCT has taken the lead in analyzing a number of weight savings and energy management concepts. For the purposes of<br />
this study, these concepts can be categorized as either feasible on new vehicles or as a retrofit, or concepts with significant<br />
promise for future vehicles. This report summarizes the status of NYCT’s work in these areas.<br />
This report is available at www.mta.info/environment.<br />
Climate Adaptation<br />
An unabridged version of the paper informing the Climate Adaptation chapter of this report <strong>MTA</strong> Adaptations to Climate<br />
Change – A Categorical Imperative, prepared by Klaus Jacob (Lamont-Doherty Earth Observatory) and Cynthia Rosenzweig,<br />
Radley Horton, David Major and Vivien Gornitz (Center for Climate Systems Research, Columbia University) can be found<br />
at www.mta.info/environment.<br />
89
94<br />
www.mta.info/environment