

Prescient presentation - Petmin
Prescient presentation - Petmin
Prescient presentation - Petmin

Create successful ePaper yourself
Turn your PDF publications into a flip-book with our unique Google optimized e-Paper software.
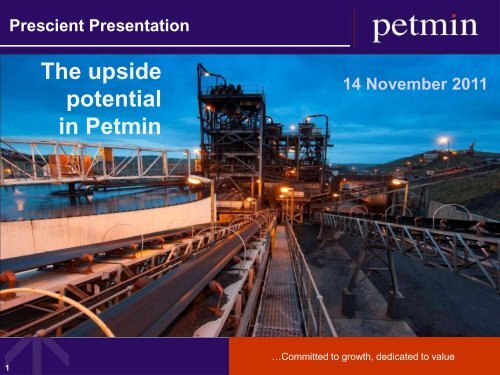
1<br />
<strong>Prescient</strong> Presentation<br />
The upside<br />
potential<br />
14 November 2011<br />
The content of this <strong>presentation</strong> is for general information purposes only and is not intended to serve as financial, investment or any other type of advice. In particular,<br />
the information contained herein is not intended to be and shall not be deemed to be an invitation or inducement to invest in or otherwise deal in any securities of<br />
<strong>Petmin</strong> or in any other investment. Any reliance on the information contained herein is at the user's own risk.<br />
Furthermore, this <strong>presentation</strong> may contain certain forward-looking statements concerning <strong>Petmin</strong>’s operations, economic performance and financial condition, and<br />
plans and expectations. These statements, including without limitation, those concerning the market outlook for the company’s products, expectations of prices,<br />
production, the commencement and completion of certain exploration and production projects, may contain forward-looking views. Such views involve both known<br />
and unknown risks, assumptions, uncertainties and other important factors that could materially influence the actual performance of the company. No assurance can<br />
be given that in these will <strong>Petmin</strong><br />
prove to be correct and no re<strong>presentation</strong> or warranty express or implied is given as to the accuracy or completeness of such views or as to<br />
any of the other information in this <strong>presentation</strong>. <strong>Petmin</strong>’s future results may differ materially from past or current results, and actual results may differ materially from<br />
those projected in the forward-looking statements.<br />
<strong>Petmin</strong> will not be responsible for any loss or damage howsoever arising of any nature, including consequential loss or damage suffered or incurred, directly or<br />
indirectly, pursuant to or as a result of the use of, or any reliance on, this <strong>presentation</strong> or the information contained herein.<br />
You are hereby deemed to have agreed that any dispute of whatsoever nature relating to or arising out of any use of this <strong>presentation</strong>, whether directly or indirectly,<br />
shall be governed by the laws of the Republic of South Africa, and shall be subject to the exclusive jurisdiction of the courts of the Republic of South Africa.<br />
You are further hereby deemed to have acknowledged that you have read and understood this disclaimer and agree to be bound by these terms and conditions. Use<br />
of this <strong>presentation</strong> indicates acceptance of these terms and conditions.<br />
This <strong>presentation</strong> and any accompanying management discussion of this <strong>presentation</strong> ("Presentation") is given by <strong>Petmin</strong> Limited ("Company") to persons: (i) that<br />
the Company reasonably believes are of a kind described in either article 19(5) (investment professionals) or article 49(2)(a) to (d) (high net worth companies,<br />
unincorporated associations, etc) of the Financial Services and Markets Act 2000 (Financial Promotion) Order 2005; or (ii) to whom it may otherwise be lawfully<br />
given, (all such persons together being referred to as "relevant persons"). This <strong>presentation</strong> must not be acted on or relied on by persons who are not relevant<br />
persons. Any investment or investment activity to which this Presentation relates is available only to relevant persons and will be engaged in only with relevant<br />
persons.<br />
No offer or invitation or solicitation of any offer to acquire securities of the Company is being made at this time nor does this Presentation constitute or form a<br />
prospectus or part of any invitation or inducement to engage in investment activity (within the meaning of section 21 of the Financial Services and Markets Act 2000<br />
("FSMA")).<br />
No reliance may be placed for any purpose whatsoever on the information or opinions contained in or given during this Presentation. The information and opinions<br />
contained in or given during this Presentation are provided as at the date hereof, are not necessarily complete and are subject to change without notice.<br />
…A STRONG …Committed PLATFORM to growth, FOR dedicated FUTURE to value GROWTH
2<br />
Disclaimer<br />
The content of this <strong>presentation</strong> is for general information purposes only and is not intended to serve as financial, investment or any other type of advice. In particular,<br />
the information contained herein is not intended to be and shall not be deemed to be an invitation or inducement to invest in or otherwise deal in any securities of<br />
<strong>Petmin</strong> or in any other investment. Any reliance on the information contained herein is at the user's own risk.<br />
Furthermore, this <strong>presentation</strong> may contain certain forward-looking statements concerning <strong>Petmin</strong>’s operations, economic performance and financial condition, and<br />
plans and expectations. These statements, including without limitation, those concerning the market outlook for the company’s products, expectations of prices,<br />
production, the commencement and completion of certain exploration and production projects, may contain forward-looking views. Such views involve both known<br />
and unknown risks, assumptions, uncertainties and other important factors that could materially influence the actual performance of the company. No assurance can<br />
be given that these will prove to be correct and no re<strong>presentation</strong> or warranty express or implied is given as to the accuracy or completeness of such views or as to<br />
any of the other information in this <strong>presentation</strong>. <strong>Petmin</strong>’s future results may differ materially from past or current results, and actual results may differ materially from<br />
those projected in the forward-looking statements.<br />
<strong>Petmin</strong> will not be responsible for any loss or damage howsoever arising of any nature, including consequential loss or damage suffered or incurred, directly or<br />
indirectly, pursuant to or as a result of the use of, or any reliance on, this <strong>presentation</strong> or the information contained herein.<br />
You are hereby deemed to have agreed that any dispute of whatsoever nature relating to or arising out of any use of this <strong>presentation</strong>, whether directly or indirectly,<br />
shall be governed by the laws of the Republic of South Africa, and shall be subject to the exclusive jurisdiction of the courts of the Republic of South Africa.<br />
You are further hereby deemed to have acknowledged that you have read and understood this disclaimer and agree to be bound by these terms and conditions. Use<br />
of this <strong>presentation</strong> indicates acceptance of these terms and conditions.<br />
This <strong>presentation</strong> and any accompanying management discussion of this <strong>presentation</strong> ("Presentation") is given by <strong>Petmin</strong> Limited ("Company") to persons: (i) that<br />
the Company reasonably believes are of a kind described in either article 19(5) (investment professionals) or article 49(2)(a) to (d) (high net worth companies,<br />
unincorporated associations, etc) of the Financial Services and Markets Act 2000 (Financial Promotion) Order 2005; or (ii) to whom it may otherwise be lawfully<br />
given, (all such persons together being referred to as "relevant persons"). This <strong>presentation</strong> must not be acted on or relied on by persons who are not relevant<br />
persons. Any investment or investment activity to which this Presentation relates is available only to relevant persons and will be engaged in only with relevant<br />
persons.<br />
No offer or invitation or solicitation of any offer to acquire securities of the Company is being made at this time nor does this Presentation constitute or form a<br />
prospectus or part of any invitation or inducement to engage in investment activity (within the meaning of section 21 of the Financial Services and Markets Act 2000<br />
("FSMA")).<br />
No reliance may be placed for any purpose whatsoever on the information or opinions contained in or given during this Presentation. The information and opinions<br />
contained in or given during this Presentation are provided as at the date hereof, are not necessarily complete and are subject to change without notice.<br />
…A STRONG …Committed PLATFORM to growth, FOR dedicated FUTURE to value GROWTH
3<br />
Disclaimer<br />
No re<strong>presentation</strong>, warranty or undertaking is given by or on behalf of the Company, sponsor, nomad, or their respective directors, officers, employee, agents and<br />
advisers as to the accuracy, completeness or reasonableness of the information or opinions contained in or given during this Presentation and no liability is accepted or<br />
incurred by any of them for or in respect of any such information or opinions, provided that nothing in this paragraph shall exclude liability for any re<strong>presentation</strong> or<br />
warranty made fraudulently. The sponsor or nomad does not have any authority to make any re<strong>presentation</strong> or warranty on behalf of the Company or any other person<br />
connected with the Company.<br />
The contents of this Presentation are confidential and must not be copied, published, reproduced, distributed or passed in whole or in part to others at any time by<br />
recipients and its contents are confidential. This Presentation is being provided to recipients on the basis that they keep confidential any information or opinions contained<br />
herein or otherwise made available, whether oral or in writing, in connection with the Company. In particular, this Presentation should not be distributed, published or<br />
reproduced in whole or in part or disclosed by recipients and, in particular, should not be distributed to United States residents, corporations or other entities, US Persons<br />
(as defined in Regulation S promulgated under the United States Securities Act of 1933 (as amended)), persons with addresses in the United States of America (or any of<br />
its territories or possessions), Canada, Japan, the Republic of Ireland, the Republic of South Africa or Australia, or to any corporation, partnership or other entity created<br />
or organised under the laws thereof, or in any other country outside the United Kingdom where such distribution may lead to a breach of any law or regulatory<br />
requirement.<br />
Statements, beliefs and opinions contained in this Presentation, particularly those regarding the possible or assumed future financial or other performance of the<br />
Company, industry growth or other trend projections are or may be forward-looking statements, beliefs or opinions and as such involve risks and uncertainties. Actual<br />
results and developments may differ materially from those expressed or implied by such statements, beliefs or opinions, depending on a variety of factors and accordingly<br />
there can be no assurance that the projected results, projections or developments will be attained. No re<strong>presentation</strong> or warranty, express or implied, is given or made by<br />
the Company or any of its respective directors, employees or advisers or any other person as to the achievement or reasonableness of, and no reliance should be placed<br />
on any projections, targets, estimates or forecasts or the statements, beliefs and opinions expressed in this Presentation and nothing in this Presentation is or should be<br />
relied on as a promise or re<strong>presentation</strong> for the future.<br />
The sponsor or nomad is acting exclusively for the Company and is not acting for any other person or treating any other person as its client and will not be responsible to<br />
anyone other than the Company for providing the protections afforded to clients of the sponsor or nomad, or for providing advice in relation to any offering of securities in<br />
the Company.<br />
No recipient of or attendee at this Presentation should deal in or attempt to deal in or otherwise engage in any behaviour which would or might constitute market abuse<br />
(as defined in section 118 of FSMA) in relation to any securities or other qualifying investments to which this Presentation relates. This Presentation may contain inside<br />
information and accordingly recipients of or attendees at this Presentation will not be able to deal in any securities of the Company before the information is made public<br />
in accordance with (i) the insider dealing provisions of Part V of the Criminal Justice Act 1993 and/ or (ii) the market abuse provisions of Chapter VIII of the South African<br />
Securities Act 2004 (the "Securities Act") . No individual within the Company or its sponsor or nomad is, by virtue of making this Presentation, encouraging recipients of<br />
or attendees at this Presentation to deal in accordance with section 52(2)(a) of the Criminal Justice Act 1993 or section 73(4) of the Securities Act.<br />
By agreeing to attend or receive this Presentation you: (i) represent and warrant that you are a relevant person; and (ii) agree to the foregoing (including, without<br />
limitation, that the liability of the Company, its sponsor or nomad and their respective directors, officers, employees, agents and advisors shall be limited in the manner<br />
described above). IF YOU ARE NOT A RELEVANT PERSON OR DO NOT AGREE WITH THE FOREGOING, PLEASE IDENTIFY YOURSELF IMMEDIATELY.<br />
…A STRONG …Committed PLATFORM to growth, FOR …exceeding dedicated FUTURE to expectations<br />
value GROWTH
<strong>Prescient</strong> <strong>presentation</strong> – 14 November 2011<br />
1. About <strong>Petmin</strong><br />
2. Strategy<br />
3. Business of Today<br />
4. Business of Tomorrow<br />
5. Results and highlights
5<br />
<strong>Petmin</strong>’s share price outperformed<br />
JSE General Mining and Small Cap indices<br />
Equity<br />
CAGR last 5 years<br />
(Excluding Dividends)<br />
Psg 20.7%<br />
Capitec 41.5%<br />
Anglo 8.3%<br />
Billiton 18.7%<br />
<strong>Petmin</strong> (since inception 2004/5) 40%<br />
…Committed …A PLATFORM to growth, FOR dedicated GROWTH to value
6<br />
About <strong>Petmin</strong><br />
Cash-producing dividend-paying high-growth junior miner<br />
Listed on AIM (PTMN) and JSE (PET)<br />
Market cap R1.5 billion<br />
Proven experienced management team<br />
580 million shares in issue<br />
119 m shares traded 1/7/10 – 30/6/11 (34% of free float)<br />
Significant management and BEE shareholding (40%)<br />
…Committed …A PLATFORM to growth, FOR dedicated GROWTH to value
Current overview of <strong>Petmin</strong><br />
7<br />
Red Crescent<br />
Resources<br />
Corporate<br />
investment in<br />
a junior mining<br />
company with<br />
assets in<br />
Turkey<br />
Iron Bird JV<br />
JV with<br />
Humming Bird<br />
Resources, a<br />
early stage<br />
Liberian Iron<br />
Ore Project<br />
<strong>Petmin</strong><br />
US$ 0m US$ 4.6m US$ 2.0m US$ 3.5m ZAR 98m<br />
0%<br />
SIVAS<br />
Currently<br />
owned 75%<br />
by RCR<br />
Turkey and<br />
25% by local<br />
partners<br />
10.1% 50% 10.7% 25% 100% 100%<br />
Canadian<br />
Iron Sands<br />
Copper Copper, Iron ore Iron sands<br />
zinc<br />
and pig<br />
iron<br />
Projects<br />
Operations<br />
Veremo<br />
Holdings<br />
(Pty) Ltd<br />
SamQuarz<br />
(Pty) Ltd<br />
SamQuarz<br />
Silica Mine<br />
Tendele Coal<br />
Mining (Pty)<br />
Ltd<br />
Somkhele<br />
Anthracite<br />
Mine<br />
Pig iron Silica Metallurgical<br />
anthracite<br />
…turning …Committed development to projects growth, …exceeding into dedicated cash generative to expectations<br />
value assets
Geographic diversification<br />
8<br />
A<br />
B<br />
C<br />
D<br />
E<br />
F<br />
•Anthracite<br />
South Africa: 100%-owned cash-generating<br />
Somkhele anthracite mine<br />
•Silica<br />
South Africa: 100%-owned cash-generating<br />
SamQuarz silica mine<br />
•Iron ore<br />
South Africa: 25% of Veremo pig iron project<br />
Liberia: 50% of Mount Ginka iron ore<br />
exploration project<br />
Canada: Up to 49.9% of iron sands<br />
exploration and development project<br />
•Copper<br />
Turkey: Up to 37.5% of Sivas copper<br />
exploration project and 10% stake in Red<br />
Crescent Resources with zinc and manganese<br />
prospects<br />
E<br />
E<br />
D<br />
F<br />
A<br />
B C<br />
…Committed …A PLATFORM to growth, FOR dedicated GROWTH to value
9<br />
Significant upside potential as at 30 June 2011<br />
<strong>Petmin</strong> is trading at a discount to the directors’ valuation<br />
Market Capitalisation (09 November2011) ~R1.5bn<br />
Current share price = R2.59<br />
Somkhele R2.388bn (DCF @ 10% Real, net of debt)<br />
SamQuarz R0.231bn (Estimated after tax proceeds on sale)<br />
Veremo R0.496bn (Audited Valuation – FY11)<br />
Projects* R0.022bn (Cost of investments – FY11)<br />
Cash R0.228bn<br />
Corporate Office -R0.336bn (NPV over 20 years)<br />
TOTAL R3.029bn<br />
NAV per Share (with Corporate) R4.95 (612m shares fully diluted)<br />
*Huge optionality and value<br />
…Committed to Growth, dedicated to value
<strong>Petmin</strong>’s shareholder base<br />
10<br />
BEE shareholders include:<br />
Dark Capital (Pty) Ltd<br />
G Sibiya<br />
Lebo Mogotsi<br />
Umsobomvu Coal (Pty) Ltd<br />
Lebone Resources (Pty) Ltd<br />
Clidet 449 (Pty) Ltd<br />
Clidet 611 (Pty) Ltd<br />
Mantratime (Pty) Ltd<br />
28%<br />
15%*<br />
Management Other shareholders<br />
18%<br />
* – This excludes 3% of management equity included under BEE shareholders – total<br />
management shareholding is therefore 18%<br />
39%<br />
Institutional shareholders<br />
include:<br />
PSG Palladin<br />
Investec<br />
CoroCapital<br />
PIC<br />
Metlife<br />
BlackRock<br />
Old Mutual<br />
Traxys<br />
RMB<br />
Sanlam<br />
Nedcor<br />
SBSA / Stanlib<br />
‘Free Float’ 60%<br />
• Excludes strategic BEE<br />
• Excludes management<br />
40%<br />
• Management/strategic BEE<br />
10<br />
…Committed to growth, dedicated to value
<strong>Petmin</strong> Board and management governance structure<br />
11<br />
11<br />
…Committed to growth, dedicated to value
Investor <strong>presentation</strong> – 14 November 2011<br />
1. About <strong>Petmin</strong><br />
2. Strategy<br />
3. Business of Today<br />
4. Business of Tomorrow<br />
5. Results and highlights
Urbanisation and infrastructure<br />
Los Angeles<br />
18.8m<br />
Sources: McKinsey Global Institute, ‘ Urban World: Mapping the<br />
Economic Power of Cities’, 2011<br />
13<br />
Mexico City 22.9m<br />
The cause and effect of global economic growth<br />
New York 22m<br />
Rio 12.6m<br />
Sao Paulo 20.8m<br />
Buenos Aires 14.8m<br />
London 12.3m<br />
Paris 10.5m<br />
Istanbul 13.7m<br />
Lagos 12.2m<br />
Tehran 13.2m<br />
Moscow 14.8m<br />
Karachi<br />
16.9m<br />
Mumbai<br />
23.5m<br />
Delhi<br />
24.1m<br />
Dhaka<br />
14.1m<br />
Calcutta<br />
16.7m<br />
26 cities today with population >10 million people<br />
13 more cities with > 10 million people by 2025<br />
Jakarta<br />
18.8m<br />
250 million more urbanised Indians and Chinese by 2020<br />
Seoul 24.6m<br />
Beijing 14m<br />
Shanghai 18.8m<br />
Guangdong 25.1m<br />
Manila<br />
20.2m<br />
Tokyo 34.3m<br />
Osaka 16.8m<br />
…Committed to growth, dedicated to value
The steel and infrastructure value chain<br />
Sources: Peabody Energy, ‘Barclays CEO Energy-Power Conference’, Sep<br />
2010; World Steel Association, 2011<br />
14<br />
19 Mt<br />
1600 Mt<br />
893 Mt<br />
643 Mt<br />
11 Mt<br />
…Committed to growth, dedicated to value
Urbanisation has a double effect on steel demand, with<br />
more people AND greater steel usage per person<br />
Sources: Peabody Energy, ‘Barclays CEO Energy-Power Conference’, Sep<br />
2010; Central Intelligence Agency, ‘The World Factbook’, 2011; US<br />
Census Bureau, ‘International Database’, 2011; United Nations,<br />
‘2009 Revision Population Database’, 2011; IMF, ‘World Economic<br />
Outlook’, 2011<br />
15<br />
Country<br />
Population:<br />
million (percentage)<br />
2010 2015 2020<br />
Urbanisation:<br />
million (percentage)<br />
Urbanisation:<br />
million (percentage)<br />
Urbanisation:<br />
million (percentage)<br />
Japan 127 85 (67%) 86 (68%) 86 (69%)<br />
China 1 398 636 (47%) 713 (51%) 787 (55%)<br />
India 1 215 365 (30%) 411 (32%) 463 (34%)<br />
Brazil 195 169 (87%) 179 (88%) 187 (90%)<br />
Korea 48 40 (83%) 42 (84%) 42 (86%)<br />
Rest of world 3 921 2192 (55%) 2394 (57%) 2610 (58%)<br />
World total 6 904 3 486 (51%) 3 824 (52%) 4 176 (54%)<br />
World total population 6904 7298 7 677<br />
% urban<br />
90<br />
80<br />
70<br />
60<br />
50<br />
40<br />
30<br />
20<br />
10<br />
Global urbanisation growth 2010-2050<br />
2010 2050<br />
India and China total<br />
urbanised growth<br />
2010-2020<br />
= 250 million people<br />
~ 700 million to cities<br />
~ 800 million ‘new’<br />
people<br />
…turning …Committed development to projects growth, …exceeding into dedicated cash generative to expectations<br />
value assets
Production (mt)<br />
Rising steel production is evident in China and India,<br />
with burgeoning infrastructure and urbanisation<br />
2500<br />
2000<br />
1500<br />
1000<br />
500<br />
0<br />
Global steel production and Asian growth<br />
World production<br />
in 2000: 549mt<br />
Other 26mt<br />
India<br />
40mt<br />
China<br />
499mt<br />
•World growth<br />
World production<br />
in 2010: 1414mt<br />
Other<br />
412mt<br />
India<br />
135mt<br />
China<br />
485mt<br />
•World growth<br />
World production in<br />
2025: 2446mt<br />
2000 2010 2025<br />
Sources: BHP Billiton, ‘Industry Outlook for the Next Decade’, Apr 2011; Rio<br />
Tinto, Tinto ‘Coal Australia Financial Community Presentation’, Jun<br />
2010; World Steel Association, 2011; Macquarie ‘China Day<br />
Presentations’, Nov 2010; Rio Tinto ‘Coal Australia Financial<br />
16 Community Presentation’, Jun 2010; Anglo American, ‘Global Iron Ore<br />
and Steel Forecast Presentation’, Mar 2011<br />
Commercial<br />
construction<br />
7%<br />
Industrial<br />
construction<br />
7%<br />
Regional steel consumption growth (mt)<br />
2000 2008 2020<br />
China 140 450 870<br />
India 30 50 160<br />
East Asia 130 150 145<br />
Western Europe 150 160 170<br />
North America 160 140 180<br />
South America 25 50 80<br />
Middle East and Africa 35 65 100<br />
2020 steel consumption by sector<br />
Infrastructure<br />
14%<br />
Machinery<br />
19%<br />
Other<br />
15%<br />
Residential<br />
Residential<br />
consumption construction 18%<br />
18%<br />
Appliances<br />
6%<br />
Automobiles<br />
10%<br />
Shipbuilding<br />
4%<br />
2020 steel consumption<br />
India<br />
8%<br />
…Committed to growth, dedicated to value<br />
Rest of world<br />
50%<br />
China<br />
42%
The effect of urbanisation and infrastructure<br />
development on the steel value chain<br />
17<br />
$900/t = over<br />
$1 trillion<br />
industry<br />
Sources: MEPS, ‘World Composite Steel Price’, Apr 2011; Standard Bank,<br />
‘Commodities Daily’, May 2011<br />
$4 200/t = over<br />
$100 billion<br />
industry<br />
$9 000/t=<br />
almost $200<br />
billion industry<br />
…turning …Committed development to projects growth, …exceeding into dedicated cash generative to expectations<br />
value assets
Vision: To develop into a geographically diversified, multicommodity<br />
mining company that will deliver sustainable and<br />
superior returns to shareholders<br />
18<br />
Strategy<br />
Organic and acquisitive growth<br />
Focusing on a mix of quality cash-producing assets and projects that create “optionality”<br />
Capitalise on the steel value chain and focus on commodities that support infrastructure development and urbanisation<br />
COMMODITIES<br />
<strong>Petmin</strong> is focussed on infrastructure<br />
development and urbanisation<br />
commodities such as:<br />
• Copper<br />
• Iron Ore<br />
• Metallurgical coals (coking &<br />
anthracite)<br />
• Manganese<br />
• Chrome<br />
• Other steel additives<br />
• Potash<br />
PETMIN ACQUISITION Leadership<br />
STRATEGY<br />
Our “Leadership at the Corporate Centre” is tasked with implementing the Board Approved Strategies and setting the tone for the business<br />
The role of the Corporate Centre is to allocate capital and employ the best possible teams for the various projects/operations<br />
The management system is decentralised and each management team is disciplined, innovative and entrepreunaral<br />
Goal<br />
To deliver sustained and superior risk-adjusted returns (capital growth and dividend) to its stakeholders<br />
PETMIN – 2010<br />
Market Cap ~ $250m<br />
JSE Main Board<br />
LSE Aim Market<br />
Anthracite/Silica Operations<br />
Iron Ore / Pig Iron Projects<br />
Predominantly South African Assets<br />
2010 – 2015<br />
Potentially through one transaction or a series of<br />
transactions<br />
GEOGRAPHIES<br />
<strong>Petmin</strong> will invest in politically-stable countries with security of tenure<br />
INVESTMENT CRITERIA<br />
• Opportunities must have a long potential life of mine i.e. >20 years<br />
• The ore body must be of high quality and yield a return (IRR) of at least 20%<br />
• Projects must have the ability to produce at least $30m PBT per annum at full<br />
production<br />
• Operations must be at the bottom 50% of the cost curve<br />
• Projects should be able to produce BFS within 36 months of initial investment<br />
• Dividend and gearing policies to be maintained<br />
PETMIN – 2015<br />
Market Cap > $600m<br />
Listed on LSE Main Board<br />
FTSE 250<br />
Infrastructure Based Commodities – mix of<br />
cash producing operations & projects<br />
South Africa Assets
Our strategy is based on key pillars<br />
19<br />
…Committed …A PLATFORM to growth, FOR dedicated GROWTH to value
The Strategic Objectives for the next 3 years<br />
20<br />
Overall<br />
• To de-risk <strong>Petmin</strong> for all shareholders, by reducing our<br />
dependence on one geographic region and one<br />
commodity through geographic diversification spread<br />
across our chosen range of commodities that feed into<br />
the steel value chain<br />
• To continuously evaluate the performance of our assets<br />
to ensure superior returns through investment and<br />
divestment<br />
• To ensure sustainable organic growth in our cash<br />
producing assets<br />
• To maintain our dividend policy of paying 20% of HEPS<br />
• To maintain a debt to equity ratio of less than 30%<br />
• To acquire cash producing assets that produce at a price<br />
that will ensure a long-tern return well in excess of our<br />
cost of capital<br />
• To prudently allocate our capital resources between cash<br />
generating operations and a quality pipeline of<br />
development asset<br />
• To move our London AIM listing to the Main Board and to<br />
become part of the FTSE Top 250 Index by 2015<br />
• Continue the culture of zero harm to employees and<br />
minimal impact on the environment<br />
Business of Today<br />
• To ensure Operational Excellence<br />
• To ensure Value added Growth<br />
• To Securing the future<br />
• To successfully close the sale of SamQuarz<br />
• To ensure sustainable organic growth at Somkhele<br />
To successfully commission the Second Plant at<br />
Somkhele<br />
To ensure a “life of Mine” in excess of 20 years at full<br />
production<br />
To ensure the conversion of all prospecting permits into<br />
New Order Mining Licence<br />
To ensure sufficient export capacity<br />
Business of Tomorrow<br />
• To ensure Value added Growth<br />
• To Securing the future<br />
To acquire cash producing assets that produce at a<br />
price that will ensure a long-tern return well in excess of<br />
our cost of capital<br />
To invest in a quality pipeline of development assets<br />
To achieve the objectives iro Veremo, Iron Bird, Sivas<br />
and NAIC as outlined elsewhere<br />
…A STRONG …Committed PLATFORM to growth, FOR …exceeding dedicated FUTURE to expectations<br />
value GROWTH
<strong>Petmin</strong> valuation curve – Huge optionality embedded in<br />
projects<br />
21<br />
Value curve<br />
• Exploration projects don’t generate cash flows or earnings and<br />
are difficult to value. Therefore management must move them up<br />
the value curve<br />
• Each stage of the value curve has a clear set of deliverables<br />
• There are a range early evaluation techniques (e.g. Aeromag,<br />
Lydar etc.)<br />
• Successful drilling results determine if feasibility study<br />
undertaken<br />
• Once the feasibility study is complete, there is the option to<br />
develop the resource by committing capital or relinquish the<br />
undeveloped resource<br />
Valuing a mining company with multiple resources<br />
• The preferred approach is to consider each resource separately<br />
as an option, value it and add the values of the options to<br />
determine the company’s value<br />
• Valuing a mining company:<br />
Value of developed resource (DCF Valuation: cash flow from<br />
extraction and sale of cash flow)<br />
+<br />
Value of undeveloped resources (Option Valuation: option<br />
value of undeveloped resources (individually or aggregate)<br />
= Value of Assets<br />
…A STRONG …Committed PLATFORM to growth, FOR …exceeding dedicated FUTURE to expectations<br />
value GROWTH
<strong>Petmin</strong> strategy<br />
22<br />
Focus on steel value chain and commodities required for urbanisation and<br />
infrastructure development<br />
•Rigorous investment criteria<br />
•Track record of developing assets for superior shareholder returns<br />
• Stable cash-generating operations in SA with expansion potential<br />
•Global expansion into high-potential exploration projects in Africa, Turkey<br />
and North America<br />
…A STRONG …Committed PLATFORM to growth, FOR …exceeding dedicated FUTURE to expectations<br />
value GROWTH
Investor <strong>presentation</strong> – 14 November 2011<br />
1. About <strong>Petmin</strong><br />
2. Strategy<br />
3. Business of Today<br />
4. Business of Tomorrow<br />
5. Results and highlights
South Africa’s largest anthracite producer, Somkhele, has<br />
a capacity of 1.3 Mtpa of specialised metallurgical coal<br />
Sources: CAMR, Feb 2010<br />
24<br />
Somkhele highlights<br />
Location • KZN, 85km north of Richards Bay Port<br />
Mining<br />
Commissioning<br />
Reserves and<br />
Resources<br />
Mineral Rights<br />
Plant<br />
People<br />
• Five areas with four coal seams (Areas 1 and<br />
2 under production)<br />
• B Seam up to 15m thick<br />
• Acquired in 2005 at pre-feasibility stage<br />
• Commissioned opencast mine and plant in<br />
June 2007<br />
• SAMREC-compliant resources of 51 Mt<br />
• Areas 1-3 reserves = 23.3 Mt<br />
• Process underway to ensure 20 year LOM<br />
• New Order Mining Rights for Area 1<br />
• Conversion of Areas 2 and 3 granted<br />
• Prospecting rights successfully renewed for<br />
Areas 4 and 5 covering 22,000 ha<br />
• Plant 1 capacity: 530,000 saleable tpa<br />
• Plant 2 capacity: 850,000 saleable tpa<br />
• 800 employees (including contractors)<br />
• 80% of employees are from local community<br />
US$/t<br />
800<br />
700<br />
600<br />
500<br />
400<br />
300<br />
200<br />
100<br />
0<br />
Anthracite and coke price comparison<br />
Mar-06<br />
Jun-06<br />
Sep-06<br />
Dec-06<br />
Mar-07<br />
Jun-07<br />
Sep-07<br />
Dec-07<br />
Mar-08<br />
Jun-08<br />
Sep-08<br />
Dec-08<br />
Mar-09<br />
Jun-09<br />
Sep-09<br />
Dec-09<br />
Mar-10<br />
Anthracite lumps c&f, Northern Europe China export coke<br />
…Committed …A PLATFORM to growth, FOR dedicated GROWTH to value
Somkhele anthracite mine<br />
25<br />
More than doubling production at cash-generating Somkhele mine in KwaZulu<br />
SA’s largest producer of anthracite – a specialised metallurgical coal<br />
2010/11 output – 524,000 tonnes produced and 579,000 tonnes sold<br />
More than doubling production to meet demand to more than a million tonnes by end Q1 2012<br />
45% export to metallurgical industry<br />
55% domestic customers in ferrochrome industry<br />
Capital expenditure R140 million on second wash plant<br />
…A STRONG …Committed PLATFORM to growth, FOR …exceeding dedicated FUTURE to expectations<br />
value GROWTH
Somkhele anthracite mine<br />
26<br />
Accelerated R54m three year<br />
Somkhele exploration<br />
programme<br />
•Prospecting rights over 22,000 ha<br />
successfully renewed<br />
•Mining on 1,400 ha and exploration<br />
of 2,500 ha to date<br />
•Life of mine exceeds 20 years at<br />
full production today<br />
•Exploration to increase resource,<br />
enable further expansion, and<br />
extend life of mine<br />
Total at the start of<br />
the exploration<br />
campaign<br />
Reserves added during 2011<br />
• Probable: 21.12Mt<br />
• Proven: 6.33Mt<br />
27.45Mt<br />
Exploration Percussion Core<br />
No m No m No m<br />
41 4191 210<br />
Total cost of exploration – R23.3m<br />
Saleable Product (@42%) - 11.53Mt<br />
Average cost per ton ~ R2<br />
Average margin per ton ~ R300<br />
Exploration Results<br />
26<br />
345<br />
111 2 696<br />
…A STRONG …Committed PLATFORM to growth, FOR …exceeding dedicated FUTURE to expectations<br />
value GROWTH
Somkhele anthracite mine<br />
27<br />
…A STRONG …Committed PLATFORM to growth, FOR …exceeding dedicated FUTURE to expectations<br />
value GROWTH
28<br />
Performance Summary 2010 and 2011 - Somkhele<br />
Anthracite (Somkhele)<br />
2011 Reviewed 2010 Audited Variance Variance %<br />
Tonnes produced 524 006 467 843 56 163 12.0%<br />
Tonnes sold 579 087 411 630 167 457 40.7%<br />
- local 269 739 219 162 50 577 23.1%<br />
- export 309 348 192 468 116 880 60.7%<br />
Turnover (R’000) 471 385 334 880 136 505 40.8%<br />
- local (R’000) 242 554 178 041 64 513 36.2%<br />
- export (R’000) 228 831 156 839 71 892 45.84%<br />
PBT (R’000) 117 006 120 402 -3 396 -2.8%<br />
PAT (R’000) 83 407 87 947 -4 540 -5.2%<br />
Average cost at mine gate per tonne (R) 555.31 438.18 117.13 26.7%<br />
Average sales price per tonne(R) 814.01 813.55 0.46 0.1%<br />
- local 899.22 812.37 86.85 10.7%<br />
- export 739.72 814.88 -75.16 -9.2%<br />
Average dollar price of exports ($) 112.06 109.96 2.10 1.9%<br />
Weighted average Rand/$ exchange rate 6.6011 7.4107 -0.8096 -10.9%<br />
Margin: PBT/Turnover 24.82% 35.95% -11.13 -31.0%<br />
Profit per tonne sold (before tax) R202.05 R292.50 -90.45 -30.9%<br />
…turning …A STRONG development PLATFORM projects …exceeding FOR into cash FUTURE generative expectations GROWTH assets
29<br />
Performance Summary 2010 and 2011 - Somkhele<br />
Anthracite (Somkhele)<br />
2011 Reviewed 2010 Audited Variance Variance %<br />
Average cost at mine gate per tonne (R) 555.31 438.18 117.13 26.7%<br />
Cost of run-of-mine coal 298.02 191.29 106.73 55.8%<br />
Plant processing 97.21 102.39 -5.18 -5.1%<br />
Other overhead costs (includes <strong>Petmin</strong> fees) 127.39 115.36 12.03 10.4%<br />
Depreciation 32.69 29.14 3.55 12.2%<br />
Average cost at mine gate per tonne (R) 555.31 438.18 117.13 26.7%<br />
• The increased amount of overburden to be moved in this higher strip ratio environment resulted in an increase in<br />
mining cost of 56% when moving from a strip ratio of 1.7:1 in Area 2 to a strip ratio of 4:1 in Area 1.<br />
• The increase in production and sales volumes combined with efficiency improvements enabled Somkhele to limit<br />
the increase in total cost per tonne (at mine gate) to 26.7%<br />
• Average Cost at Mine Gate estimated to be R 650 for 2012 as ALL production will come fro Area 1 (Revised strip<br />
ratio of 3.8:1).<br />
…turning …A STRONG development PLATFORM projects …exceeding FOR into cash FUTURE generative expectations GROWTH assets
30<br />
Targeted net profit (“both plants in production”) – R’000<br />
Net margin (R/t)^<br />
Contribution/ton<br />
Total Production (Including 2nd plant) – 000tpa<br />
1100 1200 1300 1400<br />
R 200 R 220 000 R 240 000 R 260 000 R 280 000<br />
R 250 R 275 000 R 300 000 R 325 000* R 350 000<br />
R 300 R 330 000 R 360 000 R 390 000* R 420 000<br />
R 350 R 385 000 R 420 000 R 455 000 R 490 000<br />
R 400 R 440 000 R 480 000 R 520 000 R 560 000<br />
Note - *refers to the targeted net profit before tax (Fluctuation in the R/$ has a significant impact)<br />
^Net profit margin = the total cash cost + depreciation + amortisation (Total Ex-mine gate costs)<br />
…turning …Committed development to projects growth, …exceeding into dedicated cash generative to expectations<br />
value assets
Sale of SamQuarz silica mine<br />
31<br />
<strong>Petmin</strong> has sold SamQuarz for R258m (Plus NAV)<br />
45% return year-on-year after tax<br />
Largest producer of flint-grade silica in SA<br />
Key supplier to SA clear glass and metallurgical industry<br />
New Order Mining Rights valid for 30 years<br />
Life of mine in excess of 40 years<br />
Stable production of 1.1m tons per annum<br />
Outstanding Conditions: (Best estimate Q2, 2012)<br />
• Section 11<br />
• Competition commission<br />
…A STRONG …Committed PLATFORM to growth, FOR …exceeding dedicated FUTURE to expectations<br />
value GROWTH
Investor <strong>presentation</strong> – 14 November 2011<br />
1. About <strong>Petmin</strong><br />
2. Strategy<br />
3. Business of Today<br />
4. Business of Tomorrow<br />
5. Results and highlights
Comprehensive and aggressive <strong>Petmin</strong> growth strategy<br />
33<br />
VALUE ADDING<br />
Feasibility<br />
Pig Iron<br />
BUSINESS OF<br />
TODAY<br />
Anthracite<br />
+ Silica<br />
Mining<br />
Anthracite<br />
Silica<br />
BUSINESS OF<br />
TOMORROW<br />
Infrastructure Development<br />
and Urbanisation Value<br />
Chains<br />
Steel-related commodities<br />
Infrastructure-related<br />
commodities<br />
Metallurgical coal<br />
Copper<br />
PGM<br />
POSITION ON THE STEEL AND RELATED PRODUCT VALUE CHAIN<br />
End Use<br />
…Committed …A PLATFORM to growth, FOR dedicated GROWTH to value
NAIC<br />
34<br />
<strong>Petmin</strong> has option to acquire up to 49.9% of a Canadian iron sands/pig iron<br />
project<br />
• <strong>Petmin</strong> has acquired 10.7% of a privately owned Canadian iron sands/pig iron Project for<br />
$3.5m<br />
• Claims under licence cover 450km 2<br />
• Resource is extensive and well placed infrastructurally near clean cheap power and a port<br />
• The current exploration programme has drilled over 3500m with results due in Q1 2012<br />
• The current exploration phase includes a large bulk sample and smelt test<br />
• Financial indications at this stage indicate that the project will produce pig iron at costs well<br />
within the lowest quartile<br />
…A STRONG …Committed PLATFORM to growth, FOR …exceeding dedicated FUTURE to expectations<br />
value GROWTH
NAIC<br />
35<br />
…A STRONG …Committed PLATFORM to growth, FOR …exceeding dedicated FUTURE to expectations<br />
value GROWTH
NAIC<br />
36<br />
Note 1<br />
• Phase 1 – US$1.5 million invested. Committed to a drilling programme to drill up to 1 300m<br />
• Phase 2a – US$2 million invested. Committed to a drilling programme to drill a further 2 000m, Aeromags/Lydar, Lab analysis, ore dressing<br />
studies, melt test studies, environmental scoping, appointment of project manager and agreement with technical partners on melt test work<br />
• Phase 2b – US$1.5 million to be invested. Exploration programme includes bulk sample, melt test, initiate PFS, on-going drilling, environmental<br />
permitting and communications<br />
• Outcome of phase 1, 2a and 2b is a 20 years measured and indicated resource and satisfactory conclusion of the concentrate test work,<br />
production, melt test, initiation of environmental permitting and initiation of PFS<br />
Note 2<br />
• Phase 3 (a, b & c) – US$20 million to be invested (3a: $6 million, 3b: $6 million and 3c: $8 million) is the Bankable Feasibility Study (BFS) phase<br />
and <strong>Petmin</strong> will only proceed with the investment of the US$20 million on satisfactory outcome of phases 1, 2a and 2b<br />
…A STRONG …Committed PLATFORM to growth, FOR …exceeding dedicated FUTURE to expectations<br />
value GROWTH
NAIC<br />
37<br />
Executive Summary<br />
• Commodity – pig iron fits within <strong>Petmin</strong>’s strategy of investing in ‘urbanisation’ commodities and more specifically the steel value<br />
chain.<br />
• Market – since our investment pig iron prices have increased for $450/t to over $500/t – long term prognosis remains positive<br />
despite current volatility (average Pig Iron Price for the last 6 months has been >$500).<br />
• Current estimates for NAIC’s cost of production are $260/t against a Q32011 Producer Median of $507/t.<br />
• At current pricing project has a real NPV10 of >$500m (Phase 1 ~550ktpa).<br />
• Significant competition for smelting plant location (Pennsylvania, Quebec, Louisiana, Labrador) means substantial financing,<br />
electrical tariffs and tax incentives are a reality. Initial discussions have been held with all provinces.<br />
• Exploration has made good progress with >4500m’s drilled since <strong>Petmin</strong>’s investment in October 2010.<br />
• >480/1370 samples of phase have been reanalysed – results are in line with original expectations at Heavy Mineral % of ~9%<br />
and useable Fe minerals (Magnetite, Titanomagnetite and Ilmenite) at ~50% of the HM’s.<br />
• Maiden resource announcement aimed for January 2012.<br />
• Metallurgically we have produced a viable concentrate with magnetic separation only (optimisation is still required)<br />
• Plans for a bulk sample to be fed through a pilot plant – Ordering of major equipment for the pilot plant has begun.<br />
• Discussions have been held with Tenova to carry out a conceptual study for the smelting plant – their proposal has been<br />
received.<br />
The work completed to date has confirmed our belief that this a real project with the potential to<br />
be a significant business.<br />
…Committed …A PLATFORM to growth, FOR dedicated GROWTH to value
NAIC<br />
38<br />
Resource<br />
• >4500m’s has been drilled<br />
• Phase 1 samples are being reanalysed – results of heavy minerals<br />
received on ~480/1400 phase 1 samples have been received.<br />
• Completion of Phase 1 samples will enable a resource to be declared.<br />
• All drill holes drilled to date have had mineralisation.<br />
• Aeromagnetic data along with LIDAR data indicate good potential well<br />
below our current drilling cut-off.<br />
• Results to date are indicating an average grade of approximately 4.5%<br />
magnetite and titanomagnetite in line with original expectations.<br />
• Maiden resource statement due in January 2012 over 14km 2 of >3000mt<br />
grading at about 4.5% Magentite and Titanomagentite (10 - 15 years<br />
production) covering 3.1% of our claims<br />
Valuation<br />
• DCF10 Valuation of the project at June Pig Iron Price of $519/tonne is<br />
>$500m with an IRR of 27% (both real).<br />
• Levered value (50%) is >$550 with an IRR of >40%<br />
• At more conservative pricing ($409/t – lowest LT price of analysts) the<br />
projects value is >200m with an IRR of 17%.<br />
• Project has imminent potential for scalability.<br />
Long Term Pig iron Price<br />
Grade<br />
(Mag & Ti-mag)<br />
202 375 425 475 525<br />
2% 2% -205 -31 138 285<br />
3% 3% -39 131 280 423<br />
4% 3% 45 205 348 491<br />
5% 4% 89 247 390 531<br />
6% 5% 125 274 417 557<br />
7% 6% 141 294 437 576<br />
Market<br />
• Average Pig Iron Price has increased from about $450 at time of<br />
investment to >$500 (June 2011).<br />
• Cost Curve for Pig Iron has steepened from a range of $225/tonne -<br />
$516/tonne in 2010 to $240 - $640 in Q3 of 2011 (Cash Cost).<br />
• Grand River’s estimates cash cost is about $210/tonne ($260 all in).<br />
• Grand River’s access to low cost electricity (3.5c vs 7c) and low cost<br />
iron ore ($30/t vs. $180/t) give it a significant advantage over most<br />
other producers.<br />
• Average ratio of pig iron production to steel production is 0.52 but<br />
directly correlated to steel – if we believe in steel, we must believe in<br />
pig iron.<br />
• Market for Iron Ore has decreased since WSD report to about $140/t.<br />
Cost Comparison per Tonne of Pig Iron Produced<br />
Median Producer Cost Curve - 3Q2011 NAIC Expected Costs<br />
Unit/t Pig Iron US$/Unit Cost/t Unit/t Pig Iron US$/Unit Cost/t<br />
Iron Ore 1.60 180.00 288.00 1.91 28.94 55.21<br />
Briquetted Feed* 1.70 52.38 89.05<br />
Coke & PCI 0.50 406.02 203.01 0 0 0.00<br />
Electricity 38.00 0.07 2.66 1040.89 0.035 36.43<br />
Other Energy 3.30 6.50 21.45 0 0 0.00<br />
Labour 0.69 19.25 13.28 0.4 22 8.80<br />
Energy Credit 1.00 -41.89 -41.89 0 0 0.00<br />
All Other Costs 1.00 21.04 21.04 1 20.3 20.30<br />
507.55 209.78<br />
Source: World Steel Dynamics – November 2011<br />
…Committed …A PLATFORM to growth, FOR dedicated GROWTH to value
NAIC<br />
39<br />
Metallurgy<br />
• Ore dressing studies continue to be carried out by Dr Jayson Ripke and<br />
Glenn Hoffman of Cardero Resources.<br />
• During the period a Wet High Intensity Magnetic Separator (WHIMS) was<br />
purchased and further testwork has begun using this unit.<br />
• Metallurgical testing has indicated that an adequate concentrate can be<br />
produced using just magnetic separation but this requires further<br />
optimisation.<br />
• Some optimisation has been achieved via the screening of the<br />
concentrate post magnetic separation but further work is required for<br />
production plant optimisation.<br />
• Tenova has been engaged to carry out a conceptual study on the pig iron<br />
production plant – proposal has been received.<br />
Environmental / Community<br />
• Some delays were experienced due to tree cutting on some of the claims<br />
and due to the environmental registration process that was triggered for<br />
the bulk sample.<br />
• Stantec have been engaged to run the permitting process for the bulk<br />
sample as well as to carry out a scoping study for the whole project.<br />
• The Innu Nation hold a land claim to our property and own 5% of Grand<br />
River shares.<br />
Pilot Plant<br />
• Objective of the pilot plant is to produce 200t of concentrate for a<br />
continuous melt test.<br />
• All equipment has been detailed (Process flowsheet engineering,<br />
equipment sizing and specifications).<br />
• An RFQ was sent out, on the basis of responses the ordering has begun.<br />
• Expectations are to operate the pilot plant during February 2012 and<br />
March 2012.<br />
• Negotiations are underway for access to furnace facilities to conduct the<br />
melt test.<br />
• Current cost estimates for the pilot plant are $650 000 – higher than the<br />
budget of $400 000. NAIC has applied for 50% of the costs to be paid by<br />
the Atlantic Canada Opportunity Agency (ACOA). Awaiting feedback.<br />
Location<br />
• Location remains a big advantage of the project.<br />
• Close proximity to a port has given the project options to produce a<br />
concentrate in Goose Bay but locate the smelter in other regions.<br />
• Erie, Pennsylvania, Quebec & Louisiana have all shown a significant<br />
interest in locating the project in<br />
their jurisdictions.<br />
• Each of these have indicated the<br />
potential for low electricity rates,<br />
soft loans and tax holidays for the<br />
project.<br />
• Potential loan financing of up to<br />
50% of the smelter CAPEX on soft<br />
repayment terms.<br />
…Committed …A PLATFORM to growth, FOR dedicated GROWTH to value
NAIC<br />
40<br />
Invested<br />
USD1.5m –<br />
Oct 2010<br />
Initial Start-up<br />
and River<br />
Drilling Nov ‘10<br />
Initial<br />
Aeromags –<br />
Jan ‘11<br />
Land Targets<br />
Drilling – Feb<br />
– April ’11<br />
(1376m’s<br />
drilled)<br />
Initial<br />
Laboratory<br />
Data – Mar to<br />
July<br />
Aeromags<br />
over full<br />
property<br />
Samples<br />
Results<br />
audited –<br />
July/August<br />
Indicated<br />
Drilling – July<br />
to October<br />
2011<br />
(2856m’s<br />
drilled)<br />
Engage<br />
laboratory to<br />
redo all<br />
Phase 1<br />
samples –<br />
Sept - current<br />
Order Pilot<br />
Plant –<br />
November<br />
2011<br />
Timeline<br />
Obtain all<br />
results from<br />
Phase 1<br />
drilling –<br />
declare a<br />
maiden<br />
resource –<br />
Jan 2012<br />
Engage<br />
Tenova<br />
(should<br />
budget allow)<br />
– to carry out<br />
PFS on Iron<br />
Smelting<br />
Install and<br />
Commission<br />
Pilot Plant –<br />
Jan – Feb<br />
2012<br />
Maiden<br />
Resource<br />
Statement<br />
– Jan 2012<br />
Processing of<br />
concentrate –<br />
Feb-Mar<br />
2012<br />
Melt Test –<br />
Mar – Jun<br />
2012<br />
Processing of<br />
Phase 2<br />
samples<br />
complete –<br />
Mar 2012<br />
OCT 2010 JULY 2011 JAN 2012 JUN 2012<br />
Signed off<br />
NI 43101 by<br />
June 2012<br />
PFS/BFS to<br />
begin – July<br />
2012<br />
…Committed …A PLATFORM to growth, FOR dedicated GROWTH to value
NAIC<br />
41<br />
Example of Drill Core<br />
Recon Drilling Winter Drilling<br />
Core Logging Port at Site<br />
…A STRONG …Committed PLATFORM to growth, FOR …exceeding dedicated FUTURE to expectations<br />
value GROWTH
Iron Ore – Mount Ginka, Liberia<br />
42<br />
Liberia – emerging from civil war to become<br />
a major iron ore exporter again!<br />
Population of 3.6m people<br />
Civil war between 1989 and 2003 devastated the<br />
economy.<br />
Liberia was the 3 rd largest exporter of iron ore in the<br />
1970s<br />
Government is now stable and putting in place good<br />
governance mechanisms for mining regulations<br />
Major companies such as BHP, Arcelor Mittal, Rio<br />
Tinto and … <strong>Petmin</strong> are now investing<br />
…A STRONG …Committed PLATFORM to growth, FOR …exceeding dedicated FUTURE to expectations<br />
value GROWTH
Iron Ore – Mount Ginka, Liberia<br />
43<br />
<strong>Petmin</strong> holds 50% of the Mt Ginka iron ore exploration licence in Liberia<br />
$2m investment in Iron Bird Resources – a joint venture with AIM-listed Hummingbird<br />
Aeromag survey shows continuous magnetic unit interpreted as iron formation<br />
20km long up to 250m wide and 1,000m deep<br />
Early samples range from 33-54% magnetite Fe<br />
Iron Bird fully funded for further exploration of ore body and economic potential<br />
Mt Ginka is 20km from a major iron ore mine which produced 12-24Mt pa of high grade ore<br />
from 1964 to 1989 – now reopened by Arcelor Mittal (BHP Billiton also nearby)<br />
15km from railway line to deep-water port of Buchanan<br />
…A STRONG …Committed PLATFORM to growth, FOR …exceeding dedicated FUTURE to expectations<br />
value GROWTH
Iron Ore – Mount Ginka, Liberia<br />
44<br />
…A STRONG …Committed PLATFORM to growth, FOR …exceeding dedicated FUTURE to expectations<br />
value GROWTH
Iron Ore – Mount Ginka, Liberia<br />
45<br />
<strong>Petmin</strong> holds 50% of the Mt Ginka iron ore exploration licence in Liberia<br />
…A STRONG …Committed PLATFORM to growth, FOR …exceeding dedicated FUTURE to expectations<br />
value GROWTH
Iron Ore – Mount Ginka, Liberia<br />
46<br />
Note 1<br />
• Phase 1 – US$500 000 invested. The investment was utilised to fund a detailed aeromagnetic survey<br />
• Phase 2 – additional US$1.5 million invested on successful completion of phase 1. the investment is being utilised to demonstrate the<br />
potential scale and whether a commercially saleable magnetite can be produced<br />
…A STRONG …Committed PLATFORM to growth, FOR …exceeding dedicated FUTURE to expectations<br />
value GROWTH
Iron Ore – Mount Ginka, Liberia<br />
47<br />
2011 update<br />
• Mapping and trenching has confirmed the presence of fine to<br />
very fine-grained iron formation<br />
• Mapping and trenching have not provided any evidence<br />
supporting the potential for DSO at Mount Ginka<br />
• 2 tonnage cases for potentially exploitable magnetite IF:<br />
Likelihood Weathered IF Fresh IF Total IF<br />
Mid-case 34 Mt 240 Mt 274 Mt<br />
Max-case 135 Mt 425 Mt 560 Mt<br />
• 151 trench samples have dispatched to Mintek (South Africa)<br />
for geochemical and metallurgical analysis<br />
• 6 samples have been dispatched to Dr Chris Blake (Iron ore<br />
mineralogist) – results expected in December<br />
• Iron ore bearing mineralogy appears to be a combination of<br />
oxide-facies and silicate-facies minerals<br />
• The Iron Formation (IF)may exist adjacent to a laterally<br />
continuous with magnetic schist which may be responsible of<br />
overestimation of IF thickness<br />
2011 update continued<br />
• The fine grained mineralogy and weathered nature of the rock<br />
made it difficult to be certain of the mineralogy<br />
• If the Davis Tube Recovery result are successful and<br />
favourable external analysis of the achieved, then a core drilling<br />
programme of ~ 1500m is recommended<br />
• The IF exists within a thin sequence of garnet-bearing<br />
metasediments<br />
• The IF thickness varies from 0-100m and there is potential for<br />
+100m. Average thickness is between 30m and 50m<br />
Plans to March 2012<br />
• Receive the results from Mintek – December 2011<br />
• Drill 3 large diameter holes<br />
• Bench scale metallurgical tests on LD samples<br />
• End of the programme in March 2012<br />
• By March 2012, a decision on the next steps for the project<br />
will be made<br />
• Engage potential acquirers – both Arcelor Mittal and BHP<br />
have shown interest<br />
…turning …Committed development to projects growth, …exceeding into dedicated cash generative to expectations<br />
value assets
Iron Ore – Mount Ginka, Liberia<br />
• Compilation of historical work<br />
• Airborne geophysical survey<br />
• Geophysical interpretation and<br />
review<br />
• Geological mapping and rock<br />
chip sampling<br />
• Drainage sampling for heavy<br />
mineral concentrate assessment<br />
• Trench mapping and sampling<br />
• Interim report of field work<br />
• XRF/XRD/SEM and compositing<br />
for DTR<br />
• Petrographic analysis of hand<br />
samples<br />
• Large diameter drilling campaign<br />
48<br />
<br />
Mar 11<br />
<br />
April May June July August September October November December January February Mar 12<br />
<br />
<br />
<br />
<br />
Completed To be completed Decision required<br />
<br />
…turning …Committed development to projects growth, …exceeding into dedicated cash generative to expectations<br />
value assets
Red Crescent Resources (RCR) and Sivas Copper<br />
Project, Turkey<br />
49<br />
Turkey – one of Europe’s largest economies with a mining industry taking off<br />
• Population – 73 million<br />
• 7 th largest economy in Europe ~ $1 trillion<br />
• Turkey is the fastest growing economy in Europe (8.9% Growth in 2010)<br />
• Government remains committed to joining the EU<br />
• Turkish mining industry set to grow with large unexplored resource base<br />
• Government encouraging FDI into mining with investment-friendly regulations<br />
• Turkey mining industry is currently characterised by numerous small family-owned<br />
businesses<br />
Value (US$ billion)<br />
12<br />
10<br />
8<br />
6<br />
4<br />
2<br />
0<br />
-2<br />
Turkish mining industry forecasts<br />
2010 2011 2012 2013 2014<br />
-1<br />
Value (US$b) Real growth % of GDP<br />
6<br />
5<br />
4<br />
3<br />
2<br />
1<br />
0<br />
%growth and %GDP<br />
…A STRONG …Committed PLATFORM to growth, FOR …exceeding dedicated FUTURE to expectations<br />
value GROWTH
Red Crescent Resources (RCR) and Sivas Copper<br />
Project, Turkey<br />
50<br />
…A STRONG …Committed PLATFORM to growth, FOR …exceeding dedicated FUTURE to expectations<br />
value GROWTH
SIVAS<br />
51<br />
Note 1<br />
• Phase 1 – Measured Resource of 20Mt of copper grading of 1%<br />
Phase 2<br />
• Phase 2 and 3 – deliver a Measured Resource of 100Mt of copper grading of 1%<br />
…A STRONG …Committed PLATFORM to growth, FOR …exceeding dedicated FUTURE to expectations<br />
value GROWTH
SIVAS<br />
52<br />
Phased investment entry into Turkish copper<br />
<strong>Petmin</strong> acquired 10.1% interest in TX-listed Red Crescent<br />
Resources for CDN$4.64m<br />
Option on up to 37.5% in RCR’s Sivas Copper Project in<br />
Turkey for CDN$17m<br />
Initial exploration at Sivas confirmed extensive oxide and<br />
sulphide copper mineralisation – <strong>Petmin</strong>/RCR exploration<br />
started on 4 Nov 2011<br />
Potential for discovery of significant base metal deposits<br />
RCR has extensive zinc and manganese prospects in Turkey<br />
…A STRONG …Committed PLATFORM to growth, FOR …exceeding dedicated FUTURE to expectations<br />
value GROWTH
SIVAS<br />
$ 1.40<br />
$ 1.20<br />
$ 1.00<br />
$ 0.80<br />
$ 0.60<br />
$ 0.40<br />
$ 0.20<br />
$ 0.00<br />
53<br />
Value of Copper Companies on a US$/lb basis<br />
Exploration<br />
Companies<br />
Potential Valuation Based on an EV/lb of Copper in the ground/production<br />
Production<br />
Companies<br />
Metric $/lb<br />
RCR<br />
(100Mt's @ 1%)*<br />
50 000tpa**<br />
Average exploration Co. 0.22 $486*<br />
Average Production Co. 0.80 $1 764**<br />
Exploration Range 0.04-0.54 $95m - $1187m*<br />
Production Range 0.21-1.17 $463m - $2579m**<br />
Real Option Valuation $822m<br />
Exploration company potential values are based on delineating 100Mt’s @<br />
1% and production company values are based on a mine producing 50 000t<br />
of Copper per year.<br />
• Exploration figures were calculated using the copper equivalent<br />
resources for each company. This meant that if company’s had<br />
other minerals (i.e. Zn, Au, Co) found in their deposits, they were<br />
converted to a copper equivalent using forward prices for the<br />
applicable commodity. The economic value for each company was<br />
then divided by the total copper equivalent of their resources to<br />
determine the EV $ per lb in the ground<br />
• Production figures were calculated by using the copper equivalent<br />
for each mineral produced. The production of other commodities<br />
(i.e. Zn, Au, Co) was taken into account and a total copper<br />
equivalent was calculated using forward prices for the applicable<br />
commodity. The economic value for each company was then<br />
divided by the total copper equivalent of production assuming a 20<br />
year Life of Mine to determine the EV $ per lb in the ground.<br />
• Production LOM Assumption = 20 years<br />
• Forward prices ($/lb):<br />
• Copper = $3 ($6614/t)<br />
• Cobalt = $15 ($33069/t)<br />
Assumptions<br />
• Gold = $17 480 ($1115/oz)<br />
…turning …Committed development to projects growth, …exceeding into dedicated cash generative to expectations<br />
value assets
SIVAS<br />
• Drilling to commence of main zone using drill rig 1<br />
• Stream sampling to be completed<br />
• ALS analysis of first BH mineralized Listvenite<br />
• Deploy 2 nd drill rig<br />
• Preliminary mineralogy evaluation + lab scale Metallurgical test work<br />
• Secure Forestry and Operating Permits for Phase 2<br />
• New road construction to planned BH positions ~ 3km and Systematic<br />
sampling of Listvenite<br />
• Detailed structural mapping as recommended by EB/MR<br />
• Commence development of planned trenches and sampling<br />
• Obtain ALS results for MZ BH no2, and SEZ BH’s 1,2,3, 4 and 5<br />
• Mine minimum tonnages from Licenses 22013 (800 tons) and 18246 (500<br />
tons)<br />
• Submit requisite reports/documents for extension of Operating License no<br />
18246 for a further 10yrs<br />
• Grab and chip sampling of outcrops with known potential for Cu/Au/Ni<br />
mineralization<br />
• Initial mineralogy study on representative mineralized listvenite samples<br />
• Adit?<br />
54<br />
<br />
September<br />
<br />
<br />
October November December<br />
<br />
<br />
Completed To be completed<br />
To be<br />
completed in<br />
2012<br />
…turning …Committed development to projects growth, …exceeding into dedicated cash generative to expectations<br />
value assets
<strong>Petmin</strong> holds a 25% interest in Veremo pig iron project<br />
(potentially also titanium)<br />
55<br />
Veremo highlights<br />
Location • Stoffberg, Mpumalanga Province, South Africa<br />
Reserves &<br />
Resources<br />
Project Plan<br />
• Polymetallic ore body containing approximately<br />
43% Fe<br />
• 5 renewed New Order Prospecting Rights<br />
granted<br />
• Updated drilling programme has delineated a<br />
Measured Resource of 44.3Mt (previously<br />
11.6Mt) in the weathered zone of the ore body<br />
• Weathered material requires minimal preparation<br />
as this is more simple and does not demand<br />
technical development. This as opposed to a<br />
fresh zone which requires significant<br />
development in terms of sizing<br />
• Plant commissioning planned for 2013/4;<br />
• Potential for 1Mtpa pig iron<br />
• All capital financed by Framework Investments<br />
(Kermas)<br />
• Guaranteed dividend 2012-2014 of R65 million pa<br />
• November 2010 submitted mining rights<br />
application<br />
• Finalising metallurgical processing test work,<br />
including test work to produce titanium that may<br />
be used to produce synthetic rutile<br />
• Develop bankable feasibility study<br />
• May 2011 submitted application for EMPR<br />
Combined weathered<br />
resources (Dec 09)<br />
Measured (mt) 44.25<br />
Indicated (mt) 29.10<br />
Total (mt) 73.35<br />
Inferred (mt) 12.83<br />
Combined fresh resources<br />
(Dec 09)<br />
Measured (mt) 498.3<br />
Indicated (mt) 26.4<br />
Total (mt) 524.7<br />
Inferred (mt) 1.1<br />
…Committed …A PLATFORM to growth, FOR dedicated GROWTH to value
56<br />
Veremo iron ore<br />
25% stake in Veremo iron ore project in Mpumalanga<br />
Magnetite with 42% Fe and 14% TiO 2 - suitable for high-quality pig iron production<br />
Mining right application submitted<br />
Production anticipated 2013-14<br />
Close to power, rail and water supply<br />
R50m capital expenditure to date<br />
Guaranteed dividend 2012-2014 of R65 million pa<br />
…A STRONG …Committed PLATFORM to growth, FOR …exceeding dedicated FUTURE to expectations<br />
value GROWTH
<strong>Petmin</strong> value curve – Veremo<br />
57<br />
…A STRONG …Committed PLATFORM to growth, FOR …exceeding dedicated FUTURE to expectations<br />
value GROWTH
Fully invested overview of <strong>Petmin</strong><br />
58<br />
Red Crescent<br />
Resources<br />
Corporate<br />
investment in<br />
a junior mining<br />
company with<br />
assets in<br />
Turkey<br />
Iron Bird JV<br />
JV with<br />
Humming Bird<br />
Resources, a<br />
early stage<br />
Liberian Iron<br />
Ore Project<br />
<strong>Petmin</strong><br />
US$ 17m US$ 4.6m US$ 2.0m US$ 25.0m ZAR 98m<br />
37.5%<br />
SIVAS<br />
Copper<br />
Project<br />
Ownership –<br />
37.5% <strong>Petmin</strong><br />
37.5% RCR<br />
25% Local<br />
partners<br />
10.1% 50% 40%* 25% 0% 100%<br />
Canadian<br />
Iron Sands<br />
Pig Iron<br />
Project<br />
*Option for<br />
further 9.9%<br />
Copper Copper, Iron ore Iron sands<br />
zinc<br />
and pig<br />
iron<br />
Projects<br />
Operations<br />
Veremo<br />
Holdings<br />
(Pty) Ltd<br />
Pig Iron<br />
Project<br />
SamQuarz<br />
(Pty) Ltd<br />
SamQuarz<br />
Silica Mine<br />
Tendele Coal<br />
Mining (Pty)<br />
Ltd<br />
Somkhele<br />
Anthracite<br />
Mine<br />
Pig iron Silica Metallurgical<br />
anthracite<br />
SOLD to Ferro Atlantica – September 2011<br />
(awaiting Section 11)<br />
<strong>Petmin</strong> will receive ~ZAR229m after CGT<br />
…turning …Committed development to projects growth, …exceeding into dedicated cash generative to expectations<br />
value assets
Significant upside potential as at 30 June 2011<br />
59<br />
<strong>Petmin</strong> is trading at a discount to the directors’ valuation<br />
Market Capitalisation (09 November2011) ~R1.5bn<br />
Current share price = R2.59<br />
Somkhele R2.388bn (DCF @ 10% Real, net of debt)<br />
SamQuarz R0.231bn (Estimated after tax proceeds on sale)<br />
Veremo R0.496bn (Audited Valuation – FY11)<br />
Projects* R0.022bn (Cost of investments – FY11)<br />
Cash R0.228bn<br />
Corporate Office -R0.336bn (NPV over 20 years)<br />
TOTAL R3.029bn<br />
NAV per Share (with Corporate) R4.95 (612m shares fully diluted)<br />
*Huge optionality and value<br />
…Committed to Growth, dedicated to value