Template for Electronic Submission of Organic Letters - Advanced ...
Template for Electronic Submission of Organic Letters - Advanced ...
Template for Electronic Submission of Organic Letters - Advanced ...

Create successful ePaper yourself
Turn your PDF publications into a flip-book with our unique Google optimized e-Paper software.
Research Article Adv. Mat. Lett. 2011, 2(1), 32-37 ADVANCED MATERIALS <strong>Letters</strong><br />
www.vbripress.com, www.amlett.com, DOI: 10.5185/amlett.2010.11184 Published online by the VBRI press in 2011<br />
Implementation <strong>of</strong> statistical methods on LIBS<br />
data <strong>for</strong> classification <strong>of</strong> residues <strong>of</strong> energetic<br />
materials (nitro compounds)<br />
Shikha Rai 1 , A.K. Rai 1 *, I.M.L. Das 2 , K.C. Tripathi 3<br />
1 Laser Spectroscopy Research Laboratory, Department <strong>of</strong> Physics,<br />
University <strong>of</strong> Allahabad, Allahabad 211002, India<br />
2 Department <strong>of</strong> Physics and K. Banerjee Center <strong>of</strong> Atmospheric & Ocean Studies,<br />
University <strong>of</strong> Allahabad, Allahabad 211002, India<br />
3 K. Banerjee Center <strong>of</strong> Atmospheric & Ocean Studies, University <strong>of</strong> Allahabad, Allahabad 211002, India<br />
* Corresponding author. Tel: (+91) 933-5110163; Fax: (+91) 532- 2460993; E-mail: awadheshkrai@rediffmail.com<br />
Received: 24 Nov 2010, Revised: 26 Dec 2010 and Accepted: 16 Jan 2011<br />
ABSTRACT<br />
Our key aim is to validate the use <strong>of</strong> statistical methods <strong>for</strong> analysis <strong>of</strong> Laser-Induced Breakdown Spectroscopy (LIBS) datasets<br />
<strong>of</strong> pure nitro compounds (4-nitroaniline and 4-nitrotoluene) and <strong>of</strong> test samples <strong>for</strong>med in Cu matrix. Laser-Induced Breakdown<br />
Spectroscopy (LIBS) provides the spectral lines <strong>of</strong> the constituent elements. The interest behind this study is to establish the<br />
essence behind the supplementation <strong>of</strong> LIBS analysis with statistical methods. When the energetic materials were doped with<br />
the interferents, such as Cu metal powder it leads to the alteration <strong>of</strong> the spectral pr<strong>of</strong>ile <strong>of</strong> both the target samples, which have<br />
similar constituent elements such as C, H, N and O. So, <strong>for</strong> this situation, it is difficult to classify the test samples from their<br />
pure samples only on the basis <strong>of</strong> its spectral signatures. Hence, in order to classify these sets, we have applied sophisticated<br />
chemometric techniques such as linear correlation and Principal Components Analysis (PCA) to familiar LIBS datasets and<br />
found that 50% test samples <strong>of</strong> 4-nitroaniline and 70% test samples <strong>of</strong> 4-nitrotoluene were successfully discriminated. The<br />
causes <strong>for</strong> partial classification <strong>for</strong> both the samples have also been discussed in detail. Copyright © 2011 VBRI press.<br />
Keywords: LIBS; nitro compounds; linear correlation; principal component analysis.<br />
A.K. Rai obtained his M.Sc. and Ph.D. from<br />
the Banaras Hindu University, India in 1978<br />
and 1983 respectively. He was Max-Planck<br />
Post Doctoral Fellow at Max-Planck Institute,<br />
Munich, Germany in 1984-85. During 1985-<br />
88, he has worked as Pool Scientist at the<br />
Physics Department, BHU, Varanasi. He has<br />
been awarded ISCA, Young Scientist Award<br />
in 1987, based on his work on laser<br />
Optogalvanic Spectroscopy. He joined G.B.<br />
Pant University <strong>of</strong> Agriculture & Technology<br />
as Assistant Pr<strong>of</strong>essor in 1988 and became<br />
Associate pr<strong>of</strong>essor in 1998 and has developed the experimental facility<br />
<strong>of</strong> Photoacoustic Spectroscopy. He has visited ICTP, Trieste, Italy, in<br />
1987 and 1992. He has worked as Visiting Pr<strong>of</strong>essor at Mississippi State<br />
University, USA, from 2000-02 and has developed a laser-induced<br />
breakdown spectroscopy sensor <strong>for</strong> the online analysis <strong>of</strong> molten<br />
Aluminum alloy. In 2004, Dr. A.K. Rai has joined University <strong>of</strong><br />
Allahabad as a Pr<strong>of</strong>essor <strong>of</strong> physics and has developed the experimental<br />
research facility in the area <strong>of</strong> laser-induced breakdown spectroscopy <strong>for</strong><br />
the study <strong>of</strong> materials. Pr<strong>of</strong> Rai has been elected as Recorder <strong>of</strong> the<br />
Physical Science Section <strong>for</strong> 2010-2011 & 2011-2012 (98th and 99th<br />
Sessions) <strong>of</strong> the Indian Science Congress Association. He is Member <strong>of</strong><br />
the National Academy <strong>of</strong> Sciences, India. He is Life member <strong>of</strong>: Laser<br />
and Spectroscopy Society <strong>of</strong> India, Indian Laser Association, Indian<br />
Science Congress Association and High Energy Materials Society <strong>of</strong><br />
India. He has one patent, edited one book and published more than<br />
hundred research papers in national and international journals and has<br />
delivered invited talk in many (over 35) national and international<br />
conferences. He has worked as Principal Investigator in several projects<br />
funded by DRDO/DST/CSIR. He has guided seven Ph.D. students.<br />
Shikha Rai is working as a senior research<br />
fellow (CSIR) in the Department <strong>of</strong> physics<br />
at University <strong>of</strong> Allahabad. She did her post<br />
graduation in Physics from University <strong>of</strong><br />
Allahabad in 2006 and joined as D.Phil.<br />
scholar under the supervision <strong>of</strong> Pr<strong>of</strong> A. K.<br />
Rai in 2007. She is working in the area <strong>of</strong><br />
Laser-induced Breakdown Spectroscopy<br />
(LIBS) <strong>for</strong> the study energetic materials. She<br />
has presented several poster and oral<br />
presentation in National and International conferences. She received<br />
young scientist award in “Meghnad Saha Memorial Symposium on<br />
Emerging Trends in Laser & Spectroscopy and Applications” and Best<br />
oral presentation award in Meghnad Saha Memorial Young Scientist<br />
Award in the MMISLIBS2010“Meghnad Saha Memorial International<br />
Symposium-cum-workshop on Laser Induced Breakdown Spectroscopy.<br />
Adv. Mat. Lett. 2011, 2(1), 32-37 Copyright © 2011 VBRI press.
Research Article Adv. Mat. Lett. 2011, 2(1), 32-37 ADVANCED MATERIALS <strong>Letters</strong><br />
I.M.L. Das has obtained his B.Sc. (Hons. in<br />
Physics), M.Sc. (Physics), Ph.D. degrees from<br />
Banaras Hindu University. He has published<br />
about 75 research papers and edited 02 books.<br />
His research interest includes Characterization<br />
<strong>of</strong> Liquid Crystal Materials, Oceanic Physics<br />
with emphasis on Polar Sea Ice, Middle<br />
atmosphere variability and Magnetospheric<br />
Plasma Waves. He has been Executive<br />
Councillor (1991-93), Secretary (1993-96) and<br />
Editor (1996-99) <strong>of</strong> the Plasma Science Society<br />
<strong>of</strong> India as well Secretary HQ (1994-2005), Executive Councillor (2005 –<br />
10) and currently Treasurer <strong>of</strong> the International Academy <strong>of</strong> Physical<br />
Sciences.<br />
Introduction<br />
Residue detection <strong>of</strong> energetic materials, which may be<br />
either organic or inorganic, has become a key aim <strong>for</strong><br />
national security as well as prevention <strong>of</strong> loss <strong>of</strong> lives and<br />
property. The importance <strong>of</strong> the present work lies in the<br />
fact that discrimination and recognition <strong>of</strong> suspected area<br />
soil like soil <strong>of</strong> battle field or millatry sites that includes<br />
energetic material residue can be carried out and is an<br />
important task in the present scenario <strong>for</strong> onsite energetic<br />
material residue and environmental contamination<br />
detection. Currently <strong>for</strong> their detection, several<br />
spectroscopic techniques [1-10] are available, such as ion<br />
mobility spectroscopy, gas chromatography, Raman<br />
spectroscopy, and Laser- Induced Breakdown Spectroscopy<br />
(LIBS). Among these techniques, LIBS has the capability<br />
<strong>of</strong> multi-elemental analysis <strong>of</strong> any type <strong>of</strong> material present<br />
in any phase (solid, liquid and gas) [11-16] with minimal<br />
sample preparation, with real-time, in situ, remote<br />
detection, and with the capability <strong>of</strong> non-destructive<br />
determination <strong>of</strong> elemental composition. It is suitable <strong>for</strong><br />
rapid identification <strong>of</strong> nitro compounds by excitation with a<br />
single laser shot and subsequent data analysis, taking place<br />
almost instantly within a second. There<strong>for</strong>e LIBS is<br />
promising technique <strong>for</strong> the detection (identification/<br />
classification) <strong>of</strong> energetic materials.<br />
LIBS are an emerging spectroscopic technique that<br />
operates with high-power laser pulses focused onto a small<br />
spot <strong>of</strong> the sample material. The interaction <strong>of</strong> the pulsed<br />
laser beam with the target sample produces high<br />
temperature ionized plasma, containing excited elements<br />
which radiate the characteristic emission lines <strong>of</strong> the<br />
corresponding elements. These emission lines are collected<br />
by a fiber optic cable with a collecting lens at the tip and on<br />
the other end a spectrometer equipped with a Charge<br />
coupled device (CCD) detector (gate delay 1.5 µs), whose<br />
output is finally displayed on the computer screen. These<br />
emission lines provide valuable in<strong>for</strong>mation about the<br />
composition <strong>of</strong> the sample.<br />
The purpose <strong>of</strong> this paper is to examine the feasibility<br />
<strong>of</strong> using the LIBS technique together with chemometric<br />
techniques, such as linear correlation and Principal<br />
Component Analysis, <strong>for</strong> detection <strong>of</strong> nitro compounds<br />
namely 4-nitroaniline, 4-nitrotoluene and their residues in a<br />
Cu matrix. Relative intensity <strong>of</strong> atomic lines <strong>of</strong> elements<br />
present in the LIBS spectra <strong>of</strong> the target material has been<br />
taken as the prime parameter <strong>for</strong> spectral matching with a<br />
predetermined spectral library. Eight averaged LIBS<br />
spectra <strong>of</strong> 4-nitroaniline and 4-nitrotoluene have been<br />
recorded to <strong>for</strong>m the library <strong>of</strong> pure samples. Eight<br />
averaged spectra <strong>of</strong> their residue in a Cu matrix have been<br />
recorded as library <strong>of</strong> test samples. Each LIBS spectrum is<br />
average <strong>of</strong> ten laser shot. We have employed chemometric<br />
techniques to analyze the data sets after <strong>for</strong>mation <strong>of</strong> the<br />
LIBS library.<br />
Experimental<br />
Nitro compounds, such as 4-nitroaniline (99%) and 4nitrotoluene<br />
(99%) and copper metal powder (99.5%) were<br />
purchased from the Central Drug House Ltd., India. Test<br />
samples were prepared by homogeneously mixing 0.5 g<br />
powder <strong>of</strong> pure nitro compounds in 5 g Cu metal powder.<br />
Copper matrix has been used to avoid a matrix containing<br />
any element present in compound <strong>of</strong> interest. Pellets <strong>of</strong> this<br />
powder mixture were <strong>for</strong>med by applying a pressure <strong>of</strong><br />
approximately 2 × 10 8 Pa by a hydraulic machine (supplied<br />
by Midvale - Heppenstall Company, Philadelphia, Model<br />
no. 341-20). Similarly, pellets <strong>of</strong> pure 4-nitroaniline and<br />
pure 4-nitrotoluene were prepared.<br />
LIBS spectra have been recorded by foucsing Nd:YAG<br />
laser (Continuum Surelite III-10, 10 Hz, 425 mJ at 532 nm,<br />
4 ns pulse width) onto the surface <strong>of</strong> the pellet by using a<br />
150 mm focal-length lens (quartz). More detail related with<br />
the experimentation described by the authors elsewhere<br />
[17]. The optimum value <strong>of</strong> the laser energy during this<br />
experimentation is found to 18 mJ and resolution <strong>of</strong><br />
spectrometer is 0.1 nm (from 200-500 nm) and 0.75 nm<br />
(from 200-900 nm).Each spectrum is an average <strong>of</strong> ten<br />
laser shots. Finally eight such spectra <strong>for</strong> pure nitro<br />
compounds and eight spectra <strong>for</strong> residues <strong>of</strong> these nitro<br />
compounds in a Cu matrix were obtained. The library <strong>of</strong> the<br />
intensities <strong>of</strong> the atomic lines <strong>of</strong> different elements present<br />
in the LIBS spectra <strong>of</strong> 4-nitroanilie and 4-nitrotoluene was<br />
prepared. Similarly, a library <strong>of</strong> test samples was also<br />
produced.<br />
Results and discussion<br />
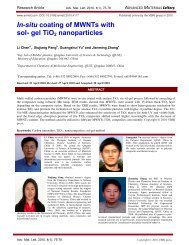
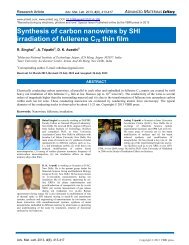
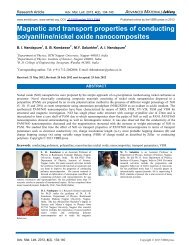
The averaged spectra <strong>of</strong> 4-nitroaniline, 4-nitrotoluene, and<br />
the residues <strong>of</strong> these samples in Cu matrix recorded in air<br />
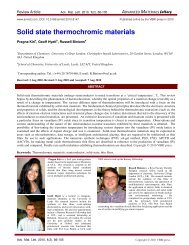
are shown in Fig. 1 (a, b) and 2 (a, b). Here I and II<br />
denotes neutral atom and first ionization state respectively.<br />
We have shown the spectra in two distinct spectral regions<br />
(from 200-550 nm and 650-780 nm) to observe the peak <strong>of</strong><br />
emission lines <strong>of</strong> our interest. It is clear from these Figures<br />
that these spectra contain C, H, N, O, Mg and K atomic<br />
lines C2 and CN molecular bands. Magnesium and<br />
potassium were the only impurities observed in the spectra<br />
<strong>of</strong> nitro compounds [18]. Using Fig. 1 and 2, it is very<br />
difficult to make a clear distinction between the LIBS<br />
spectra <strong>of</strong> these compounds because <strong>of</strong> the fact that spectral<br />
pr<strong>of</strong>ile <strong>of</strong> LIBS spectra <strong>of</strong> pure nitro compounds does not<br />
remain exactly the same when it is embedded into some<br />
matrix, like Cu metal powder, because <strong>of</strong> the matrix effect.<br />
It is only possible when we apply some efficient statistical<br />
methods/ chemometric techniques on the LIBS datasets <strong>of</strong><br />
pure and test samples <strong>of</strong> nitro compounds. A chemometric<br />
technique is the application <strong>of</strong> mathematical or statistical<br />
methods to the experimental data. There<strong>for</strong>e the<br />
supplementation <strong>of</strong> statistical methods with LIBS datasets<br />
is essential. There<strong>for</strong>e, we have used chemometric<br />
Adv. Mat. Lett. 2011, 2(1), 32-37 Copyright © 2011 VBRI press. 33
techniques to distinguish the LIBS spectra <strong>of</strong> these<br />
compounds.<br />
Intensity (a.u.)<br />
Intensity (a.u.)<br />
2500<br />
2000<br />
1500<br />
1000<br />
500<br />
400<br />
200<br />
1000<br />
0<br />
200 250 300 350 400 450 500<br />
0<br />
200 250 300 350 400 450 500<br />
500<br />
0<br />
1000 660 680 700 720 740 760 780<br />
H(I)<br />
4-nitroaniline<br />
500<br />
0<br />
(a)<br />
C(I)<br />
Cu(II)<br />
(b)<br />
H(I)<br />
C(I)<br />
Cu(II)<br />
Mg<br />
Cu(I)<br />
CN bands<br />
Wavelength (nm)<br />
660 680 700 720 740 760 780<br />
Wavelength(nm)<br />
4-nitroaniline<br />
N(I)<br />
Cu + 4-nitroaniline<br />
Cu(I)<br />
C 2<br />
Cu + 4-nitroaniline<br />
Fig. 1. Laser-induced breakdown spectra <strong>of</strong> 4-nitroaniline and test sample<br />
which contain traces <strong>of</strong> 4-nitroaniline in Cu matrix from the spectral<br />
range <strong>of</strong> (a) 200-550 nm and (b) 650-780 nm.<br />
Identification <strong>of</strong> the nitro compounds was done on the<br />
basis <strong>of</strong> the prepared libraries <strong>of</strong> pure samples (4nitroaniline,<br />
4-nitrotoluene) and their test samples with the<br />
aid <strong>of</strong> linear correlation [3]. The library provides the basis<br />
<strong>for</strong> the comparison <strong>of</strong> the spectrum <strong>of</strong> a test sample with the<br />
spectra <strong>of</strong> the pure samples already present in the library.<br />
The library consists <strong>of</strong> 32 spectra (8 spectra <strong>of</strong> each pure<br />
sample and 8 spectra <strong>of</strong> each test samples). Each sample<br />
spectrum exhibits identical molecular bands and atomic<br />
lines <strong>of</strong> elements/species. The intensities <strong>of</strong> discrete atomic<br />
lines and molecular bands were measured from area under<br />
the line pr<strong>of</strong>ile. There<strong>for</strong>e, the intensity ratios <strong>of</strong> elements C<br />
(I), H(I), N(I), O(I), and ratios <strong>of</strong> these atomic line to the<br />
molecular bands ( i.e. C2 (swan bands) and CN (violet<br />
bands) ) were computed <strong>for</strong> identification <strong>of</strong> LIBS spectra<br />
<strong>of</strong> the compounds present in the Cu matrix. Fourteen sets <strong>of</strong><br />
intensity ratios <strong>of</strong> atomic and molecular bands have been<br />
calculated (Table 1) and were used as input data <strong>for</strong> linear<br />
correlation. Here the emission line corresponding to<br />
elements (C, H, N, O) and molecular bands CN violet and<br />
C2 swan in Table 1 corresponds to wavelength at 247.8,<br />
656.2, 744.2, 777.1 and 388.34, 473.7 nm, respectively.<br />
K(I)<br />
K(I)<br />
O(I)<br />
O(I)<br />
Rai et al.<br />
0<br />
500200 250 300 350 400 450 500 550<br />
0<br />
200 250 300 350 400 450 500 550<br />
Adv. Mat. Lett. 2011, 2(1), 32-37 Copyright © 2011 VBRI press.<br />
Intensity (a.u.)<br />
Intensity (a.u.)<br />
3000<br />
2000<br />
1000<br />
400<br />
300<br />
200<br />
100<br />
1000<br />
500<br />
500<br />
0<br />
(a)<br />
Cu(II)<br />
(b)<br />
H(I)<br />
C(I)<br />
C(I)<br />
Cu(II)<br />
Cu(I)<br />
CN bands<br />
Wavelength (nm)<br />
Cu + 4-nitrotoluene<br />
Cu(II)<br />
4-nitrotoluene<br />
0<br />
1000 660<br />
H(I)<br />
680 700 720 740 760 780<br />
4-nitrotoluene<br />
N(I)<br />
660 680 700 720 740 760 780<br />
Wavelength (nm)<br />
N(I)<br />
C 2<br />
Cu + 4-nitrotoluene<br />
Fig. 2. Laser-induced breakdown spectra <strong>of</strong> 4-nitrotoluene and test<br />
sample which contain traces <strong>of</strong> 4-nitrotoluene in Cu matrix from the<br />
spectral range <strong>of</strong> (a) 200 - 550 nm and (b) 650-780 nm.<br />
Table 1. Different sets <strong>of</strong> ratios atomic lines and ratios <strong>of</strong> atomic to<br />
molecular bands.<br />
H(I)/C(I) C(I)/CN<br />
N(I)/C(I) O(I)/CN<br />
O(I)/C(I) H(I)/CN<br />
C 2/C(I) N(I)/CN<br />
N(I)/H(I) C 2/CN<br />
O(I)/H(I) O(I)+N(I)/H(I)+C(I)<br />
O(I)/N(I) O(I)/N(I)/H/C(I)<br />
To measure relationship between two variables, we<br />
have applied linear correlation [19] to the above data sets.<br />
Each LIBS intensity ratio (yi) from the library <strong>of</strong> test<br />
samples is examined <strong>for</strong> correlation with every intensity<br />
ratio (xi) <strong>of</strong> all the LIBS spectra in the previously<br />
constructed library <strong>of</strong> pure samples (nitro compounds). The<br />
correlation coefficient (r) is calculated with the help <strong>of</strong> data<br />
analysis feature <strong>of</strong> Micros<strong>of</strong>t Excel and is defined as:<br />
<br />
<br />
r <br />
[( x x)( y y)<br />
[ ( x x) ( y y)<br />
]<br />
i i<br />
i <br />
2<br />
i <br />
2<br />
1/ 2<br />
where x and y are the mean <strong>of</strong> xi , s and yi’ s.<br />
K(I)<br />
O(I)<br />
O(I)<br />
(1)
Research Article Adv. Mat. Lett. 2011, 2(1), 32-37 ADVANCED MATERIALS <strong>Letters</strong><br />
The results <strong>of</strong> linear correlation analysis <strong>of</strong> pure nitro<br />
compounds with their test samples are shown in Table 2.<br />
The correlation <strong>of</strong> each sample with another is indicated by<br />
a correlation coefficient r, ranging from -1 to 1, with r = 1<br />
indicating an exact spectral match. In this Table, the<br />
reported value <strong>of</strong> r is the average <strong>of</strong> ten correlation<br />
coefficients evaluated by correlating ten spectra <strong>of</strong> each test<br />
samples individually against all 8 spectra <strong>of</strong> each nitro<br />
compound simultaneously. The highest values <strong>of</strong> r will<br />
occur <strong>for</strong> the correlation <strong>of</strong> each sample with itself,<br />
indicating a positive identification <strong>of</strong> the sample.<br />
Table 2. Correlation coefficient (r) <strong>of</strong> nitro compounds.<br />
Pure nitro compounds C 6H 6N 2O 2<br />
C 7H 7NO 2<br />
(4-nitroaniline) (4-nitrotoluene)<br />
Test sample <strong>of</strong> nitro<br />
compounds<br />
Cu+C6H6N2O 2 .987 .980<br />
Cu+C7H7NO2 .976 .985<br />
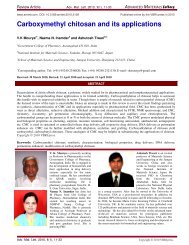
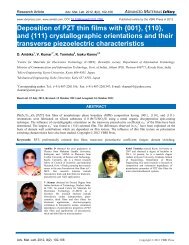
Algorithm <strong>of</strong> PCA<br />
Compute the covariance matrix <strong>of</strong> input data by loading the total number <strong>of</strong><br />
spectra and their feature <strong>of</strong> trained samples in MATLAB programme<br />
Compute the eigenvalues and eigenvectors <strong>of</strong> the covariance matrix.<br />
Arrange eigenvectors in the order <strong>of</strong> magnitude <strong>of</strong> their eigenvalues<br />
and take the first d eigenvectors as principle components if the input<br />
dimensionality is to be reduced to d.<br />
Project the input data onto the principle components, which <strong>for</strong>ms<br />
the representation <strong>of</strong> input data.<br />
Fig. 3. Set <strong>of</strong> instructions used in the PCA programme running under<br />
MATLAB version 7.0.<br />
Table 2 indicates that the test sample <strong>of</strong> 4-nitroaniline<br />
is correlated almost equally well with respect to 4nitroaniline<br />
and 4-nitrotoluene. Thus, identification <strong>of</strong> an<br />
unknown sample is not always possible with this method.<br />
The limitations associated with this analysis include the fact<br />
that when we have multivariate data sets having similar<br />
elemental nature/similar constituents, use <strong>of</strong> this analysis<br />
become very lengthy and time consuming and also it does<br />
not have the capability <strong>of</strong> characterizing and mapping<br />
interrelationships between data sets <strong>of</strong> pure and test<br />
samples. Hence, in order to overcome these difficulties,<br />
alternative ways are required to fulfill the requirements to<br />
correlate the data sets <strong>of</strong> pure and test samples. This<br />
alternative method is a dimension reduction technique<br />
based on a dispersion (covariance) matrix, which<br />
trans<strong>for</strong>ms the input space into a lower-dimensional feature<br />
space, such that the feature space retains the maximum<br />
characteristics <strong>of</strong> the input space. This method is known as<br />
Principal Component Analysis (PCA) [20-22]. The<br />
algorithm <strong>of</strong> the PCA is summarized in flow chart (Fig. 3).<br />
There<strong>for</strong>e, here we have applied PCA [4] to overcome<br />
the limitation involved in linear correlation which is most<br />
frequently used <strong>for</strong> measuring the association between two<br />
variables among categorized samples. As compared to<br />
linear correlation PCA have several other capabilities: it is<br />
suitable <strong>for</strong> data sets in multiple dimensions, <strong>for</strong> extracting<br />
the trend <strong>of</strong> data set which ease the task <strong>of</strong> characterization<br />
<strong>of</strong> several class <strong>of</strong> the samples and hence also use in pattern<br />
recognition. It is based on the orthonormal eigenvectors<br />
and eigenvalues <strong>of</strong> the covariance matrix <strong>of</strong> the original<br />
features or variables. These orthonormal eigenvectors are<br />
used <strong>for</strong> constructing the principal components, and the<br />
eigen - values are the variances <strong>of</strong> the corresponding<br />
principal components. Finally, the LIBS intensities are<br />
projected onto the eigen - vectors <strong>of</strong> the covariance matrix<br />
<strong>of</strong> the pure spectra which are linear combinations <strong>of</strong> the<br />
intensity levels in the input space themselves. These<br />
projections are called the principal components.<br />
Adv. Mat. Lett. 2011, 2(1), 32-37 Copyright © 2011 VBRI press. 35<br />
PC2<br />
7000<br />
6000<br />
5000<br />
4000<br />
3000<br />
2000<br />
1000<br />
0<br />
-1000<br />
-2000<br />
-3000<br />
-4000<br />
4-nitroaniline<br />
4-nitrotoluene<br />
Cu + 4-nitroaniline<br />
Cu + 4-nitrotoluene<br />
-9000 -6000 -3000 0 3000 6000 9000<br />
PC1<br />
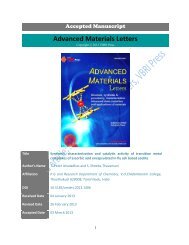
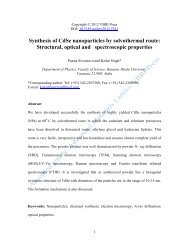
Fig. 4. PCA scores plots <strong>of</strong> nitro compounds and their test samples in<br />
selected spectral regions (200-800) nm. (+ and ▲) are used <strong>for</strong><br />
distinction <strong>of</strong> trained and test samples.<br />
In the present work, PCA has been per<strong>for</strong>med on the<br />
data related to the intensities <strong>of</strong> atomic lines <strong>of</strong> each pixel<br />
in the spectral region from 200 to 800 nm. This analysis has<br />
been carried out by dividing the sample sets into two<br />
different categories such as training set (4- nitroaniline and<br />
4-nitrotoluene) and test set (nitro compounds residue in Cu<br />
matrix).The methodology consists <strong>of</strong> applying PCA on the<br />
training set which consists <strong>of</strong> 16 spectra, 8 from each nitro<br />
compounds (4-nitroaniline and 4-nitrotoluene). There are<br />
1325 pixels with different wavelengths in the wavelength<br />
range mentioned above. Each <strong>of</strong> these wavelengths<br />
corresponds to one dimension in the multi - dimensional<br />
representation <strong>of</strong> the spectra <strong>of</strong> 16 data points. This gives a<br />
data matrix <strong>of</strong> dimensions 16 × 1325, i.e., a row matrix<br />
composed <strong>of</strong> data set <strong>of</strong> 16 spectra each with 1325
dimensions (column). Each column in this matrix is<br />
referred to as feature. Thus we have 1325 features and 16<br />
spectra represented by these features. The visualization <strong>of</strong><br />
1325 dimensions is very difficult to represent pictorially<br />
and it is almost impossible to interpret the relationships<br />
between the training and test data sets. PCA is done to<br />
reduce the dimensionality <strong>of</strong> the data matrix by identifying<br />
the directions <strong>of</strong> maximum variances in the data set so that<br />
the features that have minimum or no variance may be<br />
neglected. The first two principal components explain<br />
85.7% (PC1) and 12.3% (PC2) <strong>of</strong> the total variance within<br />
the dataset. A 2-dimensional PCA scores plot <strong>for</strong> the<br />
trained samples is shown in Fig. 4. The data sets <strong>for</strong> the test<br />
samples have also been projected on the two eigen - vectors<br />
(corresponding to PC1 and PC2) as shown in Fig. 4. It can<br />
be seen that the training samples <strong>of</strong> 4-nitroaniline and 4nitrotoluene<br />
<strong>for</strong>m clearly separable clusters. This clustering<br />
<strong>of</strong> samples can be used <strong>for</strong> classification <strong>of</strong> test samples.<br />
Average distance<br />
9000<br />
8000<br />
7000<br />
6000<br />
5000<br />
4000<br />
average distance with 4-nitroaniline<br />
average distance with 4-nitrotoluene<br />
0 1 2 3 4 5 6 7 8 9<br />
Test sample <strong>of</strong> 4-nitroaniline<br />
Fig. 5. Plot <strong>of</strong> average distance from the each data points <strong>of</strong> test sample <strong>of</strong><br />
4-nitroaniline with respect to all data points <strong>of</strong> trained data sets.<br />
Average distance<br />
9480<br />
8690<br />
7900<br />
7110<br />
6320<br />
5530<br />
4740<br />
average distance with 4-nitroaniline<br />
average distance with 4-nitrotoluene<br />
0 2 4 6 8 10<br />
Test sample <strong>of</strong> 4-nitrotoluene<br />
Fig. 6. Plot <strong>of</strong> average distance from the each data points <strong>of</strong> test sample <strong>of</strong><br />
4-nitrotoluene with respect to all data points <strong>of</strong> trained data sets.<br />
Classification <strong>of</strong> the test samples is based on fact that<br />
the test samples belongs to that class with which its average<br />
Euclidean distance is minimum, shown in Fig. 5 and 6. A<br />
close observation <strong>of</strong> Fig. 6 shows that test samples <strong>of</strong> 4nitrotoluene<br />
are classified correctly almost <strong>for</strong> every sample<br />
whereas the test samples <strong>of</strong> 4-nitroaniline are comparatively<br />
less separable in a few cases. The relatively lower<br />
Rai et al.<br />
classification <strong>of</strong> test samples <strong>of</strong> 4-nitroaniline indicates that<br />
the clusters <strong>of</strong> the 4-nitroaniline have linear discrimination<br />
boundary as compared to 4-nitrotoluene, causing less<br />
distinction <strong>for</strong> test samples <strong>of</strong> 4-nitroaniline<br />
Conclusion<br />
We have successfully examined the efficacy <strong>of</strong> statistical<br />
methods using LIBS datasets. Here we have preferred LIBS<br />
technique rather than other techniques like AAS, ICP etc<br />
because <strong>of</strong> the fact that in other technique; sample is<br />
introduced into the instrument in the <strong>for</strong>m <strong>of</strong> solution only<br />
and applicable <strong>for</strong> trace metal detection only. In AAS we<br />
can only determine only one element at a time. As<br />
comparison <strong>of</strong> it, LIBS is applicable to all samples from<br />
whatever its nature (solid, liquid or gas) and also<br />
possessing ability <strong>of</strong> multi-elemental analysis. Present study<br />
infers that PCA is very efficient tool <strong>for</strong> the discrimination<br />
<strong>of</strong> the samples in contrast to the linear correlation.<br />
Examination <strong>of</strong> average distance plot in PCA provides<br />
distinct features about the category <strong>of</strong> test sample classes.<br />
Work is in progress to per<strong>for</strong>m the PCA <strong>for</strong> particular sets<br />
<strong>of</strong> intensity ratios <strong>for</strong> improvement <strong>of</strong> results related with<br />
the classification <strong>of</strong> samples. We are also trying to per<strong>for</strong>m<br />
the a<strong>for</strong>esaid experimentation in an argon atmosphere in<br />
order to study the comparative effect <strong>of</strong> this atmosphere<br />
over the constituent elements <strong>of</strong> nitro compounds and<br />
percentage <strong>of</strong> classification.<br />
Acknowledgement<br />
Financial assistance from the BRNS, BARC, Mumbai, india (Grant No.<br />
2009/37/30/BRNS/2063) is gratefully acknowledged. Ms. Shikha Rai is<br />
also grateful to CSIR, India <strong>for</strong> providing Senior Research Fellowship.<br />
References<br />
1. DeLucia, F.C.; Samuels, A.C.; Harmon, R.S.; Walters, A.R.;<br />
Mcnesby, L.K.; Lapointe, A.; Winkel, R.J.; Mziolek, A.W. IEEE Sens<br />
J, 2005, 5, 681.<br />
DOI: 10.1016/S0165 9936(02)00408-9<br />
2. Munson, C.A.; De Lucia, F.C.; Piehler, T.; McNesby, K. L.;<br />
Miziolek, A.W. Spectrochim. Acta Part B 2005, 60, 1217.<br />
DOI: 10.1016/j.sab.2005.05.017<br />
3. Singh, J.P.; Thakur, S. N.; Laser-Induced breakdown Spectroscopy;<br />
Elsevie: Amslerdam, 2007.<br />
4. Yinon, J. Trends Analyt Chem. 2002, 21, 292.<br />
DOI: 10.1016/S0165-9936(02)00408-9<br />
5. Dikmelik, Y.; McEnnis, C. Proceeding <strong>of</strong> SPIE, Orlando, 2007.<br />
6. Babushok, V.I.; De Lucia, F.C.; Dagdigian, P.J.; Gottfried, J.L.;<br />
Munson, C.A.; Nusca, M. J.; Miziolek, A.W. Spectrochim. Acta Part<br />
B 2007, 62, 1321.<br />
DOI: 10.1016/j.sab.2007.10.029<br />
7. Rai, A.K.; Rai, V.N.; Yueh, F Y.; Singh, J. P. Trends in Appl.<br />
Spectrosc 2002, 4, 165.<br />
8. Cremers, D.A.; Radziemski, L.J., in handbook <strong>of</strong> Laser-induced<br />
breakdown spectroscopy, John Willey & sons Ltd: England , 2006.<br />
9. Suliyanti, M.M; Sardy, S.; Kunowo, A.; Hedwig, R.; Abbdulmadjid,<br />
S.N.; Kurniawan, K.H.; Lie, T. J.; Patdede, M.; Kagawa, K.; Tija,<br />
M.O. J. Appl. Phys. 2005, 97, 0533051.<br />
DOI: 10.1063/1.1858061<br />
10. De Lucia F. C.; Harmon R S.; McNesby K. L.; Winkel R. J.;<br />
Miziolek A. W.; Appl.Opt. 2003, 42, 6148.<br />
DOI: 10.1364/AO.42.006148<br />
11. Pandhija, S; Rai, A.K. Appl. Phys. B: Laser and Optics 2009, 94,<br />
545.<br />
DOI: 10.1007/s00340-008-3343-5<br />
12. Pandhija, S.; Rai, A. K. J. Environ. Monit. Assess. 2008, 148, 437.<br />
DOI: 10.1007/s10661-008-0173-1<br />
Adv. Mat. Lett. 2011, 2(1), 32-37 Copyright © 2011 VBRI press.
Research Article Adv. Mat. Lett. 2011, 2(1), 32-37 ADVANCED MATERIALS <strong>Letters</strong><br />
13. Rai, N.K.; Rai, A.K. J. Hazard. Mater. 2008, 150, 835.<br />
DOI: 10.1016/j.jhazmat.2007.10.044<br />
14. Rai, N.K.; Rai, A.K.; Kumar, A.; Thakur, S.N. Appl. Opt. 2008, 47,<br />
G105.<br />
DOI: 10.1364/AO.47.00G105<br />
15. Singh, V.K.; Rai, P.K.; Jindal, P.K.; Rai, A.K. Lasers Med. Sci.<br />
2008, 24, 749.<br />
DOI: 10.1007/s10103-008-0635-2<br />
16. Singh, V.K.; Rai, V.; Rai, A.K.; Thakur, S.N.; Singh, J.P. Appl. Opt.<br />
2008, 47, G38.<br />
DOI: 10.1364/AO.47.000G38<br />
17. Rai, S.; Rai, A.K.; Thakur, S.N. Appl. Phys. B: Laser and Optics<br />
2008, 91, 645.<br />
DOI: 10.1007/s00340-008-3040-4<br />
18. Moreno, C.L.; Palanco, S.; Miziolek, A.W.; Rose, J.; Walters, A. J.<br />
Anal. At. Spectrom. 2006, 21, 55.<br />
DOI: 10.1039/B508055J<br />
19. Gornushkin, I.B.; Smith, B.W.; Nasajpour, H.; Winefronder, J.D.<br />
Anal. Chem., 1999, 71, 5157.<br />
DOI: 10.1021/ac9905524<br />
20. Narayanaswamy, C.R.; Raghavarao, D. Appl. Statist.1991, 40, 309.<br />
21. De Lucia, F.C.; Gottfried, J.L.; Miziolek, A.W. Spectrochim. Acta<br />
Part B 2007, 62, 1399.<br />
DOI: 10.1016/j.sab.2007.10.036<br />
22. Gottfried, J.L.; De Lucia, F.C.; Munson, C.A.; Miziolek, A.W. J.<br />
Anal. At. Spectrom. 2008, 23, 205.<br />
DOI: 10.1039/B703891G<br />
23. Kramer, M.A. AICHE Journal 1991, 37, 233.<br />
DOI: 10.1002/aic.690370209<br />
ADVANCED MATERIALS <strong>Letters</strong><br />
Publish your article in this journal<br />
ADVANCED MATERIALS <strong>Letters</strong> is an international journal published<br />
quarterly. The journal is intended to provide top-quality peer-reviewed<br />
research papers in the fascinating field <strong>of</strong> materials science particularly in<br />
the area <strong>of</strong> structure, synthesis and processing, characterization,<br />
advanced-state properties, and applications <strong>of</strong> materials. All articles are<br />
indexed on various databases including DOAJ and are available <strong>for</strong><br />
download <strong>for</strong> free. The manuscript management system is completely<br />
electronic and has fast and fair peer-review process. The journal includes<br />
review articles, research articles, notes, letter to editor and short<br />
communications.<br />
Submit your manuscript: http://amlett.com/submitanarticle.php<br />
Adv. Mat. Lett. 2011, 2(1), 32-37 Copyright © 2011 VBRI press. 37