Structural, dielectric and conductivity properties of Ba2+ doped (Bi0 ...
Structural, dielectric and conductivity properties of Ba2+ doped (Bi0 ...
Structural, dielectric and conductivity properties of Ba2+ doped (Bi0 ...

You also want an ePaper? Increase the reach of your titles
YUMPU automatically turns print PDFs into web optimized ePapers that Google loves.
Research Article Adv. Mat. Lett. 2012, 3(4), 286-292 ADVANCED MATERIALS Letters<br />
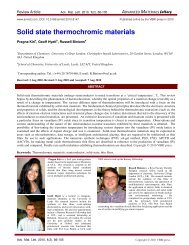
between 1 <strong>and</strong> 2 indicate diffuse behaviour [43]. We<br />
determined the value <strong>of</strong> γ from the slope <strong>of</strong> straight line<br />
fitted to the logarithmic plots <strong>of</strong> reciprocal permittivity<br />
measured at 1 KHz as a function <strong>of</strong><br />
as show in Fig. 6. There is increase in diffusive<br />
factor (γ) as we increase the concentration <strong>of</strong> Ba 2+ in BNT.<br />
These results imply an elevation <strong>of</strong> the relaxor feature <strong>and</strong><br />
transition from normal ferroelectric to relaxor<br />
ferroelectrics.<br />
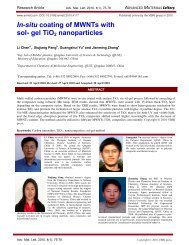
Fig. 4. Variation <strong>of</strong> <strong>dielectric</strong> constant with temperature at different<br />
frequencies for (a) x = 0, (b) x = 0.02, (C) x = 0.04, (d) x = 0.06, (e) x = 0.08,<br />
<strong>and</strong> (f) x = 0.1 respectively in system (<strong>Bi0</strong>.5Na0.5)1-xBaxTiO3.<br />
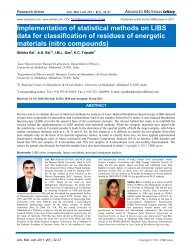
Fig. 5. Variation <strong>of</strong> <strong>dielectric</strong> loss (tanδ) with temperature at different<br />
frequencies for (a) x = 0, (b) x = 0.02, (C) x = 0.04, (d) x = 0.06, (e) x = 0.08,<br />
<strong>and</strong> (f) x = 0.1 respectively in system (<strong>Bi0</strong>.5Na0.5)1-xBaxTiO3.<br />
Impedance analysis<br />
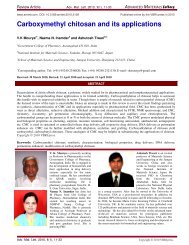
Fig. 7 shows the variation <strong>of</strong> the real part <strong>of</strong><br />
impedance with frequency from 100Hz-1MHz in<br />
temperature range from 30-500 °C. It is observed that the<br />
value <strong>of</strong> decreases with increase in temperature as well<br />
as frequency which shows that BNBT has the negative<br />
temperature coefficient <strong>of</strong> resistance (NTCR). This<br />
indicates an increase in ac <strong>conductivity</strong> with increase in<br />
temperature <strong>and</strong> frequency.<br />
Fig. 6. Variation <strong>of</strong> with for various<br />
compositions in the system (<strong>Bi0</strong>.5Na0.5)1-xBaxTiO3 (inset shows variation <strong>of</strong><br />
diffusive factor with mole fraction <strong>of</strong> Ba 2+ ).<br />
Fig. 7. Variation <strong>of</strong> with frequency at different temperature for (a) x = 0,<br />
(b) x = 0.02, (C) x = 0.04, (d) x = 0.06, (e) x = 0.08, <strong>and</strong> (f) x = 0.1<br />
respectively in system (<strong>Bi0</strong>.5Na0.5)1-xBaxTiO3 (insets in all figure show<br />
enlarged view <strong>of</strong> vs frequency plots at higher temperature).<br />
Fig. 8. Variation <strong>of</strong> with frequency at different temperature for (a) x = 0,<br />
(b) x = 0.02, (C) x = 0.04, (d) x = 0.06, (e) x = 0.08, <strong>and</strong> (f) x = 0.1<br />
respectively in system (<strong>Bi0</strong>.5Na0.5)1-xBaxTiO3 (insets in all figure show<br />
enlarged view <strong>of</strong> vs. frequency plots at higher temperature).<br />
Adv. Mat. Lett. 2012, 3(4), 286-292 Copyright © 2012 VBRI Press 289